GASP–I can't breathe! How statistics can be used to study pollution control Peter Guttorp...
32
GASP–I can't breathe! How statistics can be used to study pollution control Peter Guttorp Statistics University of Washington
-
date post
21-Dec-2015 -
Category
Documents
-
view
219 -
download
1
Transcript of GASP–I can't breathe! How statistics can be used to study pollution control Peter Guttorp...

GASP–I can't breathe! How statistics can be used to study pollution control
Peter Guttorp
Statistics
University of Washington

Acknowledgements
Joint work with
Sofia Åberg
David Caccia
Laura Knudsen
Paul Sampson
Mary Lou Thompson
Larry Cox

Outline
Smog
Health effects ot air pollution
Setting standards
A water pollution standard
An air quality standard
International comparison
A statistician’s take on a standard
How bad can it be?


Smog in Beijing

Health effects of ozone
Decreased lung capacity
Irritation of respiratory system
Increased asthma hospital admissions
Children particularly at risk
How do we find this out?

Exposure issues for particulate matter (PM)
Personal exposures vs. outdoor and central measurements
Composition of PM (size and sources)
PM vs. co-pollutants (gases/vapors)
Susceptible vs. general population

Seattle health effects study
2 years, 26 10-day sessions
Total of 167 subjects56 COPD subjects40 CHD subjects38 healthy subjects
(over 65 years old, non-smokers)33 asthmatic kids
Total of 108 residences55 private homes23 private apartments 30 group homes


HI
Ogawasampler
T/RH logger
Nephelometer
Quiet Pump Box
CO2 monitor
CAT

pDR
PUFHPEM
Ogawa sampler

Personal exposure vs. central site PM2.5
corr (pers exp, central site) = 0.24
corr (central site, local outdoor) = 0.80
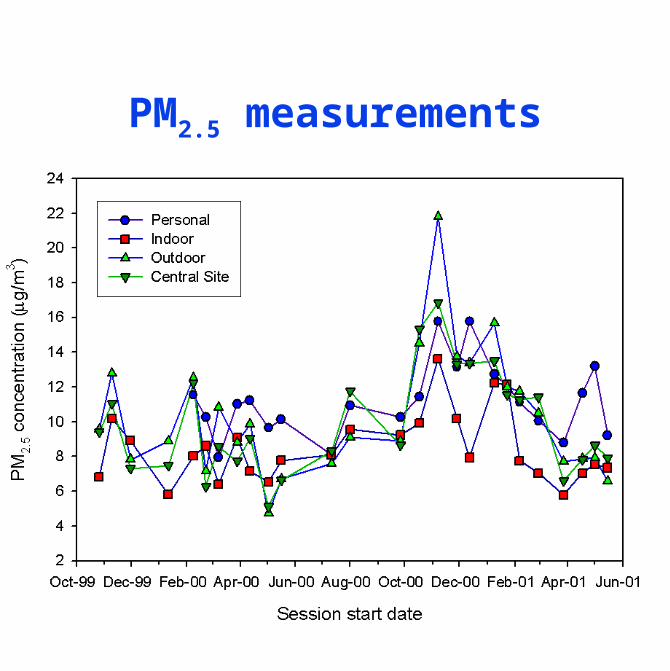
PM2.5 measurements

WHO health effects estimates for ozone
10% most sensitive healthy children get 5% reduction in lung capacity at .125 ppm hourly average
Double inflammatory response for healthy children at .09 ppm 8-hr average
Minimal public health effect at .06 ppm 8-hr average

Task for authorities
Translate health effects into limit values for standard
Determine implementation rules for standard
Devise strategies for pollution reduction

Drinking water standard
Maximum microbiological contaminant levels:
1. Arithmetic mean coliform count of all standard samples examined per month shall not exceed 1/100 ml
2. The number of coliform bacteria shall not exceed 4/100 ml in–(a) more than one sample when less than 20 are examined–(b) more than 5% of the sample if at least 20 are examined
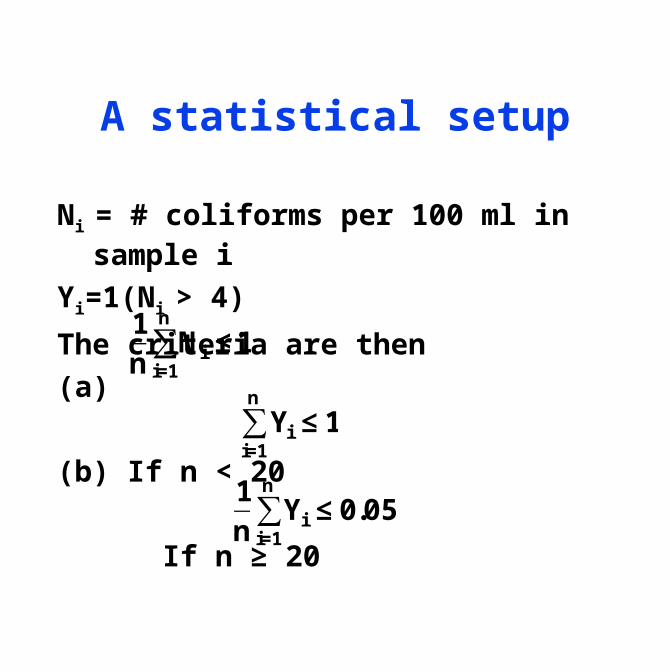
A statistical setup
Ni = # coliforms per 100 ml in sample i
Yi=1(Ni > 4)
The criteria are then
(a)
(b) If n < 20
If n ≥ 20
1n
Nii=1
n
∑ ≤1
Yii=1
n
∑ ≤1
1n
Yii=1
n
∑ ≤0.05
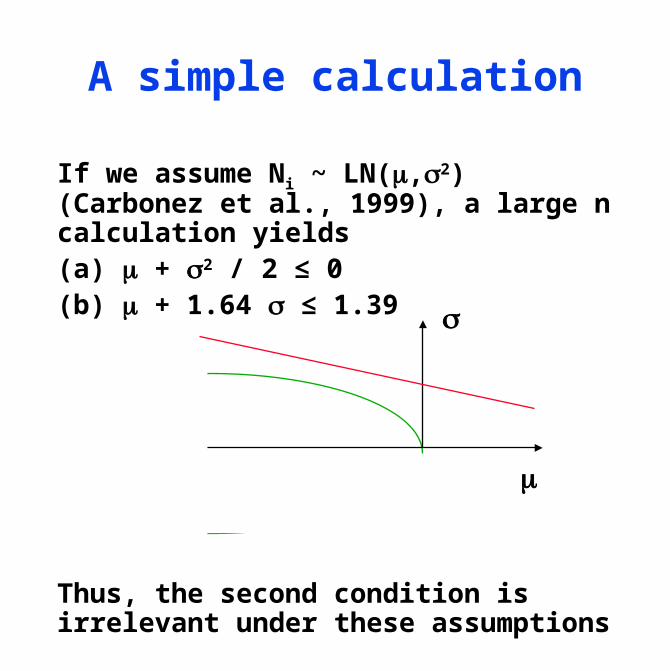
If we assume Ni ~ LN(,2) (Carbonez et al., 1999), a large n calculation yields(a) + 2 / 2 ≤ 0(b) + 1.64 ≤ 1.39
Thus, the second condition is irrelevant under these assumptions
A simple calculation

Drinking water
Not always regulated by environmental authorities
Bottled water is becoming a substantial waste problem
QuickTime™ and a decompressor
are needed to see this picture.
QuickTime™ and a decompressor
are needed to see this picture.

Some air quality standards
Ozone PM2.5
WHO 100 g/m3
(46.7 ppb)
25 g/m3
USA 80 ppb 35 g/m3
EU 60 ppb 50 g/m3
Australia 80/100* ppb 50 g/m3
Max 8 hr average
* Max 4/1 hr avg
24 hr ave

North American ozone measurements 94-96
WHO
USA
EU

Australian ozone 2001
Brisbane Canberra Melbourne Perth Sydney
0.140
0.080
ppm
Second highest 4hr average ozone readings

US 1-hr ozone standard
In each region the expected number of daily maximum 1-hr ozone concentrations in excess of 0.12 ppm shall be no higher than one per year
Implementation: A region is in violation if 0.12 ppm is exceeded at any approved monitoring site in the region more than 3 times in 3 years

A hypothesis testing framework
The US EPA is required to protect human health. Hence the more serious error is to declare a region in compliance when it is not.
The correct null hypothesis therefore is that the region is violating the standard.

How would I do the test?
One day either exceeds .12 ppm or not
Number of exceedances in a year is binomial, n=365, p=?
If mean number of exceedances is 1, then p=1/365
In three years the probability of no exceedances (when p=1/365) is 0.05
So REJECT the null hypothesis of violation if there are NO violations in three years.

How does the EPA perform the test?
They reject the null hypothesis if there are less than 3 violations in 3 years.The probability of that when p=1/365 is 0.647.I never would do a test at level 0.647.Flipping a coin would have smaller error probability.US EPA are not protecting the public with their rule!

Some other issues
Measurements are not always taken where people live
Measurement error is not taken into account
The “natural” background is not the same everywhere
People are not exposed to a single pollutant–it is a soup!

A conditional calculation
Given an observation of .120 ppm in the Houston region, what is the probability that an individual in that region is subjected to more that .120 ppm?
About 2/3!


Level of standard to protect against 0.18 ppm

General setup
Given measurements of a Gaussian field observed with error, find c[t] such that
where [t] denotes season and the mean of equals the -quantile of the estimated health effects distribution.
X(si, t j )ξ(s, t)
P( supv:ρ(u,v)≥β{ }
ξ(u, t) > c[ t] ) ≤α
ξ(u, t)