Gasification of Meat and Bone Meal
114
Gasification of Meat and Bone Meal A Thesis Submitted to the College of Graduate Studies and Research in partial fulfillment of the requirements for the degree of Master of Science in the Department of Chemical Engineering University of Saskatchewan Saskatoon, Saskatchewan By Chirayu G. Soni Copyright Chirayu G. Soni, September 2009 All Rights Reserved
Transcript of Gasification of Meat and Bone Meal

Gasification of Meat and Bone Meal
A Thesis Submitted to the College of Graduate Studies and Research
in partial fulfillment of the requirements for the degree of
Master of Science
in the Department of Chemical Engineering
University of Saskatchewan
Saskatoon, Saskatchewan
By
Chirayu G. Soni
Copyright Chirayu G. Soni, September 2009 All Rights Reserved

i
COPYRIGHT
The author has agreed that the Libraries of the University of Saskatchewan
make this thesis freely available for inspection. Moreover, the author has agreed
that permission for copying of this thesis in any manner, either whole or in part,
for scholarly purposes can be granted primarily by the professor(s) who supervised
this thesis or, in their absence, by the Head of the Department of Chemical
Engineering or the Dean of the College of Graduate Studies. Duplication or
publication or any use of this thesis, in part or in whole, for financial gain
without prior written approval by the University of Saskatchewan is prohibited. It
is also understood that due recognition shall be given to the author of this thesis
and to the University of Saskatchewan n any use of the material therein.
Request for the permission to copy or make any other use of the material
in this thesis, in whole or in part, should be addressed to:
The Head
Department of Chemical Engineering
College of Engineering
University of Saskatchewan
57 Campus Drive
Saskatoon, Saskatchewan, Canada
S7N 5A9

ii
ABSTRACT
Meat and bone meal (MBM) is a byproduct of the rendering industries. It is found to
be responsible for the transmission of bovine spongiform encephalopathy (BSE) in animals
and is no longer used as a feed to animals. There are various methods for disposal of MBM
such as land filling, incineration, combustion, pyrolysis and gasification. Gasification appears
to be one of the best options. High temperature of gasification reaction destroys the potential
BSE pathogens and produces gases which can be further used to produce valuable liquid
chemicals by Fischer-Tropsch synthesis or to generate electricity. Gasification of meat and
bone meal followed by thermal cracking/ reforming of tar was carried out using oxygen and
steam separately at atmospheric pressure using a two-stage fixed bed reaction system in
series. The first stage was used for the gasification and the second stage was used for thermal
cracking/ reforming of tar.
Meat and bone meal was successfully gasified in the two-stage fixed bed reaction
system using two different oxidants (oxygen and steam) separately. In gasification using
oxygen, the effects of temperature (650 – 850 °C) of both stages, equivalence ratio (ER)
(actual O2 supply/stoichiometric O2 required for complete combustion) (0.15 – 0.3) and the
second stage packed bed height (40 – 100 mm) on the product (char, tar and gas) yield and
gas (H2, CO, CO2, CH4, C2H4, C2H6, C3H6, C3H8) composition were studied. It was observed
that the two-stage process increased hydrogen production from 7.3 to 22.3 vol. % (N2 free
basis) and gas yield from 30.8 to 54.6 wt. % compared to single stage. Temperature and
equivalence ratio had significant effects on the hydrogen production and product distribution.
It was observed that higher gasification (850 °C) and cracking (850°C) reaction temperatures
were favorable for higher gas yield of 52.2 wt. % at packed bed height of 60 mm and

iii
equivalence ratio of 0.2. The tar yield decreased from 18.6 wt. % to 14.2 wt. % and that of
gas increased from 50.6 wt. % to 54.6 wt. % by changing the packed bed height of second
stage from 40 to 100 mm while the gross heating value (GHV) of the product gas remained
almost constant (16.2 – 16.5 MJ/m3).
In gasification using steam, effects of temperature (650 – 850 °C) of each stage,
steam/MBM (wt/ wt) (0.4 -0.8), and packed bed height (40 -100 mm) in second stage on the
product (Char, liquid and gas) distribution and gas (H2, CO, CO2, CH4, C2H4, other H/C)
composition were studied. It was observed that higher reaction temperature (850 °C) was
favorable for high gas and hydrogen yields. Char gasification improved from 27 to 13 wt. %
and hydrogen yield increased from 36.2 to 49.2 vol. % with increase in steam/MBM (wt/ wt),
while with increased in packed bed height increased gas (29.5 to 31.6 wt. %) and hydrogen
(45 to 49.2 vol. %) yields. It didn’t show substantial effect on heavier hydrocarbons.
The kinetic parameters for the pyrolysis of meat and bone meal were determined
using thermogravimetric analysis (TGA) at three different heating rates (10, 15 and 25
°C/min) using distributed activation energy model (DAEM). The activation energy was
found in the range of 60-246 kJ/mol for the temperature range of 496-758 K and their
corresponding frequency factors were 6.63 x 10³ to 8.7 x 10¹⁴ s-1.

iv
ACKNOWLEDGEMENTS
I wish to express my appreciation to my supervisors, Drs. Ajay Dalai and Todd
Pugsley, and my advisory committee member, Dr. Terry Fonstad, whose guidance
throughout my program facilitated me to the success of this research work. Discussion with
Dr. Zhiguo Wang during weekly/ bi-weekly meetings is also appreciated. I am grateful to Dr.
C. Niu including all other committee members for their valuable suggestions and comments
during the committee meetings. Special thanks to Drs. Ajay Dalai and Todd Pugsley for
giving their feedback on my reports, manuscript, and thesis draft which helped me sharpen
my writing skills.
I would like to thank T. Wallentiny, R. Blondin, and D. Cekic of the Chemical
Engineering Department for their technical assistance for various stages of this work. My
sincere thanks to T. Wallentiny and R. Blondin without whom I could not repair the gas
chromatographs.
I am also thankful to all members of the Catalysis and Reaction Engineering Lab for
their kind co-operation through out my program. I must appreciate the financial support from
TSE research fund and Agricultural Development Fund for this research work.
Last but not the least, I greatly appreciate support from my parents, other family
members, and friends.

v
DEDICATION
I dedicate this work to
My parents, Grand parents, Sister, and
Every moment I’ve spent
vi
TABLE OF CONTENTS Page
COPYRIGHT i
ABSTRACT ii
ACKNOWLEDGEMENTS iv
DEDICATION v
TABLE OF CONTENTS vi
LIST OF TABLES ix
LIST OF FIGURES xi
NOMENCLATURE xv
1. INTRODUCTION 1
1.1 Different options to dispose Meat and bone meal 1
1.1.1 Incineration/ Co-incineration 2
1.1.2 Land-filling and alkaline hydrolysis 2
1.1.3 Novel treatments: pyrolysis, gasification, and combustion 3
1.2 Knowledge gap 5
1.3 Objectives 5
2. LITERATURE REVIEW 7
2.1 Background 7
2.2 Biomass Gasification 10
2.2.1 Biomass gasification using oxygen/ air 13
2.2.2 Biomass gasification using steam 17
2.3 Kinetic analysis for pyrolysis of meat and bone meal 20

vii
3. EXPERIMENTAL 24
3.1 System description 24
3.1.1 Phase I: Gasification of Meat and Bone Meal Using Oxygen 24
3.1.2 Phase II: Gasification of Meat and Bone Meal Using Steam 26
3.2 Experimental procedure 28
3.2.1 Phase I: Gasification of Meat and Bone Meal Using Oxygen 28
3.2.2 Phase II: Gasification of Meat and Bone Meal Using Steam 29
3.2.3 Phase III: Pyrolysis of Meat and Bone Meal in a 30
Thermogravimetric Analyzer
3.3 Analysis of meat and bone meal, inert packed bed material, and 30
product gases
3.4 Experimental design 31
4. RESULTS AND DISCUSSION 33
4.1 Particle size distribution, proximate and ultimate analysis of 33
meat and bone meal
4.2 Gasification of meat and bone meal using oxygen 36
4.2.1 Single stage operation 36
4.2.1.1 Effect of temperature 36
4.2.2 Two-stage operation 38
4.2.2.1 Effect of temperature 38
4.2.2.2 Effect of equivalence ratio 40
4.2.2.3 Effect of packed bed height 42

viii
4.3 Gasification of meat and bone meal using steam 45
4.3.1 Single stage operation 45
4.3.1.1 Effect of temperature 45
4.3.2 Two-stage operation 47
4.3.2.1 Effect of temperature 47
4.3.2.2 Effect of steam/MBM ratio 49
4.3.2.3 Effect of packed bed height 51
4.4 Comparison of phase I and II results 53
4.4.1 Single-stage operation 53
4.4.2 Two-stage operation 53
4.5 Determination of kinetic parameters using distributed activation energy model 55
4.5.1 Introduction 55
4.5.2 Results and discussion 56
5. CONCLUSIONS AND RECOMMENDATIONS 61
6. REFERENCES 65
APPENDIX A: Calibration of mass flow meters, syringe pump, and GCs HP 5880 73
and 5890
APPENDIX B: Sample calculation for mass balance and calorific value of product gas 79
APPENDIX C: Experimental results with replicate runs 82
APPENDIX D: Permissions for figures and tables 94

ix
LIST OF TABLES
Table Page Table 2.1 Projection of energy use by fuel type 8
Table 2.2 Biomass potential and use distribution between regions, 11
103 PJ/year [Skytte et al., 2006]
Table 2.3 Possible reactions for gasification coal or biomass 13
Table 2.4 Effect of key parameters on product distribution and gas 16
composition for air/ oxygen blown gasification
Table 2.5 Effect of key parameters on product distribution and gas 20
composition for the steam gasification of biomass
Table 3.1 Experimental plan 32
Table 4.1 Proximate and ultimate analysis of meat and bone meal 35
Table B1 Calculation for gas compositions and weight of product gas 80
Table B2 Calculation for calorific value of product gas 81
Table C1 Effect of temperature during single-stage operation 82
Table C2 Effect of temperature during two-stage operation 83
Table C3 Effect of equivalence ration in two-stage operation 84
Table C4 Effect of packed bed height during two-stage operation 85
Table C5 Replicate runs of Phase I 86
Table C6 Effect of temperature during single stage operation 88
Table C7 Effect of temperature during two-stage operation 89
Table C8 Effect of steam/MBM during two-stage operation 90
Table C9 Effect of packed bed height during two-stage operation 91

x
Table C10 Replicate runs of Phase II 92

xi
LIST OF FIGURES
Figure Page Fig. 2.1 World marketed energy consumption, 1980-2030 7
Fig. 2.2 Shares of world’s primary energy consumption 8
[Han and Kim, 2006]
Fig. 2.3 Historical and future CO2 emissions by countries/ regions 9
[Timilsina, 2008]
Fig. 2.4 Reaction sequence for gasification of coal or biomass 12
Fig. 3.1 Schematic diagram of experimental setup for gasification of meat 25
and bone meal using oxygen in two-stage fixed bed reaction system
Fig. 3.2 Schematic diagram of experimental setup for steam gasification 27
of meat and bone meal in two-stage fixed bed reaction system
Fig. 4.1 Particle size distributions of (a) Ottawa sand and (b) MBM powder 34
Fig. 4.2 Effect of first stage final temperature on product yield and GHV 37
of gas at ER of 0.2 and N2 flow rate of 45 ml/min
Fig. 4.3 Effect of final temperature of first stage on gas composition at ER 37
of 0.2 and N2 flow rate of 45 ml/min
Fig. 4.4 Effect of second stage temperature on product yield and GHV of 39
gas at first stage final temperature of 850 °C, ER of 0.2, N2 flow
rate of 45 ml/min and packed bed height of 60 mm
Fig. 4.5 Effect of second stage temperature on gas composition at first 39
stage final temperature of 850 °C, ER of 0.2, N2 flow rate of
45 ml/min and packed bed height of 60 mm
xii
Fig. 4.6 Effect of equivalence ratio (ER) on product yield and GHV of 41
gas at first stage final and second stage temperatures of 850 °C
and packed bed height of 60 mm
Fig. 4.7 Effect of equivalence ratio (ER) on gas composition at first 41
stage final and second stage temperatures of 850 °C and packed
bed height of 60 mm
Fig. 4.8 Effect of packed bed height on product yield at first stage final 43
and second stage temperatures of 850 °C, ER of 0.2 and N2
flow rate of 45 ml/min
Fig. 4.9 Effect of packed bed height on gas compositions at first stage 43
final and second stage temperatures of 850 °C, ER of 0.2 and
N2 flow rate of 45 ml/min
Fig. 4.10 Effect of final temperature of first stage on product yield at 46
steam/MBM (wt. /wt.) of 0.6 and N2 flow rate of 45 ml/min
Fig. 4.11 Effect of final temperature of first stage on gas composition at 46
steam/MBM (wt. /wt.) of 0.6 and N2 flow rate of 45 ml/min
Fig. 4.12 Effect of second stage temperature on product yield at first stage 48
final temperature of 850 °C, steam/MBM (wt. /wt.) of 0.6,
N2 flow rate of 45 ml/min and packed bed height of 60 mm
Fig. 4.13 Effect of second stage temperature on gas composition at 48
first stage final temperature of 850 °C, steam/MBM (wt. /wt.)
of 0.6, N2 flow rate of 45 ml/min and packed bed height
of 60 mm

xiii
Fig. 4.14 Effect of steam/ MBM (wt/ wt) on product yield at 50
final temperature of first stage and second stage at 850 °C,
N2 flow rate of 45 ml/min and packed bed height of 60 mm
Fig. 4.15 Effect of steam/ MBM (wt/ wt) on gas composition at 50
final temperature of first stage and second stage at 850 °C,
N2 flow rate of 45 ml/min and packed bed height of 60 mm
Fig. 4.16 Effect of packed bed height on product yield at 52
steam/ MBM (wt/ wt) of 0.8, final temperature of first stage
and second stage at 850 °C, and N2 flow rate of 45 ml/min
Fig. 4.17 Effect of packed bed height on gas composition at 52
steam/ MBM (wt/ wt) of 0.8, final temperature of first stage
and second stage at 850 °C, and N2 flow rate of 45 ml/min
Fig. 4.18 Comparison of phase I and II results during single stage operation 54 Fig. 4.19 Comparison of phase I and II results during two - stage operation 54
Fig. 4.20 Effect of temperature on V/V* during pyrolysis 58
of MBM in thermogravimtric analyzer for three different
heating rates
Fig. 4.21 )/ln( 2Ta vs. 1/T at the selected V/V* ratios 58
Fig. 4.22 V/V* vs. E relationship 59
Fig. 4.23 lnk0 vs. E relationship 59
Fig. 4.24 f (E) vs. E relationship 60
Fig. A.1 Calibration of mass flow meter (0-200 ml/min) 73 Fig. A.2 Calibration of mass flow meter (0-20 ml/min) 74

xiv
Fig. A.3 Calibration of mass flow meter 74 Fig. A.4 Calibration curve of H2 75
Fig. A.5 Calibration curve of CO 75 Fig. A.6 Calibration curve of CO2 76 Fig. A.7 Calibration curve of CH4 76 Fig. A.8 Calibration curve of C2H4 77 Fig. A.9 Calibration curve of C2H6 77 Fig. A.10 Calibration curve of C3H6 78 Fig. A.11 Calibration curve of C3H8 78

xv
NOMENCLATURE Fi fraction i of the sample to decompose,
Vi volatiles produced by fraction i
Si solid residue formed.
wi weight fraction (actual weight/initial weight) for fraction i
ki0 pre-exponential factor (s-1 mass fraction 1-ni )
Ei activation energy (kJ mol-1)
ni reaction order
R gas constant (kJ mol-1 K)
T temperature (K)
wi weight fraction at time infinity that accounts for the final residue of the process
V total volatiles evolved by time t V* effective volatile content a heating rate (K/min)
f (E) distribution curve of the activation energy
LHV lower heating value
ER equivalence ratio
DSS dry sewage sludge umf minimum fluidization velocity TDE transmissible degenerative encephalopathies

1
Chapter 1
INTRODUCTION
1.1 Different options to dispose Meat and bone meal
Meat and bone meal or MBM is a byproduct of the rendering industries. It is obtained
after removal of fat from mammal carcasses during the cooking process followed by drying
and crushing [Bradley, 1991]. MBM has historically been used worldwide in the formulation
of feed for cattle because of its high protein content, but after being found to be responsible
for the spreading of bovine spongiform encephthalopathy (BSE), its use has become
progressively restricted [Rodehutscord et al., 2002]. The European Commission has banned
the use of protein derived from mammalian tissues for feeding ruminants since July 1994
[Chalus and Peutz, 2000]. Moreover, the link between BSE and new variant of “creutzfeldt-
Jacob disease (vCJD)” in humans has made MBM a critical issue [Bruce et al., 1997].
MBM is produced in large amounts and requires a safe disposal method to avoid the
spreading of BSE. In United States around 2.1 millions metric tons of bovine, porcine, or
mixed species of MBM was produced in 2004, while in Canada, it was 432,000 metric tons
in 2000 [Garcia et al., 2006]. The current production of MBM in the EU is approximately 3
millions tons per year [http://ec.europa.eu].
Since these large volume of meat and bone meal can no longer be used as a feed to
animals, alternative safe disposal methods to avoid spreading of bovine spongiform
encephalopathy are required. The following sections outline various methods for disposal of
meat and bone meal.

2
1.1.1 Incineration/ Co-incineration
It has been reported that the responsible prions for BSE pathogens are destroyed by
combustion at 850 °C for at least 2 sec, or at 3 bar and 133 °C for at least 20 min [Ayllon et
al., 2006]. Incineration/ co-incineration is the potential solution for safe disposal of meat and
bone meal. The high incinerator temperature ensures complete destruction of prions
responsible for bovine spongiform encephalopathy. There are various incineration plants in
England and Belgium for incineration of meat and bone meal and they are operated when
there is an assurance of sufficient supply of meat and bone meal [Conesa et al., 2003]. An
issue with this method is the ash handling. The ash tends to stick on the bottom of the
incinerator chamber causing problem in a continuous operation.
Meat and bone meal can also be disposed of by co-incineration in cement kilns. The
high temperature of the cement kiln (around 1400 - 1450 °C) and sufficient residence time
ensure complete destruction of potential BSE pathogens [Cyr and Ludmann, 2006]. In the
US, there are around 30 separate sites where hazardous waste is burned in cement kilns
[Conesa et al., 2003].
1.1.2 Land-filling and alkaline hydrolysis
Land-filling was one of the options considered. It was ruled out due to high risk of
spreading potential BSE pathogens into the environment. However, a research work by
Gulyurtlu et al. [2005] concluded that the solid products (i.e. ashes) of a thermally pre-
treated meat and bone meal could be safely deposited in landfills. The authors reported that
ashes obtained after co-combustion of meat and bone meal with coal at relatively low

3
temperatures (750 - 850 °C) were free from harmful proteins and safe in normal municipal
landfills.
Inactivation of BSE prions by alkaline hydrolysis is also one of the options
researchers have been working on to safely dispose meat and bone meal. Taylor et al. [1997]
subjected samples of macerated mouse-brain infected with the 22A strain of scrapie agent to
gravity-displacement autoclaving at 121 °C for 30 min in the presence of 2 M sodium
hydroxide and found no infectivity in mouse bioassay. They concluded the similar treatment
could be effective for human and animal TDE agents.
1.1.3 Novel treatments: pyrolysis, gasification, and combustion
Apart from the above methods, combustion, pyrolysis and gasification are other
methods for disposal of meat and bone meal at elevated temperature for complete destruction
of potential BSE pathogens and effectively utilize the fuel value. The main difference among
these methods is the amount of oxygen supply. Combustion requires oxygen in excess of that
required to theoretically burn the feed material and mainly produces carbon dioxide and
water along with heat. Pyrolysis is the thermal conversion of organics in the absence of
oxygen supply and mainly produces liquid products, called pyrolytic oil or tar. Gasification
requires controlled/ partial oxygen supply and mainly produces gases containing carbon
monoxide and hydrogen (CO + H2), a mixture known as syngas. The following discussion
presents a brief summary of research studies carried out on meat and bone meal pertaining to
this section.
Ayllon et al. [2006] studied the effect of final pyrolysis temperature (300-900 °C) and
heating rate (2, 8 and 14 °C /min) on the fixed bed pyrolysis of MBM. Char and tar were the

4
main products with relatively small amount of gas. The product gas mainly consisted of CO2,
CO, H2, CH4, other H/C, and H2S. The lower heating value of product gas increased to 16.7
MJ/m3 with temperature until 500 °C and then decreased to 12.5 MJ/m3 at temperature higher
than 600 °C. The authors also concluded that the final pyrolysis temperature was more
important than the effect of heating rate. Chaala and Roy [2003] studied vacuum pyrolysis of
MBM at a temperature of 500 °C with total pressure of 4 kPa and heating rate of 15 °C /min.
They found that pyrolytic oil and solid residue were the main products with small amount of
gases. The pyrolytic oil obtained was highly viscous and waxy in nature with very unpleasant
odor. The high calorific value of this oil was found to be 34.2 MJ/kg. However, high nitrogen
content (14 wt. %) was the main concern addressed by the authors for use of this oil in the
combustion process. Fedorowicz et al. [2007] studied the gasification of feed consisting of
MBM, cow carcasses, and two types of specific risk materials (SRMs) at 1000 °C with steam
and nitrogen as carrier gases in a bench scale gasification system. The product gas mainly
consisted H2, CO, CO2, CH4, other H/C gases. The heating value of the product gas on
nitrogen free basis was in the range from 14.9 to 19.4 MJ/m3. A major issue encountered by
the authors was the production and handling of tar. Other studies include: fluidized bed co-
combustion of MBM with coals and olive bagasse [Fryda et al., 2006], co-combustion of
coal and MBM in a fluidized bed [Gulyurtlu et al., 2005], and the use of atmospheric
bubbling fluidized bed combustor for the utilization of raw animal wastes [Pilawska et al.,
2004]. The main issue associated with co-combustion was the emissions of NOx, VOC, and
other gases harmful to the environment. Other issues related to palletizing and limiting the
amount of MBM fed along with co-combustion material were also mentioned by the authors.

5
1.2 Knowledge gap
Literature review on meat and bone meal reveals that research has been done on
pyrolysis, combustion/ co-combustion and gasification of meat and bone meal. So far there is
no scientific investigation done to increase the hydrogen and syngas yield via gasification of
meat and bone meal in a fixed-bed reactor system followed by thermal cracking of tar using
oxygen/air and steam separately.
1.3 Objectives
The overall objective of this research work is to gasify meat and bone meal and
maximize the production of hydrogen and syngas in single stage and two-stage fixed reactor
systems. The research was carried out in three different phases as follows:
Phase I: In this phase, the gasification of MBM was carried out in single stage and
two-stage reactor systems. Pure oxygen was used as a gasifying agent and nitrogen was used
as a carrier gas. The first stage was used for gasification while the second one was used to
facilitate tar cracking to produce further gases. The effects of temperature of each stage (650-
850 °C), equivalence ratio (0.15-0.3), and packed bed height (40-100 mm) were studied on
product yields (char, tar, and gas) and gas compositions (H2, CO, CO2, CH4 and other H/C).
Phase II: In this phase, the gasification of MBM was carried out in single stage and
two-stage reactor systems using steam as a gasifying agent and nitrogen as a carrier gas. The
effects of temperature of each stage (650-850 °C), steam to meat and bone meal ratio (0.2-
0.8) (wt/ wt), and packed bed height (40-100 mm) were studied on product yields (char, tar,
and gas) and gas compositions (H2, CO, CO2, CH4 and other H/C).

6
Phase III: Pyrolysis or devolatilization is a very important step in the gasification
process. It is very complex and involves number of series and/ or parallel reactions occurring
simultaneously. In this phase, the kinetic analysis for pyrolysis of MBM was carried out
using thermogravimetric analysis (TGA) at three different heating rates (10, 15, and 25 °C/
min) for the temperature range of 25-550 °C. The simple distributed activation energy model
(DAEM) developed by Miura and Maki [1998] was used to determine activation energy, E,
and frequency factor, k0.
7
Chapter 2
LITERATURE REVIEW
2.1 Background
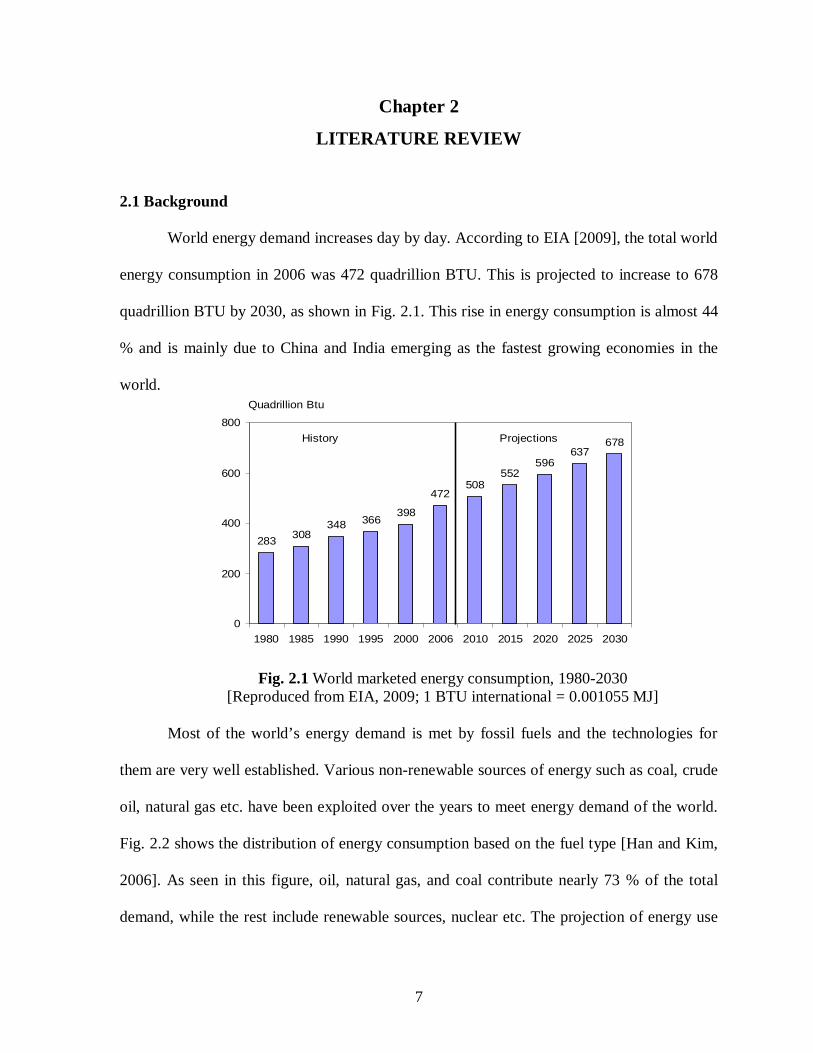
World energy demand increases day by day. According to EIA [2009], the total world
energy consumption in 2006 was 472 quadrillion BTU. This is projected to increase to 678
quadrillion BTU by 2030, as shown in Fig. 2.1. This rise in energy consumption is almost 44
% and is mainly due to China and India emerging as the fastest growing economies in the
world.
Fig. 2.1 World marketed energy consumption, 1980-2030 [Reproduced from EIA, 2009; 1 BTU international = 0.001055 MJ]
Most of the world’s energy demand is met by fossil fuels and the technologies for
them are very well established. Various non-renewable sources of energy such as coal, crude
oil, natural gas etc. have been exploited over the years to meet energy demand of the world.
Fig. 2.2 shows the distribution of energy consumption based on the fuel type [Han and Kim,
2006]. As seen in this figure, oil, natural gas, and coal contribute nearly 73 % of the total
demand, while the rest include renewable sources, nuclear etc. The projection of energy use
283 308348 366
398
472508
552596
637678
0
200
400
600
800
1980 1985 1990 1995 2000 2006 2010 2015 2020 2025 2030
Quadrillion Btu
History Projections

8
by fuel types is shown in Table 2.1 [EIA, 2009]. It is clear that the use of coal and
unconventional resources, compared to other fuel types, is going to increase the most in the
coming years to help meet the energy demand. The use of coal is going to increase from 127
quadrillion Btu in year 2006 to 190 quadrillion Btu in year 2030, while that of
unconventional resources of liquid fuel are going to increase from 3.1 million barrels/ day in
year 2006 to 13.4 million barrels/ day in year 2030.
Fig. 2.2 Shares of world’s primary energy consumption [Han and Kim, 2006, Used with permission]
Table 2.1 Projection of energy use by fuel type [Data source, EIA 2009]
Fuel type Current use (2006) Projected use (2030)
Liquid and other petroleum 85 million barrels/ day 107 million barrels/ day
Unconventional resources 3.1 million barrels/ day 13.4 million barrels/ day (including oil sands, heavy oil, bio-fuels, coal to liquid, gas to liquid) Natural gas 104 trillion cubit feet 153 trillion cubit feet Coal 127 quadrillion Btu 190 quadrillion Btu Electricity from nuclear power 2.7 trillion KWhrs 3.8 trillion KWhrs

9
There are several disadvantages associated with the use of fossil fuels as energy sources.
Environmental issues, prices, and limitation of resources are the key ones. Crude oil prices
have been fluctuating frequently in recent years, sparking concerns in most of the developing
and oil importing countries. Oil prices reached US $145 per barrel in 2008 and dropped down
below US $ 40 per barrel in the next few months. Moreover, fossil fuels have caused serious
environmental problems and disturbed the ecological cycle of the planet. One of the best is
the green house effect, which is a major problem the world is presently facing. It is causing
the average global temperature to rise, sea levels to rise due to melting of icebergs, and so
forth. Fig. 2.3 shows the historical and future CO2 emissions by countries [Timilsina, 2008].
This figure shows that the total CO2 emissions in 1980 was 18 billion tonnes, rising to 27
billions tonnes in 2004; an increase of 50 %. The figure also predicts that in 2030, CO2
emissions will be approximately 43 billions tonnes, and fast developing nations such as
China, India along with other Asian countries will be the key contributors.
Fig. 2.3 Historical and future CO2 emissions by countries/ regions [Timilsina, 2008, Used with permission]

10
Scientific speculations on depletion of fossil fuels encourage researchers from across
the world to find alternative form of energy. Nuclear energy is one of the viable alternatives,
however, capital cost, broad policy acceptance, and nuclear waste management challenges
are associated with this option. Another promising option is biomass energy. Some important
facts why biomass energy is drawing attention are [Demirbas et al., 2009]:
1. It meets energy needs without expensive conversion devices
2. It is carbon neutral
3. It can deliver energy in all forms that people need
4. It helps to restore unproductive and degraded lands, soil fertility and water
retention
5. It contributes to poverty reduction in developing nations
2.2 Biomass Gasification
There are various sources of biomass such as wood and wood wastes, agricultural
crops and their wastes, animal wastes, waste from food processing etc. Presently, the
available biomass resources could provide as much as 6.33 – 10.55 x 10¹² MJ of feed-stock
energy [Demirbas et al., 2009]. Table 2.2 [Skytte et al., 2006] shows that Asia, Latin
America and Africa have the highest biomass potential. From the table, Asia uses more
biomass than the actual annual potential while former USSR, Middle East and Latin America
use less than the actual potential. Biomass mainly contains carbon, hydrogen, oxygen,
nitrogen, and sulfur along with other heavy metals in small amounts. The high heating value
of biomass varies from source to source. It is in the range of 10 to 20 MJ/ kg which is

11
comparable to the high heating value of coal (15 - 33 MJ/kg) [Channiwala and Parikh, 2002;
Perry and Green, 1997].
Table 2.2 Biomass potential and use distribution between regions, 103 PJ/year (1 PJ=1015 J) [Skytte et al., 2006, Used with permission]
There are three main routes for the conversion of biomass to useful energy:
biochemical, chemical, and thermochemical. The focus of the present study is
Thermochemical. Thermochemical processes such as pyrolysis, gasification and combustion
have received special attention since they yield useful products and simultaneously
contributes to solving problems arising from biomass accumulation [Della Rocca et al.,
1999]. Combustion is a thermochemical oxidation process in which excess oxidant (typically
O2 in air) is supplied. This process is mainly used to generate heat and electric power.
Pyrolysis is carried out in the absence of oxygen and mainly produces high heating value
pyrolytic oil. Gasification can be described as the thermochemical conversion of
carbonaceous feed stock into gaseous products by supplying heat and a controlled or limited
amount of oxygen that is less than that theoretically needed for complete combustion. The
gases produced mainly contain syngas (CO + H2) along with methane and other
hydrocarbons in small amounts. These product gases could be used either to produce
electricity or valuable chemicals such as methanol, dimethylether, alcohols etc. via Fischer-
Tropsch synthesis [Han and Kim, 2006]. The overall gasification process involves pyrolysis/
Biomass potential North America
Latin America Asia Africa Europe Middle
East Former USSR World
Wood biomass 12.8 5.9 7.7 5.4 4 0.4 5.4 41.6 Energy crops 4.1 12.1 1.1 13.9 2.6 0 3.6 37.4
Straw 2.2 1.7 9.9 0.9 1.6 0.2 0.7 17.2 Other 0.8 1.8 2.9 1.2 0.7 0.1 0.3 7.6
Total potential 19.9 21.5 21.6 21.4 8.9 0.7 10 103.8 Use 3.1 2.6 23.2 8.3 2 0 0.5 39.7
Use/ potential (%) 16 12 107 39 22 7 5 38

12
devolatilization which produces char followed by gasification of char to produce gaseous
products as shown in Fig. 2.4 [Higman and Van der Burgt, 2008].
Fig. 2.4 Reaction sequence for gasification of coal or biomass (Reproduced from Higman and Van der Burgt, 2008)
As per the reaction scheme, the initial step in coal or biomass gasification is
pyrolysis, which produces a variety of species (tars, hydrocarbons liquids, pyrolysis gases
such as CH4, CO, H2, H2O, and char). In the second step, two different types of reactions take
place: gas phase reactions (cracking, reforming, combustion, shift reaction) and char-gas
reactions (gasification, combustion, etc.). The summary of possible reactions is presented in
Table 2.3 [Higman and Van der Burgt, 2008]. Combustion, methanation and CO-shift
reactions are exothermic while Boudouard, water gas and reforming reactions are
endothermic. When the system is in thermal balance, the heat evolved through exothermic
reactions is utilized by endothermic reactions. The partial combustion reaction of char and
Boudouard reactions are important for the production of pure CO, while the CO-shift
reaction is the deciding factor for CO and CO2 ratio in product gases.
Biomass may be gasified by using pure oxygen, air, steam or combination of these
with or without the use of a catalyst. The following section reviews biomass gasification
using oxygen/ air and steam.
Solid carbonaceous material (Coal, Biomass)
Pyrolysis Gases
(CO, H2, CH4, H2O, etc.
Tar, Oil, Naphtha
Oxygenated compounds
(Phenols, Acid
CharChar-Gas reactions
(Gasification, Combustion, CO Shift)
CO, H2, CH4, CO2, H2O
CO, H2, CH4, CO2, H2O and cracking products
Pyrolysis
Gas phase reactions
Cracking, reforming,
Combustion, CO shift

13
Table 2.3 Possible reactions for gasification of coal or biomass
Combustion reactions
Boudouard reaction
KmolMJCOCOC /17222
Water gas reaction
KmolMJHCOOHC /13122
Methanation reaction
kmolMJCHHC /752 42
CO shift reaction
kmolMJHCOOHCO /41222
Steam methane reforming reaction
kmolMJHCOOHCH /2063 224
2.2.1 Biomass gasification using oxygen/ air
Many researchers have used oxygen/air as a source of oxidant in the gasification
process. Use of pure oxygen gives accurate control of oxygen supply to the reaction and at
the same time the effect of gas residence time on product yield can also be studied by varying
the inert gas flow rate. The following discussion focuses on a few important studies carried
out on biomass gasification using oxygen/ air.
Xiao et al. [2007] studied the effect of equivalence ratio (ER), bed height and
fluidization velocity ratio (u/umf) on gasification of polypropylene plastic waste in a fluidized
kmolMJOHOHkmolMJCOOCO
kmolMJCOOC
/2422/1/2832/1
/1112/1
222
22
2

14
bed gasifier using air pre-heated to 400 °C. They observed that with increase in ER from 0.2
to 0.45, gas yield increased from 76.1 to 94.4 wt. %, while tar and char yield decreased to
almost negligible at 15.9 to 5 wt. % respectively keeping other parameters constant. H2 and
CO yields first increased with ER to a maximum yield and then decreased. The increase in
CO and H2 yields is due to thermal cracking of tar at higher temperature, which is consistent
with the decrease in tar production and C2+. While changing the static bed height from 100 to
300 mm, they found enhancement in secondary cracking reactions of tar and heavy
hydrocarbons and char gasification as well. The H2 content was almost constant, while
methane and other hydrocarbons decreased slightly with increase in static bed height. The
CO and CO2 contents reached maximum values for the static bed height of 200 mm. With
increase in fluidization velocity ratio (u/umf) from 2 to 4, the char yield was increased from 9
to 12 wt. % as the ratio increased from 3 to 4, while on the other hand, the gas yield was
decreased from 87.5 to 85 wt. % and that of tar decreased slightly as well. With increasing
the ratio u/umf from 2 to 4, CO, H2 and CnHm decreased from 22.7 to 18.9 %, from 5.7 to 4.9
% and from 3.9 to 3.5 % respectively.
Narvaez et al. [1996] studied biomass air gasification in a bubbling fluidized bed
gasifier using calcined dolomite catalyst in the guard bed reactor. They found that with
increase in equivalence ratio (ER) from 0.2 to 0.45 for gasifier temperature at 800 °C,
freeboard temperature at 600 °C, and H/C (fed to the gasifier) at 2.3, the amount of fuel gases
(H2, CO, CH4, and C2H2), and tar yield in the gas decreased, while gas yield increased.
Maximum H2 yield was obtained at an ER of 0.26. They observed that upon increasing the
gasifier bed temperature from 700 to 850 °C keeping ER at 0.3, and H/C at 2.1, H2 yield
increased from 5 to 10 vol. %., CO yield increased from 12 to 18 vol. %, CO2 yield

15
decreased with increase in temperature while no significant variation observed in CH4 and
other hydrocarbons.
Manya et al. [2006] studied the effects of bed height (100-150 mm) and equivalence
ratio (air ratios: 25 %, 30 %, and 35 %) of air gasification of sewage sludge on gas yield and
composition, average cold gas efficiency (defined as the ratio of the LHV of the produced
gas to the LHV of the DSS fed), and raw gas tar content in a bubbling fluidized bed at 850
°C. From the statistical analysis of the data, they concluded that the influence of air ratio was
more significant than the effect of bed height. They observed that with increase in air ratio
from 24 to 35 %, the concentrations of H2, CO, CH4, C2H4, and C2H6 decreased. With an
increase in bed height from 150 to 300 mm, the concentrations of the above components
increased. In the case of CO2, its percentage was not affected either by the air ratio or the bed
height but only weakly for the interaction of these factors. It was also observed that
concentration of C2H2 was affected only by the bed height and not by air ratio. The ygas
(specific yield to gas obtained) and ycarbon (average percentage of carbon in the biomass
recovered in the gas) increased as equivalence ratio and bed height were increased. The LHV
(lower heating value) was decreased as equivalence ratio increased while the average cold
gas efficiency had no dependence on the air ratio.
Mansaray et al. [1999] studied the effects of fluidization velocity (0.22, 0.28, and
0.33 m/s) and equivalence ratio (0.25, 0.3, and 0.35) for the air gasification of rice husk in a
fluidized bed gasifier. The average temperature of the dense bed varied from 665 to 828 °C
depending on the operating conditions. It was observed that as equivalence ratio was
increased, the concentration of CO2 increased while the concentration of the fuel gases (CO,
H2, CH4, C2H2 + C2H4 and C2H6) decreased. Increasing the fluidization velocity slightly

16
increased the concentration of CO2 and decreased the concentrations of CO, H2, CH4, C2H2 +
C2H4 and C2H6 which is due to the higher degree of combustion taking place at higher values
of equivalence ratio and/ or fluidization velocity. The gas yield varied between 1.3 and 1.98
Nm3/ kg fuel depending on the operating conditions. An increase was observed with
increasing in equivalence ratio, but not appreciably affected by the changes in the fluidization
velocity. The carbon conversion varied between 55 to 81 % depending on the equivalence
ratio and fluidization velocity. Carbon conversion increased with equivalence ratio due to a
decrease in char formation, while increasing the fluidization velocity caused reduced the
residence time of gases and enhanced carry over of fine char particles from the bed, thus
decreased carbon conversion.
Based on the literature, a qualitative summary of the effect of key operating
parameters on product distribution and gas composition, when using air/ oxygen blown
gasification, is presented in Table 2.4.
Table 2.4 Effect of key parameters on product distribution and gas composition for air/ oxygen blown gasification
Temperature
(+)
Equivalence ratio
(+)
Fluidization
velocity (+)
Bed height
(+)
Char conversion + + - +
Tar yield - - - -
Gas yield + + - +
H2 yield + - - + (marginal)
CO yield + - - +
CO2 yield - + + +
CH4 yield Not significant - Unclear Unclear
Other H/C yield Not significant - - Unclear
+: increase, -: decrease

17
2.2.2 Biomass gasification using steam
Many researchers have studied biomass gasification using steam and found it
beneficial for adjusting the gas composition and improving the hydrogen. The following
discussion is about few important studies on steam gasification of biomass.
Franco et al. [2003] studied the steam gasification of forestry biomass in an
atmospheric fluidized bed over a temperature range of 700 – 900 °C and steam/biomass ratio
from 0.4 to 0.85 w/w. With an increase in temperature from 700 to 900 °C at a
steam/biomass ratio of 0.8 w/w, they found an increase in gas yield and decrease in tar and
char yield due to further cracking of liquids and enhanced char reaction with the gasifying
medium. H2 formation increased from 26 to 33 mol % while CO production decreased from
41 to 38 mol %. Hydrocarbon concentration decreased while there was no significant
variation in CO2 concentration, which was approximately 14 mol %. Steam/biomass ratio
was varied from 0.4 to 0.85 w/w at 800 °C. It was observed that the production of gaseous
products reached a maximum around steam/biomass ratio of about 0.6-0.7 w/w, which
corresponded to the minimum liquid yields. H2 formation was maximum (41 mol %) at
steam/biomass ratio of 0.6 – 0.7 w/w. CO decreased with increase in ratio up to 0.6 and then
remained constant. Similar trends were observed in the case of hydrocarbons as well. There
was no significant variation observed in CO2 concentration.
Wei et al. [2007] studied the effects of reaction temperature (750 - 850 °C) and
steam/biomass (S/B) ratio (0.0-1.0 g/g) on product yields and the compositions of product
gas in a free-fall reactor (concurrent downflow) for two different types of biomass, namely
legume straw and pine sawdust. They observed that with increase in S/B ratio at 800 °C the
gas yield increased while tar and char production decreased. With an increase of S/B mass

18
ratio from 0 to 0.6 g/g, the tar yield from legume straw decreased from 5.5 wt. % to 2.8 wt. %
daf (dry ash free), while char yield decreases from 7.4 to 4.2 wt. % db (dry basis). The tar
yield from pine sawdust decreases from 3.6 wt. % to 1.5 wt. % daf, while char yield
decreased from 5.5 to 3 wt. % db. At higher S/B ratio from 0.8 to 1 g/g, the product yields
remained constant. It was found that CO and CH4 concentrations decreased and CO2 and H2
concentrations increased with an increase in S/B ratio from 0 to 0.6 g/g and at higher S/B
ratio, no significant changes were detected. The H2 concentration in the gas product from
legume straw reached a maximum of 40.3 mol% at a S/B mass ratio of 0.6, while that from
pine sawdust was 36.8 mol%. An increase in temperature from 750 to 850 °C at a S/B mass
ratio of 0.6 g/g showed an increase in gas yield and a decrease in char and tar yield for both
types of biomass. It was found that H2 and CO2 increased while CO and CH4 concentration
decreased with increasing reaction temperature. An H2 concentration of 50.6 mol% and a CO
concentration of 21.2 mol% were obtained from legume straw at the temperature of 850 °C,
while an H2 concentration of 44 mol% and a CO concentration of 28.2 mol% were obtained
from pine sawdust.
Lv et al. [2004] studied the effects of reaction temperature (700 - 900 °C), steam to
biomass (S/B) ratio (0 - 4.04), and equivalence ratio (ER) (0.19 - 0.27) on the product
distribution and gas composition in air-steam gasification of pine sawdust in a fluidized bed.
The gas yield and carbon conversion increased from 1.43 to 2.53 Nm3/kg biomass and 78.17
to 92.59 % respectively when reactor temperature increased from 700 to 900 °C. Equivalence
ratio and S/B were held constant at 0.22 and 2.7 respectively. Regarding the gas composition,
H2 production increased while CH4, C2H4, C2H6, and CO decreased with increasing reactor
temperature. Varying the S/B ratios from 0 to 4.04 at a reactor temperature of 800 °C, and at

19
a equivalence ratio of 0.22, led to a carbon conversion of 92.09 % at S/B of 0.6, which then
decreased to 75.19 % at the highest S/B ratio. This was reportedly the result of an excessive
quantity of low temperature steam induction. It was observed that CO concentration
decreased while CH4, CO2, and C2H4 concentrations increased for S/B in the range of 0 to
1.35. Over S/B range of 1.35 to 2.7, CO, CH4 and C2H4 concentrations decreased, while CO2
and H2 concentrations increased.
Ferdous et al. [2001] studied the production of H2 and medium heating value gas via
steam gasification of lignins in a fixed-bed reactor. They studied the effect of steam flow rate
(5-15 g/h/g lignin), effect of temperature (650 - 850 °C), effect of commercial steam
reforming catalyst, and effect of catalyst bed temperature (600 -750 °C) on lignin conversion
and product gas composition. They found that with an increasing steam flow rate from 5 to
15 g/h/g lignin, lignin conversion increased from 64 to 74 wt. % and from 74 to 85 wt. % for
Alcell and Kraft lignin. Reactor temperature was held constant at 750 °C. The H2 yield
increased while that of CO and CH4 decreased with increasing steam flow rate. This was
probably due to increased char and tar reforming reactions with increasing steam flow rate.
When temperature was increased from 650 to 800 °C at a steam flow rate of 5 g/h/g lignin,
the lignin conversion increased from 56 to 69 wt. % and from 60 to 76 wt. % for Alcell and
Kraft lignin, respectively. The concentration of H2 and CO in the product gas increased while
that of CO2, CH4 and C2+ decreased with increasing in the temperature.
Based on the literature, a qualitative summary of the effect of key parameters in
steam gasification of biomass on product distribution and gas composition has been prepared
(Table 2.5).

20
Table 2.5 Effect of key parameters on product distribution and gas composition for the steam gasification of biomass
Temperature
(+)
Steam/ Biomass
(+)
Char conversion + +
Tar yield - -
Gas yield + +
H2 yield + +
CO yield - -
CO2 yield Unclear Unclear
CH4 yield - Unclear
Other H/C yield - Unclear
+: increase, -: decrease
2.3 Kinetic analysis for pyrolysis of meat and bone meal
The pyrolysis of coal, biomass or any carbonaceous materials involves a great
number of reactions. These reactions are complex and occur in parallel and series [Mansaray
and Ghaly, 1999]. The design and simulation of a reactor and setting up the optimum process
conditions require the knowledge of pyrolysis kinetics [Aguado et al., 2002]. The most
commonly used technique to study the thermal behavior of carbonaceous material is
thermogravimetric analysis (TGA) [Garcia-Ibanez et al., 2006]. TGA only provides general
information on the overall reaction kinetics; however it could be used for providing
comparative kinetic data of various reaction parameters such as temperature and heating rate.
The advantage of this method is that it requires fewer data for calculating kinetic parameters
than the isothermal method. The TGA method involves continuous measurement of weight
loss with respect to temperature at a particular heating rate and the kinetics obtained using

21
this method can be examined over an entire temperature range in a continuous manner
[Mansaray and Ghaly, 1999; Freeman and Carroll, 1958].
Two studies were reported in the open literature regarding thermogravimetric
behavior of MBM and kinetic analysis for pyrolysis of MBM. Conesa et al. [2003] studied
the overall kinetic parameters for the decomposition of MBM by adapting the kinetic model
proposed to the temperature derivative of the weight loss of a sample under non-isothermal
conditions. They carried out experiments with heating rates of 10, 20, and 30 K min-1 over
the temperature range of 80 to 800 °C considering three different initial fractions for the
pyrolysis runs. It is as follows:
3,2,1, iVSF iii (1)
The kinetic model chosen for the analysis was a single reaction of nth order, with simplified
kinetic equation as follows:
inii
iio
i wwRTEk
dtdw
))(exp( (2)
For the calculation of the total weight fraction, taking into account:
3
1
3
1
3
11)(
i i iiioiio wwwww (3)
and
3
1)(
iii wwww (4)
Considering an Arrehenius-type behavior of the rate constants, and considering a first-order
reaction, they determined activation energies and pre-exponential constants for all fractions.
The activation energies and pre-exponential factors were 30.9, 72.2, 21.5 kJ/ mol and 7.16 x
103, 4.84 x 10⁵, 3 min-1 respectively for three fractions considered. It was also observed that
second fraction contributed the maximum in the weight loss.

22
In another study, Ayllon et al. [2005] studied the pyrolysis of MBM in a
thermobalance in order to compare different possible kinetic methods to obtain information
about the MBM decomposition process. They carried out experiments at different heating
rates (5, 10, 15 and 20 °C/ min) with an initial weight of 15 mg, a particle diameter of 250 -
350 µm, a nitrogen flow rate of 100 cm3/ min NTP and a final pyrolysis temperature of 900
°C. They compared different kinetic models, simple kinetic models, which consider the
decomposition of one fraction only, models based on several independent fractions
decomposing simultaneously with first and second order kinetic equations for each fraction
such as two fractions, three fractions and four fractions. They derived the global pyrolysis
rate equation as follows:
N
iii
ii ffdTd
fdTd
10 )(
11
(5)
Using above equation with right kinetic parameters, the curve for α and the derivative of α
with respect to temperature can be simulated. They found the best fitting is obtained with the
model that considers four fractions following a second order kinetic law. The respective
activation energy was highest for the third fraction and it was 85.9 kJ/ mol.
Miura and Maki [1998] developed a simple method for determining the kinetic
parameters for complex reactions such as coal and biomass pyrolysis. This model assumes
that a number of parallel, irreversible and first order reactions with different activation
energies occur simultaneously. All the reaction activation energies have the same frequency
factor, k0, at the same conversion rate. According to this model, the release of volatiles is
given by:
dEEfdtekVVRTEt
)()exp(*/1/
0
00
(6)

23
Many researchers used distributed activation energy model to study the pyrolysis of coal and
biomass and for determining the kinetic parameters as well [Li et al., 2009; Sonobe and
Worasuwannarak, 2008]. In this work, the simple distributed activation energy model
(DAEM) was used to determine kinetic parameters for pyrolysis of MBM.

24
Chapter 3
EXPERIMENTAL
This section provides details the experiments conducted in this research. It includes a
system description of the experimental approach with schematic diagrams, experimental
procedures, analysis of feed, packed bed material, and product gas analysis, and the research
plan.
3.1 System description
This section is further divided into two parts for two distinct phases of the research.
The first part deals with the system description of phase I: gasification of MBM using
oxygen as a gasifying agent in single stage and two-stage reactor systems. The second part
deals with the system description of phase II: gasification of MBM using steam as a
gasifying agent in single stage and two-stage reactor systems. The third phase: Pyrolysis of
meat and bone meal in a thermogravimetric analyzer. The system description is included in
the experimental procedure itself.
3.1.1 Phase I: Gasification of Meat and Bone Meal Using Oxygen
Experiments were performed at atmospheric pressure in single stage and two-stage
fixed bed reactor systems. A schematic diagram of the apparatus is shown in Fig. 3.1. The
first stage and second stage reactors were made of Inconel tubing having 10.5 mm ID and
500 mm and 300 mm lengths respectively. Each reactor had three pins welded inside to
support the fixed bed with the help of quartz wool. The reactors were connected by a 3 mm
diameter, 40 mm long tube and placed inside separate tubular furnaces. K-type

25
Fig. 3.1 Schematic diagram of experimental setup for gasification of meat and bone meal using oxygen in two-stage fixed bed reaction system
N2 Gas O2 Gas
Mass Flow Meter
Condensers
Gas Collector
First Stage Reactor
&
Furnace
Second Stage Reactor
&
Furnace
TIC
TIC
Vent

26
thermocouples were directly connected with each reactor to maintain and monitor the
temperature of the reactor wall via temperature controller system (Eurotherm models 2132
and 2416, USA). Nitrogen as an inert carrier gas and oxygen as a gasifying agent were
supplied at the desired flow rates from separate cylinders through needle valves and mass
flow meters (Aalborg model GFM17). The calibration of the mass flow meters was carried
out using a calibrated bubble flow meter and is presented in Appendix A. Two glass
condensers in series below the second stage reactor, surrounded by a mixture of ice and salt,
were used to condense the tar and cool down the product gases. The product gases were
collected in the saturated brine solution column which was further connected to the overhead
surge tank to receive the displaced brine solution.
3.1.2 Phase II: Gasification of Meat and Bone Meal Using Steam
Experiments were performed at atmospheric pressure in single stage and two-stage
fixed bed reactor systems. The schematic diagram is shown in Fig. 3.2. The first stage and
second stage reactors were made up of Inconel tubing having 10.5 mm ID and 500 mm and
370 mm lengths respectively. Each reactor had three pins welded inside to support the fixed
bed with the help of quartz wool. The reactors were connected by a 3 mm diameter, 40 mm
long tube and placed inside separate split tube furnaces (Applied Test Systems, Inc., USA)
with thermocouples located at the mid-length of the heating zone. The temperatures of the
reactors were monitored and controlled by temperature controller system (Eurotherm models
2132 and 2416, USA). Nitrogen as an inert carrier was supplied at the desired flow rate from
a separate cylinder through a needle valve and mass flow meter (Aalborg model GFM17),
while water was injected into the reactor by a syringe pump (Kent Scientific, Genie Plus

27
Fig. 3.2 Schematic diagram of experimental setup for steam gasification of meat and bone meal in two-stage fixed bed reaction system
N2 Gas
Mass Flow Meter
Condensers
Gas Collector
Brine Solution
First Stage Reactor
&
Furnace
Second Stage Reactor
&
Furnace
TIC
TIC
VentWater
Syringe pump

28
Model, USA) at the desired flow rate. The calibration curve is presented in Appendix A. Two
glass condensers in series below the second stage reactor, surrounded by a mixture of ice and
salt, were used to condense the tar and cool down the product gases. The product gases were
collected in the saturated brine solution column to prevent CO2 dissolution in pure water. The
brine solution column was further connected to the overhead surge tank to receive the
displaced brine solution.
3.2 Experimental procedure
3.2.1 Phase I: Gasification of Meat and Bone Meal Using Oxygen
The first stage was used for gasification of MBM while the second stage was used for
further cracking of tar. The feed material was placed inside the first stage reactor and inert
packed bed material (Ottawa sand) was placed inside the second stage reactor. These
materials were supported on the plug of quartz wool which was held on the supporting pins
inside each reactor. The sample size of MBM was 2 g for all experiments. The heating rate of
the first stage reactor was kept at 25 °C /min. The oxygen supply was started when the first
stage reactor temperature reached to 50 °C. It then took 24 to 32 min from 50 °C to reach the
final temperature of 650 to 850 °C in the case of single stage experiments. In the case of two-
stage experiments, the second stage reactor was heated to the desired temperature (650-850
°C) before the heating of first stage started. The heating of first stage was started at 25 °C
/min. The reminder of the experimental procedure was the same as single stage experiments.
After attaining the final desired temperature of the first stage, the reaction was allowed to
continue for the next 30 min. Subsequently the heating was stopped and the reactor(s) was
allowed to cool down. The amount of product gases collected was measured by the

29
displacement of the brine solution. They were analyzed using two different gas
chromatographs (GCs HP 5880 and HP 5890). The amount of condensed tar in the glass
condensers and the char left inside the reactor were measured by taking the difference in
weights of glass condensers and reactor before and after the reaction. After each run, the
reactor and glass condensers were cleaned using acetone and then dried with compressed air
prior to the next run.
3.2.2 Phase II: Gasification of Meat and Bone Meal Using Steam
The first stage was used for gasification of MBM while the second stage was used for
further cracking of tar. The feed material was placed inside the first stage reactor and inert
packed bed material (Ottawa sand) was placed inside the second stage reactor. These
materials were supported on the plug of quartz wool which was held on the supporting pins
inside each reactor. The sample size of MBM was kept 2 g for all experiments. The heating
rate of the first stage reactor was kept at 25 °C /min. Water injection was started when the
first stage reactor temperature reached 110 °C. It took approximately 25 to 33 min from 30
°C to reach the final temperature of 650 to 850 °C in the case of single stage experiments. In
the case of two-stage experiments, the second stage reactor was heated to the desired
temperature (650-850 °C) with N2 flow of 45 ml/min before the heating of first stage started.
The heating of first stage was started at 25 °C /min. The remainder of the experimental
procedure was the same as in case of single stage experiments. After attaining the final
desired temperature of the first stage, the reaction was allowed to continue for the next 30
min. Subsequently the heating was stopped and the reactor(s) allowed to cool down. The
amount of product gases collected was measured by the displacement of the brine solution.

30
They were analyzed using two different gas chromatographs (GCs HP 5880 and HP 5890).
The amount of condensed liquid (tar + water) in the glass condensers and the char left inside
the reactor were measured by a weight difference before and after the reaction. After each
run, the reactor and glass condensers were cleaned using acetone and then dried with
compressed air prior to the next run.
3.2.3 Phase III: Pyrolysis of Meat and Bone Meal in a Thermogravimetric Analyzer
The thermogravimetric analyzer (Pyris Diamond TG/ DTA, PerkinElmer Instruments,
USA) consists of a micro thermobalance with an electric furnace connected to a computer.
Argon was used as a carrier gas to sweep the product gases. Its flow rate was set at 60 ml/
min as per the operating procedure of the instrument. The MBM sample was kept in a
Alumina sample holder. The sample size was kept 10 mg approximately in all experiments.
The final pyrolysis temperature of the sample in all experiments was set at 550 °C. The
experiments were carried out at three different heating rates (10, 15, and 25 °C/ min).
3.3 Analysis of meat and bone meal, inert packed bed material, and product gases
Experiments were performed with meat and bone meal obtained in the powder form
from Saskatoon Processing Ltd., Saskatoon, SK, Canada. The particle size distributions of
the meat and bone meal and the inert packed bed material (Ottawa sand), in the second stage
reactor were carried out using a particle size analyzer (MasterSizer, Malvern Instruments,
UK). The MBM was filled without applying any pressure or tapping in a standard volume
cylindrical container. Then, the cylindrical container was weighed and the difference in
weights of filled and empty container was used to calculate the specific gravity of MBM. The

31
proximate analysis of MBM was carried out using ASTM D 3172-89 standards while the
elemental analysis was carried out using a Vario EL III CHNS analyzer (Elementar Americas
Inc., USA). The product gases were analyzed using two different gas chromatographs (GCs
HP 5880 and HP 5890). The HP 5880 was equipped with a flame ionization detector (FID).
A Chromosorb 102 column with 1/8 inch diameter and 6 ft length was used to analyze the
CH4 and other hydrocarbons. The HP 5890 was equipped with a thermal conductivity
detector (TCD). A Carbosieve S II column with 1/8 inch diameter and 10 ft length was used
to analyze H2, CO and CO2. The conditions for the HP 5880 were as follows: initial
temperatures of 40 °C, initial temperature hold time of 1 min, heating rate of 10 °C /min.,
final temperature of 180 °C, final hold time of 3 min., injector temperature of 220 °C and
detector temperature of 250 °C. The conditions for the HP 5890 were as follows: initial
temperatures of 40 °C, initial temperature hold time of 1 min, heating rate of 10 °C /min,
final temperature of 180 °C, final hold time of 3 min, injector temperature of 200 °C and
detector temperature of 220 °C. The gas analysis was carried out on a carrier gas (N2) free
basis.
3.4 Experimental design
Semi-batch gasification of MBM in phases I and II was carried out by studying the
effect of one parameter at a time while holding all other parameters constant. The range of
the parameters was selected based on the literature review and experimental set up
limitations and is shown in Table 3.1. The optimum run, which was selected based on the
highest hydrogen/ syngas yield, was repeated once for each parameter to find out the
percentage difference in reproducibility of the experimental data.

Table 3.1 Experimental design
Parameter
Range
T1
T2
ER
Steam/ MBM
Packed bed height
T1 650-850 °C 650-850 °C - 0.2 NA 60
T2 650-850 °C 650-850 °C 650-850 °C 0.2 NA 60
ER 0.15-0.3 650-850 °C 650-850 °C 0.15-0.3 NA 60
Phase I
Packed bed
height 40-100 mm 650-850 °C 650-850 °C 0.15-0.3 NA 40-100 mm
T1 650-850 °C 650-850 °C - NA 0.6 60
T2 650-850 °C 650-850 °C 650-850 °C NA 0.6 60
Steam/
MBM 0.2-0.8 650-850 °C 650-850 °C NA 0.2-0.8 60 Phase II
Packed bed
height 40-100 mm 650-850 °C 650-850 °C NA 0.2-0.8 40-100 mm
T1: Temperature of 1st stage; T2: Temperature of 2nd stage; ER: Equivalence ratio; NA: Not applicable
32

33
Chapter 4
RESULTS AND DISCUSSION
This chapter presents the experimental results and discussion from phases I to III of
the project. Section 4.1 deals with the proximate and elemental analysis of the MBM as well
as particle size distribution of MBM and Ottawa sand used in the experiments. The results
and discussion of the effects of different parameters during the gasification of MBM using
oxygen are presented in section 4.2. Section 4.3 presents results from the steam gasification
of MBM, while section 4.4 consists of determination of kinetic parameters for the pyrolysis
of MBM in a thermogravimetric analyzer.
Optimal experiments were repeated for each parameter to check the reproducibility of
the data. Percentage difference observed in replicate runs is reported in each figure. The
variation observed in product yield and gas composition during replicate runs is considered
to be mainly due to non-homogeneity of meat and bone meal in the sample and errors during
product yield and gas analyses.
4.1 Particle size distribution, proximate and elemental analysis
The MBM used for the experiments was in powder form and brownish in color
having specific gravity of approximately 0.55. The particle size distribution of Ottawa Sand
and MBM powder was carried out using MasterSizer and it is in the range of 152.2 to 1290.9
µm and 5 to 3228 µm respectively as shown in Fig. 4.1 (a) and (b). The proximate analysis of
MBM is presented in Table 4.1. The carbon (C), hydrogen (H), nitrogen (N) and sulfur (S)
analysis of the MBM is also presented in Table 4.1. The gross heating value of MBM was

34
(a)
(b)
Fig. 4.1 Particle size distributions of (a) Ottawa sand and (b) MBM powder
0
2
4
6
8
10
12
14
16
18
20
0 200 400 600 800 1000 1200 1400
Particle size (um)
Vol
ume
In (%
)
0
1
2
3
4
5
6
7
8
9
10
0 500 1000 1500 2000 2500 3000 3500
Particle size (um)
Volu
me
In (%
)

35
Table 4.1 Proximate and ultimate analysis of meat and bone meal
Moisture content (wt. % wet basis) 4.5
Gross heating value (MJ/kg) 17.1
Proximate analysis (wt. % dry basis)
Volatile matter 73.8
Ash 18.3
Fixed Carbon 7.8
Ultimate analysis (wt. %)
C 46.3
H 6.6
N 9.7
S 1.0
Oa 36.4
a = by difference

36
calculated using the Channiwala and Parikh [2002] correlation. The results are comparable
with the literature. The carbon, hydrogen, and nitrogen contents of MBM in the literature
were in the range of 41 to 46 (wt. %), 5.8 to 6.4 (wt. %), and 7.8 to 9 (wt. %). Moreover, the
gross heating value mentioned in the literature was in the range of 17-20 MJ/kg which is also
comparable with the heating value of MBM used in this work [Chaala and Roy, 2003; Ayllon
et al., 2006; Conesa J.A. et al., 2003].
4.2 Gasification of meat and bone meal using oxygen
4.2.1 Single stage operation
4.2.1.1 Effect of temperature
The effect of final temperature of the first stage was studied by bypassing the second
stage in Fig. 3.1. The final temperature of first stage was varied from 650 to 850 °C in
increments of 50 °C while holding equivalence ratio (ER) at 0.2 and nitrogen flow rate at 45
ml/min. The effect of the final temperature of the first stage on product (char, tar and gas)
yield and gross heating value (GHV) of gas is presented in Fig. 4.2. As expected, char (from
22.9 to 17.8 wt. %) and tar (from 47 to 40.7 wt. %) yields decreased, while gas yield
increased (from 22.1 to 30.8 wt. %). Higher temperature is favorable for the gasification of
char as well as thermal cracking of tar. Similar trends were observed by Lv et al. [2004].
They found that carbon conversion increased from 1.43 to 2.53 Nm3/kg biomass when the
reactor temperature increased from 700 to 900 °C in air-steam gasification of pine sawdust in
a fluidized bed.
Fig. 4.3 shows the effect of the final temperature of the first stage on gas composition.
The product gas was mainly composed of H2, CO, CO2, CH4 and other heavier hydrocarbon

37
Fig. 4.2 Effect of first stage final temperature on product yield and GHV of gas at ER of 0.2 and N2 flow rate of 45 ml/min (% Difference in replicate run: Char - ±2, Tar - ±2, Gas - ±4)
Fig. 4.3 Effect of final temperature of first stage on gas composition at ER of 0.2 and N2 flow rate of 45 ml/min (% Difference in replicate run: H2 - ±3, CO - ±4, CO2 - ±6, CH4 - ±2, Other H/C - ±3)
0
20
40
60
550 650 750 850
Temperature (°C)
Wei
ght (
%)
0
4
8
12
Gro
ss H
eatin
g Va
lue
(MJ/
m3)
Char
Tar
Gas
GHV
0
10
20
30
40
50
60
550 600 650 700 750 800 850
Temperature (C)
Volu
me
(%)
H2
CO
CO2
CH4
C2H4
C2H6
C3H6
C3H8

38
gases. Each gas component showed a clear trend. The H2 yield increased from 5.5 to 7.3 vol.
% (N2 free basis), the CO2 yield decreased sharply from 55 to 20.5 vol. % and CO yield
increased remarkably from 10 to 51.6 vol. % with an increase in temperature from 650 to 850
°C. Enhanced carbon conversion and the Boudard reaction ( COCOC 22 ), reaction of
carbon and carbon dioxide to produce carbon monoxide, at higher temperature are partially
responsible for the observed increase in CO and the corresponding decrease in CO2. The
gasification of biomass is a very complex process. It involves several physical and chemical
steps [Cipriani et al., 1998]. Methane and other hydrocarbons showed little variation with an
increase in temperature. This is likely due to some secondary reactions with CO2. The gross
heating value (GHV) of the product gases increased from 5.3 to 9.3 MJ/m3 as temperature
increased from 650 to 850 °C, which is consistent with the significant increase in CO content
in the product gas.
4.2.2 Two - stage operation
4.2.2.1 Effect of temperature
Tar is a complex mixture of condensable hydrocarbons, which includes single ring to
multiple ring aromatic compounds along with other oxygen containing hydrocarbons and
complex polycyclic aromatic compounds [Devi et al., 2005]. The tar can be removed in
various ways, with increased residence time and thermal cracking being two of them
[Bridgwater, 1995]. With this in mind, second stage reactor was introduced in series to the
first stage for further cracking of tar and to increase the H2 yield. The second stage reactor
temperature was varied from 650 to 850 °C in increments of 50 °C, keeping first stage
temperature at 850 °C, equivalence ratio (ER) at 0.2, nitrogen flow rate at 45 ml/min.

39
Fig. 4.4 Effect of second stage temperature on product yield and GHV of gas at first stage final temperature of 850 °C, ER of 0.2, N2 flow rate of 45 ml/min and packed bed height of 60 mm (% Difference in replicate run: Char - ±2, Tar - ±2, Gas - ±4)
Fig. 4.5 Effect of second stage temperature on gas composition at first stage final temperature of 850 °C, ER of 0.2, N2 flow rate of 45 ml/min and packed bed height of 60 mm (% Difference in replicate run: H2 - ±3, CO - ±1, CO2 - ±7, CH4 - ±5, Other H/C - ±4)
0
20
40
60
550 650 750 850
Temperature (°C)
Wei
ght (
%)
0
5
10
15
20
Gro
ss H
eatin
g Va
lue
(MJ/
m3)Char
Tar
Gas
GHV
0
10
20
30
40
50
550 600 650 700 750 800 850
Temperature (C)
Volu
me
(%)
H2
CO
CO2
CH4
C2H4
C2H6
C3H6
C3H8

40
The second stage also contained a packed bed of inert material (Ottawa sand) packed to
depth of 60 mm.
The effect of second stage temperature on product yield is presented in Fig. 4.4. The
tar yield decreased from 26.5 to 17.4 wt. % and gas yield increased from 42.3 to 52.2 wt. %.
The decrease in tar yield and increase in gas yield were 16.4 and 5.6 % respectively up to 750
°C but beyond this temperature, they were 21.4 and 16.8 %, respectively. This shows that the
thermal cracking of tar becomes highly favorable beyond 750 °C. By introducing the second
stage, the tar yield is reduced by 57.3 % while gas yield is 40.9 % higher than that obtained
using only a single stage. Fig. 4.5 shows that CO content decreased consistently from 41.6 to
36.2 vol. %, while that of CO2 showed no consistent change. The CH4 yield increased
slightly at temperatures above 700 °C, while the yield of C2+ hydrocarbons (C2H6, C3H6,
C3H8) decreased sharply after 700 °C. This phenomenon can be explained as cracking of
heavier hydrocarbons into lighter hydrocarbons and H2 which is further supported by the
rapid increase in H2 content after 700-750 °C. The gross heating value (GHV) of product
gases decreased gradually from 18.1 to 16.1 MJ/m3 over the temperature range of 650 to 850
°C because of the continuous decrease in heavier hydrocarbon yield.
4.2.2.2 Effect of equivalence ratio
The equivalence ratio is defined as the air to fuel weight ratio used in the gasification
process divided by the air to fuel weight ratio for stoichiometric combustion [Narvaez et al.,
1996]. From the ultimate analysis of Table 4.1, elemental formula of MBM (CH1.7O0.59N0.18)
was derived to set up the oxidation reaction, which was used to calculate the equivalence
ratio: 22 220.1890.51.7 pNO OnH COmO NOCH [Zhu and Venderbosch, 2005]. In

41
Fig. 4.6 Effect of equivalence ratio (ER) on product yield and GHV of gas at first stage final and second stage temperatures of 850 °C and packed bed height of 60 mm (% Difference in replicate run: Char - ±2, Tar - ±2, Gas - ±2)
Fig. 4.7 Effect of equivalence ratio (ER) on gas composition at first stage final and second stage temperatures of 850 °C and packed bed height of 60 mm (% Difference in replicate run: H2 - ±3, CO - ±1, CO2 - ±7, CH4 - ±5, Other H/C - ±4).
10
20
30
40
50
60
0.1 0.15 0.2 0.25 0.3 0.35
Equivalence Ratio
Wei
ght (
%)
10
15
20
Gro
ss H
eatin
g Va
lue
(MJ/
m3)Char
Tar
Gas
GHV
0
10
20
30
40
0.1 0.15 0.2 0.25 0.3 0.35
Equivalence Ratio
Volu
me
(%)
H2
CO
CO2
CH4
C2H4
C2H6
C3H6
C3H8

42
the present work, ER was varied from 0.15 to 0.3 in increments of 0.05, keeping the final
temperature of the first and second stages at 850 °C and the packed bed height in the second
stage at 60 mm. The nitrogen flow rate was varied accordingly to compensate for the
variation in oxygen flow rate and hence keep the total volumetric flow rate of gas entering to
the system constant. The effect of ER on product distribution and gas composition is
presented in Fig. 4.6 and 4.7. It was observed that with increase in ER, char and tar yield
decreased from 20 to 14.2 wt.% and 19.6 to 14.6 wt.% respectively while gas yield increased
from 43.3 to 56.2 wt.%. The gross heating value (GHV) of the gases decreased slightly from
16.6 to 15 MJ/m3. The increase in ER promotes oxidation reactions and deteriorates the
product gas quality. It was observed that H2 content in the product gas reached a maximum
value of 21.2 vol. % at an ER of 0.2 and then dropped to 16.9 vol. % with further increase in
ER. Increase in CO2 content from 16.8 vol. % to 24.4 vol. % can be explained by strong
oxidation reaction. The CH4 and C2H4 content in the product gas were decreased marginally
from 11.6 to 9.4 and 8.9 to 7.3 vol. % respectively. There was no significant changes
observed in case of higher hydrocarbon gases. Similar trends were reported by other
researchers [Manya et al., 2006; Mansaray et al., 1999]. Manya et al. [2006] observed that
with increase in air ratio (ER) from 24 to 35 %, the concentrations of H2, CO, CH4, C2H4,
and C2H6 decreased in air gasification of sewage sludge in a bubbling fluidized bed. Mansary
et al. [1999] observed that as equivalence ratio was increased, the concentration of CO2
increased while the concentration of the flue gases (H2, CO, CH4, C2H2 + C2H4, and C2H6)
decreased.
4.2.2.3 Effect of packed bed height

43
Fig. 4.8 Effect of packed bed height on product yield at first stage final and second stage temperatures of 850 °C, ER of 0.2 and N2 flow rate of 45 ml/min (% Difference in replicate run: Char - ±2, Tar - ±3, Gas - ±2)
Fig. 4.9 Effect of packed bed height on gas compositions and gross heating value at first stage final and second stage temperatures of 850 °C, ER of 0.2 and N2 flow rate of 45 ml/min (% Difference in replicate run: H2 - ±1, CO - ±3, CO2 - ±1, CH4 - ±3, Other H/C - ±1)
0
20
40
60
Char Tar Gas
Wei
ght (
%)
40 mm
60 mm
80 mm
100 mm
0
6
12
18
24
30
36
42
GHV H2 CO CO2 CH4 C2H4 Other H/C
Gro
ss H
eatin
g Va
lue
(MJ/
m3)
& V
olum
e (%
)
40 mm
60 mm
80 mm
100 mm

44
The residence time of the tar can be changed by changing the packed bed height of
cracking stage. Higher residence time is favorable for the thermal cracking of tar, and higher
hydrocarbons, as well as for allowing secondary reactions to take place. In the present work,
the packed bed height in the second reactor was varied from 40 to 100 mm keeping the final
temperature of the first and second stages at 850 °C, ER at 0.2, and N2 flow rate at 45
ml/min. Fig. 4.8 and 4.9 show the product yield and gas compositions as a function of packed
bed height. It can be deduced that an increase in packed bed height decreased tar yield from
18.6 to 14.2 wt.% and increased gas yield from 50.6 to 54.6 wt.%. The H2 content increased
slightly from 18.9 to 22.3 vol. %, while CO content initially decreased from 39.3 to 36.2 vol.
% and then increased up to 40.7 vol. %. There was a little variation observed in the case of
CO2 content. It was almost constant in the range of 19.7 to 19.2 vol. % with increase in
packed bed height from 40 to 100 mm. CH4 yield decreased slightly from 10.7 to 9.8 vol. %
with packed bed height from 40 to 80 mm and then increased little up to 10.3 vol. % at
packed bed height of 100 mm. The yield of C2H4 was almost constant in the range of 7.6 to
7.5 vol. % over the packed bed height from 40 to 100 mm. Other heavier hydrocarbons
(C2H6, C3H6 and C3H8) combined showed opposite trend than CH4. They first increased
slightly from 0.8 to 1.2 vol. % and then decreased to 0.8 vol. % with increase in packed bed
height. An initial increase in heavier hydrocarbons could be because of cracking of tar into
heavier hydrocarbon gases and then decrease of them could be explained by further cracking
into CH4 and H2. Xiao et al. [2007] studied the effect of bed height in air gasification of
polypropylene plastic waste in fluidized bed gasifier. They found that tar and heavier
hydrocarbons yield decreased while gas yield increased with increase in bed height.

45
4.3 Gasification of meat and bone meal using steam
4.3.1 Single stage operation
4.3.1.1 Effect of temperature
The effect of final temperature of the first stage was studied by bypassing the second
stage reactor of Fig. 3.2. In the present work, the final temperature of first stage was varied
from 650 to 850 °C with increments of 50 °C, while maintaining a steam/ MBM (wt. /wt.)
ratio of 0.6 and a N2 flow rate of 45 ml/min. The effect of final temperature of the first stage
on product (char, liquid and gas) yield gas composition is presented in Figs. 4.10 and 4.11.
As expected, char (from 21.7 to 14.1 wt. %) and liquid (tar + water) (from 57.9 to 52.2 wt.
%) yields decreased, whereas gas yield increased (from 8.7 to 18.1 wt. %) with an increase in
temperature from 650 to 850 °C. It was also observed that after 750 °C, gas production was
rapid which shows that gasification reactions become significant after 750 °C. This could be
explained by higher char conversion with steam and thermal cracking/steam reforming of tar
at the higher temperature. Similar trends were obtained by other researchers [Ferdous et al.,
2001; Franco et al., 2003]. Ferdous et al. [2001] found that when the temperature of fixed
bed reactor was increased from 650 to 800 °C, lignin conversion increased from 56 to 69 wt.
% and from 60 to 76 wt. % for Alcell and Kraft lignin, respectively. Franco et al. [2003]
observed an increase in gas yield and decrease in tar and char yield while increasing in
temperature from 700 to 900 °C during steam gasification of forestry biomass in an
atmospheric fluidized bed. The product gas was mainly composed of H2, CO, CO2, CH4 and
other heavier hydrocarbon gases. The H2 and CO yields increased from 42 to 52.2 vol. % and
10.2 to 26.8 vol. % (N2 free basis) respectively while that of CO2 decreased sharply from
25.9 to 12.8 vol. % with increase in temperature from 650 to 850 °C. Increased carbon

46
Fig. 4.10 Effect of final temperature of first stage on product yield (wt. % yield) at steam/MBM (wt. /wt.) of 0.6 and N2 flow rate of 45 ml/min (% Difference in replicate run: Char - ±2, Liquid - ±2, Gas - ±4)
Fig. 4.11 Effect of final temperature of first stage on gas composition (volume % yield (N2 free basis)) at steam/MBM (wt. /wt.) of 0.6 and N2 flow rate of 45 ml/min (% Difference in replicate run: H2 - ±1, CO - ±6, CO2 - ±2, CH4 - ±1, Other H/C - ±3)
0
20
40
60
550 650 750 850
Temperature (°C)
Wei
ght (
%)
0
4
8
12
Gro
ss H
eatin
g Va
lue
(MJ/
m3)
Char
Liquid
Gas
GHV
0
20
40
60
550 650 750 850
Volu
me
(%)
H2
CO
CO2
CH4
C2H4
OtherH/C
Temperature (°C)

47
conversion as well as Boudard reaction, ( COCOC 22 ) are partially responsible for the
observed increase in CO and decrease in CO2 content at higher temperature. CH4 (from 7 to
3.1 vol. %) and other hydrocarbons (from 2.7 to 1 vol. %) showed a marginal decrease with
an increase in temperature. This could be explained by the likelihood of some secondary
reactions with CO2 as well as steam reforming reaction of hydrocarbons to produce CO and
H2. The gross heating value of product gases was almost constant in the range of 11.2 - 11.5
MJ/m3.
4.3.2 Two - stage operation
4.3.2.1 Effect of temperature
The tar product observed above can be removed by increasing in the gas residence
time thus facilitating thermal cracking [Bridgwater, 1995]. Hence, the second reactor stage
was introduced in series to the first stage for further cracking/ reforming of tar and to
increase the H2 yield.
The second stage reactor temperature was varied from 650 to 850 °C with increments
of 50 °C keeping temperature of first stage at 850 °C, steam/ MBM (wt. /wt.) at 0.6, nitrogen
flow rate at 45 ml/min and packed bed height at 60 mm. The effect of temperature of second
stage on product yield and gas composition is presented in Figs. 4.12 and 4.13. The liquid
(tar + water) yield decreased from 39.1 to 32.4 wt. % and gas yield increased from 26.8 to
32.1 wt. % as second stage temperature increased from 650 to 850 °C. After introducing the
second stage, the liquid (tar + water) yield is 37.9 % lower while gas yield is 77.3 % greater
than that obtained using only a single stage reactor system. H2 yield increased from 39.9 to
46.2 vol. % while that of CO and CO2 were almost constant over the range of 23.6 - 23.9 and

48
Fig. 4.12 Effect of second stage temperature on product yield (wt. % yield) at first stage final temperature of 850 °C, steam/MBM (wt. /wt.) of 0.6, N2 flow rate of 45 ml/min and packed bed height of 60 mm (% Difference in replicate run: Char - ±2, Liquid - ±2, Gas - ±1)
Fig. 4.13 Effect of second stage temperature on gas composition (volume % yield (N2 free basis)) at first stage final temperature of 850 °C, steam/MBM (wt. /wt.) of 0.6, N2 flow rate of 45 ml/min and packed bed height of 60 mm (% Difference in replicate run: H2 - ±2, CO - ±5, CO2 - ±4, CH4 - ±6, Other H/C - ±6)
0
20
40
60
550 650 750 850
Temperature (°C)
Wei
ght (
%)
0
5
10
15
20
Gro
ss H
eatin
g Va
lue
(MJ/
m3)Char
Liquid
Gas
GHV
0
20
40
60
550 650 750 850
Volu
me
(%)
H2
CO
CO2
CH4
C2H4
OtherH/C
Temperature (°C)

49
10.5 - 9.8 vol. % respectively. The CH4 yield increased linearly from 7.8 to 14.2 vol. % with
increasing in temperature, while C2H4 increased from 5.1 to 8.2 vol. % up to 800 °C and then
decreased to 5.9 vol. %. Other heavier hydrocarbons decreased sharply after 700 °C. This
phenomenon can be explained by the reforming/cracking of heavier hydrocarbons into light
gases. The gross heating value initially increased up to 18.8 MJ/m3 and then dropped down to
17.5 MJ/m3 with increase in temperature which is consistent with the sharp decrease in
heavier hydrocarbons content.
4.3.2.2 Effect of steam to meat and bone meal ratio
In this set of experiments, the steam/ MBM ratio (wt/ wt) was varied from 0.2 to 0.8
while keeping the final temperature of the first and second stages at 850 °C, N2 flow rate at
45 ml/min, and packed bed height of the second stage at 60 mm. The effect of steam/ MBM
on product yield and gas composition is presented in Figs. 4.14 and 4.15. The char yield
decreased from 27 to 13 wt. % while liquid (tar + water) and gas yields increased from 29.2
to 36.7 and 23.6 to 30 wt. % respectively. H2 increased from 36.2 to 47.1 vol. % while CH4
(23.2 to 14.5 vol. %) and C2H4 (8.7 to 5.3 vol. %) along with other hydrocarbons (0.4 to 0.3
vol. %) decreased gradually with an increase in steam/MBM. The CO increased up to 23.8
vol. % and then dropped slightly to 23.3 vol. %, while CO2 increased slightly to 9.8 vol. %
and then remained constant with further increase in steam/ MBM. The char gasification and
reforming reactions are enhanced with the increase in steam/ MBM, which can be witnessed
from the decrease in char, CH4, and other H/C content. Similar trends were observed by other
researchers [Ferdous et al., 2001; Dalai et al., 2009]. They found that H2 and CO2 increased
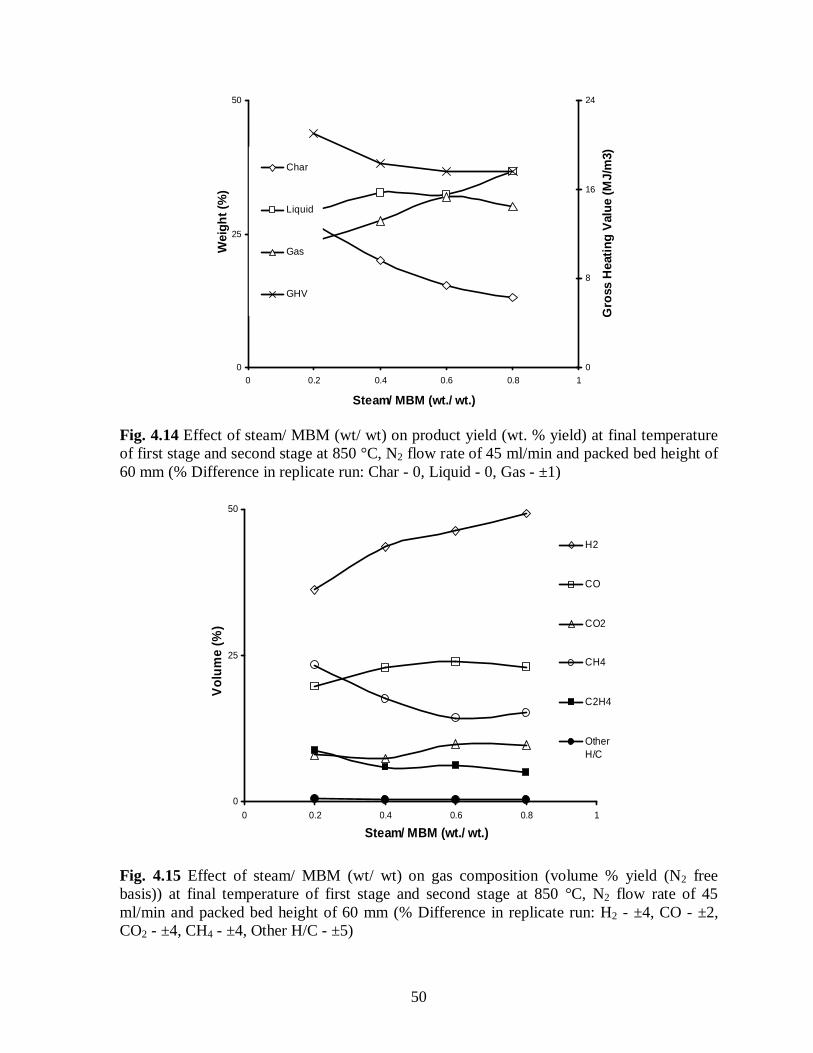
50
Fig. 4.14 Effect of steam/ MBM (wt/ wt) on product yield (wt. % yield) at final temperature of first stage and second stage at 850 °C, N2 flow rate of 45 ml/min and packed bed height of 60 mm (% Difference in replicate run: Char - 0, Liquid - 0, Gas - ±1)
Fig. 4.15 Effect of steam/ MBM (wt/ wt) on gas composition (volume % yield (N2 free basis)) at final temperature of first stage and second stage at 850 °C, N2 flow rate of 45 ml/min and packed bed height of 60 mm (% Difference in replicate run: H2 - ±4, CO - ±2, CO2 - ±4, CH4 - ±4, Other H/C - ±5)
0
25
50
0 0.2 0.4 0.6 0.8 1
Steam/ MBM (wt./ wt.)
Wei
ght (
%)
0
8
16
24
Gro
ss H
eatin
g Va
lue
(MJ/
m3)
Char
Liquid
Gas
GHV
0
25
50
0 0.2 0.4 0.6 0.8 1
Volu
me
(%)
H2
CO
CO2
CH4
C2H4
OtherH/C
Steam/ MBM (wt./ wt.)

51
while that of CH4 and CO decreased with increased in steam flow rate during steam
gasification of lignin and refuse derived fuel in fixed bed reactor system, respectively.
4.3.2.3 Effect of packed bed height
The packed bed height of the second stage was varied from 40-100 mm in increments
of 20 mm by keeping the final temperatures of the first and second stages at 850 °C, N2 flow
rate at 45 ml/min, and steam/MBM (wt/ wt) at 0.8. Figs. 4.16 and 4.17 show the effect of
packed bed height on product yield and gas compositions. The liquid yield decreased from
38.6 to 34.9 wt. % while that of gas increased slightly from 29.5 to 31.6 wt. %. H2 yield
increased from 45 to 48.9 vol. % and CO and CO2 yields shifted up and down in the range of
22.5 - 22.7 and 12.4 - 10.4 vol. % respectively with increased in packed bed height from 40-
100 mm. CH4 showed a slight decrease from 14.5 to 13.3 vol. % while no significant
variation observed in case of other H/C. They were constant in the range of 6.3 - 6.1 vol. %.
These variations could be due to reforming of CH4 and liquid compounds with steam and/ or
CO2 and water gas shift reactions.

52
Fig. 4.16 Effect of packed bed height on product yield (wt. % yield) at steam/ MBM (wt/ wt) of 0.8, final temperature of first stage and second stage at 850 °C, and N2 flow rate of 45 ml/min (% Difference in replicate run: Char - 0, Liquid - ±1, Gas - ±3) Fig. 4.17 Effect of packed bed height on gas composition (volume % yield (N2 free basis)) and gross heating value at steam/ MBM (wt/ wt) of 0.8, final temperature of first stage and second stage at 850 °C, and N2 flow rate of 45 ml/min (% Difference in replicate run: H2 - ±3, CO - ±4, CO2 - ±4, CH4 - ±4, Other H/C - 0)
0
20
40
60
GHV H2 CO CO2 CH4 Other H/C
Gro
ss H
eatin
g Va
lue
(MJ/
m3)
& V
olum
e (%
)
40 mm
60 mm
80 mm
100 mm
0
15
30
45
Char Liq. Gas
Wei
ght (
%)
40 mm
60 mm
80 mm
100 mm

53
4.4 Comparison of phase I and II results 4.4.1 Single - stage operation The comparison of phase I and II results in single stage operation is presented in Fig.
4.18. The operating conditions of phase I were: temperature of 850 °C, equivalence ratio of
0.2, and N2 flow rate of 45 ml/min. The operating conditions of phase II were: temperature of
850 °C, steam/MBM (wt. / wt.) of 0.6, and N2 flow rate of 45 ml/min. It is clear from the
figure that the gas yield was (approximately 41 %) higher than obtained using steam, while
the liquid obtained was (28 %) lower than in the case of using steam. There was a slight
difference observed in case of char yield and GHV of product gases. There appears a huge
difference while comparing the H2 yield. It is way higher than in the case of using oxygen.
The splitting of water molecule during gasification reactions plays a major role contributing
to more H2 in the product gas during steam gasification. CO and CO2 contents were more
during gasification using oxygen than steam, while CH4 and other H/C contents were almost
the same in both the cases.
4.4.2 Two-stage operation The comparison of phase I and II results in two-stage operation is shown in Fig. 4.19.
The operating conditions of phase I were: temperature of both the stages at 850 °C,
equivalence ratio of 0.2, packed bed height of 100 mm, and N2 flow rate of 45 ml/min. The
operating conditions of phase II were: temperature of both the stages at 850 °C, steam/MBM
(wt. / wt.) of 0.8, packed bed height of 100 mm, and N2 flow rate of 45 ml/min. The trends of
comparison for liquid, gas, GHV, H2, CO, and CO2 are same as in the case of single-stage
operation. Liquid (tar + water) was almost double in case of using steam. This is due to the
presence of unreacted steam in the liquid product. Gas yield was higher in the case of

54
Fig. 4.18 Comparison of phase I and II results during single stage operation
Fig. 4.19 Comparison of phase I and II results during two - stage operation
0
10
20
30
40
50
60
Char wt%
Liquid wt%
Gas wt%
GHV ofgases MJ/m3
H2 vol%
CO vol%
CO2 vol%
CH4 vol%
C2+ vol.%
O2
Steam
0
10
20
30
40
50
60
Char wt%
Liquid wt%
Gas wt%
GHV ofgases MJ/m3
H2 vol%
CO vol%
CO2 vol%
CH4 vol%
C2+ vol.%
O2
Steam

55
oxygen gasification, which is due to the large presence of heavier gases such as CO, CO2 and
heavier H/C. The H2 yield was higher in steam gasification which is due to the splitting of
water molecule and enhanced steam reforming reactions in second stage reactor. CH4 content
was slightly higher than gasification using oxygen, while other H/C were lower than in the
case of using oxygen. This proves enhanced reforming reactions using steam as a gasifying
agent.
4.5 Determination of kinetic parameters using distributed activation energy model
4.5.1 Introduction
A simple method for estimating f (E) and k0 in the distributed activation energy model
was developed by Miura and Maki [1998] from his own previous work [Miura, 1995]. The
new method is more accurate to estimate f (E) and k0 because it is a simple procedure and
does not require a tedious differential procedure to calculate d(V/V*)/ dt. This model
assumes that a number of parallel, irreversible and first order reactions with different
activation energies occur simultaneously. All the reaction activation energies have the same
frequency factor, k0, at the same conversion rate. The activation energy has a continuous
distribution. The release of volatiles is given by:
Es
EsdEEfdEEfVV
0)()(1*/ (7)
Where V is the volatile evolved at temperature T, V* is the effective volatile content, f (E) is
a distribution curve of the activation energy that represents the difference in the activation
energies of the many first order irreversible reactions. The k0 corresponds to the E value and
a is the heating rate. Most researchers assume that f (E) has a Gaussian distribution with
mean activation energy E0. In this study, Miura’s method is used to estimate f (E) and k0 of

56
meat and bone meal from three TGA experiments using different heating rates (10, 15, and
25 °C/ min). The calculation for E and k0 is done using following equation [Miura and Maki,
1998].
RTE
ERk
Ta
6075.0)ln()ln( 02 (8)
The procedure used to estimate f (E) and k0 is summarized as follows:
1. Measure V/V* vs. T using at least three different heating rates.
2. Calculate the values of )/ln( 2Ta and 1/T at the same V/V*.
3. Plot )/ln( 2Ta and 1/T at the selected V/V* ratios and then determine the activation
energies E from the slopes and k0 from the intercept.
4. Plot V/V* and E and differentiate the V/V* vs. E relationship by E to obtain f (E).
The following section presents results and discussion of pyrolysis of MBM to determine
the kinetic parameters using a simple method in the distributed activation energy model.
4.5.2 Results and discussion
The weight loss as a function of temperature and time data was obtained for three
different heating rates (10, 15, and 25 °C/ min). The plot of V/V* as a function of
temperature is shown in Fig. 4.20. From this figure it can be seen that conversion of meat and
bone meal increased with increase in temperature. The curve shifts to the higher temperature
with increasing the heating rates. The maximum weight loss occurred between the
temperature range of 500 - 700 K as seen in the Fig. 4.20. It is also observed that after 700
K, the effect of heating rate on weight loss is negligible. Moreover, there is only a marginal
influence of heating rate on the overall weight loss.

57
Fig. 4.21 shows the graph of )/ln( 2Ta and 1/T at the selected V/V* ratios. The
activation energy is determined as the slope of the linear fit of Fig. 4.21. Activation energies
were found to increase with conversion rate as shown in Fig. 4.22. They were in the range of
60 - 246 kJ/mol for the temperature range of 496-758 K. The frequency factors, k0, were
obtained from the intercepts of Fig. 4.21 and were 6.63 x 10³ to 8.7 x 10¹⁴ s-1. Moreover, Fig.
4.23 shows the linear relationship between lnk0 and E. The graph of f (E) vs. E is shown in
Fig. 4.24. It shows that f (E) has a maximum value of 130 kJ/mol approximately. The figure
illustrates an approximate Gaussian distribution. This is also consistent with the work done
by other researchers on coal and biomass [Li et al., 2009; Sonobe and Worasuwannarak,
2008]. Li et al. [2009] used distributed activation energy model to calculate kinetic
parameters for pyrolysis of two coal and corn stalk skins samples. The temperature range was
40 to 900 °C for corn stalk sample while it was 40 to 1200 °C for coal samples. The E value
was found in the range of 100-486 kJ/mol with corresponding k0 of 2.94 x 10⁸ to 4.2 x 1025 s-
1 and 100-462 kJ/mol with corresponding k0 of 4.42 x 10⁵ to 1.71 x 1024 s-1 for Datong
bituminous and Jindongnon lean coal respectively. The values of E and k0 for corn stalk skins
were in the range of 62-169 kJ/mol and 4.9 x 10⁴-3.22 x 10¹¹ s-1 respectively. Sonobe and
Worasuwannarak [2008] used distributed activation energy model to calculate the kinetic
parameters for the pyrolysis of rice straw, rice husk, and corn cob. They found k0 increased
from 1011 to an order of 1018 s-1 where E increased from 120 to 250 kJ/mol for the final
pyrolysis temperature of 900 °C.

58
Fig. 4.20 Effect of temperature on V/V* during pyrolysis of MBM in thermogravimtric analyzer for three different heating rates
Fig. 8 V/V* vs. E relationship
Fig. 4.21 )/ln( 2Ta vs. 1/T at the selected V/V* ratios
0
0.1
0.2
0.3
0.4
0.5
0.6
0.7
0.8
0.9
300 400 500 600 700 800
Temperature (K)
V/V*
10 C/min
15 C/min
25 C/min
-15.5
-15
-14.5
-14
-13.5
-13
0.001 0.0014 0.0018 0.00221/T (k-1)
ln(a
/T2)
V/V*=0.1
V/V*=0.15
V/V*=0.25
V/V*=0.35
V/V*=0.45
V/V*=0.55
V/V*=0.65
V/V*=0.75

59
Fig. 4.22 V/V* vs. E relationship
Fig. 4.23 lnk0 vs. E relationship
0
0.4
0.8
0 100 200 300
E (KJ/mol)
V/V*
R2 = 0.9606
0
20
40
0 100 200 300
E (KJ/mol)
lnk0
(s-1
)

60
Fig. 4.24 f (E) vs. E relationship
0
0.004
0.008
0.012
0 100 200 300
E (KJ/mol)
f(E)

61
Chapter 5
CONCLUSIONS AND RECOMMENDATIONS
5.1 Conclusions
In general, it has been concluded that meat and bone meal (MBM) can be effectively
gasified using pure oxygen and steam as the gasifying agents.
The following conclusions were made regarding gasification of meat and bone meal using
pure oxygen:
1. Higher temperature of 850 °C of both the stages was found to be favorable for higher
hydrogen/syngas production within the temperature range (650 - 850 °C) studied.
2. In comparison to single stage process, two- stage process was proved to be effective
in increasing the H2 yield from 7.3 to 22.3 vol. % and the gas yield from 30.8 to 54.6
wt. %. At the same time, the tar yield was reduced from 40.7 to 14.2 wt. %.
3. The equivalence ratio (ER) of 0.2 was found to be optimal to yield maximum H2
production of 21.2 vol. % at the final temperature of first stage and second stage
temperature of 850 °C, N2 flow rate of 45 ml/min and packed bed height of second
stage at 60 mm.
4. Packed bed height was found to have a least impact. The tar yield decreased slightly
from 18.6 to 14.2 wt. % while gas yield increased from 50.6 to 54.6 wt. % with an
increase in packed bed height of second stage from 40 to 100 mm. There was no
significant variation observed in gas compositions.
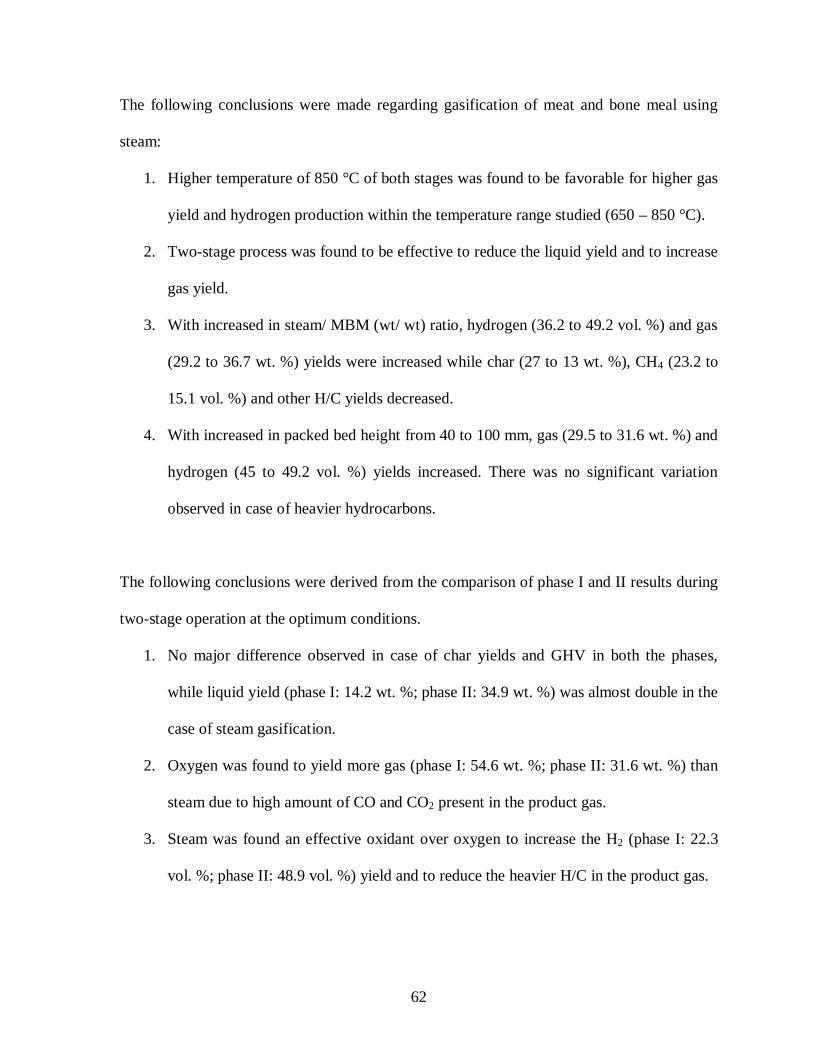
62
The following conclusions were made regarding gasification of meat and bone meal using
steam:
1. Higher temperature of 850 °C of both stages was found to be favorable for higher gas
yield and hydrogen production within the temperature range studied (650 – 850 °C).
2. Two-stage process was found to be effective to reduce the liquid yield and to increase
gas yield.
3. With increased in steam/ MBM (wt/ wt) ratio, hydrogen (36.2 to 49.2 vol. %) and gas
(29.2 to 36.7 wt. %) yields were increased while char (27 to 13 wt. %), CH4 (23.2 to
15.1 vol. %) and other H/C yields decreased.
4. With increased in packed bed height from 40 to 100 mm, gas (29.5 to 31.6 wt. %) and
hydrogen (45 to 49.2 vol. %) yields increased. There was no significant variation
observed in case of heavier hydrocarbons.
The following conclusions were derived from the comparison of phase I and II results during
two-stage operation at the optimum conditions.
1. No major difference observed in case of char yields and GHV in both the phases,
while liquid yield (phase I: 14.2 wt. %; phase II: 34.9 wt. %) was almost double in the
case of steam gasification.
2. Oxygen was found to yield more gas (phase I: 54.6 wt. %; phase II: 31.6 wt. %) than
steam due to high amount of CO and CO2 present in the product gas.
3. Steam was found an effective oxidant over oxygen to increase the H2 (phase I: 22.3
vol. %; phase II: 48.9 vol. %) yield and to reduce the heavier H/C in the product gas.

63
The following conclusions were made regarding the kinetic analysis for pyrolysis of meat
and bone meal:
1. Simple method of distributed activation energy model fitted experimental results of
pyrolysis of meat and bone meal using a thermogravimetric analyzer. Experiments
also showed that f (E) vs. E have an approximate Gaussian distribution.
2. The activation energies were in the range of 60 - 246 kJ/mol for the temperature
range of 496 - 758 K with corresponding frequency factors of 6.63 x 10³ to 8.7 x 10¹⁴
s-1.
5.2 Recommendations
The following important recommendations were made for further studies.
1. In the present work, the range of parameters was carefully chosen based on the
literature review and experimental set up limitations. It is recommended to further
expand the range.
2. Continuous systems such as fluidized bed reactors are always of an industrial interest.
It is recommended to test gasification parameters and pursue detail kinetic modeling
of MBM gasification using a fluidized bed reactor system.
3. Experiments were carried out without statistical design. It is also recommended to
pursue experimental design of the important parameters to optimize the operating
conditions in both continuous and semi-batch systems.
4. All experiments were carried out in non-catalytic systems. Selective catalyst can help
to reduce tar content and enhance reforming reactions. It is advisable to use
commercial or synthesized catalysts in the gasification process.

64
5. Combination of both oxygen and steam has been reported effective in few gasification
processes. It is also an important parameter to consider in future studies.
6. Detail cost estimation and feasibility study of MBM gasification is to be carried out
for industrial applicability.
65
Chapter 6
REFERENCES
Aguado, R., M. Olazar, B. Gaisan, R. Prieto, and J. Bilbao, “Kinetic Study of Polyolefin
Pyrolysis in a Conical Spouted Bed Reactor”, Ind. Eng. Chem. Res. 2002, 41, 4559-4566
Ayllon, M., G. Gea, M.B. Murillo, J.L. Sanchez, and J. Arauzo, “Kinetic study of meat and
bone meal pyrolysis: an evaluation and comparison of different possible kinetic models”,
Journal of Applied Pyrolysis 74 (2005), 445-453.
Ayllon, M., M. Aznar, J.L. Sanchez, G. Gea, and J. Arauzo, “Influence of temperature and
heating rate on the fixed bed pyrolysis of meat and bone meal”, Chemical Engineering
Journal 121 (2006), 85-96.
Bradley R., “Bovine Spongiform Encephalopathy (Bse): The Current Situation and
Research”, Eur Journal of Epidemiology 7 (1991), 532-44.
Bridgwater, A.V., “The technical and economic feasibility of biomass gasification for power
generation”, Fuel 74 (1995), 631-653.
Bruce, M.E., R.G. Will, J.W. Ironside, I. McConnell, D. Drummond, A. Suttie, L. McCardle,
A. Chree, J. Hope, C. Birkett, S.N. Cousens, H. Fraser, and C.J. Bostock, “
Transmissionstomiceindicate that ‘newvariant’ CJD is caused by the BSE agent”, Nature 389
(1997), 498-501.

66
Chaala, A., and C. Roy, “Recycling of Meat and Bone MealAnimal Feed by Vacuum
Pyrolysis”, Environ. Sci. Technol. 37 (2003), 4517-22.
Chalus T. and I. Peutz BSE: the European regulatory context. Euro Surveill. (2000);
5(10):pii=2. Available online:
http://www.eurosurveillance.org/ViewArticle.aspx?ArticleId=2, last accessed on July 31
(2009).
Channiwala, S.A. and P.P. Parikh, “A Unified Correlation for Estimating HHV of solid,
liquid and gaseous fuels”, Fuel 81 (2002), 1051-1063.
Cipriani P., D.P. Filippis, and F.J. Pochetti, “Solid waste gasification: Energy recovery from
polyethylene biomass mixtures” Solid Waste Tech. Mang. 25 (1998), 77-81.
Conesa, J.A., A. Fullana, and R. Font, “Thermal decomposition of meat and bone meal”,
Journal of Anal. Appl. Pyrolysis 70 (2003), 619-630.
Cyr, M. and C. Ludmann, “Low risk meat and bone meal (MBM) bottom ash in mortars as
sand replacement”, Cement and Concrete Research 36 (2006), 469-480.
Dalai, A.K., N. Batta, I. Eswaramoorthi, and G.J. Schoenau, “Gasification of refuse derived
fuel in a fixed bed reactor for syngas production”, Waste Management 29 (2009), 252–258.
67
Della Rocca, P.A., E.G. Cerrella, P.R. Bonelli, and A.L. Cukierman, “Pyrolysis of
hardwoods residues: on kinetics and chars characterization”, Biomass and Bioenergy 16
(1999) 79-88.
Demirbas, M.F., M. Balat, and H. Balat, “Potential contribution of biomass to the sustainable
energy development”, Energy Conversion and Management 50 (2009) 1746–1760.
Devi L., K.J. Ptasinski, F.J.J.G. Janssen, S.V.B. Van Paasen, P.C.A. Bergman, and J.H.A.
Kiel, “Catalytic decomposition of biomass tars: use of dolomite and untreated olivine”,
Renewable Energy 30 (2005), 565-87.
Directorate General for Health and Consumers, “European Commission decides new
measures on BSE: exceptional events call for an exceptional response”, last accessed on July
31 (2009) website: http://ec.europa.eu/dgs/health_consumer/library/press/press90_en.html.
Energy Information Administration (EIA), International Energy Outlook (May, 2009), last
assessed on July 31 (2009) website: http://www.eia.doe.gov/oiaf/ieo/
Fedorowicz, M.E., S.F. Miller, and B.G. Miller, “Biomass Gasification as a Means of
Carcass and Specified Risk Materials Disposal and Energy Production in the Beef Rendering
and Meatpacking Industries”, Energy & Fuels 21 (2007), 3225-32.

68
Ferdous, D., A.K. Dalai, S.K. Bej, and R.W. Thring, “Production of H2 and medium heating
value gas via steam gasification of lignins in fixed-bed reactors”, The Canadian Journal of
Chemical Engineering 79 (2001), 913-922.
Franco, C., F. Pinto, I. Gulyurtlu, and I. Cabrita, “The study of reactions influencing the
biomass steam gasification process”, Fuel 82 (2003), 835-842.
Freeman, E.S. and B. Carroll, “The application of thermoanalytical techniques to reaction
kinetics. The thermogravimetric evaluation of the kinetics of the decomposition of calcium
oxalate monohydrate”, Journal of Physical Chemistry 62 (1958), 394-397.
Fryda, L., K. Panopoulos, P. Vourliotis, E. Pavlidou, and E. Kakaras, “Experimental
investigation of fluidised bed co-combustion of meatand bone meal with coals and olive
bagasse”, Fuel 85 (2006), 1685-99.
Garcia-Ibanez, P., M. Sanchez, and A. Cabanillas, “Thermogravimetric analysis of olive-oil
residue in air atmosphere”, Fuel Processing Technology 87 (2006), 103-107.
Garcia, R.A., K.A. Rosentrater, and R.A. Flores, “Characteristics of North American Meat
and Bone Meal Relevant To the Development of Non-Feed Applications”, American Society
of Agricultural and Biological Engineers”, 22(5) (2006), 729-736.

69
Gulyurtlu, I., D. Boavida, P. Abelha, M.H. Lopes, and I. Cabrita, “Co-combustion of coal
and meat and bone meal”, Fuel 84 (2005), 2137-2148.
Han, J. and H. Kim, “The reduction and control technology of tar during biomass
gasification/ pyrolysis: An overview”, Renewable and Sustainable Energy Reviews (2006),
doi:10.1016/j.rser.2006.07.015
Higman, C. and M. Van der Burgt, “Gasification, second edition”, Gulf Professional
Publishing (2008).
Li, Z., C. Liu, Z. Chen, J. Qian, W. Zhao, and Q. Zhu, “Analysis of coals and biomass
pyrolysis using the distributed activation energy model”, Bioresource Technology, 100
(2009), 948-952.
Lv, P.M., Z.H. Xiong, J. Chang, C.Z. Wu, Y. Chen, and J.X. Zhu, “An experimental study on
biomass air–steam gasification in a fluidized bed”, Bioresource Technology 95 (2004), 95-
101.
Mansaray, K.G., A.E. Ghaly, A.M. Al-Taweel, F. Hamdullahpur, and V.I. Ugursal, “Air
gasification of rice husk in a dual distributor type fluidized bed gasifier”, Biomass and
Bioenergy 17 (1999), 315-332.
Mansaray, K.G. and A.E. Ghaly, “Determination of kinetic parameters of rice husks in
oxygen using thermogravimetric analysis”, Biomass and Bioenergy 17 (1999), 19-31.

70
Manya, J.J., J.L. Sa´nchez, J. Abrego, A. Gonzalo, and J. Arauzo, “Influence of gas residence
time and air ratio on the air gasification of dried sewage sludge in a bubbling fluidised bed”,
Fuel 85 (2006), 2027–2033.
Miura, K., “A New and Simple Method to Estimate f (E) and k0 (E) in the Distributed
Activation Energy Model from Three Sets of Experimental Data”, Energy & Fuels 9 (1995),
302-307.
Miura, K. and T. Maki, “A Simple Method for Estimating f (E) and k0 (E) in the Distributed
Activation Energy Model”, Energy & Fuels 12 (1998), 864-869.
Narvaez, I., A. Orio, M.P. Aznar, and J. Corella, “Biomass Gasification with Air in an
Atmospheric Bubbling Fluidized Bed. Effect of Six Operational Variables on the Quality of
the Produced Raw Gas”, Ind. Eng. Chem. Res. 35 (1996), 2110-2120.
Perry, H.R. and D.W. Green, “Perry’s Chemical Engineering Handbook, 7th Edition”,
McGraw Hill (1997).
Pilawska, M., J. Baron, W. Zukowski, and S. Kandefer, “The Use of AB FBC for the
Utilization of Raw Animal Wastes”, The Seventh Asia-Pacific International Symposium on
Combustion and Energy Utilization, Hong Kong SAR, proceedings 15-17 December 2004.
Rodehutscord M., H.J. Abel, W. Friedt, C. Wenk, G. Flachowsky, H.J. Ahlgrimm, B. Johnke
, R. Kuhl, and G. Breves, “Review article consequences of the ban of by-products from

71
terrestrial animals in livestock feeding in Germany and the European Union: Alternatives,
nutrient and energy cycles, plant production, and economic aspects”, Arch. Anim. Nutr. 56
(2002) 67-91.
Skytte, K., P. Meibom, and T.C. Henriksen, “Electricity from biomass in the European
union—with or without biomass import”, Biomass and Bioenergy 30 (2006) 385–392.
Sonobe, T. and N. Worasuwannarak, “Kinetic analyses of biomass pyrolysis using the
distributed activation energy model”, Fuel 87 (2008), 414-421.
Taylor, D.M., K. Fernie, and I. McConnell, “Inactivation of the 22A strain of scrapie agent
by autoclaving in sodium hydroxide“, Veterinary Microbiology 58 (1997), 87-91.
Timilsina, G.R., “Atmospheric stabilization of CO2 emissions: Near-term reductions and
absolute versus intensity-based targets”, Energy Policy 36 (2008) 1927–1936.
Wei, L., S. Xu, L. Zhang, C. Liu, H. Zhu, and S. Liu, “Steam gasification of biomass for
hydrogen-rich gas in a free-fall reactor”, International Journal of Hydrogen Energy 32
(2007), 24-31.
Wrobel, J and P. Wright, “Calorific values and Relative densities, Calculations from
Composition”, Technical Monograph Series Communication 1080 (1978).

72
Xiao, R., B. Jin, H. Zhou, Z. Zhong, and M. Zhang, “Air gasification of polypropylene
plastic waste in fluidized bed gasifier”, Energy Conversion and Management 48 (2007), 778-
786.
Zhu, X. and R. Venderbosch, “A correlation between stoichiometrical ratio of fuel and its
higher heating value”, Fuel 84 (2005) 1007–1010.
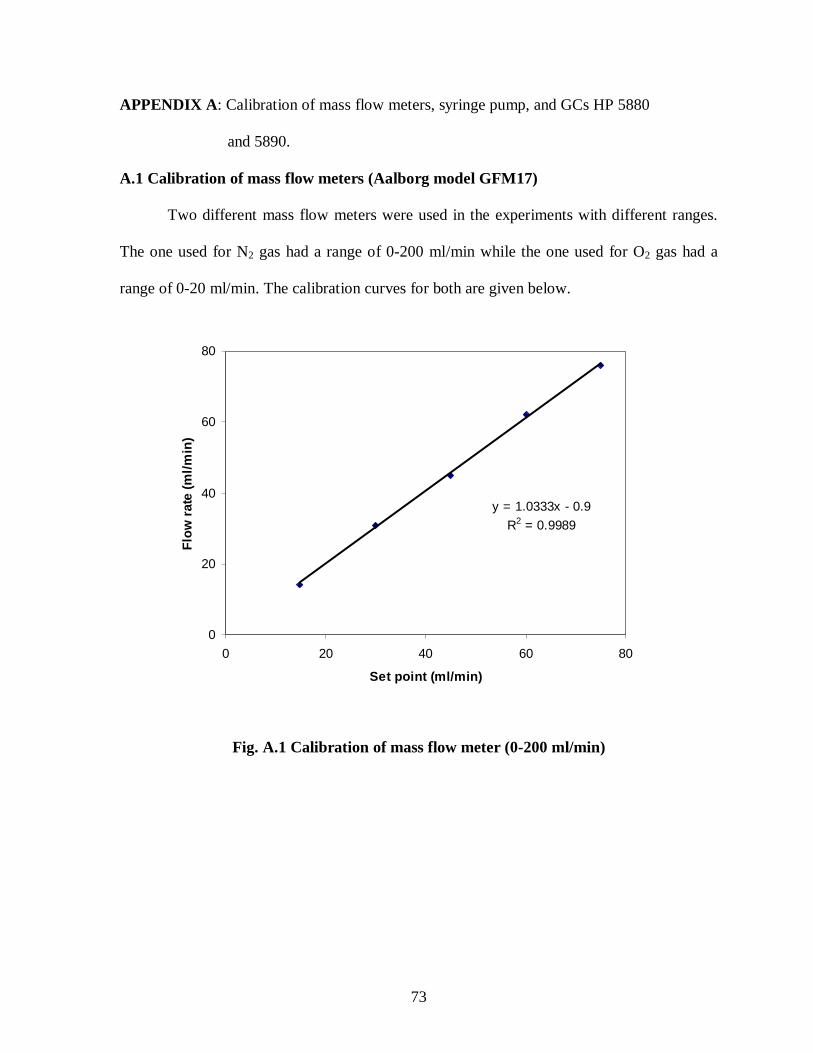
73
APPENDIX A: Calibration of mass flow meters, syringe pump, and GCs HP 5880
and 5890. A.1 Calibration of mass flow meters (Aalborg model GFM17)
Two different mass flow meters were used in the experiments with different ranges.
The one used for N2 gas had a range of 0-200 ml/min while the one used for O2 gas had a
range of 0-20 ml/min. The calibration curves for both are given below.
Fig. A.1 Calibration of mass flow meter (0-200 ml/min)
y = 1.0333x - 0.9R2 = 0.9989
0
20
40
60
80
0 20 40 60 80
Set point (ml/min)
Flow
rate
(ml/m
in)

74
Fig. A.2 Calibration of mass flow meter (0-20 ml/min) A.2 Calibration of syringe pump (Kent Scientific, Genie Plus Model, USA) Fig. A.3 Calibration of mass flow meter
y = 1.025x + 0.5R2 = 0.9917
0
5
10
15
20
0 5 10 15 20
Set point (ml/min)
Flow
rate
(ml/m
in)
y = 0.9975xR2 = 0.9999
0
500
1000
1500
2000
2500
3000
0 500 1000 1500 2000 2500 3000
Set point (µl/hr)
Flow
rate
(µl/h
r)

75
A.3 Calibration of GCs HP 5880 and 5890 The calibration of GCs HP 5880 and 5890 was carried out using standard gas
mixtures. The information related to GCs program is already explained in detail in section
3.3.
Fig. A.4 Calibration curve of H2
Fig. A.5 Calibration curve of CO
y = -4E-12x2 + 3E-06xR2 = 0.9999
0
0.05
0.1
0.15
0.2
0.25
0 20000 40000 60000 80000 100000 120000
Peak area
Volu
me
inje
cted
, ml
y = 4E-08xR2 = 0.9942
0
0.0002
0.0004
0.0006
0.0008
0.001
0.0012
0 5000 10000 15000 20000 25000
Peak area
Vol.
inje
cted
, ml

76
Fig. A.6 Calibration curve of CO2
Fig. A.7 Calibration curve of CH4
y = 5E-15x2 + 3E-08xR2 = 0.9997
0
0.01
0.02
0.03
0.04
0.05
0.06
0.07
0.08
0 500000 1000000 1500000 2000000
Peak area
Vol.
inje
cted
, ml
y = 4E-13x2 + 1E-07xR2 = 0.9997
0
0.002
0.004
0.006
0.008
0.01
0.012
0 20000 40000 60000 80000
Peak area
Vol
. inj
ecte
d, m
l

77
Fig. A.8 Calibration curve of C2H4
Fig. A.3.3 Calibration curve of CH4
Fig. A.9 Calibration curve of C2H6
y = 8E-08xR2 = 0.9861
0
0.001
0.002
0.003
0.004
0 10000 20000 30000 40000 50000
Peak area
Vol.
inje
cted
, ml
y = 8E-08xR2 = 0.9878
0
0.001
0.002
0.003
0.004
0.005
0 20000 40000 60000
Peak area
Vol
. inj
ecte
d, m
l

78
Fig. A.10 Calibration curve of C3H6
Fig. A.11 Calibration curve of C3H8
y = 6E-08xR2 = 0.9866
0
0.001
0.002
0.003
0.004
0.005
0 20000 40000 60000 80000
Peak area
Vol.
inje
cted
, ml
y = 5E-08xR2 = 0.9881
0
0.0005
0.001
0.0015
0.002
0.0025
0.003
0 20000 40000 60000
Peak area
Vol
. inj
ecte
d, m
l
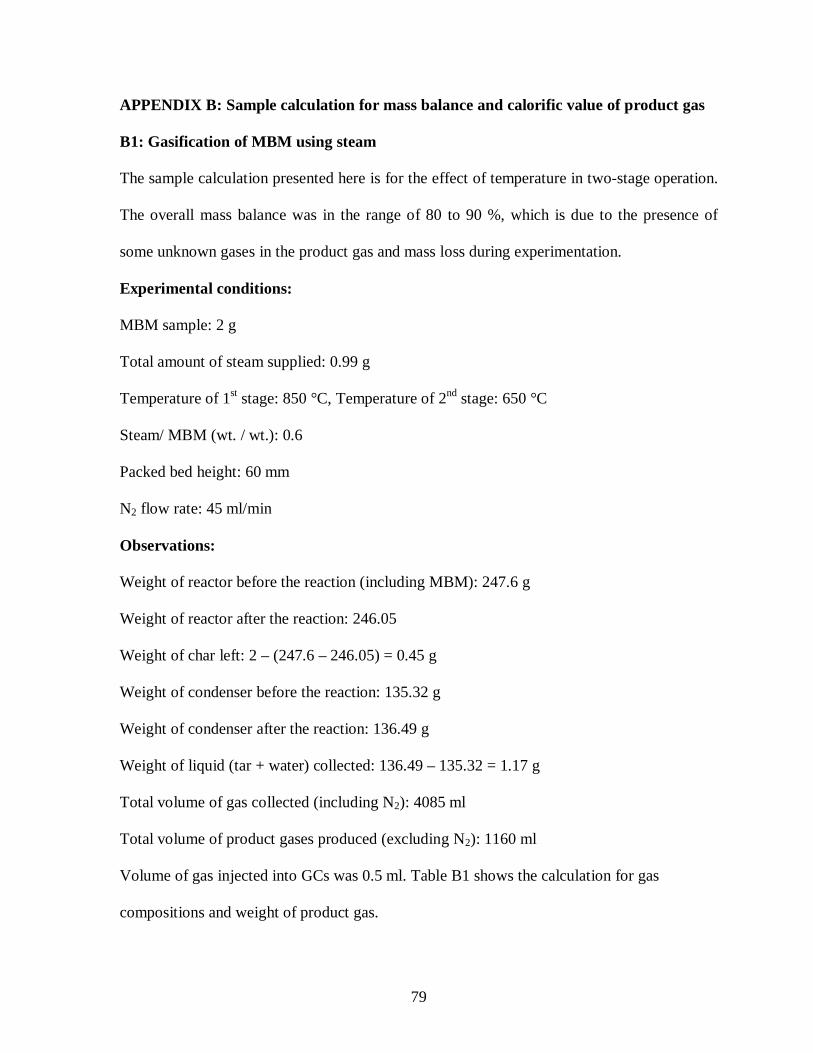
79
APPENDIX B: Sample calculation for mass balance and calorific value of product gas
B1: Gasification of MBM using steam
The sample calculation presented here is for the effect of temperature in two-stage operation.
The overall mass balance was in the range of 80 to 90 %, which is due to the presence of
some unknown gases in the product gas and mass loss during experimentation.
Experimental conditions:
MBM sample: 2 g
Total amount of steam supplied: 0.99 g
Temperature of 1st stage: 850 °C, Temperature of 2nd stage: 650 °C
Steam/ MBM (wt. / wt.): 0.6
Packed bed height: 60 mm
N2 flow rate: 45 ml/min
Observations:
Weight of reactor before the reaction (including MBM): 247.6 g
Weight of reactor after the reaction: 246.05
Weight of char left: 2 – (247.6 – 246.05) = 0.45 g
Weight of condenser before the reaction: 135.32 g
Weight of condenser after the reaction: 136.49 g
Weight of liquid (tar + water) collected: 136.49 – 135.32 = 1.17 g
Total volume of gas collected (including N2): 4085 ml
Total volume of product gases produced (excluding N2): 1160 ml
Volume of gas injected into GCs was 0.5 ml. Table B1 shows the calculation for gas
compositions and weight of product gas.

Table B1 Calculation for gas compositions and weight of product gas
Component Peak area Vol. in injected
sample (0.5 ml)
ml
Total vol. in
gas collected
ml
Total moles in
gas collected
gmole
Weight
g
H2 19402 0.0567 463 0.019 0.039
CO 837408 0.033 273 0 .012 0.32
CO2 461105 0.014 121 0.005 0.23
CH4 66975.5 0.011 90 0.0035 0.056
C2H4 88250 0.0071 58 0.0025 0.07
C2H6 21115.5 0.002 16.3 0.0007 0.021
C3H6 55382 0.0033 27.2 0.0011 0.0462
C3H8 5350 0.0003 2.5 0.0001 0.0044
Total vol. =
1051 ml
Total gas wt.
= 0.8 g
= 26.8 wt. %
Feed: MBM = 2 g Steam = 0.99 g
Char = 0.45 g = 15.1 wt. %
Liquid (tar + water) = 1.17 g = 39.1 wt. %
80

81
B2: Calculation for finding the calorific value of product gas: Calorific value of the product gas was calculated at 15 °C temperature and
atmospheric .pressure. The ideal gas calorific value is given by [Wrobel and Wirght, 1978]
CV = x1*CV1 + x2*CV2 + …. + xn*CVn
Where, x1, x2… represent vol. fractions and CV1, CV2, ….represent calorific values of ideal
gases. The sample calculation to calculate calorific value of product gas is shown in Table
B2.
Table B2 Calculation for calorific value of product gas
Component
Calorific value at 15 °C and atm. Pressure
MJ/m3
Total volume in product gas
ml
Volume % (Based on actual vol. collected)
Calorific value MJ/m3
H2 12.1 463 39.9 4.82
CO 11.97 273 23.5 2.81
CH4 37.71 90 7.8 3.0
C2H4 59.72 58 5.0 3.0
C2H6 66.07 16.3 1.4 0.93
C3H6 87.09 27.2 2.3 2.0
C3H8 93.94 2.5 0.23 0.22
Total 16.8

Appendix C: Experimental results with replicate runs Phase I: Gasification of MBM using oxygen in single stage and two-stage operations
Table C1 Effect of temperature during single-stage operation T1: Temperature of 1st reactor
0.340.190.680.223.119.6447.18.427.742.318.68000.532
0.330.180.660.253.120.551.67.39.330.840.717.88500.532
0.370.20.750.213.424.236.577.625.343.520.67500.532
0.490.260.980.294.437.622.56.26.622.144.722.17000.532
0.520.281.10.314.855105.55.322.14722.96500.532
C3H8vol.%
C3H6vol.%
C2H6vol.%
C2H4vol.%
CH4vol.%
CO2vol.%
CO vol.%
H2vol.%
Calorific value of product
gas MJ/m3
Gas wt. %
Tar wt. %
Char wt. %
T1°C
O2g
MBM g
2.61.55.31.624150341547750.71.070.47
2.51.385.21.9424157400567750.781.030.45
2.51.45.21.4724168257507050.641.10.52
2.61.45.31.624196142365650.561.130.56
2.51.35.31.522.926148.226.74840.561.190.58
C3H8ml
C3H6ml
C2H6ml
C2H4ml
CH4ml
CO2ml
CO ml
H2ml
Product gas
volume ml
Gas g
Tar g
Char g
2.61.55.31.624150341547750.71.070.47
2.51.385.21.9424157400567750.781.030.45
2.51.45.21.4724168257507050.641.10.52
2.61.45.31.624196142365650.561.130.56
2.51.35.31.522.926148.226.74840.561.190.58
C3H8ml
C3H6ml
C2H6ml
C2H4ml
CH4ml
CO2ml
CO ml
H2ml
Product gas
volume ml
Gas g
Tar g
Char g
82

Table C2 Effect of temperature during two-stage operation T2: Temperature of 2nd reactor
0.020.70.78.311.62036.11416.450.21917.48508000.532
0.0080.410.527.710.219.736.221.216.152.217.417.88508500.532
0.122.041.198.710.6820.738.59.917.744.722.117.88507500.532
0.252.761.57.89.4423.840.48.817.843.124.917.48507000.532
0.242.91.58.39.462141.67.418.142.326.517.88506500.532
C3H8vol.%
C3H6vol.%
C2H6vol.%
C2H4vol.%
CH4vol.%
CO2vol.%
CO vol.%
H2vol.%
Calorific value of product
gas MJ/m3
Gas wt. %
Tar wt. %
Char wt. %
T1°C
T2°C
O2g
MBM g
0.218.88.8108.5148.4258.3468.6181.413001.270.480.44
C3H8ml
C3H6ml
C2H6ml
C2H4ml
CH4ml
CO2ml
CO ml
H2ml
Product gas
volume ml
Gas g
Tar g
Char g
0.15.67.2106.5137.7263.9500.8292.613801.30.440.45
1.321.512.793.5112.9221413.5106.710751.20.560.45
2.426.214.777.392.2230393869801.090.630.45
2.32814.881.491.5202.440972.39841.060.670.45
83

Table C3 Effect of equivalence ration in two-stage operation
0.010.450.557.569.922.137.418.815.7554.716.116.18508500.250.672
0.010.460.517.269.424.436.516.915.0456.214.614.28508500.30.812
0.0080.410.527.710.219.736.221.216.0552.217.417.88508500.20.532
0.010.550.618.911.616.832.917.316.6143.319.6208508500.150.42
C3H8vol.%
C3H6vol.%
C2H6vol.%
C2H4vol.%
CH4vol.%
CO2vol.%
CO vol.%
H2vol.%
Calorific value of product
gas MJ/m3
Gas wt. %
Tar wt. %
Char wt. %
T1°C
T2°CERO2
gMBM
g
C3H8ml
C3H6ml
C2H6ml
C2H4ml
CH4ml
CO2ml
CO ml
H2ml
Product gas
volume ml
Gas g
Tar g
Char g
0.136.97.911114136256025915351.560.410.4
0.136.47.810814030953927114441.460.430.43
0.15.67.2106.5137.7263.9500.8292.613801.320.440.45
0.126.37.110413319138420211691.040.470.48
C3H8ml
C3H6ml
C2H6ml
C2H4ml
CH4ml
CO2ml
CO ml
H2ml
Product gas
volume ml
Gas g
Tar g
Char g
0.136.97.911114136256025915351.560.410.4
0.136.47.810814030953927114441.460.430.43
0.15.67.2106.5137.7263.9500.8292.613801.320.440.45
0.126.37.110413319138420211691.040.470.48
84

Table C4 Effect of packed bed height during two-stage operation
0.8257.4710.319.240.722.316.5454.614.217.48508501000.532
1.1947.699.819.637.621.716.335216.617.8850850800.532
0.9387.710.219.736.221.216.0552.117.417.8850850600.532
0.8357.5910.719.739.318.916.1750.618.617.4850850400.532
C2+Vol. %
C2H4vol.%
CH4vol.%
CO2vol.%
CO vol.%
H2vol.%
Calorific value of product
gas MJ/m3
Gas wt. %
Tar wt. %
Char wt. %
T1°C
T2°C
Packing height
mm
O2g
MBM g
16103.8130.3257.850829213501.30.420.45
11.6103.8141.2259.7565.2309.313901.370.360.44
12.9106.5137.7263.9500.8292.613801.320.440.45
10.898.613624951024513001.270.470.44
C2+ml
C2H4ml
CH4ml
CO2ml
CO ml
H2ml
Product gas volume
ml
Gas g
Tar g
Char g
16103.8130.3257.850829213501.30.420.45
11.6103.8141.2259.7565.2309.313901.370.360.44
12.9106.5137.7263.9500.8292.613801.320.440.45
10.898.613624951024513001.270.470.44
C2+ml
C2H4ml
CH4ml
CO2ml
CO ml
H2ml
Product gas volume
ml
Gas g
Tar g
Char g
85

Table C5 Replicate runs of Phase I
Effect of temperature during single stage operation
Effect of temperature during two-stage operation
C3H8vol.%
C3H6vol.%
C2H6vol.%
C2H4vol.%
CH4vol.%
CO2vol.%
CO vol.%
H2vol.%
Calorific value of product
gas MJ/m3
Gas wt. %
Tar wt. %
Char wt. %
T1°C
O2g
MBM g
0.330.180.650.3319.153.479.43239.917.48500.532
C3H8vol.%
C3H6vol.%
C2H6vol.%
C2H4vol.%
CH4vol.%
CO2vol.%
CO vol.%
H2vol.%
Calorific value of product
gas MJ/m3
Gas wt. %
Tar wt. %
Char wt. %
T1°C
O2g
MBM g
0.330.180.650.3319.153.479.43239.917.48500.532
C3H8ml
C3H6ml
C2H6ml
C2H4ml
CH4ml
CO2ml
CO ml
H2ml
Product gas
volume ml
Gas g
Tar g
Char g
2.61.55.32.52415443155.58080.811.010.44
C3H8ml
C3H6ml
C2H6ml
C2H4ml
CH4ml
CO2ml
CO ml
H2ml
Product gas
volume ml
Gas g
Tar g
Char g
2.61.55.32.52415443155.58080.811.010.44
0.0040.30.47.610.718.136.720.616.153.417.817.48508500.532
C3H8vol.%
C3H6vol.%
C2H6vol.%
C2H4vol.%
CH4vol.%
CO2vol.%
CO vol.%
H2vol.%
Calorific value
of product gas
MJ/m3
Gas wt. %
Tar wt. %
Char wt. %
T1°CT2 °CO2 gMBM
g
0.0040.30.47.610.718.136.720.616.153.417.817.48508500.532
C3H8vol.%
C3H6vol.%
C2H6vol.%
C2H4vol.%
CH4vol.%
CO2vol.%
CO vol.%
H2vol.%
Calorific value
of product gas
MJ/m3
Gas wt. %
Tar wt. %
Char wt. %
T1°CT2 °CO2 gMBM
g
0.0064.25.711015426352829714501.350.450.44
C3H8ml
C3H6ml
C2H6ml
C2H4ml
CH4ml
CO2ml
CO ml
H2ml
Product gas volum
e ml
Gas g
Tar g
Char g
0.0064.25.711015426352829714501.350.450.44
C3H8ml
C3H6ml
C2H6ml
C2H4ml
CH4ml
CO2ml
CO ml
H2ml
Product gas volum
e ml
Gas g
Tar g
Char g
86

Effect of equivalence ratio during two-stage operation
Effect of packed bed height during two-stage operation
C3H8vol.%
C3H6vol.%
C2H6vol.%
C2H4vol.%
CH4vol.%
CO2vol.%
CO vol.%
H2vol.%
Calorific value of product
gas MJ/m3
Gas wt. %
Tar wt. %
Char wt. %
T1°C
T2°CERO2
gMBM
g
0.0040.30.47.610.718.136.720.616.153.417.817.48508500.20.532
C3H8vol.%
C3H6vol.%
C2H6vol.%
C2H4vol.%
CH4vol.%
CO2vol.%
CO vol.%
H2vol.%
Calorific value of product
gas MJ/m3
Gas wt. %
Tar wt. %
Char wt. %
T1°C
T2°CERO2
gMBM
g
0.0040.30.47.610.718.136.720.616.153.417.817.48508500.20.532
0.0064.25.711015426352829714501.350.450.44
C3H8ml
C3H6ml
C2H6ml
C2H4ml
CH4ml
CO2ml
CO ml
H2ml
Product gas
volume ml
Gas g
Tar g
Char g
0.0064.25.711015426352829714501.350.450.44
C3H8ml
C3H6ml
C2H6ml
C2H4ml
CH4ml
CO2ml
CO ml
H2ml
Product gas
volume ml
Gas g
Tar g
Char g
0.857.31019.339.422.416.255.314.617.88508501000.532
C2+Vol. %
C2H4vol.%
CH4vol.%
CO2vol.%
CO vol.%
H2vol.%
Calorific value of
product gas MJ/m3
Gas wt. %
Tar wt. %
Char wt. %
T1°C
T2°C
Packing height
mm
O2g
MBM g
0.857.31019.339.422.416.255.314.617.88508501000.532
C2+Vol. %
C2H4vol.%
CH4vol.%
CO2vol.%
CO vol.%
H2vol.%
Calorific value of
product gas MJ/m3
Gas wt. %
Tar wt. %
Char wt. %
T1°C
T2°C
Packing height
mm
O2g
MBM g
1210314327456031714201.40.370.45
C2+ml
C2H4ml
CH4ml
CO2ml
CO ml
H2ml
Product gas
volume ml
Gas gTar g
Char g
1210314327456031714201.40.370.45
C2+ml
C2H4ml
CH4ml
CO2ml
CO ml
H2ml
Product gas
volume ml
Gas gTar g
Char g
87

Phase II: Gasification of MBM using steam in single stage and two-stage operations
Table C6 Effect of temperature during single stage operation T1: Temperature of 1st reactor
1.060.173.2114.421.550.410.715.153.915.48000.992
1.020.163.1212.826.852.211.518.152.214.18500.992
1.590.34.517.119.746.91110.454.517.737500.992
1.920.3520.614.245.710.749.755.518.77000.992
2.650.42725.910.24211.248.757.921.76500.992
C2+vol.%
C2H4vol.%
CH4vol.%
CO2vol.%
CO vol.%
H2vol.%
Calorific value of product
gas MJ/m3
Gas wt. %
Liquid wt. %
Char wt. %
T1°C
Steamg
MBM g
9.31.524.690.835.51473500.261.730.65
8.21.32290.5622014400.291.660.56
7.61.22182942254800.311.630.53
8.21.3261082264408440.541.560.42
8.21.3251131683957850.471.610.46
C2+ml
C2H4ml
CH4ml
CO2ml
CO ml
H2ml
Product gas
volume ml
Gas g
Liquid g
Char g
9.31.524.690.835.51473500.261.730.65
8.21.32290.5622014400.291.660.56
7.61.22182942254800.311.630.53
8.21.3261082264408440.541.560.42
8.21.3251131683957850.471.610.46
C2+ml
C2H4ml
CH4ml
CO2ml
CO ml
H2ml
Product gas
volume ml
Gas g
Liquid g
Char g
88

Table C7 Effect of temperature during two-stage operation T2: Temperature of 2nd reactor
C2+ml
C2H4ml
CH4ml
CO2ml
CO ml
H2ml
Product gas
volume ml
Gas g
Liquid g
Char g
46589012127346311600.81.170.45
42.49011911128044811750.831.150.46
20.210415012430452213150.891.060.46
4.185.5200.7139337.865514200.960.970.46
11.411117013032655813670.9410.46
C2+ml
C2H4ml
CH4ml
CO2ml
CO ml
H2ml
Product gas
volume ml
Gas g
Liquid g
Char g
46589012127346311600.81.170.45
42.49011911128044811750.831.150.46
20.210415012430452213150.891.060.46
4.185.5200.7139337.865514200.960.970.46
11.411117013032655813670.9410.46
C2+vol.%
C2H4vol.%
CH4vol.%
CO2vol.%
CO vol.%
H2vol.%
Calorific value of product
gas MJ/m3
Gas wt. %
Liquid wt. %
Char wt. %
T1°C
T2°C
Steamg
MBM g
0.8378.1512.59.523.840.81831.433.415.48508000.992
0.295.914.29.823.946.217.532.132.415.48508500.992
1.6027.911.49.523.139.717.8329.835.515.48507500.992
3.637.710.29.523.938.218.827.838.515.48507000.992
4.25.17.810.523.639.916.826.839.115.18506500.992
89

Table C8 Effect of steam/MBM during two-stage operation
4.185.5200.7139337.865514200.960.970.46
4.480.6220.3137.735271015100.991.220.43
365.9201.682.8261.650011450.730.870.53
3.371.118963.3159.52958150.550.680.63
C2+ml
C2H4ml
CH4ml
CO2ml
CO ml
H2ml
Product gas
volume ml
Gas g
Liquid g
Char g
4.185.5200.7139337.865514200.960.970.46
4.480.6220.3137.735271015100.991.220.43
365.9201.682.8261.650011450.730.870.53
3.371.118963.3159.52958150.550.680.63
C2+ml
C2H4ml
CH4ml
CO2ml
CO ml
H2ml
Product gas
volume ml
Gas g
Liquid g
Char g
0.296.114.29.823.846.217.631.932.415.48508500.60.992
0.285.314.59.223.347.117.63036.7138508500.81.322
0.285.817.67.322.843.618.327.432.719.98508500.40.662
0.428.723.27.919.636.22123.629.2278508500.20.332
C2+vol.%
C2H4vol.%
CH4vol.%
CO2vol.%
CO vol.%
H2vol.%
Calorific value of product
gas MJ/m3
Gas wt. %
Liquid wt. %
Char wt. %
T1°C
T2°CS/BSteam
gMBM
g
90

Table C9 Effect of packed bed height during two-stage operation
613.510.62248.217.230.135.61385085080322
6.113.310.422.748.917.431.634.9138508501001.322
5.5814.59.223.347.117.63036.713850850601.322
6.314.512.422.54517.429.538.613850850401.322
C2+vol.%
CH4vol.%
CO2vol.%
CO vol.%
H2vol.%
Calorific value of product
gas MJ/m3
Gas wt. %
Liquid wt. %
Char wt. %
T1°C
T2°C
Packing height
mm
Steam g
MBM g
93.4210.7164.9342.3749.5155511.180.43
96.7209.5163.2357.1769.715751.051.160.43
85220137.735271015100.991.220.43
87.6202172.4313.9628.813950.981.280.43
C2+ ml
CH4ml
CO2ml
CO ml
H2ml
Product gas
volume ml
Gas g
Liquid g
Char g
93.4210.7164.9342.3749.5155511.180.43
96.7209.5163.2357.1769.715751.051.160.43
85220137.735271015100.991.220.43
87.6202172.4313.9628.813950.981.280.43
C2+ ml
CH4ml
CO2ml
CO ml
H2ml
Product gas
volume ml
Gas g
Liquid g
Char g
91

Table C10 Replicate runs of Phase II
Effect of temperature during single stage operation
Effect of temperature during two-stage operation
C2+vol.%
C2H4vol.%
CH4vol.%
CO2vol.%
CO vol.%
H2vol.%
Calorific value of product
gas MJ/m3
Gas wt. %
Liquid wt. %
Char wt. %
T1°C
Steamg
MBM g
0.950.23.112.625.152.811.418.751.214.388500.992
C2+vol.%
C2H4vol.%
CH4vol.%
CO2vol.%
CO vol.%
H2vol.%
Calorific value of product
gas MJ/m3
Gas wt. %
Liquid wt. %
Char wt. %
T1°C
Steamg
MBM g
0.950.23.112.625.152.811.418.751.214.388500.992
8.81.829116.5231.74879230.571.530.43
C2+ml
C2H4ml
CH4ml
CO2ml
CO ml
H2ml
Product gas
volume ml
Gas g
Liquid g
Char g
8.81.829116.5231.74879230.571.530.43
C2+ml
C2H4ml
CH4ml
CO2ml
CO ml
H2ml
Product gas
volume ml
Gas g
Liquid g
Char g
C2+vol.%
C2H4vol.%
CH4vol.%
CO2vol.%
CO vol.%
H2vol.%
Calorific value of product
gas MJ/m3
Gas wt. %
Liquid wt. %
Char wt. %
T1°C
T2°C
Steamg
MBM g
0.255.4159.422.747.117.531.833.115.18508500.992
C2+vol.%
C2H4vol.%
CH4vol.%
CO2vol.%
CO vol.%
H2vol.%
Calorific value of product
gas MJ/m3
Gas wt. %
Liquid wt. %
Char wt. %
T1°C
T2°C
Steamg
MBM g
0.255.4159.422.747.117.531.833.115.18508500.992
C2+ml
C2H4ml
CH4ml
CO2ml
CO ml
H2ml
Product gas
volume ml
Gas g
Liquid g
Char g
3.678.5217.8136.532968414500.950.990.45
C2+ml
C2H4ml
CH4ml
CO2ml
CO ml
H2ml
Product gas
volume ml
Gas g
Liquid g
Char g
3.678.5217.8136.532968414500.950.990.45
92
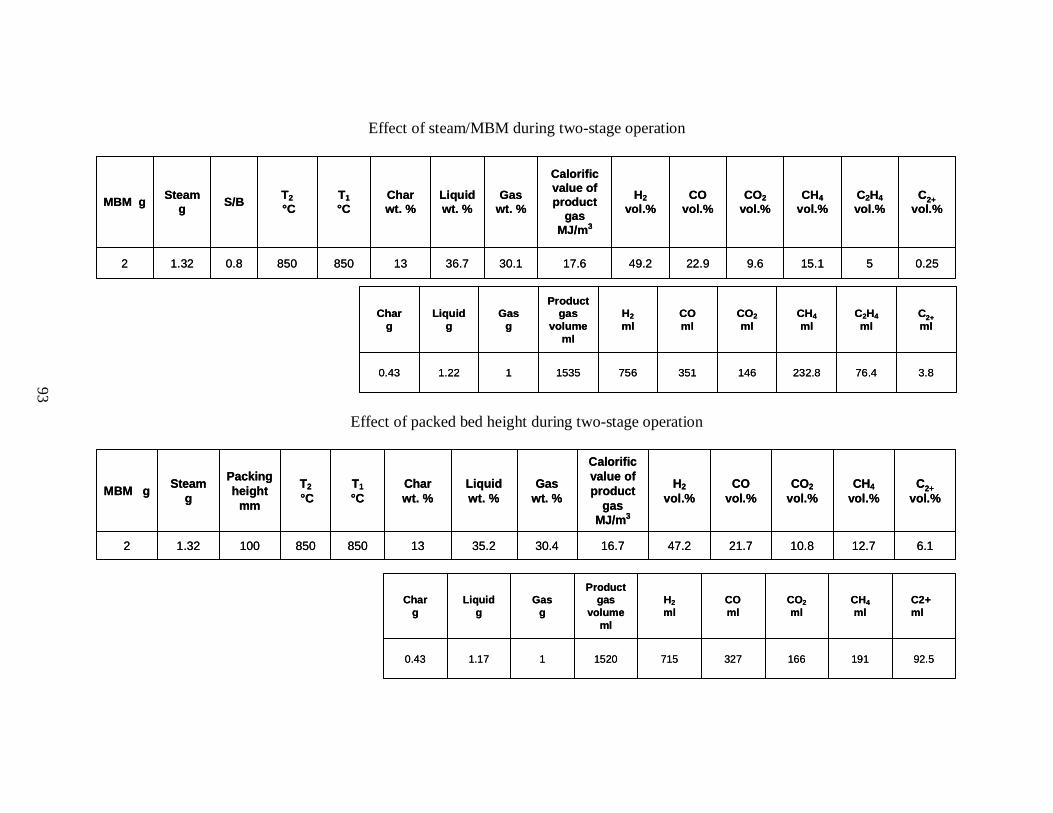
Effect of steam/MBM during two-stage operation
Effect of packed bed height during two-stage operation
C2+vol.%
C2H4vol.%
CH4vol.%
CO2vol.%
CO vol.%
H2vol.%
Calorific value of product
gas MJ/m3
Gas wt. %
Liquid wt. %
Char wt. %
T1°C
T2°CS/BSteam
gMBM g
0.25515.19.622.949.217.630.136.7138508500.81.322
C2+vol.%
C2H4vol.%
CH4vol.%
CO2vol.%
CO vol.%
H2vol.%
Calorific value of product
gas MJ/m3
Gas wt. %
Liquid wt. %
Char wt. %
T1°C
T2°CS/BSteam
gMBM g
0.25515.19.622.949.217.630.136.7138508500.81.322
C2+ml
C2H4ml
CH4ml
CO2ml
CO ml
H2ml
Product gas
volume ml
Gas g
Liquid g
Char g
3.876.4232.8146351756153511.220.43
C2+ml
C2H4ml
CH4ml
CO2ml
CO ml
H2ml
Product gas
volume ml
Gas g
Liquid g
Char g
3.876.4232.8146351756153511.220.43
C2+vol.%
CH4vol.%
CO2vol.%
CO vol.%
H2vol.%
Calorific value of product
gas MJ/m3
Gas wt. %
Liquid wt. %
Char wt. %
T1°C
T2°C
Packing height
mm
Steam gMBM g
6.112.710.821.747.216.730.435.2138508501001.322
C2+vol.%
CH4vol.%
CO2vol.%
CO vol.%
H2vol.%
Calorific value of product
gas MJ/m3
Gas wt. %
Liquid wt. %
Char wt. %
T1°C
T2°C
Packing height
mm
Steam gMBM g
6.112.710.821.747.216.730.435.2138508501001.322
C2+ ml
CH4ml
CO2ml
CO ml
H2ml
Product gas
volume ml
Gas g
Liquid g
Char g
92.5191166327715152011.170.43
C2+ ml
CH4ml
CO2ml
CO ml
H2ml
Product gas
volume ml
Gas g
Liquid g
Char g
92.5191166327715152011.170.43
93

94
APPENDIX D: Permission for figures, and tables D1: Letter of permission for Fig. 2.1
Date: Wed, 05 Aug 2009 09:54:29 -0400 From: "Macintyre, Stacy" <[email protected]> Block Address
To: "Chirayu Soni" <[email protected]> Subject: RE: Permission to use Fig. 10 in International Energy Outlook May 2009
Dear Chirayu Soni,
Thank you for your request to use an image from the International Energy Outlook. U.S. Government publications are in the public domain and are not subject to copyright protection. You may use and/or distribute any of our data, files, databases, reports, graphs, charts, and other information products that are on our website or that you receive through our email distribution service. However, if you use or reproduce any of our information products, you should use an acknowledgment, which includes the publication date, such as: "Source: Energy Information Administration (Oct 2008)."
Regards,
Stacy MacIntyre
National Energy Information Center
Energy Information Administration/U.S. Dept. of Energy
From: Chirayu Soni [mailto:[email protected]] Sent: Tuesday, August 04, 2009 4:20 PM To: Macintyre, Stacy Subject: Permission to use Fig. 10 in International Energy Outlook May 2009
Hello,
My name is Chirayu Soni and I'm a chemical engineering master's student at the University of Saskatchewan in Canada. I would like to have your permission to use your Fig. 10 World marketed energy consumption, 1980-2030 (Chapter 1, International Energy Outlook May 2009) in the introductory material for my thesis.
My thesis is on Gasification of Meat and Bone. Basically, gasification is a well known process for producing syngas. The syngas could be used for generating electricity or in other applications. I would like to use this figure to explain the world energy consumption now and in the future.

95
Thank you,
Sincerely,
Chirayu Soni
D2 Permission for Fig. 2.2
License Number 2242071155701
License date Aug 04, 2009
Licensed content publisher Elsevier
Licensed content publication
Renewable and Sustainable Energy Reviews
Licensed content title
The reduction and control technology of tar during biomass gasification/pyrolysis: An overview
Licensed content author Jun Han and Heejoon Kim
Licensed content date February 2008
Volume number 12
Issue number 2
Pages 20
Type of Use Thesis / Dissertation
Portion Figures/table/illustration/abstracts
Portion Quantity 1
Format Both print and electronic
You are the author of this Elsevier article No

96
Are you translating? No
Order Reference Number
Expected publication date Sep 2009
Elsevier VAT number GB 494 6272 12
Billing type Invoice
Company Chirayu G Soni
Billing address Dept of Chemical Eng.,
57 Campus Dr, University of Saskatchewan Saskatoon, SK S7N5A9 Canada
Customer reference info
Permissions price 0.00 USD
Value added tax 0.0% 0.00 USD
Total 0.00 USD
D3: Permission for Fig. 2.3
License Number 2242080221295
License date Aug 04, 2009
Licensed content publisher Elsevier
Licensed content publication Energy Policy
Licensed content title: Atmospheric stabilization of CO2 emissions: Near-term reductions and absolute versus intensity-based targets
Licensed content author Govinda R. Timilsina
Licensed content date June 2008
Volume number 36
Issue number 6

97
Pages 10
Type of Use Thesis / Dissertation
Portion Figures/table/illustration/abstracts
Portion Quantity 1
Format Both print and electronic
You are the author of this Elsevier article No
Are you translating? No
Order Reference Number
Expected publication date Sep 2009
Elsevier VAT number GB 494 6272 12
Billing type Invoice
Company Chirayu G Soni
Billing address Dept of Chemical Eng., 57 Campus Dr, University of Saskatchewan
Saskatoon, SK S7N5A9 Canada
Customer reference info
Permissions price 0.00 USD
Value added tax 0.0% 0.00 USD
Total 0.00 USD
D4: Permission for Table 2.2
License Number 2242080622873
License date Aug 04, 2009
Licensed content publisher Elsevier
Licensed content publication Biomass and Bioenergy

98
Licensed content title Electricity from biomass in the European Union—With or without biomass import
Licensed content author Klaus Skytte, Peter Meibom and Thomas Capral Henriksen
Licensed content date May 2006
Volume number 30
Issue number 5
Pages 8
Type of Use Thesis / Dissertation
Portion Figures/table/illustration/abstracts
Portion Quantity 1
Format Both print and electronic
You are the author of this Elsevier article No
Are you translating? No
Order Reference Number
Expected publication date Sep 2009
Elsevier VAT number GB 494 6272 12
Billing type Invoice
Company Chirayu G Soni
Billing address Dept of Chemical Eng., 57 Campus Dr, University of Saskatchewan
Saskatoon, SK S7N5A9 Canada
Customer reference info
Permissions price 0.00 USD
Value added tax 0.0% 0.00 USD
Total 0.00 USD