GASB#34 Asset Management TEAM Transportation Fair Presentation by: Charles J. Nemmers, P.E. Charles...
45
GASB#34 GASB#34 Asset Management Asset Management TEAM Transportation Fair TEAM Transportation Fair Presentation by: Presentation by: Charles J. Nemmers, P.E. Charles J. Nemmers, P.E. October 8, 2004 October 8, 2004 St. Louis, St. Louis, Missouri Missouri
-
Upload
reynard-kelly -
Category
Documents
-
view
214 -
download
1
Transcript of GASB#34 Asset Management TEAM Transportation Fair Presentation by: Charles J. Nemmers, P.E. Charles...

GASB#34 GASB#34 Asset ManagementAsset Management
TEAM Transportation FairTEAM Transportation Fair
Presentation by:Presentation by:
Charles J. Nemmers, P.E. Charles J. Nemmers, P.E.
October 8, 2004October 8, 2004 St. Louis, Missouri St. Louis, Missouri

Today’s Presentation:Today’s Presentation:
Define:Define: ” ”What is GASB#34 ? What is GASB#34 ?
Why Should I Care?”Why Should I Care?”
Why is it important Why is it important ““Why Worst First Is Worst”Why Worst First Is Worst”
Implement: Implement: ““Asset Management”Asset Management”

GASB #34GASB #34What is it? What is it?
Why should I care?Why should I care?

GASBGASB Government Accounting Standards Government Accounting Standards
BoardBoard NOT a government agencyNOT a government agency
Sets standards for States and Local Sets standards for States and Local entitiesentities
Basis of audit opinionsBasis of audit opinions

#34#34 ““Basic Financial Statements and Basic Financial Statements and
Management’s Discussion and Management’s Discussion and Analysis for State and Local Analysis for State and Local Governments”Governments”
June 1999June 1999
Changed reporting from Optional to Changed reporting from Optional to RequiredRequired

GASB #34 Objective:GASB #34 Objective: To make government accounting more like To make government accounting more like
private sector accountingprivate sector accounting
Defined Infrastructure AssetsDefined Infrastructure Assets– roadsroads– bridgesbridges– water and sewer systemswater and sewer systems– drainage systemsdrainage systems– dams, tunnels, ...dams, tunnels, ...

Asset Valuation: GASB #34Asset Valuation: GASB #34
Requirements:Requirements: state and local agencies to include the state and local agencies to include the
value of physical assets in their financial value of physical assets in their financial statementsstatements
value based on depreciated historical cost, value based on depreciated historical cost, or historical cost without depreciation if or historical cost without depreciation if the agency can demonstrate that they:the agency can demonstrate that they:– inventory their assetsinventory their assets– assess every 3 yearsassess every 3 years– spend funds sufficient to maintain at an spend funds sufficient to maintain at an
established condition.established condition.

GASB #34GASB #34 gives 2 options gives 2 options
1) Depreciate1) Depreciate
2) Modified Approach2) Modified Approach

Modified vs. Modified vs. DepreciationDepreciation
ModifiedModified DepreciationDepreciation Expense:Expense: Maintenance & Maintenance Maintenance & Maintenance
Preservation Preservation
Capitalize: Capitalize: Additions andAdditions and Preservation costs Preservation costs Improvements Additions & Improvements Additions &
Improvements Improvements

GASB #34 GASB #34 recognizes that recognizes that factors vary among jurisdictions factors vary among jurisdictions and among infrastructure assetsand among infrastructure assets

In aIn a Nutshell Nutshell
Governments generally don’t Governments generally don’t depreciate their assets and the depreciate their assets and the
private sector does, but now the private sector does, but now the rules have changed !!rules have changed !!

Why “Worst First” is Why “Worst First” is “Worst” “Worst”
Comments on how to build Comments on how to build an effective public works an effective public works infrastructure programinfrastructure program

Worst First occurs becauseWorst First occurs because::
Easy to sell - lots of roads are in Easy to sell - lots of roads are in poor shapepoor shape
Funding / budgets tilt toward Funding / budgets tilt toward new new constructionconstruction
No Ribbon CuttingNo Ribbon Cutting
Deferred maintenanceDeferred maintenance

But “Worst First”:But “Worst First”:
Costs more - 6X moreCosts more - 6X more
Drags the whole system downDrags the whole system down
Is difficult to recover fromIs difficult to recover from
Is a difficult concept to counterIs a difficult concept to counter
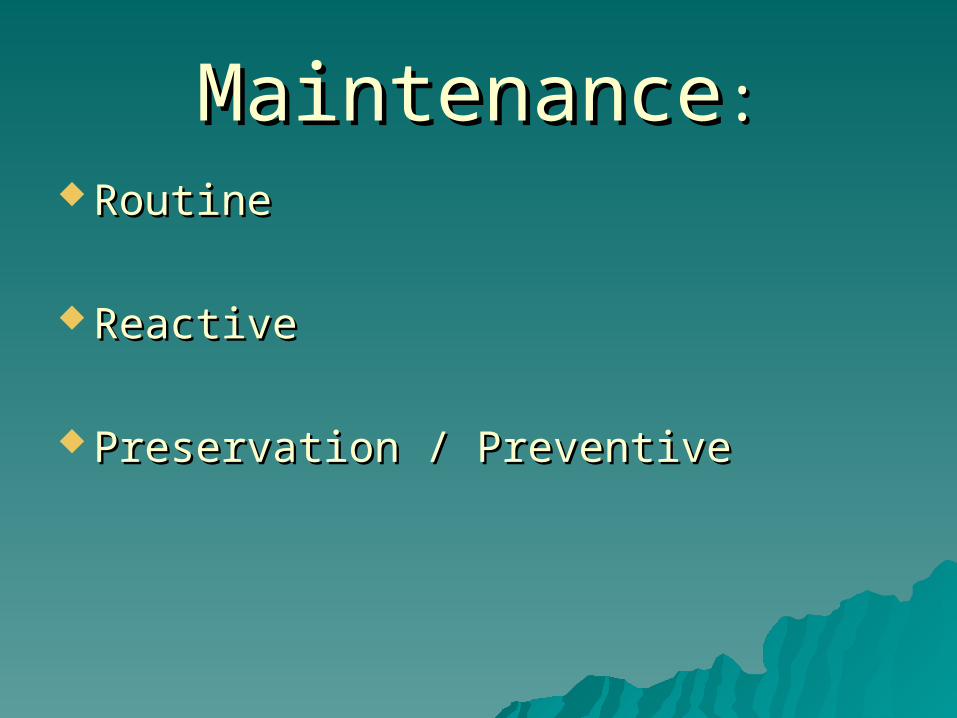
MaintenanceMaintenance:: RoutineRoutine
ReactiveReactive
Preservation / PreventivePreservation / Preventive

Build:Build: Replace / Reconstruct Replace / Reconstruct
(improve structural condition)(improve structural condition)
Expand / New Facilities Expand / New Facilities (add new capacity)(add new capacity)

Pav
emen
t C
on
dit
ion
Optimal Timing
Time/Traffic
Rehabilitation Trigger
Prevention Trigger
Original Pavement

Current ConditionCurrent Condition
0
10
20
30
40
50P
erc
en
t o
f N
etw
ork
Pa
ve
me
nt
I
(0-2)
III
(8-12)
II
(3-7)
IV
(13-17)
V
(18-22)
VI
(23-27)
(years)
Pavement Remaining Life Categories
From Michigan DOT -- Galehouse
19%
10%
40%
8%6%
17%

Remaining Service Life Remaining Service Life Distribution StateDistribution State
5%1%
42%
7% 7%
20%
8%10%
0.005.00
10.0015.0020.0025.0030.0035.0040.0045.00
Pe
rce
nt
Su
rfa
ce A
rea
0 1-3 4-6 7-9 10-12 13-15 16-18 19-20
Remaining Service Life Category
State Highway Network (RSL)
RSL average 8.32

Remaining Service Life Remaining Service Life Distribution CountyDistribution CountyTooele County Remaining Service Life Distribution
5.8 4.0
50.2
9.8
25.5
3.1 1.3 0.30.00
10.00
20.00
30.00
40.00
50.00
60.00
0 1-3 4-6 7-9 10-12 13-15 16-18 19-21
RSL Category
Perc
ent A
rea
Average RSL 6.9

Ideal ConditionIdeal Condition
0
10
20
30
40
50P
erc
en
t o
f N
etw
ork
Pa
ve
me
nt
I
(0-2)
III
(8-12)
II
(3-7)
IV
(13-17)
V
(18-22)
VI
(23-27)
(years)
Pavement Remaining Life Categories
11%
18% 18%16% 17%
20%

Remaining Service Life Remaining Service Life Distribution StateDistribution State
Remaining Service Life for State Network in 2011(Multi-Phase Preservation Program)
2.6% 1.4% 1.8% 1.4% 1.0%
8.2%
24.6%
37.0%
15.9%
6.0%
0.00%5.00%
10.00%15.00%20.00%25.00%30.00%35.00%40.00%
0 1-3 4-6 7-9 10-12 13-15 16-18 19-21 22-24 25-30
RSL Categories
Per
cen
tag
e o
f N
etw
ork

Remaining Service Life Remaining Service Life Distribution-Tooele CountyDistribution-Tooele County
Distribution in the Year 2010 Using a Two PhaseFunding Program
0.00%
10.00%
20.00%
30.00%
40.00%
0 yrs 1-3 yrs 4-6 yrs 7-9 yrs 10-12 yrs 13-15 yrs 16-18 yrs 19-21 yrs
Years
% S
tree
t Net
wo
rk

Remaining Service Life Remaining Service Life Distribution-Tooele CountyDistribution-Tooele County
Distribution in the Year 2010 Using a Two PhaseFunding Program
0.00%
10.00%
20.00%
30.00%
40.00%
0 yrs 1-3 yrs 4-6 yrs 7-9 yrs 10-12 yrs 13-15 yrs 16-18 yrs 19-21 yrs
Years
% S
tree
t Net
wo
rk

Reconstruction StrategyReconstruction Strategy(25 Year Fixes)(25 Year Fixes)
0
10
20
30
40
50
60
70
80
90
100
1997 2003 2009 2015 2021 2027 2033 2039
Per
cent
of
Lan
e M
iles
poor fair good

Combined Reconstruct and Rehab StrategiesCombined Reconstruct and Rehab Strategies(15, 20 & 25 Years Design Life)(15, 20 & 25 Years Design Life)
0
10
20
30
40
50
60
70
80
90
100
1997 2003 2009 2015 2021 2027 2033 2039
Per
cent
of
Lan
e M
iles
poor fair good
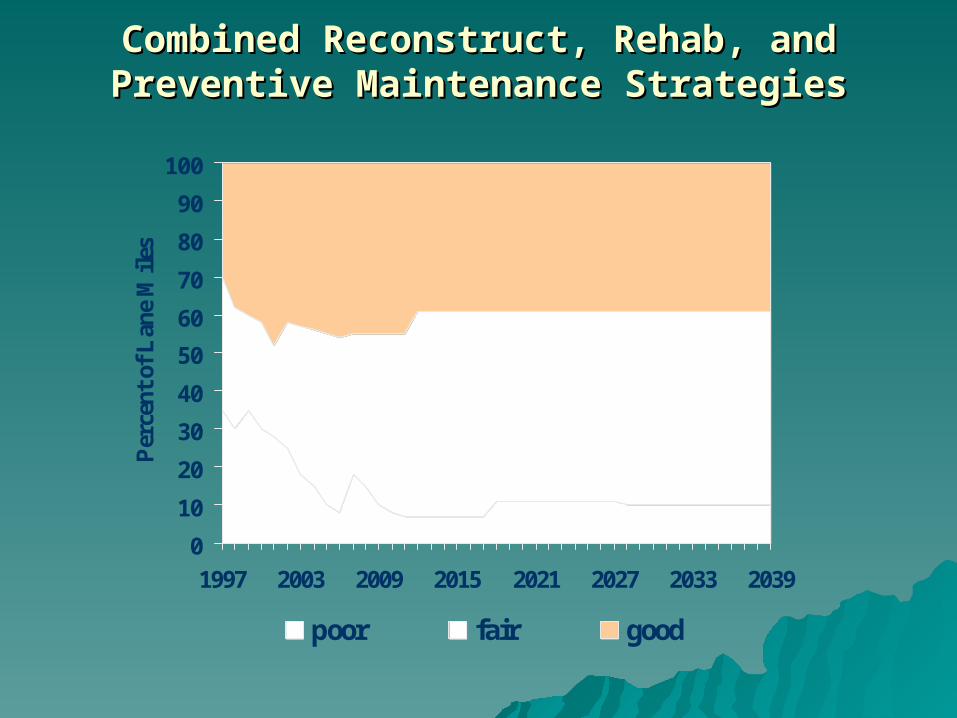
Combined Reconstruct, Rehab, andCombined Reconstruct, Rehab, andPreventive Maintenance StrategiesPreventive Maintenance Strategies
0
10
20
30
40
50
60
70
80
90
100
1997 2003 2009 2015 2021 2027 2033 2039
Per
cent
of
Lan
e M
iles
poor fair good

Keys to SuccessKeys to Success (from MiDOT/GaDOT):(from MiDOT/GaDOT):
Promote Preventive Maintenance Philosophy Promote Preventive Maintenance Philosophy
Fix pavements BEFORE they are broken-select Fix pavements BEFORE they are broken-select good pavements for treatmentgood pavements for treatment
Budget & fund Preventive maintenanceBudget & fund Preventive maintenance
Shorten the time between assessment and Shorten the time between assessment and maintenancemaintenance
Build them excellent the first timeBuild them excellent the first time

““Asset Management”Asset Management”
to meeting GASB #34 using the to meeting GASB #34 using the Modified ApproachModified Approach

Asset ManagementAsset Management
What is it?What is it? Improved way of doing business Improved way of doing business Draws from economics & engineeringDraws from economics & engineering Focuses on benefit of investmentFocuses on benefit of investment Shows How, When & Why resources Shows How, When & Why resources
were committedwere committed Planning toolPlanning tool

Asset ManagementAsset Management
Inventory assetsInventory assets Condition assessmentCondition assessment Value AssetsValue Assets Performance predictionPerformance prediction Alternative / Decision analysisAlternative / Decision analysis Monitor and feedbackMonitor and feedback
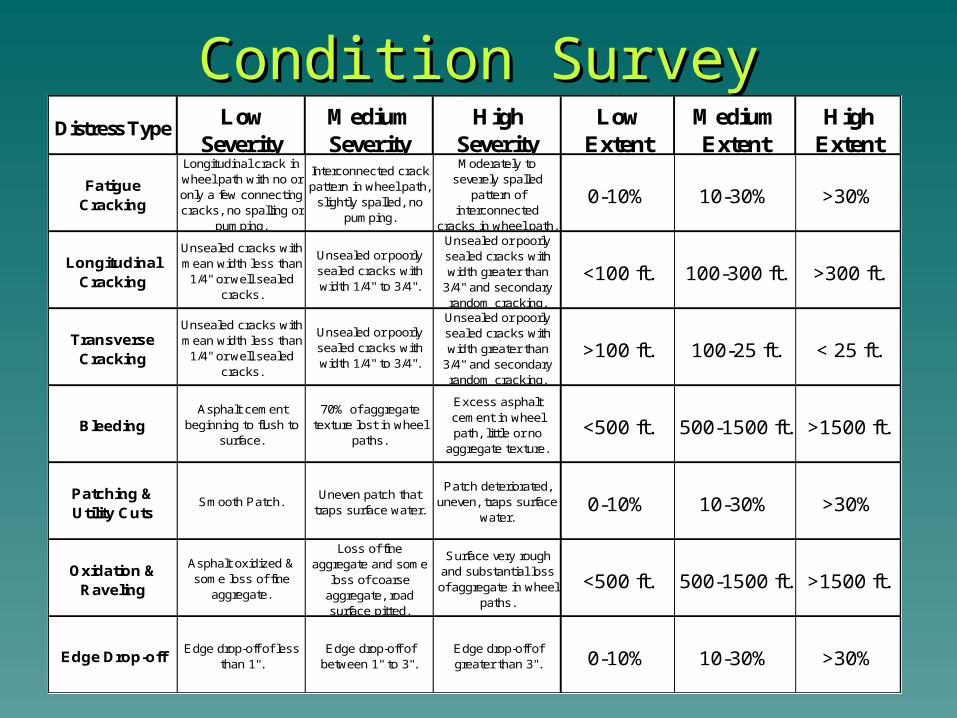
Condition SurveyCondition SurveyDistress Type Low
SeverityMedium Severity
High Severity
Low Extent
Medium Extent
High Extent
Fatigue Cracking
Longitudinal crack in wheel path with no or only a few connecting cracks, no spalling or
pumping.
Interconnected crack pattern in wheel path,
slightly spalled, no pumping.
Moderately to severely spalled
pattern of interconnected
cracks in wheel path,
0-10% 10-30% >30%
Longitudinal Cracking
Unsealed cracks with mean width less than
1/4" or well sealed cracks.
Unsealed or poorly sealed cracks with width 1/4" to 3/4".
Unsealed or poorly sealed cracks with width greater than
3/4" and secondary random cracking.
<100 ft. 100-300 ft. >300 ft.
Transverse Cracking
Unsealed cracks with mean width less than
1/4" or well sealed cracks.
Unsealed or poorly sealed cracks with width 1/4" to 3/4".
Unsealed or poorly sealed cracks with width greater than
3/4" and secondary random cracking.
>100 ft. 100-25 ft. < 25 ft.
BleedingAsphalt cement
beginning to flush to surface.
70% of aggregate texture lost in wheel
paths.
Excess asphalt cement in wheel path, little or no
aggregate texture.
<500 ft. 500-1500 ft. >1500 ft.
Patching & Utility Cuts
Smooth Patch.Uneven patch that
traps surface water.
Patch deteriorated, uneven, traps surface
water.0-10% 10-30% >30%
Oxidation & Raveling
Asphalt oxidized & some loss of fine
aggregate.
Loss of fine aggregate and some
loss of coarse aggregate, road surface pitted.
Surface very rough and substantial loss of aggregate in wheel
paths.
<500 ft. 500-1500 ft. >1500 ft.
Edge Drop-offEdge drop-off of less
than 1".Edge drop-off of
between 1" to 3".Edge drop-off of greater than 3". 0-10% 10-30% >30%

Condition AssessmentCondition Assessment
0 Low Med High
RSL (20)0-10% 10-30% >30%
Low 1 2 3
Longitudinal crack in wheel path with no or only a few connecting cracks, no
spalling or pumping RSL (10) RSL (8) RSL (6)Med 4 5 6
Interconnected crack pattern in wheel path, slightly spalled, no pumping
RSL (8) RSL (6) RSL (4)High 7 8 9
Moderately to severely spalled pattern of interconnected cracks in wheel path,
pumping may be noticeable RSL (6) RSL (2) RSL (0)
Extent (Percent of Wheel Path)
Se
ve
rity
Reference: SHRP Distress Manual pages 8-9
Flexible PavementLow Volume Asphalt Fatigue Cracking
..

RSL of 0

RSL of 8

RSL of 20

Pavement Performance CurvePavement Performance Curve
Pavement Performance Curve
0
20
40
60
80
100
20 18 16 14 12 10 8 6 4 2 0
Remaining Service Life
PCI
0
20
RSL
10
*Terminal Serviceability
Lowest Annual Resurfacing Cost(Rehabilitation Treatments)
PreventativeTreatments

Network Performance Network Performance ObjectivesObjectives
(Recommendations)(Recommendations)
State Network
Interstate
+12 Years 5% or less
+15 Years 3% or less
Percent Requiring Reconstruction
Average RSL
Arterials/Major Collectors(NHS and High Volume Roads)Major Collectors (Low Volume)
and Minor Collectors + 10 Years 5% or less
No more than 5%10 Year(min.)Local Roads and Streets

Needs AssessmentNeeds AssessmentCounty and City NetworksCounty and City Networks
AgencyCenterline Miles
Surface
Area (yd2)Estimated Funding Needs
Tooele County 244 3,605,282 2.1 million/yearHeber City 30 641,713 220,000/year

Routine (reactive) MaintenanceRoutine (reactive) Maintenance
Routine Maintenance
Type of repair Cost per Unit Area Added Service LifeWhen used RSL 13-18
Crack Seal $0.05 2Digout and Cold Patch $0.30 0Digout and Hot Patch $0.30 0High Perf. Cold Patch $0.30 0Fog Coat $0.30 2

Preventative MaintenancePreventative Maintenance
Preventive Maintenance
Type of Repair Cost per Unit Area Added Service LifeWhen used RSL 10-12
Sand Seal $0.54 2Scrub Seal $0.90 5Single Chip Seal $0.90 5Double Chip Seal $1.35 7Slurry Seal $0.90 5Microsurfacing $1.44 7

RehabilitationRehabilitation
Rehabilitation
Type of Repair Cost per Unit Area Added Service LifeWhen used RSL 7-9
HMA (leveling) & Overlay (<2 in.) $4.14 8Thin Hot Mix Overlay (<2 in) $3.60 7Hot Surface Recycling $4.95 8Rotomill & Overlay (<2 in) $4.95 8Plant Mix Seal $2.70 7

ReconstructionReconstruction
Reconstruction
Type of Repair Cost per Unit Area Added Service LifeWhen used RSL 0
Thick Overlay (3 in.) $5.00 12Base repair and pavement Replacement $7.50 14Base Replacement and Pavement Replacement $10.00 20Cold Recycling &Overlay (3 in.) $9.90 14Rotomill & Thick Overlay (3 in.) $6.00 12

Predicted 10 Year RSLPredicted 10 Year RSL Average- Heber City Average- Heber City
Average Remaining Service Life Two Phase Strategy
12.1
12.5
12.7
13.1
11.60
11.80
12.00
12.20
12.40
12.60
12.80
13.00
13.20
2003 2006 2008 2010
Year
RS
L

Thank YouThank YouCharlie NemmersCharlie Nemmers