GAS TURBINES Development of the sequential combustion …€¦ · · 2015-05-114 ABB Review...
13
4 ABB Review 4/1998 he GT24/GT26 gas turbine family uses proven turbine technology and applies it in a unique manner to solve a problem that has challenged the power generation industry since the inception of advanced technology: the uncoupling of efficiency and emissions. In standard gas turbine designs, the higher turbine inlet temperature required for increased efficiency results in higher emission levels and increased material and life cycle costs. This problem is overcome with the sequential combustion cycle. Such a cycle forms the basis of ABB’s advan- ced GT24 (60 Hz) and GT26 (50 Hz) gas turbines, which combine compactness 1 with high specific power, high efficiency, high reliability and low emissions. GT24/GT26 performance data Rated at 165 MW, the GT24 delivers 50% more output than a conventional GT11N2 with essentially the same footprint of 10 × 5 meters. The higher output is the result of increases in the cycle pressure ratio and the sequential combustion cycle. Additionally, the exhaust tempera- ture of the GT24/GT26 is 610°C (1130 °F), which is ideal for combined cycle (gas and steam turbine plant) oper- ation (Table 1). Scaled up from the GT24, the GT26 is for the 50-Hz market, with an output of 265 MW and efficiencies of 38.2 % in simple cycle and 58.5 % in combined cycle mode. The power density of this gas turbine family is approximately 20 % higher than for other units in this class. This allows a more compact design, shorter blade lengths, lower tip speeds and therefore lower stresses, leading to higher reliabil- ity. Sequential combustion system From the outside, the straight through- flow design of the GT24/GT26 gas tur- bines looks very similar to that of a con- ventional gas turbine, with a cold-end generator drive, the air intake system per- pendicular to the shaft, axial turbine ex- haust and all casings and vane carriers split horizontally. The main developments that led to the advanced and compact GT24/26 turbine design have already proved their reliability in numerous power plants. The advanced technology behind the GT24/GT26 is the sequential com- G A S T U R B I N E S Dr. Franz Joos Philipp Brunner Dr. Burkhard Schulte-Werning Dr. Khawar Syed ABB Power Generation Dr. Adnan Eroglu ABB Corporate Research T Development of the sequential combustion system for the GT24/GT26 gas turbine family The 60-Hz, 165-MW GT24 and the 50-Hz, 265-MW GT26 are the first two members of ABB’s new gas turbine family based on sequential combus- tion. These turbines offer higher output plus an efficiency advantage of up to 4% over today’s machines. Whereas the first combustor in the se- quential combustion system employs proven EV combustor technology, the lean premixed, self-igniting second combustor is the result of an ex- tensive R & D programme that included wind tunnel and water channel experiments, computational fluid dynamics (CFD) calculations and com- bustion tests at atmospheric and high pressure. An innovative cooling technology was also developed to satisfy the special needs of the self- igniting premix combustor. The test programme further showed that the sequential combustion system has the potential to lower NO x emissions to single-digit levels. This article is based on a paper of the same title, pre- sented at the ASME Turbo Expo ’96 in Birmingham, UK. It was named ‘Best Technical Paper’ by the Electric Util- ities & Cogeneration Committee at Turbo Expo ’97 and honoured with the 1996 ASME Award for its outstand- ing contribution to the literature of gas turbines and power plants at ASME TURBO EXPO ’98.
-
Upload
phungduong -
Category
Documents
-
view
222 -
download
1
Transcript of GAS TURBINES Development of the sequential combustion …€¦ · · 2015-05-114 ABB Review...

4 A B B R e v i e w 4 / 1 9 9 8
he GT24/GT26 gas turbine family
uses proven turbine technology and
applies it in a unique manner to solve a
problem that has challenged the power
generation industry since the inception of
advanced technology: the uncoupling of
efficiency and emissions.
In standard gas turbine designs, the
higher turbine inlet temperature required
for increased efficiency results in higher
emission levels and increased material
and life cycle costs.
This problem is overcome with the
sequential combustion cycle. Such a
cycle forms the basis of ABB’s advan-
ced GT24 (60 Hz) and GT26 (50 Hz) gas
turbines, which combine compactness
1 with high specific power, high efficiency,
high reliability and low emissions.
GT24/GT26 performance data
Rated at 165 MW, the GT24 delivers 50 %
more output than a conventional GT11N2
with essentially the same footprint of
10 × 5 meters. The higher output is the
result of increases in the cycle pressure
ratio and the sequential combustion
cycle. Additionally, the exhaust tempera-
ture of the GT24/GT26 is 610°C
(1130 °F), which is ideal for combined
cycle (gas and steam turbine plant) oper-
ation (Table 1).
Scaled up from the GT24, the GT26 is
for the 50-Hz market, with an output of
265 MW and efficiencies of 38.2 % in
simple cycle and 58.5 % in combined
cycle mode.
The power density of this gas turbine
family is approximately 20 % higher than
for other units in this class. This allows a
more compact design, shorter blade
lengths, lower tip speeds and therefore
lower stresses, leading to higher reliabil-
ity.
Sequential combustion system
From the outside, the straight through-
flow design of the GT24/GT26 gas tur-
bines looks very similar to that of a con-
ventional gas turbine, with a cold-end
generator drive, the air intake system per-
pendicular to the shaft, axial turbine ex-
haust and all casings and vane carriers
split horizontally. The main developments
that led to the advanced and compact
GT24/26 turbine design have already
proved their reliability in numerous power
plants.
The advanced technology behind
the GT24/GT26 is the sequential com-
G A S T U R B I N E S
Dr. Franz Joos
Philipp Brunner
Dr. Burkhard Schulte-Werning
Dr. Khawar Syed
ABB Power Generation
Dr. Adnan Eroglu
ABB Corporate Research
T
Developmentof the sequential combustion system for the GT24/GT26gas turbine family
The 60-Hz, 165-MW GT24 and the 50-Hz, 265-MW GT26 are the first two
members of ABB’s new gas turbine family based on sequential combus-
tion. These turbines offer higher output plus an efficiency advantage of
up to 4 % over today’s machines. Whereas the first combustor in the se-
quential combustion system employs proven EV combustor technology,
the lean premixed, self-igniting second combustor is the result of an ex-
tensive R & D programme that included wind tunnel and water channel
experiments, computational fluid dynamics (CFD) calculations and com-
bustion tests at atmospheric and high pressure. An innovative cooling
technology was also developed to satisfy the special needs of the self-
igniting premix combustor. The test programme further showed that the
sequential combustion system has the potential to lower NOx emissions
to single-digit levels.
This article is based on a paper of the same title, pre-sented at the ASME Turbo Expo ’96 in Birmingham, UK.It was named ‘Best Technical Paper’ by the Electric Util-ities & Cogeneration Committee at Turbo Expo ’97 andhonoured with the 1996 ASME Award for its outstand-ing contribution to the literature of gas turbines andpower plants at ASME TURBO EXPO ’98.

A B B R e v i e w 4 / 1 9 9 8 5
bustion system . With a pressure ratio
of 30 :1, the compressor delivers nearly
double the pressure ratio of a conven-
tional compressor, although in terms of
applied technology it remains well within
the experience envelope [14]. The com-
pressed air is heated in a first combus-
tion chamber (EV combustor). After the
addition of about 60 % of the fuel (at full
load), the combustion gas expands
through the first turbine stage. This one-
stage, high-pressure (HP) turbine lowers
the pressure from 30 to approximately
15 bar.
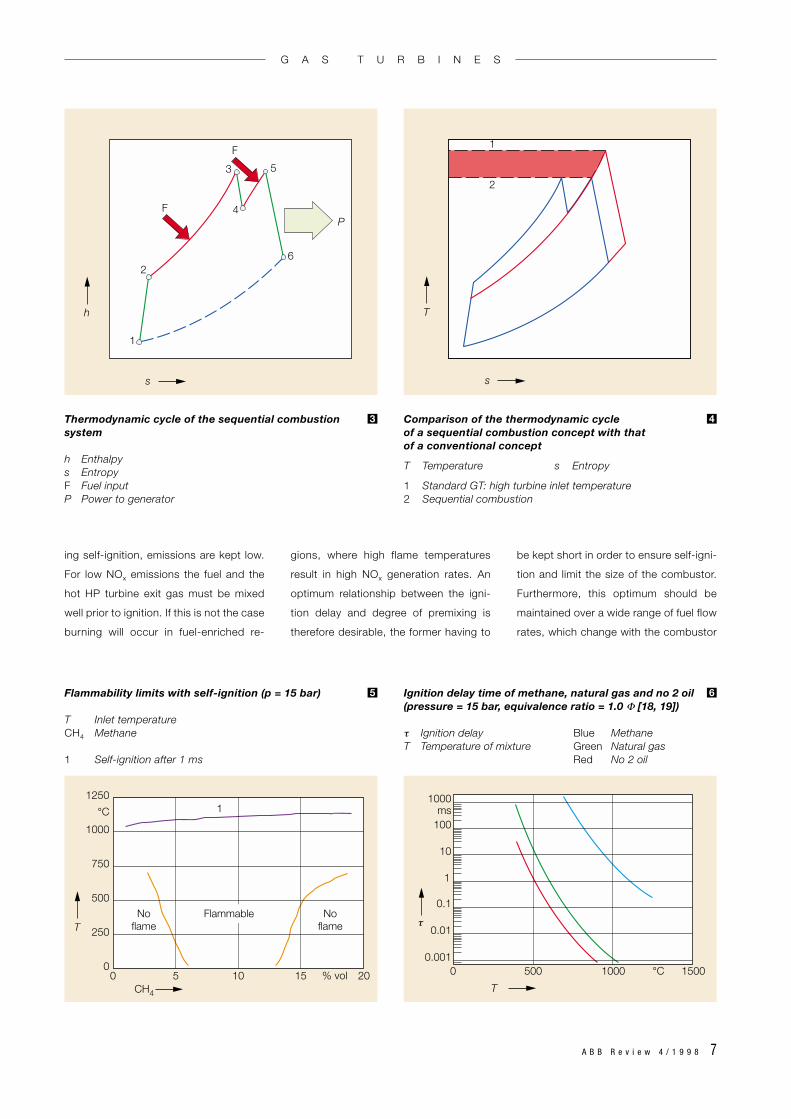
The remaining fuel is added in a sec-
ond combustion chamber (SEV combus-
tor), where the gas is again heated to
the maximum turbine inlet temperature.
Final expansion in the 4-stage, low-
pressure (LP) turbine follows. shows
the thermodynamic cycle of the sequen-
tial combustion process, while com-
pares the cycle of the sequential com-
bustion process with a conventional
cycle. It is seen that for the same power
output, a lower turbine inlet temperature
is needed with the sequential combustion
cycle.
Sequential combustion is not new in
the history of power generation. ABB de-
livered already during the 1950s and
1960s 24 plants with various com-
binations of intercooling in the compres-
sor and two-stage combustion in the tur-
bine. Nine of these plants are still in oper-
ation today. ABB therefore has decades
of experience with sequential combustion
systems [7].
Design features of the
GT24/GT26 EV combustor
The first combustor is an annular com-
bustion chamber equipped with 30 prov-
en dry low-NOx EV burners. The EV
burner (EV stands for ‘Environmental’)
[16] adds the benefit of low NOx combus-
4
3
2
tion without water or steam injection.
First commercially tested in 1990 at the
Midland Cogeneration Venture, Michigan
(USA), the fleet using the EV burner has
meanwhile run up more than 800,000
hours of reliable operation.
The compact annular combustion
chamber design is another key com-
ponent of the sequential combustion
system. It is already proven in the GT10
(25-MW) and in the GT13E2 (165-MW)
gas turbines [1,17], the latter having been
successfully commissioned in Japan in
1993. Launched in 1991, 53 units of the
GT13E2 have been ordered to date, with
48 units already in operation.
Cutaway drawing of the advanced ABB GT24/GT26 gas turbine 1
Table 1:Technical data of the GT24 and GT26 gas turbines (simple cycle, methane)
GT24 GT26
Load output* MW 165 265Efficiency (LHV)* % 37.9 38.2Heat rate (LHV)* Btu/kWh 9,000 8,930Compressor ratio – 30 30Exhaust mass flow kg/s 378 545Exhaust temperature ° C 610 610Shaft speed rpm 3,600 3,000NOX emissions vppm < 25 < 25No of stages
compressor – 22 22turbine – 5 5
No and type of annular combustors – 1 EV 1 EV– 1 SEV 1 SEV
No of burners EV/SEV – 30/24 30/24
* = at generator terminals
G A S T U R B I N E S

6 A B B R e v i e w 4 / 1 9 9 8
This very compact combustion
chamber has a carrier structure with seg-
mented liners which are cooled by con-
vection. There are no cooling films on the
hot side of the walls. Virtually all the in-
coming compressor air is led to the EV
burners, where a lean premix combustion
process ensures extremely low NOx
emissions. The EV burners employ the
‘vortex breakdown’ principle; neither
mechanical flame holders nor cross-firing
tubes are therefore necessary. All EV
burners operate throughout the full load
range. The temperature profile of the de-
parting hot gas is very even in the circum-
ferential direction (due to the annular de-
sign) as well as in the radial direction (pri-
marily due to the premixing of all air with
the fuel and the absence of film cooling of
the inner and outer liners of the combus-
tor). This important feature enhances re-
liability and efficiency in the first turbine
stage and increases the lifetime of the
hot-gas components.
The SEV combustor –
basic considerations
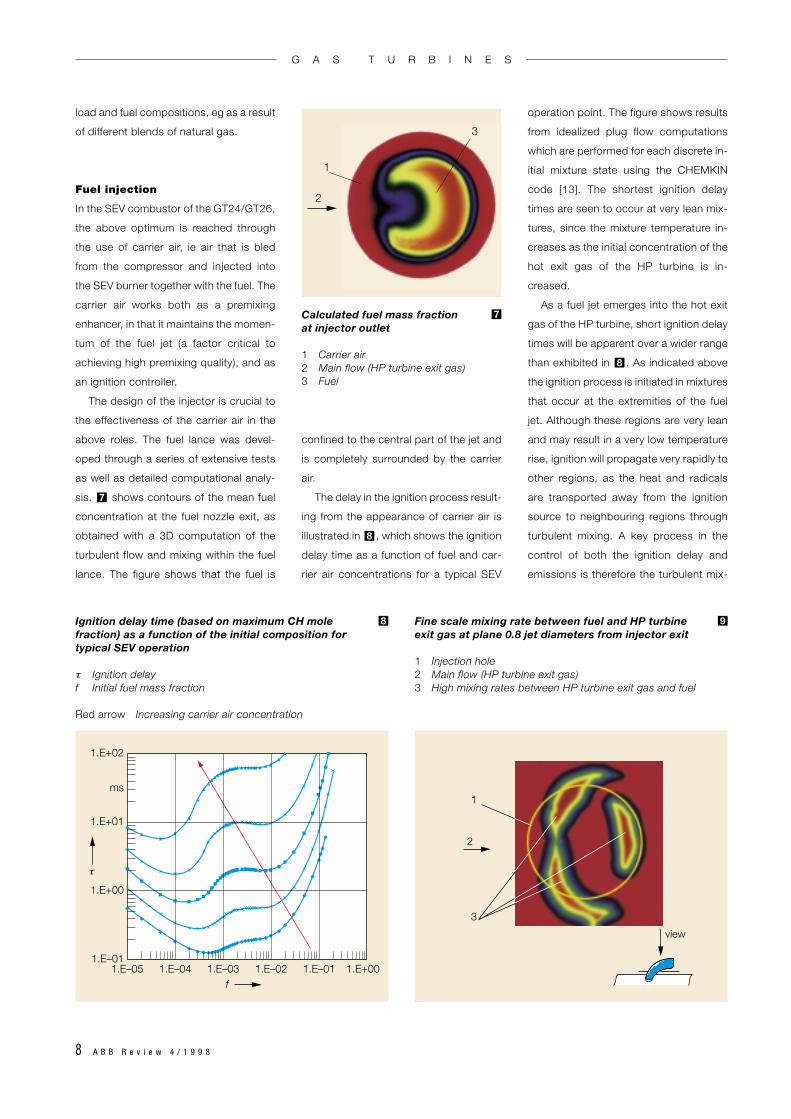
Experimental findings show that for many
fuels the weak extinction limit cor-
responds to an equivalence ratio Φ of
around 0.5 in atmospheric conditions and
is relatively independent of the pressure.
In contrast, the flammability range is con-
siderably widened by increasing the inlet
temperature . This widening is gen-
erally ascribed to the enhanced flame
temperature, which strengthens the dif-
fusion ignition sources in the flame propa-
gation process [5].
At considerably higher temperatures a
region is found where self-ignition of the
fuel occurs and no external ignition
source for flame propagation is required.
Spontaneous ignition delay is defined
as the time interval between the creation
of a combustible mixture, achieved by in-
jecting fuel into air at high temperatures,
and the onset of a flame. In view of their
practical importance, measurements of
5
5
spontaneous ignition delay have been
conducted for many fuels over wide
ranges of ambient conditions [18, 19].
compares the ignition delay time of
methane with that of a typical natural gas
and oil no 2.
In a conventional lean premix combus-
tor (eg the EV combustion chamber)
spontaneous ignition must be avoided,
since it could lead to overheating of com-
bustor components and to unacceptably
high pollutant emissions. A reheat com-
bustion system, such as the SEV (Se-
quential EV) combustion chamber, can be
designed to use the self-ignition effect for
a simple and rugged construction. In
order to achieve reliable spontaneous
ignition with natural gas and to widen the
stability range, combustor inlet tempera-
tures higher than 1000 °C over the whole
operating range were selected for the
GT24/GT26 SEV combustor.
Successful operation of the SEV com-
bustor requires that, in addition to ensur-
6
4
123
5 6 7
8 9 10 11
Section through the sequential combustion system in the GT24/GT26 gas turbine
1 Compressor 5 Fuel injector 9 Mixing zone2 High-pressure turbine 6 EV combustor 10 Vortex generators3 Low-pressure turbine 7 EV burner 11 Effusion-cooled SEV burner4 SEV combustor 8 Convective liner cooling
2
G A S T U R B I N E S
A B B R e v i e w 4 / 1 9 9 8 7
ing self-ignition, emissions are kept low.
For low NOx emissions the fuel and the
hot HP turbine exit gas must be mixed
well prior to ignition. If this is not the case
burning will occur in fuel-enriched re-
gions, where high flame temperatures
result in high NOx generation rates. An
optimum relationship between the igni-
tion delay and degree of premixing is
therefore desirable, the former having to
be kept short in order to ensure self-igni-
tion and limit the size of the combustor.
Furthermore, this optimum should be
maintained over a wide range of fuel flow
rates, which change with the combustor
h
s
1
26
P
F
F
5
4
3
T
s
1
2
Thermodynamic cycle of the sequential combustionsystem
h Enthalpys EntropyF Fuel inputP Power to generator
3 Comparison of the thermodynamic cycle of a sequential combustion concept with that of a conventional concept
T Temperature s Entropy
1 Standard GT: high turbine inlet temperature2 Sequential combustion
4
T
CH4
1250
1000
°C
750
500
250
050 10 15 20% vol
1
Noflame
Noflame
Flammable
T
1000ms
100
10
0.1
1
0.01
0.0010 500 1000 °C 1500
τ
Flammability limits with self-ignition (p = 15 bar)
T Inlet temperatureCH4 Methane
1 Self-ignition after 1 ms
5 Ignition delay time of methane, natural gas and no 2 oil(pressure = 15 bar, equivalence ratio = 1.0 Φ [18, 19])
τ Ignition delay Blue MethaneT Temperature of mixture Green Natural gas
Red No 2 oil
6
G A S T U R B I N E S
8 A B B R e v i e w 4 / 1 9 9 8
load and fuel compositions, eg as a result
of different blends of natural gas.
Fuel injection
In the SEV combustor of the GT24/GT26,
the above optimum is reached through
the use of carrier air, ie air that is bled
from the compressor and injected into
the SEV burner together with the fuel. The
carrier air works both as a premixing
enhancer, in that it maintains the momen-
tum of the fuel jet (a factor critical to
achieving high premixing quality), and as
an ignition controller.
The design of the injector is crucial to
the effectiveness of the carrier air in the
above roles. The fuel lance was devel-
oped through a series of extensive tests
as well as detailed computational analy-
sis. shows contours of the mean fuel
concentration at the fuel nozzle exit, as
obtained with a 3D computation of the
turbulent flow and mixing within the fuel
lance. The figure shows that the fuel is
7
confined to the central part of the jet and
is completely surrounded by the carrier
air.
The delay in the ignition process result-
ing from the appearance of carrier air is
illustrated in , which shows the ignition
delay time as a function of fuel and car-
rier air concentrations for a typical SEV
8
operation point. The figure shows results
from idealized plug flow computations
which are performed for each discrete in-
itial mixture state using the CHEMKIN
code [13]. The shortest ignition delay
times are seen to occur at very lean mix-
tures, since the mixture temperature in-
creases as the initial concentration of the
hot exit gas of the HP turbine is in-
creased.
As a fuel jet emerges into the hot exit
gas of the HP turbine, short ignition delay
times will be apparent over a wider range
than exhibited in . As indicated above
the ignition process is initiated in mixtures
that occur at the extremities of the fuel
jet. Although these regions are very lean
and may result in a very low temperature
rise, ignition will propagate very rapidly to
other regions, as the heat and radicals
are transported away from the ignition
source to neighbouring regions through
turbulent mixing. A key process in the
control of both the ignition delay and
emissions is therefore the turbulent mix-
8
1.E+02
1.E+01
1.E+00
1.E–01
ms
1.E–05 1.E–04 1.E–03 1.E–02 1.E–01 1.E+00
τ
f
view
1
3
2
Ignition delay time (based on maximum CH mole fraction) as a function of the initial composition for typical SEV operation
τ Ignition delayf Initial fuel mass fraction
Red arrow Increasing carrier air concentration
8 Fine scale mixing rate between fuel and HP turbine exit gas at plane 0.8 jet diameters from injector exit
1 Injection hole2 Main flow (HP turbine exit gas)3 High mixing rates between HP turbine exit gas and fuel
9
Calculated fuel mass fraction at injector outlet
1 Carrier air2 Main flow (HP turbine exit gas)3 Fuel
7
1
2
3
G A S T U R B I N E S

A B B R e v i e w 4 / 1 9 9 8 9
ing of the fuel, carrier air and HP turbine
exit gas.
Fuel/air premixing
To better understand the coupling be-
tween the small-scale turbulent mixing
and chemistry that controls ignition, the
mixing of the fuel/carrier air jet and the HP
turbine exit gas was studied by way of
CFD. The commercial package CFDS-
FLOW3D [2] was used for this, the turbu-
lent flow being modelled by addressing
density-weighted averaged variables.
Turbulent closure was achieved using the
two-equation k-ε turbulence model.
Given the non-linear dependence of
the ignition chemistry on the state of the
mixture, it is necessary to know the in-
stantaneous state rather than just the
mean mixture characteristics that are of-
fered by the averaged balance equations.
This issue has been effectively tackled
within the modelling of turbulent non-pre-
mixed combustion, where the thermo-
chemical field can be related to a single
conserved scalar, eg the mixture fraction,
by presuming the form of the probability
density function (PDF) of the mixture frac-
tion from its first two moments. The latter
are obtained by solving the appropriate
balance equations [4].
In the given circumstances, however,
and considering that there are three sep-
arate streams – fuel, carrier air and HP
turbine exit gas – the mixture field is de-
scribed by two conserved scalars. Fur-
thermore, the correlation between these
streams is essential when inferring igni-
tion delay behaviour. For a given instan-
taneous fuel concentration, the instan-
taneous rate of the ignition reactions are
dependent upon the instantaneous car-
rier air concentration and the instan-
taneous hot gas concentration. There-
fore, a two-dimensional joint PDF is
necessary.
Within the confines of the SEV devel-
opment programme, an approach based
upon obtaining the joint PDF by solution
of its transport equation [15] is not feas-
ible due to the complex 3D flows and the
need to rapidly assess the merits of differ-
ent designs. Instead, the work described
in [8] has been followed, whereby the joint
PDF is presumed from a finite number of
moments. The model is based on the as-
sumption of a multi-variate beta-function
PDF for the scalar variables. The PDF is
then constructed from the first moments
of each of its components and the turbu-
lent scalar energy.
The above model has been used to in-
vestigate the turbulent mixing process
and its coupling with the chemistry as
well as to evaluate the attributes of differ-
fuel injector
H
x
x/H = 0.1
x/H = 1.0
x/H = 2.0
x/H = 3.0
main flow
air fuel
SD
x /H
0 0.5 1.0 1.5 2.0 2.5 3.0
100
80
60
40
20
0
LIF pictures and associated histograms of transverseplanes along the mixing section
x Axial coordinateH Channel height
10 Variation coefficient (standard deviation/mean, SD) of the mixing quality versus the normalized axial distance x/H
x Axial coordinateH Channel height
11
G A S T U R B I N E S

10 A B B R e v i e w 4 / 1 9 9 8
ent lance designs in terms of the mixing
and hence the ignition process. shows
the computed results of the modelled
scalar dissipation rate based on the fuel
and HP turbine exit gas, ie the rate at
which fuel and hot gas mix at the mo-
lecular level, which is necessary for the
chemical reaction to proceed. The fuel
jet boundary condition used for the
calculation is shown in . indicates
the region most vulnerable to self-igni-
tion.
Aerodynamic and fuel/oxidant
mixing within the burner
As in the EV burner, fuel distribution and
mixing within the SEV burner is achieved
with the aid of vortical flow. The flame is
anchored at the vortex breakdown posi-
tion. The vortices are generated by delta
wings, formed like ramps and located on
the walls of the SEV burner.
Water model tests were employed ex-
tensively throughout the development of
the SEV combustor to lay out and opti-
mize the burner aerodynamics. The pre-
liminary tests were carried out in a
straight channel, simulating first a single
and later double annular segments of the
SEV combustor. In this relatively simple
test rig numerous concepts for the fuel in-
jection, mixing and flame stabilization
were investigated with regard to the mix-
ing quality and velocity distribution along
the mixing section. Another requirement
was a single fuel supply per segment to
facilitate reliable liquid fuel injection and
ensure a simple and robust design. With
all these restrictions in mind, a great
number of variations of each alternative
concept were set up and tested in a plexi-
glas test rig.
Laser Doppler anemometry was used
to assess the mean and turbulent velo-
cities along the mixing section and com-
bustor. All three components of the velo-
97
9
city were measured. The primary aim of
these measurements was to ensure that
the axial velocity along the mixing section
provides a large enough safety margin
against flashback. Additionally, the swirl
components of the velocity were
measured in order to optimize the flame
stabilization geometry .
The fuel distribution and mixing quality
were measured by means of Laser In-
duced Fluorescence (LIF). In this tech-
nique, the fuel flow is simulated by a so-
lution of disodium fluorescence (a laser
dye which fluoresces strongly when il-
luminated at the wavelength of 488 nm) in
water. The main stream was seen to be
free of dye. The blue line of an argon-ion
laser is transmitted into the test section
via a fiber optic cable and manipulated
into a sheet by a cylindrical lens or rotat-
ing mirror. This light sheet illuminates a
plane of 1 mm thickness, which is tra-
versed along the mixing section to ob-
serve selected cross-sections via a CCD
camera. Recordings made by this cam-
era are digitized via a frame grabber and
subsequently evaluated on a computer to
obtain statistical values, such as mean
and standard deviation. A series of grey
scale pictures for a specific injector and
mixer configuration are given in for
consecutive transverse planes down-
stream of the injection point.
Next to each picture is a histogram
showing the distribution of the pixels
with a certain grey scale value. These his-
tograms focus on just the lean region
of the fuel jet. A peak at the left end of
the diagram means pure air. At x/H = 0.1
the peak is associated with water free
of dye, whilst at x/H = 3.0 it is cen-
tered around the perfect mixture. It can
be seen from these histograms that the
mixing progresses rapidly to yield a very
narrow distribution. The progress of the
standard deviation of the mean ratio
(defined as a variation coefficient) is
shown in .
CFD calculations were performed
alongside the combustion and water
tests during development of the combus-
tor in order to obtain a robust design in
11
10
13
Vector plot of the radial andcircumferential velocity components at the fuel injectionplane as measured with LDA in a rectangular perspex model (half channel width)
13
Computed secondary flow patterns at the fuel injection plane(half channel width)
12
G A S T U R B I N E S

Non-dimensional reattachment length behind the SEV backward facing step from CFD simulation
x/H Reattachment lengthα Circumferential angle from one wall to other wall
of SEV burner
Outer SEV linerInner SEV liner
A B B R e v i e w 4 / 1 9 9 8 11
the shortest possible time at minimum
cost. With regard to the aerodynamic de-
sign of the SEV burner, CFD was used
for:
• Preliminary and rapid analysis of initial
designs and subsequent modifica-
tions, and of the influence of all the
boundary conditions under which the
combustor operates.
• A better analysis of the test data
through the detailed study of the pro-
cesses.
Given the vortical turbulent flows that
occur within the SEV combustor, it is es-
sential for the CFD to be strongly coupled
to the testing activities in order to be able
to gauge the reliability of the CFD results
and assess the extent to which CFD
should be relied upon. Comparison of
water test results and CFD results have
shown that the accuracy of the aerody-
namics data is sufficient to allow CFD to
be used for assessing the geometry and
boundary condition modifications.
shows the computed secondary
flow pattern downstream of the vortex
generators within the SEV burner. The
12
computations were performed using
CFDS-FLOW3D and the standard k-ε
turbulence model to achieve closure of
the mean balance equations. Although
the standard k-ε model is not well suited
to swirling flows, the adopted strategy
results in a good balance between accu-
rate results and an acceptable turn-
around time for the computations.
A comparison of the computed and
the measured secondary flow field ,
shows that the major flow features
are reproduced.
SEV combustor cooling
technology
An innovative cooling system was devel-
oped which meets all the requirements of
the self-igniting premixed SEV combus-
tion chamber. Minimization of the com-
bustor’s cooling air consumption was an
important goal during development of the
sequential combustion system because
the cooling air of the SEV combustor by-
passes the HP turbine. Such require-
ments are in contrast to those for a con-
13
12
vective cooled combustor in a standard
cycle gas turbine, where the pressure
drop must be minimized and therefore the
maximum amount of air must be used for
cooling. Special attention was also paid
to ensuring that the hardware is of a ro-
bust construction and that variations in
the boundary conditions would have only
a minimal influence on the effectiveness
of the cooling.
Essentially, a counterflow cooling sys-
tem with full heat recuperation is used, in
which virtually all the cooling air is mixed
with the hot gas from the HP turbine
ahead of the flame. After having cooled
the combustor liner walls via convective
cooling, the cooling air is injected into the
hot gas path via the effusion cooling of
the burner. The full amount of cooling air
is used to reduce the flame zone tem-
peratures, and therefore the NOx
emissions.
Due to the high Re number flow and
the premix character of the flame, the
dominant heat transfer mechanism with-
in the SEV combustor is convection. Only
1/5 of the total heat flux rate is attributed
1E+05 5E+051
2
3
4
Nu
Re
Re sev
α
2.0
1.5
1.0
0.5
00° 5° 10° 15°
x /H
Nu enhancement behind a backward facing step
Nu Nusselt numberRe Reynolds number
14 15
G A S T U R B I N E S

12 A B B R e v i e w 4 / 1 9 9 8
to the radiation of the non-luminous
flame.
The peak wall heat transfer within the
SEV combustor is dominated by the con-
vection of the reacting flow resulting from
the sudden expansion at the exit of the
SEV burner. The turbulent shear layer
starting at the apex of the backward
facing step reattaches to the liner wall
several step heights downstream, where
it causes a local peak in the heat transfer.
For a given expansion ratio the peak
Nusselt number of an unswirled flow
scales with Re2/3, while in a fully devel-
oped flow Nu grows like Re0.8. Scaling up
the available data [20, 3] to higher Re
leads to an Nu enhancement factor of 2
behind the backward facing step .
Detailed CFD simulations showed
the average reattachment length of the
swirled SEV burner flow to be only 1.2
times the premixing channel height,
which is only 2/3 the value for a tubular
single swirler flow [6]. This earlier reat-
15
14
tachment is attributed both to the multi-
swirler flow within the SEV burner and the
annular geometry of the combustion
chamber.
The hot gas heat transfer modelling
was then based on the stated Nu value,
assuming a typical boundary layer devel-
opment downstream of the calculated
location of the flow reattachment, and
includes the flame radiation.
In recent years ABB has amassed a
considerable amount of experience in
the use of thermal barrier coatings (TBC)
on tiles in combustor cooling systems.
The protective layer, which reduces ther-
mal loading at its source (on the hot-gas
side) is built up by spraying on a coating
of zirconia oxide (ZrO2). The benefits of
the TBC were mainly used to lower the
liner wall temperature to levels where su-
perior metal properties allow a signifi-
cantly longer lifetime for the components
than before.
All the SEV cooling air enters the liner
cooling system near the LP turbine,
thereby locally cooling the contraction
ahead of the turbine via an impingement
plate. Afterwards, the air travels up-
stream.
The cross-sectional area of the cooling
channel is gradually reduced to counter-
balance the effect of the heat picked up
by the cooling air and to adjust the effec-
tiveness of the local cooling to the vary-
ing heat input from the hot gas. In addi-
tion, the heat transfer is enhanced by tur-
bulators at the cooling channel wall
[10,11].
shows the measured effectiveness
(ie, the dimensionless wall-metal tem-
perature on the hot-gas side) of the liner
cooling as a function of the coolant mass
flow function. The latter is defined as the
ratio of the heat capacity rate of the cool-
ing air to that of the hot gas wetted sur-
face, and therefore as the inverse of the
number of heat transfer units used in
heat-exchanger theory [12]. In high-
16
η
ψ
1.0
0.8
(–)
0.6
0.4
0.2
00 2 4 6 8 10(–)
q
0.8
0.6
0.4
0.2
00 1 2 3
η
Cooling effectiveness of the SEV liner, measured during the high-pressure test
η Cooling effectivenessψ Coolant mass flow function
MeasurementsIdeal trend
16 Axial development of the effectiveness of effusion cooling of the SEV burner, measured during the high-pressure test
η Cooling effectivenessq Local heat load parameter
Vortex generatorsFuel injectionMixing zoneBackward facing stepIdeal trend
17
G A S T U R B I N E S

A B B R e v i e w 4 / 1 9 9 8 13
pressure tests under real machine con-
ditions all the combustor liner tempera-
tures remained well below 800 °C, thus
providing empirical support for the mod-
elling of the heat transfer process.
After having cooled both liners of the
combustion chamber the air is dis-
charged into a plenum chamber sur-
rounding the SEV burners. This cavity
damps out all possible flow non-uniform-
ities ahead of the burner cooling so that
a common pre-pressure drives the effu-
sion cooling.
Effusion cooling, sometimes referred
as full coverage film cooling [12], is a
relatively recent development in combus-
tor cooling technology and has not been
used widely until now. A large number of
small, straight holes drilled in the single-
sheet wall to be cooled are arranged in
such a way that three basic heat transfer
mechanisms interact to ensure highly
effective cooling:
• Coolant film on the hot-gas side
• Internal convection inside the effusion
holes
• Heat transfer on the back wall where
the coolant enters the holes
An effusion cooling model has been pro-
posed [9] together with the key par-
ameters for correlating measured data
from effusion heat transfer experiments
with respect to the different heat transfer
effects.
Before the burner cooling design was
laid out this model was used to define
a basic test series under atmospheric
conditions; the cooling efficiency of differ-
ent effusion test plates was measured,
with subsequent variation in the par-
ameters affecting the different cooling
mechanisms. The influence of the longi-
tudinal vortices within the burner on the
development of the film cooling was
also investigated in detail. All the
measured data were correlated with
respect to the three different factors
contributing to heat transfer, as stated
above, in order to derive a physically
based layout guideline for effusion cool-
ing.
The local effusion hole spacing was
chosen to give an optimum balance be-
tween the internal heat transfer rate and
the film cooling effect, thus reducing the
temperature gradient across the burner.
The effusion jet to hot-gas momentum
ratio was kept below unity; the result is a
well-defined film development, while the
cooling jets are prevented from being
lifted off into the hot-gas stream. Be-
cause of the large area through which the
cooling air is effused and the good mixing
properties of the helical swirling motion
within the burner, mixing ahead of the
flame is highly uniform. An additional fea-
ture of this effusion cooling is the cold
and fuel-lean wall boundary layer, which
inherently prevents the flame from travel-
1 3
2
6
7
6ASection A-A
A
5 4
SEV combustor test rig
1 Gas inlet 4 Combustor 7 Two-burner sector2 Pressure vessel 5 Burner3 Gas exit 6 Fuel injector
18
G A S T U R B I N E S

14 A B B R e v i e w 4 / 1 9 9 8
ling upstream via the low velocity region
near the wall.
The effectiveness of the effusion cool-
ing within the SEV burner is shown in
with respect to the axial position as
measured in the high-pressure test with
real machine parts. The heat load par-
ameter is defined as the local coolant to
hot gas ratio of the heat transfer coef-
ficient times the wetted area. The related
burner wall temperatures all remained
well below 850 °C.
The combined result of this and the
convective liner cooling is a highly effec-
tive and very robust cooling system
with a cooling air consumption minimized
to only 1/10 of the combustor exit flow
rate.
Validation of the SEV combustion
chamber design
Tests were carried out in steps during the
development of the SEV combustor. Con-
ceptual tests and primary feasibility
studies were performed under atmos-
pheric pressure conditions to demon-
17
strate the feasibility of self-ignition. Sub-
sequent tests investigated the qualitative
influence of various parameters, such as
inlet conditions and different configu-
rations for the injectors and turbulence
generators.
The next step was to test at elevated
pressure to demonstrate the basic prin-
ciple of premixing and self-ignition under
machine conditions. NOx formation and
CO burn-out were also investigated dur-
ing these tests. The SEV combustor test
rig consists of two independent combus-
tors in a serial arrangement. The first
combustor acts as a hot gas generator
and simulates the SEV combustor inlet
conditions, while the second combustor
is the SEV arrangement to be tested.
The final design of the combustor was
validated using a two-sector, original-
sized test rig under real machine con-
ditions. Parts such as the burners, fuel
lances and liner segments were identical
with the real machine parts.
shows the high-pressure test rig
with the two-sector model of the SEV
combustor inside a pressure vessel. The
18
real inlet conditions were simulated by an
EV combustor feeding hot gas into the
SEV combustor. This arrangement allow-
ed the air pressure at the combustor inlet,
the air temperatures and the mass flows
to be adjusted correctly.
The measuring equipment consists of
thermocouples at several stations be-
tween the burner lance and the liner seg-
ments. Exhaust emissions could be
measured at three axial positions using
water-cooled integral probes, each with 5
holes located radially. The pressure drop
across the sampling holes was such that
quenching was ensured under all con-
ditions. Five probes were positioned at
different circumferential locations at the
combustor exit. The mixing section of the
burner, from the fuel injection point to the
combustor, could be observed by means
of a video system.
shows a view of the test rig with
the two combustors on the high-pressure
test facility. The tests were carried out for
conditions ranging from SEV ignition to
full load. Stable combustion inside the
combustor could be observed through-
out the operating range.
The NOx formed in the SEV combustor
is shown in in relation to the simulated
machine load. The units used are
gNOx/kgfuel, which gives the emission va-
lues without the influence of the O2-con-
tent of the exhaust gas. No NOx formation
was measured in the SEV combustor
under low-load conditions. NOx formation
increases up to about 1 g/kgfuel at 100 %
load.
To obtain the NOx emissions of the ma-
chine by extrapolating the NOx produced
by the SEV combustor, it is necessary to
consider the fuel mass flow rates of both
combustors. shows the expected en-
gine NOx emissions of the machine under
typical full-load conditions for assumed
EV combustor emissions of 18 and 12
vppm NOx. With no NOx produced in the
21
20
19
SEV combustor test rig with hot gas supplier (left) and SEV pressure vessel (right)
19
G A S T U R B I N E S

A B B R e v i e w 4 / 1 9 9 8 15
SEV combustor, the NOx emissions of the
EV combustor would be reduced from 18
vppm to 11 vppm. For an SEV NOx
formation of 1 gNOx/kgfuel the NOx emis-
sions of the machine are expected to be
15 vppm (15 % O2), based on the EV NOx
amount of 18 vppm.
These investigations clearly indicate
that there is a potential for reducing the
emissions to levels in the single digit
range.
The volume of the combustor has
been sized for good CO burn-out down
to low-load conditions using emission
measurements under real machine con-
ditions at several axial distances in an
initial test combustor. shows the
results of the subsequent two-sector
validation test results. The measured
UHC emissions are very low, as
shows.
23
22
NOX
P
3
2
1
0
–140
∆
60 80 100 120%
g/kgfuel
NOXGT
25
15
10
5
00 0.5 1.0 1.5 2.5
NOXSEV∆
vppm15% O2
g/kgfuel
Measured NOx formation in the SEV combustor in relation to the simulated machine load P(two-sector rig)
20 NOx emissions of machine as a function of the NOx
emissions of the SEV and EV combustors
NOxGT Gas turbine NOx emissions∆NOxSEV NOx production of SEV combustor
Red 18 vppm NOx assumed emitted by EV combustorGreen 12 vppm NOx assumed emitted by EV combustor
21
1000
100
10
1
0.1
CO
P
10080604020 %
vppm15% O2
1000
100
10
1
0.1
UHC
P
100908070605040 %
vppm15% O2
Measured carbon monoxide emissions (CO) under simulated machine load (P) conditions (two-sector rig)
22 Measured unburned hydrocarbon emissions (UHC) under simulated machine load (P) conditions (C3H8 , two-sector rig)
23
G A S T U R B I N E S

16 A B B R e v i e w 4 / 1 9 9 8
Summary
Sequential combustion was chosen for
the GT24/GT26 gas turbines in order to
achieve high cycle efficiency at mode-
rate turbine inlet temperatures as well
as optimum gas turbine exhaust tem-
peratures for the steam cycle in com-
bined cycle applications. The design
of the first combustor, the EV combus-
tor, is proven in more than 800,000 oper-
ating hours. The reliability of the sec-
ond combustor, the SEV combustor,
has been validated by several funda-
mental investigations as well as tests
using machine parts under real machine
conditions. These tests demonstra-
ted safe operation as well as low
NOx, CO and UHC emissions for this
design.
References
[1] M. Aigner, A. Mayer, P. Schiessel,
W. Strittmatter: Second generation low
emission combustors for ABB gas tur-
bines: tests under full engine conditions.
ASME 90-GT- 308, 1990.
[2] CFDS-FLOW3D, release 3.3: User
manual. AEA Technology, 1994, Harwell,
England.
[3] J. Baughn, M. Hoffmann, R. Taka-
hashi, B. Launder: Local heat transfer
downstream of an abrupt expansion in a
circular channel with constant wall heat
flux. Journal of Heat Transfer, 1984, vol
106, 789–796.
[4] R. W. Bilger: Turbulent jet diffusion
flames. Progress in energy and combus-
tion science, 1976, vol 1, 87–109.
[5] H. F. Coward, G. W. Jones: Limits of
flammability of gases and vapors. US
Bureau of Mines, Washington, 1976, bul-
letin 503.
[6] P. Dellenback, J. Sanger, D.
Metzger: Heat transfer in coaxial jet
mixing with swirled inner jet. Journal of
Heat Transfer, 1994, vol 116, 864–870.
[7] H. U. Frutschi: Advanced cycle sys-
tem with new GT24/GT26 turbines – his-
torical background. ABB Review 1/94,
21–25.
[8] S. S. Girimaji: Assumed beta-pdf
model for turbulent mixing: validation
and extension to multiple scalar mixing.
Comb Sci Tech, 1991, vol 78, 177–196.
[9] W. Hahn, G. Urner: Untersuchungen
zu effusions-gekühlten Brennkammerele-
menten. Brennstoff-Wärme-Kraft, 1994,
vol 46, no 12, 33–39.
[10] J. Han: Heat transfer and friction
characteristics in rectangular channels
with rib turbulators. ASME Journal of
Heat Transfer, 1988, vol 110, 321–328.
[11] J. Han, J. Park: Developing heat
transfer in rectangular channels with
rib turbulators. Int Journal of Heat and
Mass Transfer, 1988, vol 31, no 1,
183–195.
[12] W. M. Kays, M. E. Crawford: Con-
vective heat and mass transfer. McGraw-
Hill, New York, 1993.
[13] R. J. Kee, F. M. Rupley, J. A. Miller:
CHEMKIN-II: A Fortran chemical kinetics
package for the analysis of gas phase
chemical kinetics. Sandia Report
SAND89-8009B UC-706, 1989.
[14] T. Meindl, F. Farkas, R. Klussmann:
The development of a multistage com-
pressor for heavy duty industrial gas tur-
bines. ASME Houston, 95-GT-371, 1995.
[15] S .B. Pope: PDF methods for turbu-
lent reactive flows. Progress in Energy
and Combustion Science, 1985,
vol 11, 119–192.
[16] T. Sattelmayer, M. Felchlin, J.
Haumann, J. Hellat, D. Steyner: Second
generation low emission combustors for
ABB gas turbines: burner development
and tests at atmospheric pressure. ASME
90-GT-162, 1990.
[17] P. Senior, E. Lutum, W. Polifke, T.
Sattelmayer: Combustion technology of
the ABB GT13E2 annular combustor.
20th CIMAC G22 1993 London.
[18] L. J. Spadaccini, J. A. TeVelde:
Autoignition characteristics of aircraft
type fuels. Combustion and Flame 46:
283–300, 1982.
[19] L. J. Spadaccini, M. B. Colket:
Ignition delay characteristics of methane
fuels. Prog Energ Comb Sci, 1994, vol
20, 431–460.
[20] P. Zemanick, R. Dougall: Local heat
transfer downstream of abrupt circular
channel experiment. ASME Journal of
Heat Transfer, 1970, vol 92, 53–60.
Authors
Dr. Franz Joos
Philipp Brunner
Dr. Burkhard Schulte-Werning
Dr. Khawar Syed
ABB Power Generation Ltd
P.O. box
CH-5401 Baden
Switzerland
Telefax: +41 56 205 8254
E-mail:
Dr. Adnan Eroglu
ABB Corporate Research
Segelhof
CH-5405 Baden-Dättwil
Switzerland
Telefax: +41 56 486 7359
E-mail:
G A S T U R B I N E S