Gas Plus Groupir.gasplus.it/file_upload/1.GasPlus-Analyst... · EBT 4.4 (2.6) n.a. Net Result 3.1...
16
0 Gas Plus Group Analyst Presentation 1H 2019 Financial Results August 7 th , 2019* * This document is updated on 6 months basis, occurring after 31 December and 30 June closing
Transcript of Gas Plus Groupir.gasplus.it/file_upload/1.GasPlus-Analyst... · EBT 4.4 (2.6) n.a. Net Result 3.1...

0
Gas Plus Group
Analyst Presentation1H 2019 Financial Results
August 7th, 2019*
* This document is updated on 6 months basis, occurring after 31 December and 30 June closing

1
Agenda
▪ MARKET SCENARIO
▪ HIGHLIGHTS
▪ FINANCIAL RESULTS
1
2
3

2
Market Scenario
TTF Gas Price – Quarter AheadTTF Gas Price – Quarter Ahead TTF Gas Price – Quarter AheadEuro – Us Dollar Exchange rate
TTF Gas Price – Quarter AheadBrent Price TTF Gas Price – Quarter AheadBrent forward 1 year price

3
Agenda
▪ MARKET SCENARIO
▪ HIGHLIGHTS
▪ FINANCIAL RESULTS
1
2
3

4
Highlights
✓ Group EBITDA and EBIT growth (+13% and + 1,150% respectively), while EBT and Net Result returned positive (2018results affected by the full depreciation of two unsuccessful exploration wells in Romania)
✓ Contained NFP growth (+€ 10.2 M), notwithstanding € 21.4 M of Capex, thanks to positive cash flows
✓ Positive turn around in two of the main E&P development projects:
✓ In Italy: “Longanesi” project, after obtaining the authorization in Q4 2018, started the development phase, withthe engineering of the project and the procurement of the first Long Lead Items
✓ In Romania: “Midia Development Project”, development phase started after NAMR approval of the FieldDevelopment Plan, 2P reserves evaluated by independent Reserves Auditor at 725 MScm (>15% increase inGroup’s 2P reserves) for the 10% Gas Plus interest remaining after the FOA (transfer of 5% stake to the Operator)
✓ In Q1 2019 the Group acquired Rete Gas Fidenza Srl, a company operating in gas distribution in the second largest townof Parma district, following a successful bid in a tender with major competitors. The acquisition allowed N&T BU togrow both in terms of end users and pipeline length
✓ Corporate financing in place for new development projects: on August, 6th 2019 signed corporate financing for longterm facilities and Capex line related to the main E&P development projects

5
Agenda
▪ MARKET SCENARIO
▪ HIGHLIGHTS
▪ FINANCIAL RESULTS
1
2
3
E&P
RETAIL
NETWORK & TRANSPORTATION
STORAGE
GROUP FINANCIAL RESULTS
COMPANY PROFILE

6
Financial Results: E&P
E&P (MScme) 1H19 1H18 ∆ (%)
Hydrocarbon Production 73.1 68.0 7%
of which natural gas 57.6 57.7 (0%)
of which oil and condensate 15.5 10.3 50%
EBITDA (M€) 9.1 6.6 38%Exploration Capex 0.4 3.3 -88%
Development Capex 7.8 1.6 388%
▪ Domestic activities:
― “Longanesi” project: at the end of 2018 issued authorization decrees of the Ministry of Economic Development. Activities carried out in the 1H2019:• planning & engineering of the project• procurement of project’s Long Lead Items• set up of plant site
― Garaguso concession production ramp-up completed and stable from April (on yearly basis, ~25 MScm)
― Stable gas production as effect of 1Q19 reduced contribution of Garaguso and contingent interruption of another field
― Strong improvement of oil production of Cavone field after 2018 maintenance activities
▪ International activities:Offshore concession “Pelican XIII and MidiaShallow XV Blocks” ongoing:
― Development phase started, after National Agency for Mineral Resources (NAMR) approval of the Field Development Plan
― Executed 5% interest farmout and accounted the upfront and deferred price
― 2P reserves evaluated by an independent Reserves Auditor at 725 MScm for the 10% Gas Plus stake after farmout
▪ As of June 30th 2019, domestic and international 2P hydrocarbon reserves are 4.923 Mscme vs. 4.271 Mscme in 1H2018 (+15%)
TTF Gas Price – Quarter Ahead1H 2019 P&L - E&P contribution

7
Financial Results: Retail
TTF Gas Price – Quarter AheadP&L - Retail
Retail 1H19 1H18 ∆ (%)
Sales (MScm) 48.8 54.8 -10.9%
Residential 39.1 44.5 -12.1%
Small Business/Multipod 5.9 7.1 -16.9%
Industrial 3.8 3.2 18.8%
EBITDA (M€) 3.1 3.7 -16.2%
1H 2019 1H 2018
80%
12%8%
Residential
Small Business
Industrial
Sales: 48.8 MScm
81%
13%6%
Sales: 54.8 MScm
▪ EBITDA decrease due to:
― Sales reduction due to a negative thermal curve;
― Marginality decrease due to:• reduction of the marginality
of the “regulatory formula”, following the elimination of the GRAD authority component;
• reduction of the marginality of some clusters, in particular of the industrial and small business customers.
▪ Constant attention to limit the switch rate providing customized offers to meet the needs of the customers (both Residential and Small Business) and focusing on the most interesting areas.

8
Financial Results: Network & Transportation
TTF Gas Price – Quarter Ahead1H 2019 P&L – Network Contribution
1H19 1H18 ∆ (%)Distributed Volumes (MScm) 114.4 119.4 -4.2%
Direct end users (#K) 108.8 95.9 13.5%
Pipeline (Km) 1,764.5 1,561.7 13.0%
EBITDA (M€) 3.5 3.6 -2.8%Capex (M€) 12.9 0.7 +1,742.9%
1H19 1H18 ∆ (%)Transported Volumes (MScm) 5.5 5.9 -7%
Pipeline (Km) 41.8 41.8 0%
EBITDA (M€) 0.1 0.1 0%
TTF Gas Price – Quarter Ahead1H 2019 P&L – Transportation Contribution
▪ Stable EBITDA, since the acquisition in March of Rete Gas Fidenza Srl (RGF), a company operating in the gas distribution in the Municipality of Fidenza, had a small impact only in Q2 (usually a poor quarter in terms of distributed volumes)
▪ Strong Capex increase mainly due to the acquisition of RGF
▪ Thanks to the acquisition of RGF:
― Direct end users increase (+13.5%)
― Pipeline length increase (+13%).
▪ Evaluation of the new ATEM tenders in order, at least, to maintain the same perimeter of activities.

9
San Benedetto (AP)(84.7% Gas Plus)
Poggiofiorito (CH) (100% Gas Plus)
Sinarca (CB)(60% Gas Plus)
Financial Results: Storage
Three projects located in Central Italy,characterized by few storage sites, and in thesame area allowing for operational synergies:
SAN BENEDETTO (84,7% Gas Plus - Operator)
▪ EIA* obtained in June 2014, application for EIA duration extension ongoing.
POGGIOFIORITO (100% Gas Plus)
▪ EIA obtained in June 2014, application for EIA duration extension ongoing.
SINARCA (60% Gas Plus - Operator)
▪ Final authorization obtained. Technical and economic evaluation ongoing
(*): Administrative claims related to the EIA issuing; refer to 2019 half-yearly report for more information

10
Financial Results
TTF Gas Price – Quarter Ahead1H 2019 – Group P&L
Group (M€) 1H19 1H18 ∆ (%)Revenues 52.1 48.0 9%Operating Costs 37.4 35.0 7%EBITDA 14.7 13.0 13%EBIT 5.0 0.4 1 150%EBT 4.4 (2.6) n.a.Net Result 3.1 (2.1) n.a.EPS (€) 0.07 (0.05) n.a.
52,1 48,0
14,7 13,0
1H2019 1H2018
Revenues EBITDA
▪ Growth in:
― revenues, thanks to E&P production sales (due to higher hydrocarbon production) and Retail gas sales (due to higher selling price)
― operating costs only due to higher gas supply costs of retail activities
▪ Increase in EBITDA thanks to the improvement of E&P activities results and in EBIT (2018 results affected by the full amortization of two dry wells in Romania)
▪ Positive net result of € 3.1 vs -2.1 of 1H18 after the transfer of the 5% stake in the MidiaProject and the strong reduction in financial charges

11
Financial Results
TTF Gas Price – Quarter AheadEBITDA Breakdown by BU (M€) TTF Gas Price – Quarter AheadGroup Net Result Evolution (M€)
TTF Gas Price – Quarter AheadGroup Ebitda Evolution (M€) TTF Gas Price – Quarter AheadNet Financial Charges Evolution (M€)
6.6 9.13.7
3.63.73.1
-1.0 -1.1
1H18 1H19
E&P Network Retail Other
13.0 14.7
-2.1
1.72.9
0.5
1.9
-1.8
3,1
1H18 EBITDA D&A FinancialCharges
Other Taxes 1H19
13.0
2.5
-0.1 -0.6 -0.1
14.7
1H 18 E&P Network Retail Other 1H 19
-0.3 -0.3
-1.1-0.6
-1.9
-1.6
-0.1
-0.2
1H18 1H19Short Term Financial Charges Long Term Financial Charges Charges on Funds NPVOther Financial Charges Financial Revenues
(3.3) (2.7)
12
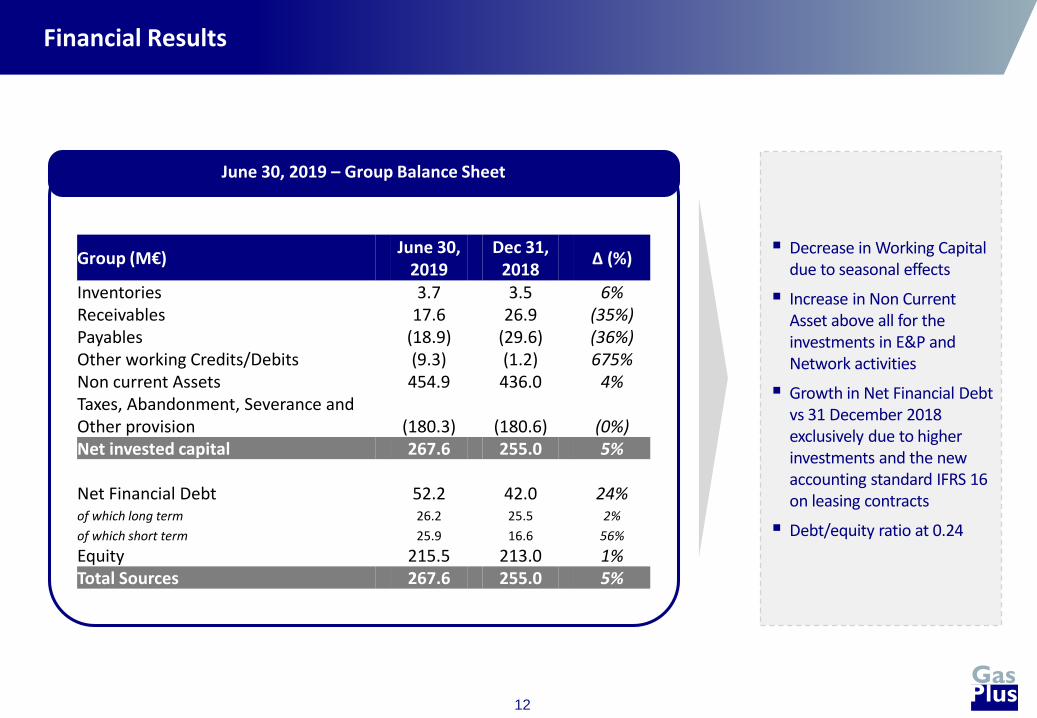
▪ Decrease in Working Capital due to seasonal effects
▪ Increase in Non Current Asset above all for the investments in E&P and Network activities
▪ Growth in Net Financial Debt vs 31 December 2018 exclusively due to higher investments and the new accounting standard IFRS 16 on leasing contracts
▪ Debt/equity ratio at 0.24
Financial Results
TTF Gas Price – Quarter AheadJune 30, 2019 – Group Balance Sheet
Group (M€)June 30,
2019Dec 31,
2018∆ (%)
Inventories 3.7 3.5 6%Receivables 17.6 26.9 (35%)Payables (18.9) (29.6) (36%)Other working Credits/Debits (9.3) (1.2) 675%Non current Assets 454.9 436.0 4%Taxes, Abandonment, Severance and Other provision (180.3) (180.6) (0%)Net invested capital 267.6 255.0 5%
Net Financial Debt 52.2 42.0 24%of which long term 26.2 25.5 2%
of which short term 25.9 16.6 56%
Equity 215.5 213.0 1%Total Sources 267.6 255.0 5%

13
Financial Results: NFP Trend
TTF Gas Price – Quarter AheadGroup NFP Historical Trend (M€)
TTF Gas Price – Quarter AheadGroup NFP Evolution (M€)
250.6212.9
150.598.6
71.241.1 53.0 52.5 42.0 52.2
Dec 10 Dec 11 Dec 12 Dec 13 Dec 14 Dec 15 Dec 16 Dec 17 Dec 18 Jun 19
34.1
-16.9
28.0
0.0 6.1 0.9
52.2
PFN 1H18 OperatingCash Flows
NetInvestments
Dividends IFRS 16 Other PFN 1H19
▪ NFP remained at low levels but affected by both the higher investments and the effects of the new accounting standard IFRS 16 on leasing contracts
▪ The positive operating cash flows mitigated the NFP growth
▪ After the end of 1H19 the signing of a new loan agreement enabled the Group to extend the existing debt duration and increase available cash resources for investments

14
Company Profile
Shareholding as at 30 June 2019 Share information
N. of share: 44.909.620
Share price as of 28.06.2019: € 2.0500
Share price as of 06.08.2019: € 2.1387
Mkt cap 28.06.2019: € 92.1 million
Italian Stock Exchange – segment MTA
Own shares as of 28.06.2019: 1.336.677
Share price performance
Group structure* Management
Cinzia Triunfo
Achille Capelli
Davide Usberti
Lino Gilioli
Massimo Nicolazzi
Chairman and CEO Gas Plus S.p.A.
VP and Lead Independent Director Gas Plus S.p.A.
Network Manager
Group General Manager and Director of Gas Plus S.p.A.
Executive VP Gas Plus International B.V. (E&P Int. Activities)
Regulated Activity - Network
Leonardo Dabrassi Chairman – GP Infrastrutture S.r.l
Germano Rossi Group CFO
73,94%
15,51%
2,98%
7,57%
Us.Fin. Srl Findim S.A.
Treasury Shares Floating
100%Società Padana
Energia SpA
Gas Plus S.p.A.
Gas PlusItaliana Srl
Gas PlusVendite Srl
Gas PlusInternational BV
100%
Reggente SpA
81,6%
85.29%
Gas PlusStorage Srl
GP InfrastruttureSrl
Gas PlusEnergia Srl
Gas PlusInternational Holding Srl
Exploration & Production Retail StorageNetwork &
Infrastructures Other
Co
mp
any
BU
Idrocarburi Italiana Srl
100%
Gas PlusNetherlands BV
Gas PlusDacia Srl
100% 100%
100%
0,00025%99,9
9975
%
E&P BU Italy E&P BU International
100% 100% 100%
GP InfrastruttureTrasporto Srl
Rete Gas Fidenza Srl
100%
100%
(*): Gas Plus Group Structure as of 30 June 2019

15
Disclaimer
This presentation contains forward-looking statements concerning the financial condition, results of operations and businesses ofGas Plus. All statements other than statements of historical fact are, or may be deemed to be, forward-looking statements.Forward-looking statements are statements of future expectations that are based on management’s current expectations andassumptions and involve known and unknown risks and uncertainties that could cause actual results, performance or events todiffer materially from those expressed or implied in these statements. Forward-looking statements include, among other things,statements concerning the potential exposure of Gas Plus to market risks and statements expressing management’s expectations,beliefs, estimates, forecasts, projections and assumptions. These forward-looking statements are identified by their use of termsand phrases such as ‘‘anticipate’’, ‘‘believe’’, ‘‘could’’, ‘‘estimate’’, ‘‘expect’’, ‘‘intend’’, ‘‘may’’, ‘‘plan’’, ‘‘objectives’’, ‘‘outlook’’,‘‘probably’’, ‘‘project’’, ‘‘will’’, ‘‘seek’’, ‘‘target’’, ‘‘risks’’, ‘‘goals’’, ‘‘should’’ and similar terms and phrases. There are a number offactors that could affect the future operations of Gas Plus and could cause those results to differ materially from those expressed inthe forward-looking statements included in this Report, including (without limitation): (a) price fluctuations in crude oil and naturalgas; (b) changes in demand for the Group’s products; (c) currency fluctuations; (d) drilling and production results; (e) reserveestimates; (f) loss of market and industry competition; (g) environmental and physical risks; (h) risks associated with theidentification of suitable potential acquisition properties and targets, and successful negotiation and completion of suchtransactions; (i) the risk of doing business in developing countries and countries subject to international sanctions; (j) legislative,fiscal and regulatory developments including potential litigation and regulatory effects arising from re-categorisation of reserves;(k) economic and financial market conditions in various countries and regions; (l) political risks, project delay or advancement,approvals and cost estimates; and (m) changes in trading conditions.All forward-looking statements contained in this presentation are expressly qualified in their entirety by the cautionary statementscontained or referred to in this section. Readers should not place undue reliance on forward-looking statements. Each forward-looking statement speaks only as of the date of this presentation. Neither Gas Plus nor any of its subsidiaries undertake anyobligation to publicly update or revise any forward-looking statement as a result of new information, future events or otherinformation. In light of these risks, results could differ materially from those stated, implied or inferred from the forward-lookingstatements contained in this presentation.