Gas Market gas weekly report... · Web viewAn Amber LCA flag on the Bulletin Board indicates actual...
19
Gas Market Report 5 – 11 February 2017 Weekly Summary Prices increased across all markets from the previous week. Continued high prices in Queensland and rising prices in New South Wales were supported by strong gas demand by gas power generators (GPGs). Over all regions, the total GPG usage reached its highest level since mid-2016, alongside high maximum temperatures across the east coast. Trade volumes on the Wallumbilla Gas Supply Hub Exchange (GSH) reduced by 77 per cent, but with record prices of up to $16.20/GJ. Over the last few months GSH prices (and Brisbane STTM prices) continue to be a few dollars higher than LNG spot netback prices. Long term statistics and explanatory material The AER has published an explanatory note to assist with interpreting the data presented in its weekly gas market reports. The AER also publish a range of longer term statistics on the performance of the gas sector including gas prices, production, pipeline flows and consumer demand. Market overview Figure 1 sets out the average daily prices ($/GJ) for the current week, and demand levels, compared to historical averages. Regions shown include the Victorian Declared Wholesale Market (VGM or Victorian gas market) and for the Sydney (SYD), Adelaide (ADL) and Brisbane (BRI) Short Term Trading Market hubs (STTM). Price and demand information is also shown for the voluntary Wallumbilla and Moomba Gas Supply Hubs (GSH). © Commonwealth of Australia 1 AER reference: 39270 – D17/24323
Transcript of Gas Market gas weekly report... · Web viewAn Amber LCA flag on the Bulletin Board indicates actual...

Gas Market Report
5 – 11 February 2017Weekly SummaryPrices increased across all markets from the previous week. Continued high prices in Queensland and rising prices in New South Wales were supported by strong gas demand by gas power generators (GPGs). Over all regions, the total GPG usage reached its highest level since mid-2016, alongside high maximum temperatures across the east coast. Trade volumes on the Wallumbilla Gas Supply Hub Exchange (GSH) reduced by 77 per cent, but with record prices of up to $16.20/GJ. Over the last few months GSH prices (and Brisbane STTM prices) continue to be a few dollars higher than LNG spot netback prices.
Long term statistics and explanatory materialThe AER has published an explanatory note to assist with interpreting the data presented in its weekly gas market reports. The AER also publish a range of longer term statistics on the performance of the gas sector including gas prices, production, pipeline flows and consumer demand.
Market overviewFigure 1 sets out the average daily prices ($/GJ) for the current week, and demand levels, compared to historical averages. Regions shown include the Victorian Declared Wholesale Market (VGM or Victorian gas market) and for the Sydney (SYD), Adelaide (ADL) and Brisbane (BRI) Short Term Trading Market hubs (STTM). Price and demand information is also shown for the voluntary Wallumbilla and Moomba Gas Supply Hubs (GSH).
Figure 1: Average daily prices and demand – all markets ($/GJ, TJ)1
Victoria Sydney Adelaide Brisbane Wallumbilla Moomba
Price Demand Price Demand Price Demand Price Demand Price Quantity Price Quantity
05 Feb - 11 Feb 2017 10.20 328 11.88 225 10.93 49 13.90 79 14.68 63 - -
% change from previous week 15 7 23 -1 22 5 16 -3 19 -77 - -
16-17 financial YTD 7.93 559 7.72 246 8.46 63 8.01 84 8.33 5939 - -
% change from previous financial YTD
82 -2 68 4 64 2 105 -4 126 8 - -
1 Average daily quantities are displayed for each region, with the exception of Gas Supply Hubs (GSH). The weighted average daily imbalance price applies for Victoria. The prices shown for the GSH in Wallumbilla and Moomba are volume weighted average prices for all products traded across the period. The total quantity contributing to the weighted price is displayed for these GSH.
© Commonwealth of Australia 1 AER reference: 39270 – D17/24323

Figure 2 illustrates the daily prices in each gas market, as defined in figure 1.
Figure 2: Daily gas market prices ($/GJ)
0
2
4
6
8
10
12
14
16
18
5 Feb 6 Feb 7 Feb 8 Feb 9 Feb 10 Feb 11 Feb
$/G
J
Sydney (Ex ante STTM) Adelaide (Ex ante STTM) Brisbane (Ex ante STTM)
Victoria (6am DWGM) Wallumbilla (VWA) Moomba (VWA)
Figure 3 compares average ancillary market payments (VGM) and balancing gas service payments (STTM) against historical averages.
Figure 3: Average ancillary payments ($000)
Victoria Ancillary Payments*
Sydney MOS
Adelaide MOS
Brisbane MOS
05 Feb - 11 Feb 2017 - 61.64 4.22 1.59
% change from previous week - 54 -25 41
16-17 financial YTD 55.98 22.56 1.59
% change from previous financial YTD 80 166 -2
* Ancillary payments reflect the compensation costs for any additional injections offered at a price higher than the market price. Note: only positive ancillary payments, reflecting system constraints will be shown here.
More detailed analysis on the VGM is provided in section 1.
2

Figure 4 shows the quantity and volume weighted prices of products traded in the Gas Supply Hub locations at Wallumbilla and Moomba.
Figure 4: Gas supply hub products traded for the current week ($/GJ, TJ)*
RBP SWQP MAP MSP QGP
VWA price
Quantity
VWA price
Quantity
VWA price
Quantity
VWA price
Quantity
VWA price
Quantity
Balance of day 14.80 4.2 13.50 16.2 - - - - - -
Daily 15.25 20.0 14.90 5.0 - - - - - -
Day ahead 15.13 15.0 14.43 3.0 - - - - - -
Weekly - - - - - - - - - -
Monthly - - - - - - - - - -
* Non-netted products are not shown here. For information about these products, refer to figure 6.1.
Figure 5 shows Bulletin Board pipeline flows for the three LNG export pipeline facilities and the production output at related production facilities in the Roma region.
Figure 5: LNG export pipeline and production flows (TJ)*
0
200
400
600
800
1000
1200
1400
1600
1800
5 Feb 6 Feb 7 Feb 8 Feb 9 Feb 10 Feb 11 Feb
TJ
APLNG production facilities Santos production facilities QGC production facilities
APLNG Pipeline GLNG Gas Transmission Pipeline Wallumbilla to Gladstone Pipeline
* Production quantities represent flows from facilities operated by APLNG, Santos and QGC in the Roma region. Gas from individual facilities may also supply the domestic market, other LNG projects or storage facilities.
3

Detailed market analysisHigh Gas Power Generation (GPG) Demand
High gas demand from GPG continued in Queensland averaging 289 TJ/d, whilst increasing by approximately 87 per cent in New South Wales to above 100 TJ/d. Flows out of Victoria into New South Wales through the interconnect near Albury/Wodonga were just short of record flow rates achieved in January 2017 (see figure 5.1).
GPG demand was driven by continuing high temperatures across the east coast, with Brisbane experiencing a streak of days above 30 degrees since early January.2 In South Australia, maximum temperatures were above 40 degrees over three consecutive days from 8 February.
Collectively, this amounted to the highest GPG demand level in the National Electricity Market (NEM) since the start of winter last year at an estimated 747 TJ/d. 3
High Gas Market prices
High daily GPG usage levels in NSW from 9 to 11 February (151–206 TJ) drove higher gas market prices in the Sydney hub (from $12.67–$15.95/GJ), as significant back haul quantities were traded through the market including to service GPG. On 9 February, there was 59 TJ of back haul allocated on the Eastern Gas Pipeline (EGP), with participants renominating “backhaul” flows with deliveries 44 TJ higher on-the-day compared to scheduled.
In Adelaide, gas prices increased to $12.60/GJ on Thursday and reached over $14/GJ on the following days. A constraint at the Coomandook compressor near Adelaide led to an amber flag4 being raised for flows on the SEAGas pipeline for the 9 February gas day, as record flow levels exceeded the standing capacity of the pipeline. This too, occurred as the region reached its highest GPG gas usage level for the week (351 TJ).
Prices in Brisbane were consistently highest across all markets averaging $13.90/GJ. The adjacent Wallumbilla upstream gas supply hub exchange (GSH) price was slightly higher still at $14.60/GJ. The GSH can service large gas generation demand outside the Brisbane market so prices will not necessarily “align” with the downstream Brisbane price which incorporates only a 70 TJ subset of Queensland demand.
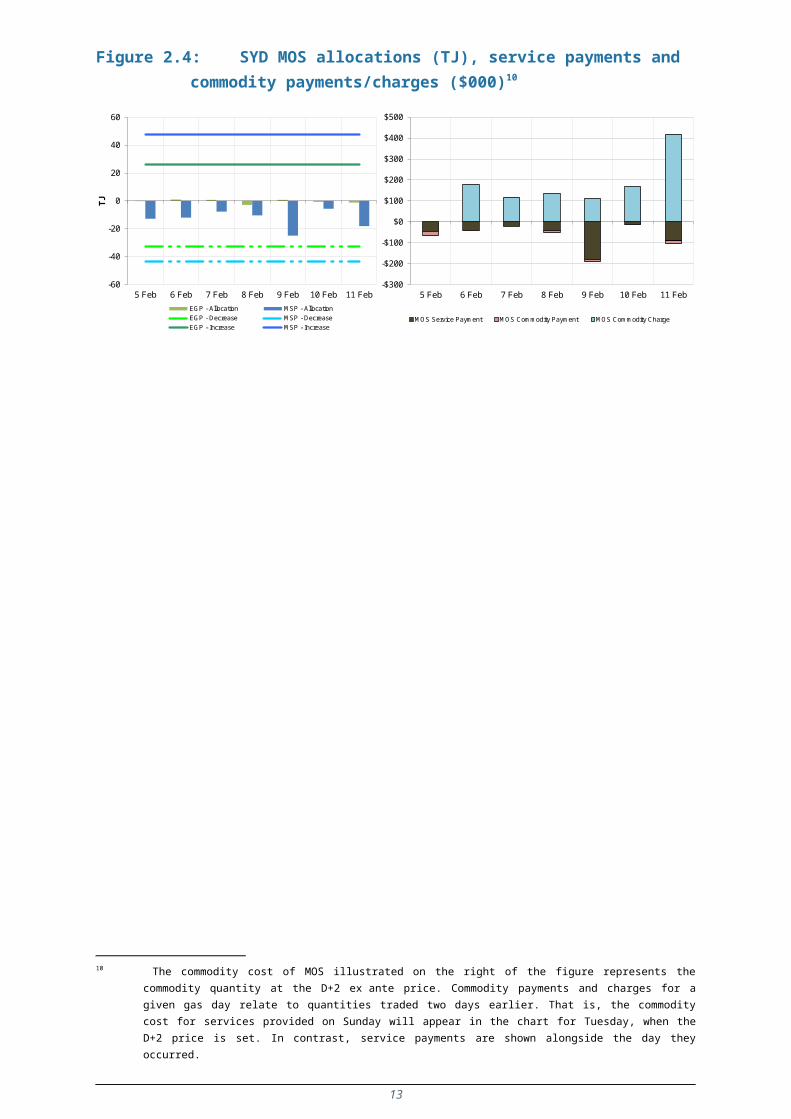
High MOS payment in Sydney
Demand forecasting error contributed to high MOS payments on 9 and 11 February, reaching $179,105 and $91,234 respectively. The MOS Service requirement on 9 February was largely driven by over forecasting.
Longford production flow dips
In the Victorian market, flows at Longford were constrained to a maximum of 438.5 TJ/day and 450 TJ/day on 7 and 9 February respectively. These constraints were applied after the commencement of each gas day and manifested in production dips and higher next schedule prices (see figures 1.1 and 1.5).
2 Since 8 January, Brisbane has only experienced one day where the maximum didn’t reach 30 degrees, while other areas further inland have faced even warmer temperatures over the same period,
3 GPG demand is estimated based on NEM generator output and estimated heat rates of converting gas to electricity4 An Amber LCA flag on the Bulletin Board indicates actual or potential load shedding of interruptible gas customers
on non-Victorian pipelines.
4

Detailed Market Figures
1. Victorian Declared Wholesale MarketIn the Victorian gas market, gas is priced five times daily at 6 am, 10 am, 2 pm, 6 pm and 10 pm. The imbalance weighted price on a gas day tends towards the 6 am price5 which is the schedule at which most gas is traded.
The main drivers6 of price are demand forecasts and bids to inject or withdraw gas from the market. Figures 1.1 to 1.4 below show the daily prices, demand forecasts7, and injection/withdrawal bids for each of the five pricing schedules. Figure 1.5 provides information on which system injection points were used to deliver gas, in turn indicating the location and relative quantity of gas injection bids cleared through the market.
Ancillary payments for gas injected above the market price are shown above in figure 3.
Figure 1.1: Prices by schedule ($/GJ)
02468
10121416
5 Feb 6 Feb 7 Feb 8 Feb 9 Feb 10 Feb 11 Feb
$/G
J
6am 10am 2pm 6pm 10pm Daily Imbalance Weighted Average Price
Figure 1.2: Demand forecasts (TJ)
0
100
200
300
400
500
5 Feb 6 Feb 7 Feb 8 Feb 9 Feb 10 Feb 11 Feb
TJ
6am 10am 2pm 6pm 10pm
5 Prices for subsequent schedules are applied only to the differences in scheduled quantities (imbalances) to calculate the weighted price. The 6 am price applies to the entire scheduled quantity in the initial schedule.
6 The price might also be affected by transmission or production (contractual) constraints limiting how much gas can be delivered from a locale or System Injection Point (SIP) from time to time.
7 These are Market Participants’ aggregate demand forecasts adjusted for any override as applied by AEMO from time to time. These forecasts must be scheduled and cannot respond to price like withdrawal bids.
5

Figure 1.3: Injection bids by price bands (TJ)
0
200
400
600
800
1000
1200
1400
1600
1800
2000
6am
10am 2p
m6p
m10
pm 6am
10am 2p
m6p
m10
pm 6am
10am 2p
m6p
m10
pm 6am
10am 2p
m6p
m10
pm 6am
10am 2p
m6p
m10
pm 6am
10am 2p
m6p
m10
pm 6am
10am 2p
m6p
m10
pm
5 Feb 6 Feb 7 Feb 8 Feb 9 Feb 10 Feb 11 Feb
5/02/2017 6/02/2017 7/02/2017 8/02/2017 9/02/2017 10/02/2017 11/02/2017
TJ
$0 <=$1 <=$2 <=$4 <=$6 <=$8 <=$10 <=$40 <=$100 <=$200 <=$300 <=$400 <=$600 <=$800
Figure 1.4: Withdrawal bids by price bands (TJ)
050
100150200250300350400450500550
6am
10am 2p
m6p
m10
pm 6am
10am 2p
m6p
m10
pm 6am
10am 2p
m6p
m10
pm 6am
10am 2p
m6p
m10
pm 6am
10am 2p
m6p
m10
pm 6am
10am 2p
m6p
m10
pm 6am
10am 2p
m6p
m10
pm
5 Feb 6 Feb 7 Feb 8 Feb 9 Feb 10 Feb 11 Feb
5/02/2017 6/02/2017 7/02/2017 8/02/2017 9/02/2017 10/02/2017 11/02/2017
TJ
<=$800 <=$600 <=$400 <=$300 <=$200 <=$100 <=$40 <=$10 <=$8 <=$6 <=$4 <=$2 <=$1
Figure 1.5: Metered Injections by System Injection Point (TJ)
0
20
40
60
80
100
120
6am
10am 2p
m6p
m10
pm 2am
6am
10am 2p
m6p
m10
pm 2am
6am
10am 2p
m6p
m10
pm 2am
6am
10am 2p
m6p
m10
pm 2am
6am
10am 2p
m6p
m10
pm 2am
6am
10am 2p
m6p
m10
pm 2am
6am
10am 2p
m6p
m10
pm 2am
5 Feb 6 Feb 7 Feb 8 Feb 9 Feb 10 Feb 11 Feb
5/02/2017 6/02/2017 7/02/2017 8/02/2017 9/02/2017 10/02/2017 11/02/2017
TJ
Bass Gas Longford Culcairn Iona Mortlake Otway SEA Gas VicHub
Note that in figure 1.5, the last 8-hour schedule from 10 pm has been separated into two 4-hour blocks to provide a consistent comparison with earlier scheduled injection volumes.
6

2. Sydney STTMIn each STTM hub, a daily gas price is calculated before the gas day (the ex ante price) and after the gas day (the ex post price). The main drivers of these prices are participant demand forecasts, and offers to inject or bids to withdraw gas traded at the hub.8 Divergences in ex ante and ex post prices for a gas day may occur due to differences in scheduled (forecast) and allocated (actual) quantities. Pipeline acronyms are defined in the user guide.
Market Operator Service balancing gas (MOS) payments arise because the amount of gas nominated on pipelines for delivery on a gas day will either exceed or fall short, by some amount, of the amount of gas consumed in the hub. In such circumstances, MOS payments are made to participants for providing a service to park gas on a pipeline or to loan gas from a pipeline to the hub.9
Figures 2.1 and 2.2 show daily prices, demand, offers and bids. Figures 2.3 and 2.4 show gas scheduled and allocated on pipelines to supply the hub, indicating the location and relative quantity of gas offers across pipelines and also the amount of MOS allocated for each pipeline.
Figure 2.1: SYD STTM daily ex ante and ex post prices and quantitiesSun Mon Tue Wed Thu Fri Sat
Ex ante price ($/GJ) 9.46 9.41 9.12 11.20 14.50 12.67 16.79
Ex ante quantity (TJ) 209 238 247 230 232 207 214
Ex post price ($/GJ) 8.49 8.49 8.37 9.97 17.75 16.40 14.70
Ex post quantity (TJ) 196 227 239 216 250 215 203
Figure 2.2: SYD daily hub offers and daily hub bids in price bands ($/GJ)
0
50
100
150
200
250
300
350
400
450
500
5 Feb 6 Feb 7 Feb 8 Feb 9 Feb 10 Feb 11 Feb
Bid
s (T
J)
0
100
200
300
400
500
600
700
5 Feb 6 Feb 7 Feb 8 Feb 9 Feb 10 Feb 11 Feb
Offe
rs (T
J)
Pricetaker 0 <= 0.50 <= 1 <= 1.50 <= 2 <= 3 <= 4 <= 6
<= 8 <= 10 <= 40 <= 100 <= 300 <= 399 <= 399.50 <= 400 Scheduled
8 The main driver of the amount of gas scheduled on a gas day is the ‘price-taker’ bid, which is forecast hub demand that cannot respond to price and which must be delivered, regardless of the price.
9 MOS service payments involve a payment for a MOS increase service when the actual quantity delivered exceeds final gas nominations for delivery to a hub, and a payment for a MOS decrease service when the actual quantity delivered is less than final nominations. As well as a MOS ‘service’ payment, as shown in figure 2.4, MOS providers are paid for or pay for the quantity of MOS sold into the market or bought from the market (MOS ‘commodity’ payments/charges).
7

Figure 2.3: SYD net scheduled and allocated gas hub supply (excluding MOS)
0
50
100
150
200
250
Sched Alloc Sched Alloc Sched Alloc Sched Alloc Sched Alloc Sched Alloc Sched Alloc
5 Feb 6 Feb 7 Feb 8 Feb 9 Feb 10 Feb 11 Feb
5/02/2017 6/02/2017 7/02/2017 8/02/2017 9/02/2017 10/02/2017 11/02/2017
TJ
EGP MSP ROS NGS
Figure 2.4: SYD MOS allocations (TJ), service payments and commodity payments/charges ($000)10
-60
-40
-20
0
20
40
60
5 Feb 6 Feb 7 Feb 8 Feb 9 Feb 10 Feb 11 Feb
TJ
EGP - Allocation MSP - AllocationEGP - Decrease MSP - DecreaseEGP - Increase MSP - Increase
-$300
-$200
-$100
$0
$100
$200
$300
$400
$500
5 Feb 6 Feb 7 Feb 8 Feb 9 Feb 10 Feb 11 Feb
MOS Service Payment MOS Commodity Payment MOS Commodity Charge
10 The commodity cost of MOS illustrated on the right of the figure represents the commodity quantity at the D+2 ex ante price. Commodity payments and charges for a given gas day relate to quantities traded two days earlier. That is, the commodity cost for services provided on Sunday will appear in the chart for Tuesday, when the D+2 price is set. In contrast, service payments are shown alongside the day they occurred.
8

3. Adelaide STTMThe Adelaide STTM hub functions in the same way as the Sydney STTM hub. The same data that was presented for the Sydney hub is presented for the Adelaide hub in the figures below.
Figure 3.1: ADL STTM daily ex ante and ex post prices and quantitiesSun Mon Tue Wed Thu Fri Sat
Ex ante price ($/GJ) 8.68 8.68 8.85 9.50 12.60 14.10 14.10
Ex ante quantity (TJ)
39 52 51 48 52 52 47
Ex post price ($/GJ) 8.22 8.68 8.75 10.39 12.60 14.10 13.75
Ex post quantity (TJ)
39 51 50 53 51 52 45
Figure 3.2: ADL daily hub offers and daily hub bids in price bands ($/GJ)
0
20
40
60
80
100
120
5 Feb 6 Feb 7 Feb 8 Feb 9 Feb 10 Feb 11 Feb
Bid
s (T
J)
0
50
100
150
200
250
300
5 Feb 6 Feb 7 Feb 8 Feb 9 Feb 10 Feb 11 Feb
Offe
rs (T
J)
Pricetaker 0 <= 0.50 <= 1 <= 1.50 <= 2 <= 3 <= 4 <= 6 <= 8 <= 10 <= 40 <= 100 <= 300 <= 399 <= 399.50 <= 400 Scheduled
Figure 3.3: ADL net scheduled and allocated gas hub supply (excluding MOS)
0
20
40
60
Sched Alloc Sched Alloc Sched Alloc Sched Alloc Sched Alloc Sched Alloc Sched Alloc
5 Feb 6 Feb 7 Feb 8 Feb 9 Feb 10 Feb 11 Feb
5/02/2017 6/02/2017 7/02/2017 8/02/2017 9/02/2017 10/02/2017 11/02/2017
TJ
MAP SEAGAS
9

Figure 3.4: ADL MOS allocations (TJ), service payments and commodity payments/charges ($000)
-50
-40
-30
-20
-10
0
10
20
30
40
5 Feb 6 Feb 7 Feb 8 Feb 9 Feb 10 Feb 11 Feb
TJ
MAP - Allocation SEAGAS - AllocationMAP - Decrease SEAGAS - DecreaseMAP - Increase SEAGAS - Increase
-$15
-$10-$5
$0$5
$10$15
$20$25
$30$35
5 Feb 6 Feb 7 Feb 8 Feb 9 Feb 10 Feb 11 Feb
MOS Service Payment MOS Commodity Payment MOS Commodity Charge
4. Brisbane STTMThe Brisbane STTM hub functions in the same way as the Sydney STTM hub. The same data that was presented for the Sydney hub is presented for the Brisbane hub in the figures below.
Figure 4.1: BRI STTM daily ex ante and ex post prices and quantitiesSun Mon Tue Wed Thu Fri Sat
Ex ante price ($/GJ) 10.11 13.52 14.00 14.10 14.69 15.39 15.50
Ex ante quantity (TJ)
68 82 85 89 83 77 68
Ex post price ($/GJ) 14.10 13.52 13.03 13.03 14.69 15.00 14.99
Ex post quantity (TJ)
73 83 79 82 80 74 63
Figure 4.2: BRI daily hub offers and daily hub bids in price bands ($/GJ)
0
20
40
60
80
100
120
140
5 Feb 6 Feb 7 Feb 8 Feb 9 Feb 10 Feb 11 Feb
Bid
s (T
J)
020406080
100120140160180200
5 Feb 6 Feb 7 Feb 8 Feb 9 Feb 10 Feb 11 Feb
Offe
rs (T
J)
Pricetaker 0 <= 0.50 <= 1 <= 1.50 <= 2 <= 3 <= 4 <= 6 <= 8 <= 10 <= 40 <= 100 <= 300 <= 399 <= 399.50 <= 400 Scheduled
10

Figure 4.3: BRI net scheduled and allocated gas hub supply (excluding MOS)
020406080
100
Sched Alloc Sched Alloc Sched Alloc Sched Alloc Sched Alloc Sched Alloc Sched Alloc
5 Feb 6 Feb 7 Feb 8 Feb 9 Feb 10 Feb 11 Feb
5/02/2017 6/02/2017 7/02/2017 8/02/2017 9/02/2017 10/02/2017 11/02/2017
TJ
RBP
Figure 4.4: BRI MOS allocations (TJ), service payments and commodity payments/charges ($000)
-50
-40
-30
-20
-10
0
10
20
30
40
5 Feb 6 Feb 7 Feb 8 Feb 9 Feb 10 Feb 11 Feb
TJ
RBP - Allocation RBP - Decrease RBP - Increase
-$10
-$5
$0
$5
$10
$15
$20
$25
$30
$35
$40
5 Feb 6 Feb 7 Feb 8 Feb 9 Feb 10 Feb 11 Feb
MOS Service Payment MOS Commodity Payment MOS Commodity Charge
5. National Gas Bulletin BoardFigure 5.1 shows average daily actual flows for the current week11 from the Bulletin Board (changes from the previous week’s average are shown in brackets). Average daily prices12 are provided for gas markets and gas supply hubs. Average daily quantities are provided for gas powered generation for each region.
11 Domestic gas flows are calculated as the total of: SA = MAP + SEAGAS; VIC = SWP + LMP + (absolute quantity of negative flows only on the ‘NSW-VIC interconnect’); NSW/ACT = EGP + MSP; TAS = TGP; QLD (Brisbane) = RBP; QLD (Mt Isa) = CGP; and QLD (Gladstone) = QGP. Export gas flows are calculated as the total of: the APLNG pipeline; the GLNG pipeline; and the Wallumbilla to Gladstone pipeline.GPG volumes may include gas usage that does not show up on Bulletin Board pipeline flows.
12 GSH supply is the average daily volume of gas ‘traded’, while price is a volume weighted average. Optional hub services (for compression and redirection) are shown separately from commodity trades.
11

Figure 5.1: Gas market data ($/GJ, TJ); Bulletin Board flows (TJ)13
13 Net flows are shown for Bulletin Board facilities, as outlined in the user guide.
12
6. Gas Supply HubThe gas supply hub was established at Wallumbilla in March 2014 to facilitate the voluntary trading of gas between participants, with products listed for sale and purchase at delivery points on three major connecting pipelines at Wallumbilla – the QGP, the SWQP and the RBP. There are separate products for each pipeline (trading location) and delivery period (daily, day-ahead, balance-of-day, weekly and monthly products).14
The Moomba hub commenced operation from June 2016 to further facilitate trading on the MAP and MSP, with trading between the two hubs on the SWQP via a spread product (representing the price differential between the hubs). From October 2016, the addition of a Wallumbilla Compression Product was introduced to facilitate the supply hub’s transition from three different trading locations into one.
There were 12 trades this week for 63.4 TJ of gas at a volume weighted price of $14.68/GJ in the Wallumbilla hub. Trades consisted of balance-of-day, daily and day ahead trades on each pipeline (39.2 TJ on RBP at $15.16/GJ, 24.2 TJ on SWQP at $13.90/GJ).
Figure 6.1 shows the quantity of gas traded by product type for each trading day on pipeline trading locations in the Wallumbilla and Moomba Gas Supply Hubs.15
Figure 6.1: GSH traded quantities
0
2
4
6
8
10
12
14
16
18
RB
P
SW
QP
RB
P
SW
QP
RB
P
SW
QP
RB
P
SW
QP
RB
P
SW
QP
RB
P
SW
QP
RB
P
SW
QP
5 Feb 6 Feb 7 Feb 8 Feb 9 Feb 10 Feb 11 Feb
Volu
me
Trad
ed (T
J)
Balance of day Daily Day ahead Monthly Weekly
Australian Energy RegulatorMarch 2016
14 Additional information on trading locations and available products is detailed in the user guide.15 Non-netted (off-market) trades, allowing the selection of specific delivery point at a trading location, are denoted as
WAL*.
13