Gary Klass Department of Politics and Government Illinois State University.
32
Gary Klass Department of Politics and Government Illinois State University
-
date post
20-Dec-2015 -
Category
Documents
-
view
214 -
download
0
Transcript of Gary Klass Department of Politics and Government Illinois State University.

Gary KlassDepartment of Politics and Government
Illinois State University

JUST PLAIN DATA ANALYSIS
Part IStatistical Fallacies
Gary KlassDepartment of Politics and Government
Illinois State University

FROM LAST YEARS’ CONFERENCE:Moving Practitioners Beyond Descriptive Statistics
Saturday, October 18, 2008 8:30 a.m. - 12:30 p.m.
Seminar Description: Statistical analysis is very important with regard to reports, projects, policy, and the general understanding of information processed on a daily basis. Many people are intimidated by mathematics and statistics, which causes an overreliance on simple descriptive statistics such as means, standard deviations, rates, and percent changes. These simple descriptive statistics all have limitations, however. The primary goal of this presentation is to identify the limitations of descriptive statistics and explore more meaningful bivariate and multivariate analyses, such as z-scores, t-tests, ANOVA, and regression.
Instructor:
Jamie Price, President
Socialphenom, Inc.
West Palm Beach, Florida

STATISTICAL FALLACIES
An argument:–Premises (evidence and reasoning) in
support of a conclusion
An argument fallacy:–When the premises, even if true, do not support
a conclusion (Examples: false cause, slippery slope, ad hominem, straw man, red herring…).
A statistical fallacy:–When the data do not support the conclusion.

CHERRY PICKING: HOW PRESIDENT BUSH LOWERED THE POVERTY RATE (Bill O’Reilly)
1992 1994 1996 1998 2000 2002 200410
12
14
16
13.7
12.7
*% of population living in families below the poverty level
Clinton
fourth yearin office
G. W. Bush

CHERRY PICKING: DISTRIBUTION OF 248 Z-SCORES IN 17 POLITICAL ECONOMY STUDIES (Tufte, Beautiful Evidence)
gg
gg
gg
gg
gg
gg
gg
gg
gg
gg
gg
gg
gg
gg
gg
10%
5%5%
10%
gg
gg
gg
gg
gg
gg
gg
gg
gg
gg
gg
gg
gg
gg
gg
gg
gg
gg
gg
gg
g
gg
gg
gg
gg
gg
gg
g
gg
gg
gg
gg
gg
gg
gg
gg
gg
gg
g
gg
gg
gg
gg
gg
gg
gg
g
gg
gg
gg
gg
gg
gg
gg
gg
gg
gg
g
gg
gg
gg
gg
gg
gg
gg
gg
gg
gg
gg
gg
gg
gg
gg
gg
gg
gg
gg
g
gg
gg
gg
gg
gg
g
gg
gg
gg
gg
gg
< 00
- .4
.4 -
.8
.8 -
1.2
1.2
- 1.6
1.6
- 2.0
2.0
- 2.4
2.4
- 2.8
2.8
- 3.2
3.2
- 3.6
3.6
- 4.0
4.0
- 4.4
> 4.4

CHERRY PICKING: CUMULATIVE % CHANGE IN INCOME TAX REVENUES* AFTER REAGAN AND CLINTON TAX CHANGES
1981(1993)
1983(1995)
1989(2003)
-15%
0%
15%
30%
45%
60%
+16%
0.28063448671317
Reagan '81-89
Reagan '83-89
* Constant dollars

CHERRY PICKING: CUMULATIVE % CHANGE IN INCOME TAX REVENUES* AFTER REAGAN AND CLINTON TAX CHANGES
1981(1993)
1983(1995)
1989(2003)
-15%
0%
15%
30%
45%
60%
+16%
0.28063448671317
+68%
First year of change
Reagan '81-89
Clinton '93-01
Reagan '83-89
* Constant dollars

MEASUREMENT RELIABILITY:TWO MEASURES OF VIOLENT CRIME (per 1,000 population)
1973
1980
1990
0
4
8
12
16
20
-17%
+84%
National Crime Victimization Survey
FBI Uniform Crime Report

REGRESSION ARTIFACT: SENATE OIL PRICE SPECULATION BILL AND CRUDE OIL PRICES*
Jan-
06
Apr
-06
Jul-0
6
Oct
-06
Jan-
07
Apr
-07
Jul-0
7
Oct
-07
Jan-
08
Apr
-08
Jul-0
8
Oct
-08
Jan-
09
Apr
-09
30
60
90
120
150
*Dollars per Barrel
Senate HearingsBill Passes

RESERVE CAUSATION: PROSECUTION RATE OF PUBLIC OFFICIALS AND VOTER TURNOUT, 1980-2004
45% 50% 55% 60% 65% 70%0.1
0.4
1.6
6.4
25.6
2.94
1.48
2.98
0.59
4.88
0.730000000000001
1.081.3
9.78
5.26
0.56
1.861.34
0.3900000000000010.3200000000000
01
1.77
4.93
0.640000000000003
8.18
1.281.1
0.4
3.92
1.01 0.730000000000001
0.21
1.36
0.13
1.521.77
3.612.31
0.27
2.23
0.640000000000003
0.330000000000001
1.4
3.044.33
0.48
4.06
1.32
0.58
0.1
0.380000000000001
0.630000000000002
2.33
0.41
0.770000000000003
Voter Turnout: Presidential Elections, 1980-2004
Pros
ecuti
on ra
te(lo
g sc
ale)

RESERVE CAUSATION: FELONY ARREST RATIO AND VIOLENT CRIME RATE, 2008: NEW YORK COUNTIES (excl. NYC)
1.5 3.0 6.00
200
400
600
503618989 24542
26403
32113
34332367904174242138 45266
4832848560
4935849594
50281
50353
51170
550125772162256
62313
6246962944
63029
66478
69859
7657177775
79812 82475
8761990960
96608
99894
101591104379
109530117896121286
133217
151325
155621
182305195377
214193
217656
231868294181
298129
299789
381554
453316728695
908651
954255
13548331522727
Felony Arrests / Violent Crimes (log scale)
Viol
ent C
rim
e Ra
te
O - population size

POPULATION MORTALITY: ENROLLMENT AND FIRST INTERNATIONAL SCIENCE STUDY RESULTS, FINAL YEAR OF SECONDARY SCHOOL
0 10 20 30 40 50 60 70 8010
15
20
25
3029.0
26.9
24.723.3
23.1
23.123.0
19.8 19.218.3
17.415.9
15.3 13.7
% of age group enrolled
Mea
n sc
ienc
e s
core

THE TREND IS NOT YOUR FRIEND: AVERAGE CONTRACT PRICE OF NEW ONE-FAMILY HOUSES (2000 dollars)
1994 1997 2000 2003 2006$150,000
$175,000
$200,000
$225,000
$250,000

RATE OF CHANGE FALLACY:
Year Black White Year Black White1950 17 2 1950 83 981960 22 2 1960 78 981970 38 6 1970 62 941980 56 9 1980 44 911992 68 19 1992 32 82
% Change 307% 988% -62% -17%
White out-of-wedlock birth rate "climbing faster" than black rate (Hacker, Two Nations )
Black in-wedlock birth rate "falling faster" than white rate

RATE OF CHANGE FALLACY: "MINORITIES IN THE U.S. INCREASED THEIR LEVELS OF HOMEOWNERSHIP AT A FASTER CLIP THAN WHITES DURING THE RECENT HOUSING BOOM." -WSJ 5/13/09
1995 2008 ChangeHomeownership Rates
Black 42.1 47.5 13%Hispanic 41.9 48.9 17%Asian 49.1 59.1 20%White 70.5 74.9 6%
Home Non-Ownership RatesBlack 57.9 52.5 -9%Hispanic 58.1 51.1 -12%Asian 50.9 40.9 -20%White 29.5 25.1 -15%

Graphical Distortion: Average Tuition and Fees: 4-year Public and Private Universities
1980 1988 1996 20040
5,000
10,000
15,000
20,000
25,000Private: +607%
Public: +662%

DOMINANT DENOMINATOR
• “Bill Clinton and a GOP Congress balanced the budget by withdrawing a ‘peace dividend’ at a time when al Qaeda was declaring war” (2004). --WSJ 8/9/04

Dominant Denominator: Clinton defense budgets: % of GDP and in constant dollars
3.0
3.5
4.0% of GDP:
1993 1994 1995 1996 1997 1998 1999 2000 2001250
300
350
Billions 2000 $

• “Crime halved under Mr. Giuliani and murders fell by two-thirds, transforming New York from one of the most dangerous cities in America to one of the safest.”
“From America's mayor to America's President?,” The Economist.com <http://www.economist.com/world/na/displaystory.cfm?story_id=9119759> (3 May, 2007)

ROBBERY RATES, TEN LARGEST CITIES, 1985-2007*BJS: Data Online
NewYork
Chicago LosAngeles
Dallas Phila-delphia
Houston SanAntonio
SanDiego
Phoenix LasVegas
0
300
600
900
1200
100 100 100 100 100 100 100 100 100 100
HighLow

NEW YORK CITY CRIMES, 1993-2001(Thousands)
1993 Trend 2001Net
Change%
ChangeViolent crime total 154 74 -79 -52%Murder 1.9 0.7 -1.2 -63%Forcible rape 2.8 1.7 -1.2 -41%Robbery 86 31 -55 -65%Aggravated assault 63 42 -21 -34%
Property crime total 447 213 -234 -52%Burglary 99 34 -65 -65%Larceny-theft 235 146 -89 -38%Motor vehicle theft 112 33 -80 -71%

COUNTER ARGUMENTS
• Crime went down in other cities too (Freakonomics)
• The national economy improved
• Regression artifact – end of crack epidemic
• William Bratton, not Giuliani, deserves credit
• Decline started under Dinkins
• Most of the reduction was for minor crimes
• Bad data: CompStat encouraged underreporting of crime
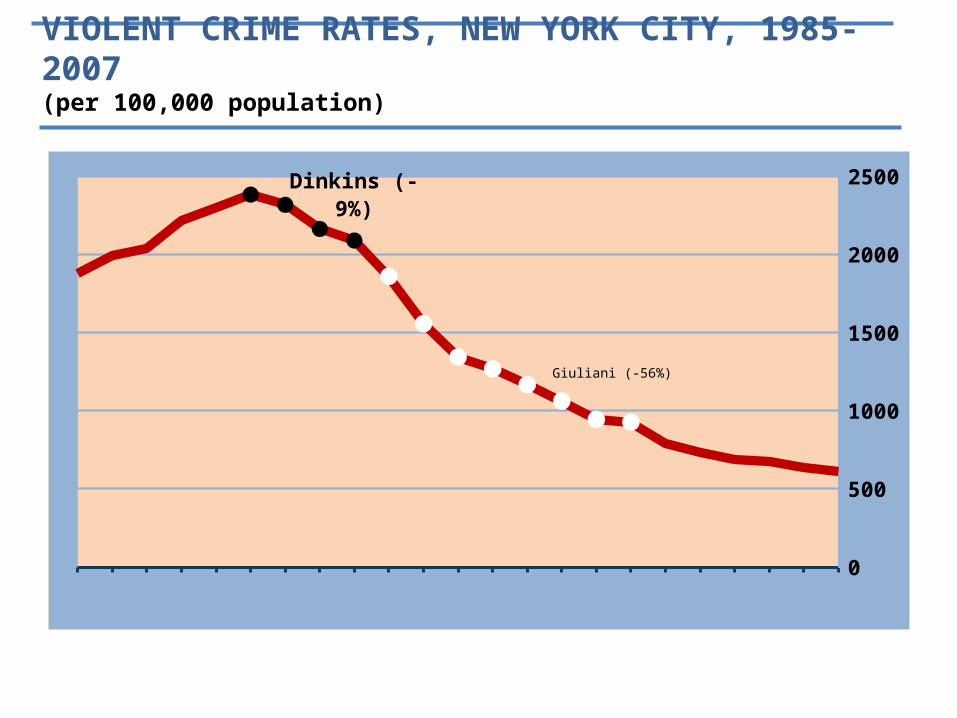
VIOLENT CRIME RATES, NEW YORK CITY, 1985-2007(per 100,000 population)
0
500
1000
1500
2000
2500
Dinkins (-9%)
Giuliani (-56%)

FBI\UCR VIOLENT CRIME RATES: 69 LARGEST CITIES, 2007 (population > 250,000)
0
1000
2000
3000
4000
New York City

VIOLENT AND PROPERTY INDEX CRIMES, NEW YORK CITY, 1985-2007 (thousands)
1985 1990 1995 2000 20050
200
400
600
800
530
Giuliani admin-istration
288
Violent and property crimes
Violent crimes
13774
-46%
-46%

FBI AND NCVS VIOLENT CRIME RATES: 69 LARGEST CITIES, 2007 (population > 250,000)
0
1000
2000
3000
4000
NYC NCVS
New York City

MURDER RATES: NEW YORK CITY AND 69 LARGEST CITIES, 2007 (POPULATION > 250,000)
0
20
40
60
80

MURDER RATES: NEW YORK AND 69 LARGEST CITIES, 2007(population > 250,000)
0
10
20
30

THE ECONOMY?
19851987
19891991
19931995
19971999
20012003
20050
500
1000
1500
2000
2500
3000
0
2
4
6
8
10
12
Violent Crime Rate
Unemploy-mentRate
US unemployment
Viol
ent C
rim
e Ra
te
Une
mpl
oym
ent

DINKINS AND POLICE HIRING? SWORN OFFICERS, NEW YORK CITY POLICE DEPARTMENT, AND VIOLENT CRIME RATE 1992-04
General Accounting Office. “COMMUNITY POLICING GRANTS COPS Grants Were a Modest Contributor to Declines in Crime in the 1990s”http://www.gao.gov/new.items/d06104.pdf
1992
1993
1996
1997
1999
2000
2004
20000
25000
30000
35000
40000
0
500
1000
1500
2000Officers Crime Rate
Offi
cers
Crim
e Ra
te

CHANGE IN CRIME RATES AND SWORN POLICE PERSONNEL,IN THE 1990S, 58 LARGEST CITIES
-20 -10 0 +10 +20 +30 +40 +50-75
-50
-25
0
+25
-29
-37
-47
-18
-51
-43-45-49
15
3
-20
-39
-25-30-31
-51
-36
-24-22
-40
5
-27
2 3
-64
-45
-21
-6
-48-44
-33
-53
-27-27
-13
-27
-50
4
-38
-8
-29
-40
-21
10
-7-10
-52
-60
-12
-24-19
-65
17
-29-26
-12
-59
Change in Sworn Police Personnel, 1990-00per 100,000 residents
Chan
ge in
Vio
lent
Cri
me
Rate
19
91-0
1