Garmin Q3 2015 earnings call presneentation
22
Q3 2015 Earnings October 28, 2015
-
Upload
ludovic-privat -
Category
Business
-
view
683 -
download
0
Transcript of Garmin Q3 2015 earnings call presneentation

Q3 2015 Earnings
October 28, 2015

Safe Harbor StatementThese materials include projections and other forward-looking statements. These statements are based on the current expectations of Garmin Ltd. and are naturally subject to uncertainty and changes in circumstances. Forward-looking statements include, without limitation, statements containing words such as "proposed" and “intends” or “intended” and "expects" or "expected." Any statements regarding Garmin’s revenue, GAAP and pro forma estimated earnings and EPS, and tax rate for fiscal 2015, Garmin’s expected segment revenue growth rates, margins, currency movements, expenses, pricing, new products to be introduced in 2015 and Garmin’s plans and objectives are forward-looking statements. By their nature, forward-looking statements involve risk and uncertainty because they relate to events and depend on circumstances that will occur in the future. There are a number of factors that could cause actual results and developments to differ materially from those expressed or implied by such forward-looking statements. Other unknown or unpredictable factors could cause actual results to differ materially from those in the forward-looking statements. These factors include those discussed or identified in the filing by Garmin Ltd. with the U.S. Securities and Exchange Commission in its Annual Report on Form 10-K. Garmin Ltd. does not undertake any obligation to update publicly or revise forward-looking statements, whether as a result of new information, future events or otherwise, except to the extent legally required.
2

Business Update
Cliff Pemble
President and CEO
3

3rd Quarter Financial Review
• Revenue decreased 4%, affected by strong US Dollar
• Shipped approximately 3.9 million units, representing
4% growth
• Non-auto market segments continue to provide revenue
growth; contributed 61% and 75% of revenue and
operating income, respectively
• Gross and operating margin of 53% and 18.5%,
respectively
• Pro forma EPS of $0.51
4

Fitness
3rd Quarter Business Review
• Revenue growth of 23%; strong
results in activity trackers,
multisport and cycling
• Gross and operating margin of 54%
and 19%, respectively
Market/Product Update
• Forerunner family update including
the 235 with Garmin Elevate wrist
heart rate technology
• vívosmart HR with Garmin Elevate,
always-on display and full smart
notification capability
• Garmin Connect Mobile update
• Q4 advertising campaign launches
soon5

Outdoor
3rd Quarter Business Review
• Revenue decline of 5% due to
geographic exposure to weak
currency
• Margin profile negatively
impacted by currency and
category mix
Market/Product Update
• Expanded the fēnix 3 product
line with new color and
material options
6
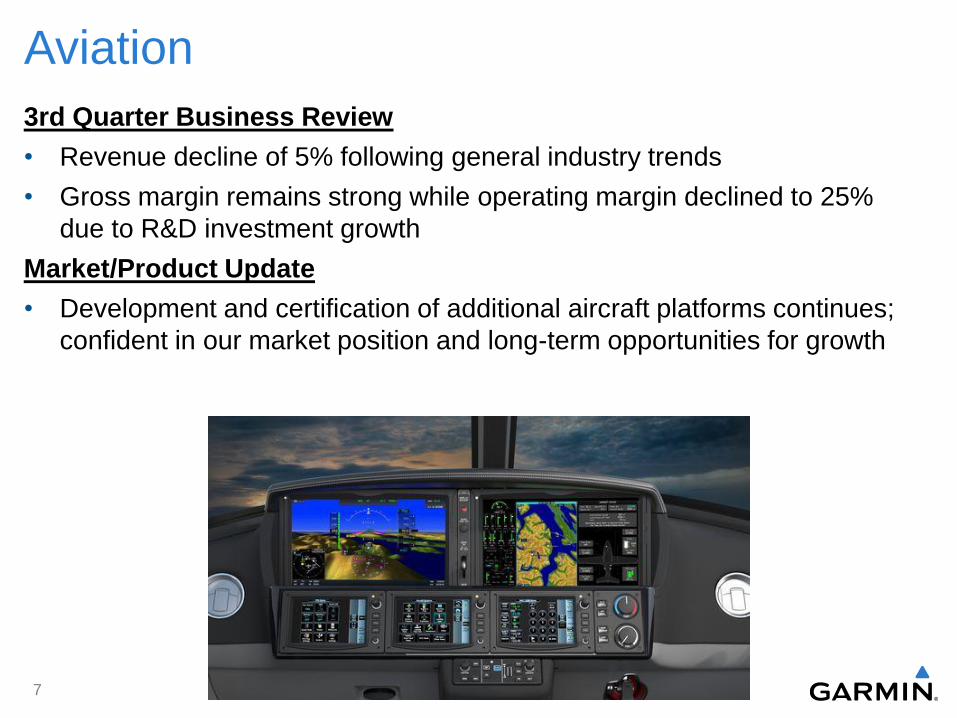
Aviation
3rd Quarter Business Review
• Revenue decline of 5% following general industry trends
• Gross margin remains strong while operating margin declined to 25%
due to R&D investment growth
Market/Product Update
• Development and certification of additional aircraft platforms continues;
confident in our market position and long-term opportunities for growth
7

Marine3rd Quarter Business Review
• Revenue was flat following
strong 2nd quarter results and as
we compare against the Q3
2014 acquisition of Fusion
• Gross margin continues to
improve with launch of new
products
Market/Product Update
• Honored with 5 awards by
NMEA including Manufacturer of
the Year
• Will build on current momentum
in 2016 with further innovation
and share gain8

Auto
3rd Quarter Business Review
• Revenue declined 14%, in-line with expectations
• Global share remains stable
Market/Product Update
• Expect PND market to decline approximately 10-15% globally with
stable pricing
• Introduced babyCam, a back seat video monitoring system that
feeds wirelessly to compatible Garmin PND
9

2015 Guidance Update
2015
Guidance
Revenue ~$2.8 B
Gross Margin ~53.5%
Operating Margin ~18.5%
Tax Rate ~21.5%
EPS (Pro Forma) ~$2.25
10

Financial Update
Doug Boessen
CFO and Treasurer
11

Q3 Income Statement
Q3 2015 Q3 2014
($ Millions) Actual Actual Change
Revenue $680 $706 (4%)
Gross Profit 362 398 (9%)
Gross Margin % 53% 56% (300 bps)
Total Operating Expense 237 223 6%
Operating Income 125 176 (29%)
Operating Margin % 18% 25% (640 bps)
Other Income/(Expense) 39 -3
Income Tax 46 319
Net Income (GAAP) 119 -147 NM
Net Income Pro-Forma 97 146 (34%)
EPS (GAAP) $0.63 -$0.76 NM
EPS Pro-Forma $0.51 $0.76 (33%)
Units Shipped (K) 3,861 3,700 4%

39%
21%
17%
14%9%
Q3 2015 Revenue
Auto Fitness Outdoor Aviation Marine
Q3 Revenue
44%
16%
17%
14%9%
Q3 2014 Revenue
Auto Fitness Outdoor Aviation Marine
($ M) Q3 2015 Q3 2014 Change
Auto $265 $308 (14%)
Fitness 143 116 23%
Outdoor 115 121 (5%)
Aviation 94 99 (5%)
Marine 63 62 0%
Total $680 $706 (4%)
Revenue by Segment
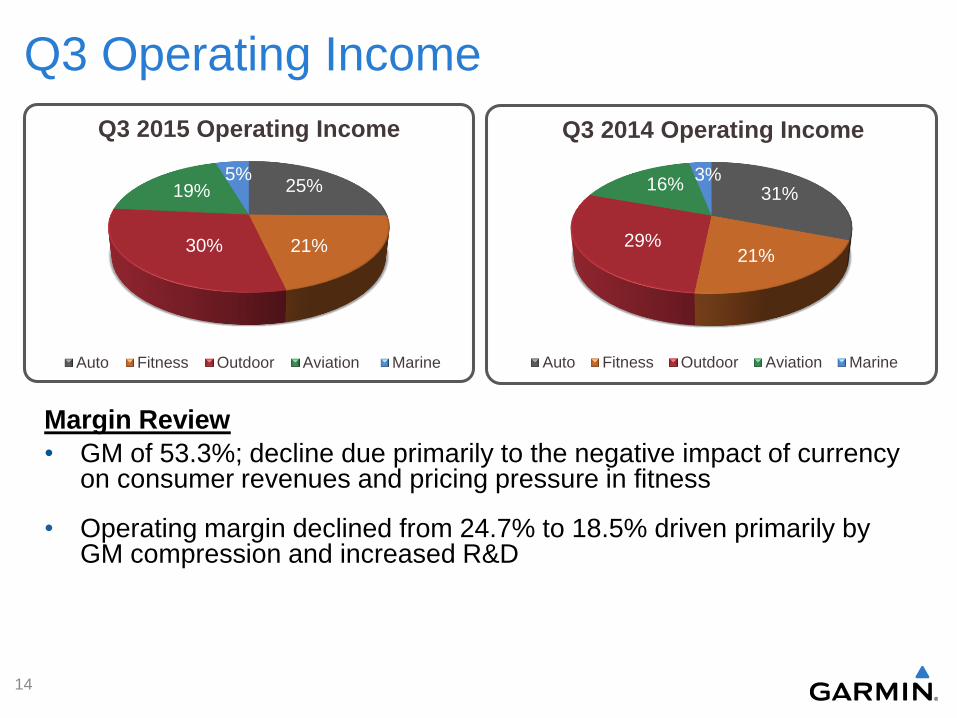
Q3 Operating Income
25%
21%30%
19%5%
Q3 2015 Operating Income
Auto Fitness Outdoor Aviation Marine
31%
21%29%
16%3%
Q3 2014 Operating Income
Auto Fitness Outdoor Aviation Marine
14
Margin Review
• GM of 53.3%; decline due primarily to the negative impact of currency on consumer revenues and pricing pressure in fitness
• Operating margin declined from 24.7% to 18.5% driven primarily by GM compression and increased R&D

99 102 106 109 106
-
20
40
60
80
100
Q314
Q414
Q115
Q215
Q315
R&D ($M)
Operating Expenses
33
54
28
46 37
-
20
40
60
80
100
Q314
Q414
Q115
Q215
Q315
Advertising ($M)
91 99 99 98 94
-
20
40
60
80
100
Q314
Q414
Q115
Q215
Q315
SG&A ($M)

Balance Sheet/Cash FlowBalance Sheet
• Ended quarter with over $2.4 billion of cash and marketable securities
• Accounts receivable decreased both sequentially and year-over-year
• Inventory balance increased on a sequential basis as we prepared for
the fourth quarter and remains higher year-over-year to support new
product launches
Cash Flow
• Generated $124 million of free cash flow in Q3 2015
• Repurchased $51 million in company stock in Q3 2015; $192 million
repurchase authorization remains in effect
16

Taxes
• Q3 2015 Effective Tax Rate (ETR) of 27.7% compared to pro forma
ETR of 21.0% in Q3 2014
• Reduced profit forecast negatively impacting income mix by tax
jurisdiction
• Q3 2014 pro forma ETR excludes tax expense associated with
inter-company restructuring and tax benefit of reserve releases
• 2015 ETR forecasted to be approximately 21.5% due primarily to
income mix by tax jurisdiction
17

Q3 2015 Earnings
October 28, 2015
18

Appendix
October 28, 2015
19

20
Pro Forma net income (earnings) per share
Management believes that net income per share before the impact of foreign currency translation gain
or loss and income tax adjustments that materially impact the effective tax rate, as discussed below, is
an important measure. The majority of the Company’s consolidated foreign currency gain or loss
result from balances involving the Euro, the British Pound Sterling and the Taiwan Dollar and from the
exchange rate impact of the significant cash and marketable securities, receivables and payables held
in a currency other than the functional currency at one of the Company’s subsidiaries. However, there
is minimal cash impact from such foreign currency gain or loss. The Company’s income tax expense
is periodically impacted by material net releases of reserves primarily related to completion of audits
and/or the expiration of statutes effecting prior periods. Thus, reported income tax expense is not
reflective of the income tax expense that is incurred related to the current period earnings. The net
release of other uncertain tax position reserves, amounting to approximately $7 million and $11 million
in first half 2015 and 2014, respectively, have not been included as pro forma adjustments in the
following presentation of pro forma net income as such amounts have been considered immaterial,
tend to be more recurring in nature and are comparable between periods. In the third quarter of 2014,
the company incurred tax expense of $308 million associated with our inter-company restructuring. As
this is a one-time transaction and not reflective of income tax expense incurred related to the current
period earnings, it has been excluded from pro forma net income (earnings) per share. Accordingly,
earnings per share before the impact of foreign currency translation gain or loss and income tax
adjustments that materially impact the effective tax rate permits a consistent comparison of the
Company’s operating performance between periods.

Pro Forma Net Income
Note: Tax effects are based on respective periods’ normalized effective tax rate.
21
13-Weeks Ended
Sept 26, Sept 27, Sept 26, Sept 27,2015 2014 2015 2014
Net Income (Loss) (GAAP) $119,299 ($146,834) $323,844 $153,966
Foreign currency (gain) / loss, net of tax effects ($22,120) $10,035 $11,073 $16,957
Income tax benefit due to completion of tax audits
and/or expiration of statutes - ($24,400) - ($24,400)
Tax due to inter-company restructuring - $307,635 - $307,635
Net income (Pro Forma) $97,179 $146,436 $334,917 $454,158
Net income (loss) per share (GAAP):
Basic $0.63 ($0.76) $1.69 $0.79
Diluted $0.63 ($0.76) $1.69 $0.79
Net income per share (Pro Forma):
Basic $0.51 $0.76 $1.75 $2.34
Diluted $0.51 $0.76 $1.75 $2.33
Weighted average common shares outstanding:
Basic 190,342 192,239 191,068 193,700
Diluted (GAAP) (1) 190,822 192,239 191,523 194,763
Diluted (Pro Forma) 190,822 193,341 191,523 194,763
(1) Per US GAAP, dilutive shares are excluded from the calculation of GAAP EPS in a net loss position as
the dilutive impact becomes anti-dilutive, reducing the loss per share.
Garmin Ltd. And Subsidiaries
39-weeks Ended
Net income per share (Pro Forma)
(in thousands, except per share information)

Free Cash Flow
Management believes that free cash flow is an important financial measure because it
represents the amount of cash provided by operations that is available for investing and
defines it as operating cash flow plus non-recurring cash payments associated with our
inter-company restructuring less capital expenditures for property and equipment.
22
13-Weeks Ended
Sept 26, Sept 27, Sept 26, Sept 27,
2015 2014 2015 2014
Net cash provided by operating activities $137,834 $142,342 $122,131 $377,694
Less: purchases of property and equipment ($13,565) ($18,066) ($53,297) ($54,829)
Plus: taxes paid related to inter-company restructuring - $78,137 $182,800 $78,137
Free Cash Flow $124,269 $202,413 $251,634 $401,002
Garmin Ltd. And Subsidiaries
Free Cash Flow
(in thousands)
39-weeks Ended