
Gareth J Morgan Director NYULangone Myeloma Research...
65
Genomics of multiple myeloma Gareth J Morgan Director NYULangone Myeloma Research Program New York City
Transcript of Gareth J Morgan Director NYULangone Myeloma Research...

Genomics of multiple myelomaGareth J Morgan
Director NYULangone Myeloma Research ProgramNew York City

Talk outline
1. Introduction2. Aetiologic events3. The Myeloma Genome project4. Epigenetic events5. Risk stratification6. Impact on the microenvironment7. Structural events and identifying new drivers

We know its illogical – “MULTIPLE” myelomas
One size fits all

Natural history of Multiple Myeloma.
MGUS, monoclonal gammopathy of unknown significance; M protein, myeloma protein.
Durie BGM, ed. Multiple Myeloma Concise Review 2007. International Myeloma Foundation. American Cancer
Society. Cancer Facts & Figures, 2008.
Myeloma remains an incurable disease for most patients

Personalize therapeutic decisions.
Younger, fit•Achieving longest possible remission/sustaineddisease control while preserving QoL?
Elderly, fit•Achieving and maintaining responses while preserving QoL?
Frail/comorbidities•Tolerability while preserving QoL?
Very frail• Palliative care while preserving QoL?

Personalized medicine
Diagnostic test

MGUS Smouldering Myeloma Myeloma Plasma Cell
Leukemia
PRIMARY GENETIC EVENTSIGH TRANSLOCATIONSHYPERDIPLOIDY SECONDARY GENETIC EVENTS
COPY NUMBER ABNORMALITIESDNA HYPOMETHYLATION
ACQUIRED MUTATIONS
Initiation Progression
Bone marrow Peripheral bloodGerminal centre
Post-GC B cell
inherited variants
Multistep Progression System

2. Aetiologic Copy Number Abnormalities and Structural Variants

2. Aetiologic Events in Multiple Myeloma
Morgan GJ, Walker BA and Davies FE. Nature Reviews Cancer. In 2012
Primary genetic events (initiation events)
IGH translocations (50%)• t(4;14) FGFR3/MMSET (15%)• t(6;14) CCND3 (4%)• t(11;14) CCND1 (20%)• t(14;16) MAF (4%)• t(14;20) MAFB
Hyperdiploidy (50%)•Trisomies of chromosomes3, 5, 7, 9, 11, 15, 19, 21
None60%
11q13 (Cyclin D1)15%
6p21 (Cyclin D3)3%
4p16 (MMSET)15%
20q12 (MAFB)2%
16q23 (c-MAF)5%

Translocation Cyclin-D classification
“A unifying aetiologicclassification of MM is based on the presence of chromosomal translocations and the deregulation of a D group cyclineither directly by a translocation or by an unknown mechanism.”
MM is comprised of at least six molecular categories.
Stein C et al Oncotarget 2017.

G1/S checkpoint
11Pawlyn C and Morgan GJ. Nat Rev Cancer. 2017;17(9):543-556

3. Myeloma Genome Project
ISS
Stratification of patients
Molecular profiling
DNA• ~600 ex. panel• ~1700 WES• ~1000 WGS
RNA• ~1100 RNAseq
Clinical
Today
MGP
Group 1
Group 2
Group 3
Group 4
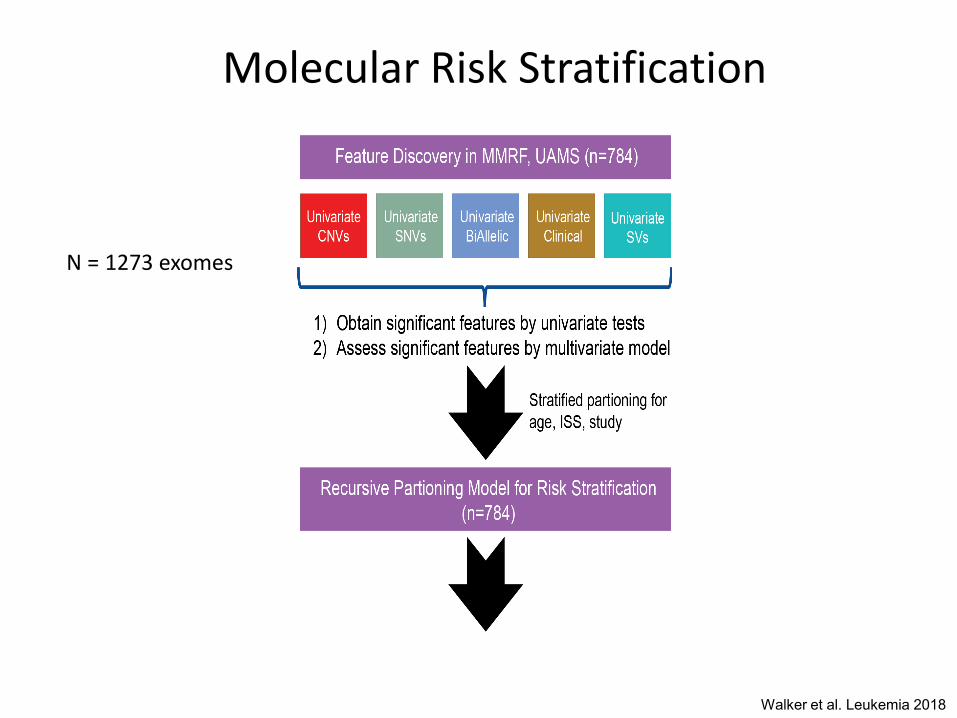
Molecular Risk Stratification
Walker et al. Leukemia 2018
N = 1273 exomes

Bi-allelic Inactivation of Tumour Suppressor GenesMultiple Myeloma
NFkBG1SP53

Pan-cancer Homozygous Deletions

Multiple Myeloma Driver Genes (n=63)
Walker et al. Blood 2018

Mutation Frequencies of 63 Driver Genes
Walker et al. Blood 2018
RAS

Mutation Frequencies of 63 Driver Genes
RAS
VEMURAFINIBDEBRAFINIB

Cancer Clonal Fraction of Driver Genes
Walker et al. Blood 2018

21
Myeloma as an Evolutionary Ecosystem
Ecosystem 1
Single founder tumour initiating cell
Ecosystem 3
Selective pressures
Ecosystem 4
PCLMMMGUS
Diffuse
Focal
Ecosystem 2EMD

Mutation Targeted Therapy; Implications of Sub-clonal Heterogeneity
Venetoclaxt(11;14)

Oncogene Dependancies
• Distribution of mutations and copy number variables s not random providing evidence for distinct subgroups of disease.
• The aetiologic events provide a distinct genetic background on which collaborating variants are super imposed.

Clustering by Copy Number Abnormality;Nine Copy Number Sub-Groups

4. Epigenetic Changes; t(4;14)
FGFr3
Enhancer
NSD2Ig
Hybrid gene
Immunoglobulin gene locus

NSD2 is H3K36me3 Wipes Out Repressive H3K27me3 Peaks to Activate Genes
- NSD2
+ NSD2

OFF
RbAp46/47
EED SUZ12
EZH2 Me
ASXL1JARID2
Me
ON
Balance of H3K27me/Ac regulates key processes
Modified from Ezponda & Licht, Clin Cancer Res 2014
PTIP
ASC-2MLL2/3
UTXp300
H3K27me3
Ac
The complex is frequently targeted by mutation in MM

Epigenetic Driver MutationsGene Cytoband Full name Function
ARID1A 1p36.11 AT-rich Interaction Domain 1A SWI/SNF 31/1273 (2.44%) 1p36.11 TSG score
ARID2 12p12 AT-rich Interaction Domain 2 PBAF complex 17/1273 (1.34%) 12q12 TSG score
CREBBP 16p13.3 CREB Binding Protein BRD and HAT 30/1273 (2.36%) 16p13.3 TSG score
DNMT3A 2p23.3 DNA Methyltransferase a DNA methylation 22/1273 (1.73%) 2p23.3 TSG score
EP300 22q13.2 E1A Binding Protein P300 HAT 25/1273 (1.96%) 22q13.2 TSG score
HIST1H1E 6p22.2 Histone Cluster 1 H1 Family MemberE
Epigenetic 47/1273 (3.69%) 6p22.2 TSG score
IDH1 2q34 Isocitrate Dehydrogenase DNA methylation 7/1273 (0.55%) 2q34 ONC score
IDH2 15q26.1 Isocitrate Dehydrogenase DNA methylation 4/1273 (0.31%) 15q26.1 ONC score
KDM5C (Jarid1c) Xp11.22 Lysine Demethylase 5C H3K4demethylase
21/1273 (1.65%) Xp11.22
TSG score
KDM6A (UTX) Xp11.3 Lysine Demethylase 6A H3K27demethylase
19/1273 (1.49%) Xp11.3 TSG score
KMT2B (MLL2) 19q13.12 Lysine Methyltransferase 2B H3K4 methylation 28/1273 (2.2%) 19q13.12
TSG score
KMT2C (MLL3) 7q36.1 Lysine Methyltransferase 2C H3K4 methylation 34/1273 (2.67%) 7q36.1 TSG score
NCOR1 17p12 Nuclear Receptor Corepressor 1 gene repression 17/1273 (1.34%) 17p12 TSG score
SETD2 3p21.31 SET Domain Containing 2 H3K36 me3 24/1273 (1.89%) 3p21.31 TSG score
TET2 4q24 Hydroxylation 5MeC DNA methylation 24/1273 (1.89%) 4q24 TSG score
Myeloma genome project Walker et al. Blood 2018

5. Risk Stratification
Interphase FISH– Adverse – t(4;14), t(14;16), del17p.– Standard – hyperdiploidy, t(11;14).– Ultra high risk – adverse translocation plus del17p

Revised International Staging System R-ISS
Stg Factor % of pts 5 yr PFS 5 yr OS
I Absence of adverse factors (no high LDH, ISS 2 or 3, t(4;14) t(14;16) or del(17p)) 28% 55% 82%
II Not R-ISS I or III 62% 36% 62%
III ISS 3 and either high-risk CA by iFISH or high LDH 10% 24% 40%
Non–transplantation-based
regimens
Transplantation-based
regimens
Immunomodulatory-basedregimens
Proteasome inhibitor-based regimens
1. Palumbo A, et al. J Clin Oncol2015;33:2863-2869.
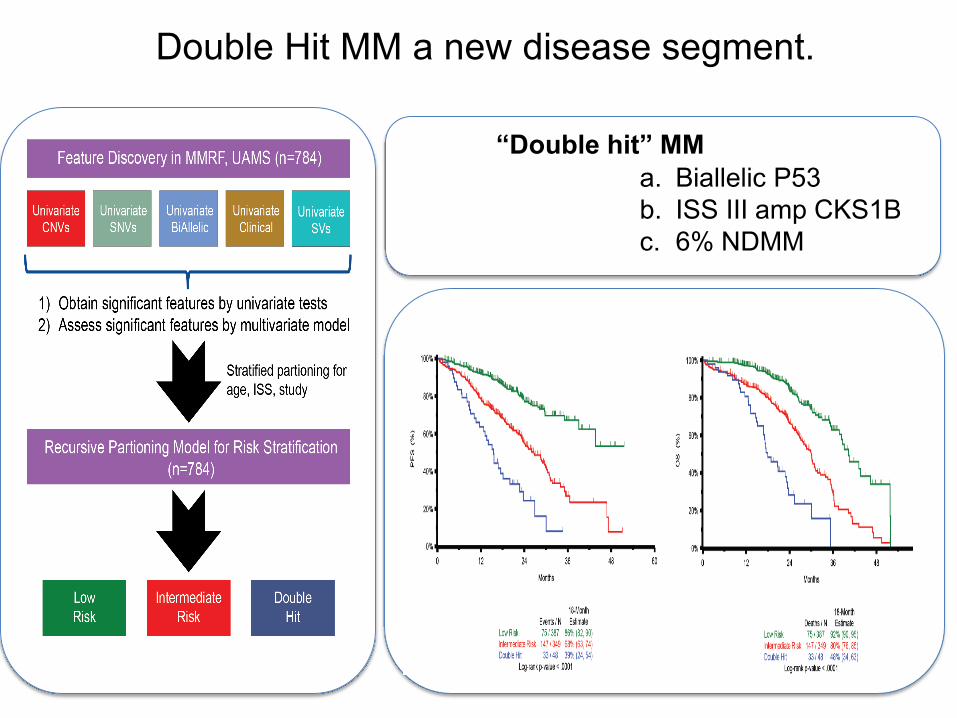
Double Hit MM a new disease segment.
“Double hit” MMa. Biallelic P53b. ISS III amp CKS1Bc. 6% NDMM

Comparison of Double Hit MM to IMWG Risk Groups
34
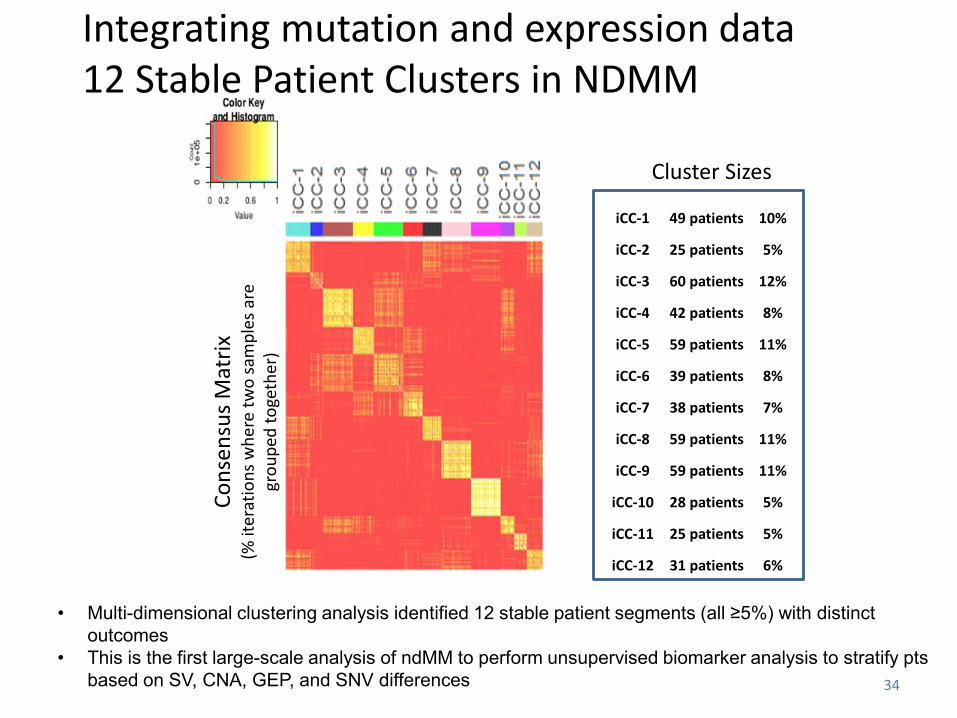
iCC-1 49 patients 10%
iCC-2 25 patients 5%
iCC-3 60 patients 12%
iCC-4 42 patients 8%
iCC-5 59 patients 11%
iCC-6 39 patients 8%
iCC-7 38 patients 7%
iCC-8 59 patients 11%
iCC-9 59 patients 11%
iCC-10 28 patients 5%
iCC-11 25 patients 5%
iCC-12 31 patients 6%
Cons
ensu
sMat
rix(%
iter
atio
nsw
here
two
sam
ples
are
grou
ped
toge
ther
)
Cluster Sizes
• Multi-dimensional clustering analysis identified 12 stable patient segments (all ≥5%) with distinct outcomes
• This is the first large-scale analysis of ndMM to perform unsupervised biomarker analysis to stratify pts based on SV, CNA, GEP, and SNV differences
Integrating mutation and expression data12 Stable Patient Clusters in NDMM

Molecular Features of Cluster 8
36
t(4;14) (1e-3)
t(14;16) (1e-4)
Del1p13/22-21 (1e-3) Amp 1q21-25 (1e-2)
Del13q12-34 (1e-5/3)Del14q12-32 (1e-7)Del16q12-24 (1e-4)
CopyNumber
GE profile drivenby significant low-expression oftranscripts and up-regulation ofcell-cyclepathways
Cytogenetics
GE
Ortiz et al, Manuscript in preparation.. Poster presented at EHA 2018.
C8:NS_MAX,NS_TRAF2,CDKN2C_Loss,RPL5_Loss,FAM46C_Loss,FGFR3_Loss,TRAF2_Loss,BRCA2_Loss,RB1_Loss,DIS3_Loss,ABCD4_Loss,TRAF3_Loss,CKS1B_Amp,t_14_16,t_4_14,mutations_per_mb,APOBEC,ISS_S3"
• 24/59 (41%) were ISS3• 19/59 (32%) were ≥ 65 yrs

Identifying Molecular Drivers of High-Risk
Genetic• CRISPR screens• shRNA
knockdowns• Targeted gene
manipulations• Chemical inhibition
Biological• Proliferation• Cell cycle• Apoptosis• 3D & Co-culture
assays• Immune assays
Proteomic• Interaction mapping• Immunoprecipitation• Mass Spectrometry• ChIP-Seq
• Pathways, genes and functional networks• Biomarker• Preclinical / ex-vivo models for testing function
Computational• Validation• Master regulators• Bionetworks

Normalcell
MMMGUS SMM
EMD
PCLHR
MYC translocationsP53 inactivationAmp1qWhole arm translocationsRB1 inactivationCDKN2C inactivation
Recurrent myeloma mutationsRecurrent copy number changes
6. Impact on the Microenvironment

High-risk states
Normalcell
MMMGUS SMM
EMD
PCLHR
MYC translocationsP53 inactivationAmp1qWhole arm translocationsRB1 inactivationCDKN2C
T-regs
pDCsMDSCs
Increase in tumourpromoting cells

High-risk states
Normal
cell MMMGUS SMM
EMD
PCLHR
MYC translocationsP53 inactivationAmp1qWhole arm translocationsRB1 inactivationCDKN2C inactivation
NK cells Cytotoxic T
cells
Th cells
B cells
DCs
Decrease in tumoursuppressing cells

Do the tumour cells contain information which is able to disorganize the
microenvironment?

De-convoluting the immune micro-environment.The Rosetta project.

Sub-groups identified with distinct features independent of the major molecular subgroups
of disease. Cluster 5.

Mast cells EosinophilsT cells NK cells Macrophage
M2
M1
Cluster 5. High-risk microenvironment

Stromal cell
Plasma cellHepatocyte growth factor
Proteoglycan 2Interferon response genes IFIT1/3, ISG15, IFI6, IFI44L
VCAM
Extracellular matrix
Cancer testis antigen FAM133A
Mast cells EosinophilsT cells NK cells
SMAD, RASSF6,GBP1, MITD1,
MAD2L1, NDC80APOBEC3B
Macrophage
M2
M1
Plasma cell features associated with high-risk microenvironment

7. Identifying New DriversA Significant Percentage of Patients (15%) Have No Detectable Driver
Walker et al. Blood 2018
We are missing drivers either because they occur by a mechanism its difficult to find or
they occur in a part of the genome we haven’t examined.

10x Chromium WGS
SVsSNVs
Copy Number
N = 95 whole genome sequencing
The Non-coding Regions of the Multiple Myeloma Genome
Enriched for high risk molecular features
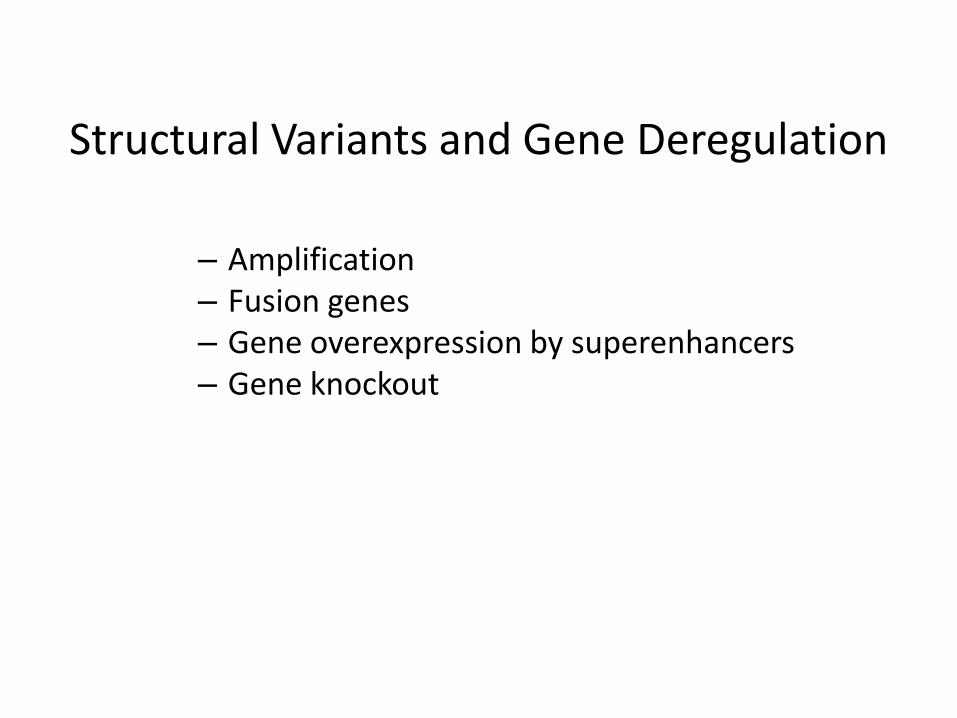
Structural Variants and Gene Deregulation
– Amplification – Fusion genes– Gene overexpression by superenhancers– Gene knockout

• 1q+ is present in 40% presenting MM and is a poor prognostic feature.• Frequently amplified by duplication or breakage fusion breakage cycles.• 1q12 site of hypomethylation which may be an important mechanism.• Genes at locus include CKS1B, ANP32E, BCL9•Translocates to receptor chromosomes and causes gain and loss of copy number•Deregulates MYC, BCL2, WWOX, CYLD, 17p-
Sawyers et al 2014 Blood
1q amp and JT1q12

Functional Groups of Fusion Genes

Translocations Drive Gene Overexpression via the Ig Gene Super-enhancers
Rearrangement of super-enhancers
Overexpression of FGFR3
IgH locus
FGFR3

Novel Ig Rearrangements
symbol cytoband Adjusted P Expression(event)
Expression(no event)
FoldChange Percent
MAP3K14 17q21.31 2.18E-55 15.0 10.7 18.6 1.6%CCND2 12p13.32 6.46E-06 18.4 8.4 1010.8 1.1%LRRC31 3q26.2 2.56E-16 8.0 0.9 137.4 0.4%
PAX5 9p13.2 0.00019762 15.8 8.2 187.9 0.4%
ZFP36L1 14q23.3,14q24.1 0.03199773 14.4 12.0 5.4 0.7%
We detected five novel significantly overexpressed genes when looking at structural events involving IgK, IgHand IgL.

57Plasma Cell Super-Enhancers
BRD4 and MED1 ChIP-seq to identify super-enhancer elements in MM1s cells
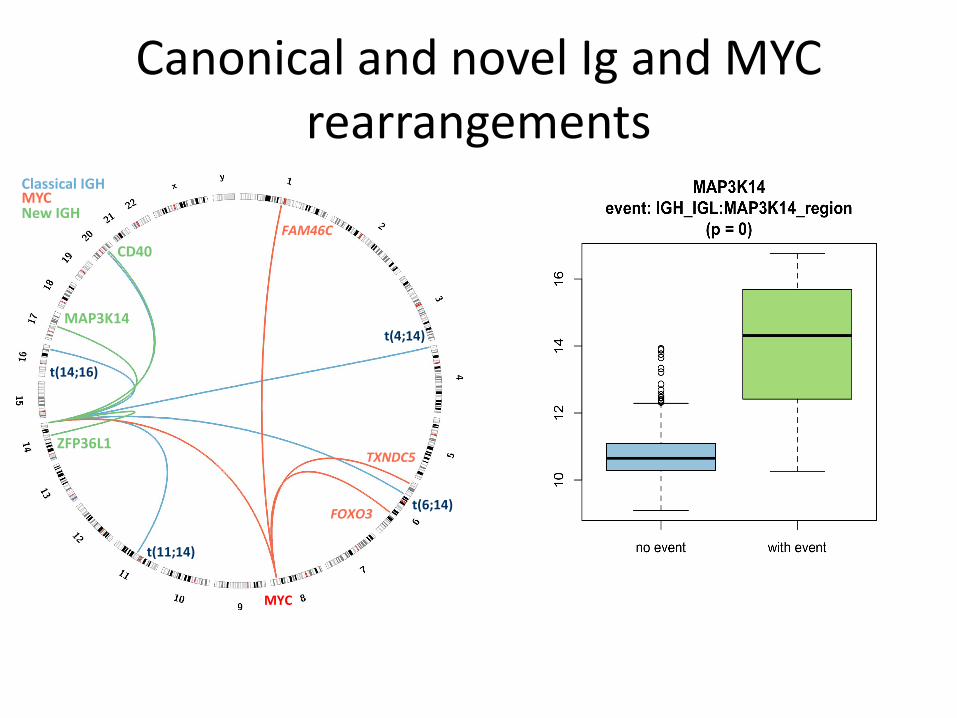
Canonical and novel Ig and MYC rearrangements
CD40
MAP3K14
ZFP36L1TXNDC5
FAM46C
FOXO3
MYC
t(4;14)
t(11;14)
t(14;16)
t(6;14)
Classical IGHMYCNew IGH

Chromatin Organization
Spielmann et al. Nature Reviews Genetics 2018
Topologically associated domains
“From a linear genome to a 3D structure.”

Maintenance of TAD Boundaries is Critical
Spielmann et al. Nature Reviews Genetics 2018
Maintenance of TAD boundaries is crucial to maintaining correct gene expression profiles.
Impacted by multiple mechanisms

TAD Boundaries Impacted by Many Mechanisms
Spielmann et al. Nature Reviews Gen
Maintenance of TAD boundaries is crucial to maintaining correct gene expression profiles.
Inversion
Tandem duplication
Deletion

IgH
FGFR3
IgH FGFR3
t(4;14)
Spielmann et al. Nature Reviews Genetics 2018
“Structural rearrangements function mediating gene dysregulation by the hi-jacking of the super-enhancers of donor
TADs and placing them within a receptor TAD to drive expression of oncogenes”
HypothesisTranslocations Break TAD Boundaries

Potential New Drivers Identified by Rearrangement to a Super Enhancer

MM is a Disease of Abnormal Transcription
Pérez-Salvia M, et al. Epigenetics. 2017;12:323-329.
Bromodomain inhibitors• Prevent bromodomains from
interacting with acetyl group• Downregulate gene
transcription
Bromodomains• Recognize acetylation marks in
histone tails• Recruit transcriptional
machinery• Promote gene transcription

Structural Events are Common
• Complex and simple.• Median number of structural
variants is 25 (range 1 – 182).• Intra chromosomal events
more frequent median of 14 (range 1 - 179) (P<0.001).
• Inter-chromosomal events median of 7 (range 0 - 29).
• Events seen on all chromosomes but most frequent• Chromosomes 14 – 64%.• Chromosome 8 – 53%.• Chromosome 1 - 44%.• Chromosome 6 – 42%.
Chromoplexy
Chromothripsis
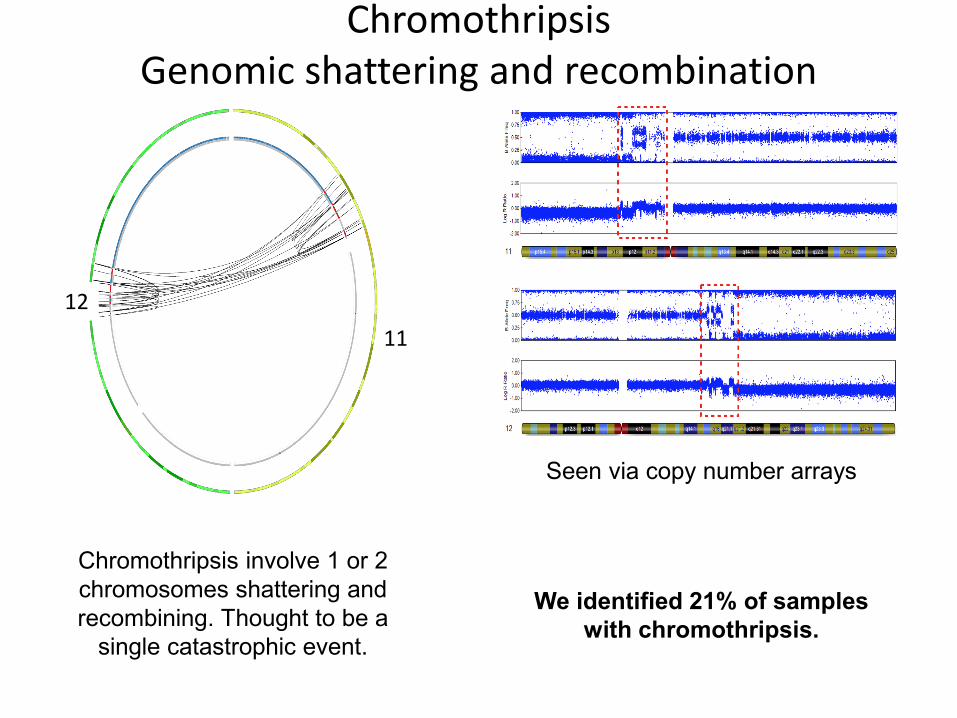
ChromothripsisGenomic shattering and recombination
Chromothripsis involve 1 or 2 chromosomes shattering and recombining. Thought to be a
single catastrophic event.
Seen via copy number arrays
We identified 21% of samples with chromothripsis.
1112

Chromoplexy results in derivative chromosomes
An example where chromoplexy developed sequentially over time
t(1;8;19) t(1;8;16;19)

Co-existence of chromoplexy and chromothripsis impacts survival
• Called rearrangements chromoplexyand chromothripsis on 500 cases with low depth whole genome sequencing.
• Samples with both chromoplexy and chromothripsis are associated with a shorter time to progression (P<0.001).

Genetic Events Associated With Multiple Myeloma
Morgan GJ, Walker BA and Davies FE. Nature Reviews Cancer. In 2012
Primary genetic events
IGH translocations (50%)• t(4;14) FGFR3/MMSET (15%)• t(6;14) CCND3 (4%)• t(11;14) CCND1 (20%)• t(14;16) MAF (4%)• t(14;20) MAFB• t(14;17) MAP3K14
Hyperdiploidy (50%)Trisomies of chromosomes3, 5, 7, 9, 11, 15, 19, 219 clusters
Secondary genetic events
Copy number abnormalitiesDeletion• Deletion 1p (30%) CDKN2C, FAF1, FAM46C• Deletion 6q (33%)• Deletion 8p (25%)• Deletion 13 (44%) RB1, DIS3• Deletion 11q (7%) BIRC2/BIRC3• Deletion 14q (38%) TRAF3• Deletion 16q (35%) WWOX, CYLD• Deletion 17p (8%) TP53
GainGain 1q (40%) CKS1B, ANP32E Gain LTBRGain TACIGain NIK
Secondary structural rearrangements• t(8;14) • Fusion genes • Non IgH translocations• Chromoplexy• Chromothripsis
Mutational events and the molecular hallmarks of myelomaA – Immortalisation Aetiologic eventsB – G1S abnormality CDKN2C, RB1, CCND, CDKN2AC – Proliferation NRAS, KRAS, BRAF, PTPN11, MYCD – Resistance to apoptosis PI3k/AKT, NF-κB, TRAF, CYLD, IkBE – Abnormal localisation and bone disease DKK1, FRZBF – Abnormal PC Differentiation XBP1, BLIMP, IRF4G – Abnormal DNA repair TP53, ATMH – RNA editing DIS3, FAM46C, SF3B1I – Epigenetic/PRC complex IDH1, UTX, MLL, MMSETJ – Abnormal Immune microenvironmentK – Abnormal energy metabolism an ADME events
Epigenetic events• Global hypomethylation from MGUS to myeloma• Gene specific hypermethylation from myeloma to plasma cell leukaemia• Epigenetic mutation and the compass complex

MyDrUG trial

Acknowledgements
NYU Myeloma ProgramGareth MorganFaith DaviesMichael GrossbardDavid KaminetskiMaher Adul HayJane Skok
Brian WalkerChris WardellCody AshbyEileen BoyleMichael BauerNiels WeinholdLeo RascheKatie RyanSamrat Roy ChoudhuryBart Barlogie
\
CRAB Seattle Adam RosenthalAntje Hoering
Celgene: Anjan ThakurtaErin FlyntMaria OrtizAndrew DervanSam DanzingerJake Gockley
Sarah JohnsonShayu DeshpandeYan WangFrits Van RheeMaurizio ZangariSharmilanThanendrarajaPhilip FarmerCarolina Schinke
UAMS
\
University Florida Jonathon Licht


![Smart Checklists for Crises Management Planning€¦ · gated the process of planning and elaborated on potential IT support for the planning process as demanded by [PL03]. At first](https://static.fdocuments.in/doc/165x107/5f01bb7c7e708231d400c53d/smart-checklists-for-crises-management-planning-gated-the-process-of-planning-and.jpg)


