Gap Migration and the Working of Urban Labor...
33
World Bank Reprint Series: Number 300 Dipak Mazumdar The Rural-Urban Wage Gap Migration and the Working of Urban Labor Market An Interpretation Based on a Study of the Workers of Bombay City Reprinted with permission from Indian Economic Reviezo, vol. 18, no. 2 (1984). pp. 169-98. Public Disclosure Authorized Public Disclosure Authorized Public Disclosure Authorized Public Disclosure Authorized Public Disclosure Authorized Public Disclosure Authorized Public Disclosure Authorized Public Disclosure Authorized
Transcript of Gap Migration and the Working of Urban Labor...
World Bank Reprint Series: Number 300
Dipak Mazumdar
The Rural-UrbanWage Gap Migrationand the Working ofUrban Labor MarketAn InterpretationBased on a Study of theWorkers of Bombay City
Reprinted with permission from Indian Economic Reviezo, vol. 18, no. 2 (1984). pp. 169-98.
Pub
lic D
iscl
osur
e A
utho
rized
Pub
lic D
iscl
osur
e A
utho
rized
Pub
lic D
iscl
osur
e A
utho
rized
Pub
lic D
iscl
osur
e A
utho
rized
Pub
lic D
iscl
osur
e A
utho
rized
Pub
lic D
iscl
osur
e A
utho
rized
Pub
lic D
iscl
osur
e A
utho
rized
Pub
lic D
iscl
osur
e A
utho
rized

World Bank Reprints
No. 258. Christiaan Grootaert, "The Conceptual Basis of Measures of Household Welfare andTheir Implied Survey Data Requirements." 7-Tie ReLieLW o)f Incone and IM'ealtlr
N o. 259. Guy Pfeffermann and Richard WVebb, "Poverty and Income Distribution in Brazil," 'I lreRe-'ieu ot)f InctimLO and 1 attltJ
No. 200. Pradeep K. Mitra, "A Theory of Interlinked Rural Transactions," Journal of PublicEconomics
No. 201. David L. Lindauer and Richard H. Sabot, "Tehe Public,/Private W,Vage Differential in aPoor Urban Economy," Jtournal of( D,,s,V,Lpmct c Eon,onmics
No. 262. J. B. Knight and R. fI. Sabot, "Labor MIarket Discrimination in a Poor Urban Economn,"J,ournal oif De'elt)oprient Studwisi
No. 263. Carl Dahlman and Larry \Westphal, "Technical Effort in Industrial Development: AnInterpretative Survey of Recent Research," TIrle Lt,eLrionrlic ot \ew Teclrrrolog1t'i inD,; zt,',,1,i,,' Coulnries
No. 2o4. N fi-hael Bamberger, "The Role of Self-HIelp Housing in Low-Cost Shelter l'rogramnsfor the Third World," Built B nzEironme'nt
N o. 265. Bela Balassa, "The Adjustment Experience of Developing Economies after 1973," IV11T
No. 20o. Bela Balassa, "Outward Orientation and Exchange Rate Policy in DevelopingCountries: The Turkish Experience.," 'Tlie A fiddle East Journald
No. 26". Dipak MlaVum1dar, "Segmented Labor Markets in LDCs," Armri or Economiic Reviewi,
No. 2c8. Stephen P. Hevneman and William A. Loxley, "TFhe Effect of Primary-School Qualityon Academic Achievement across Tw,-entv-nine Fligh.- and Lon -Incon(oe Countries,"Tie AInerican Journal oSf 5ociohtt I0
No. 2c,9. James R. Follain, Jr., Gill-Chin Lim, and Bertrand Renaud, 'tlou'Ling Crowding inDeveloping Countries and WVillingness to Pay for Additional Space: The Case ofKorea," Jo(rnal of I)fDez A j t ELcoromnclin
No. 2-0. Bela Balassa, "Policy Responses to External Sh cks in Sub-.Saharan African Countries,"Journr.i of RVi,-,,A
No. 27 1. 3aime de Melo and Sherrnan Robinson, "'Trade Adjustment Pl'icies and IncomeDistribution in Three Archetype Developing Economies," Journal' t L);'t elopmrfef
Io. 2'2. J. B. Knight and R. FI. Sabot. "The Role of the Firm in Wa-gte Determination: An AfricanCase Study," FOxblt' Enomic Ripe;r
No. 2 -3. Williarn G. Tvler, 'The Anti-Export Bias in Commercial P'olicies and Export Perfor-mance: Somne Evidence from Recent Braziliani Experienec."' \ '3t:e't-cirmiH!iJ:' :Xrcl
No. 274. Ron Duncan and i.rn1l Lutz. "Pe.e'tra1tirfl Of 1lr,lu41rIFal (1Country Ntrrl'.'L. bv Agricul-turai P, 'luc V from [I'. 'hld 'firn D% Countries." Dez '.l II )vco11mnnt
No. '5. M,fltoir- D. Bale, tFod ProsPCL1 in the DCel ping Countries: A QualifiedOptimistic View,v" Tr'he. 91: i,.1, .o onomne Re:KilL'' 'With TRonaldll C. DU11(n.!1 a(rid an ' rld
'.g i.~t L'trl Trade and Fon)d SecuLrity: Pl71uriry Patternsr arn Policy P DirtCi Ls" "c I i'ii J!w'' V R.y Smuthworth
No.2e "'. ' . n . i cr ' '~rr cc iRat C' .I i. Ie 1c' In 'ItC~, Juna I ' I I on
m-7. 2""" O I avrylvs n and lradj .^il '.uri 'Js I here ('aLl.tc for Export ()ptrnis ,m? An Inquiryinto ,e F X<itence ,t a Sec' lud (c'erreration of tU,Cess;ftll r\l u1( I> :.. :'i-[atIu t
,c 1, .' Z,
Indian Economic Review, Vol. XVIII, No. 2
The Rural-Urban Wage Gap Migration and the Working ofUrban Labor Market: An [nterpretation Based on a
Study of the Workers of Bombay City
DIPAK MAZUMDAR
SECTION I: THE CURRENT PARADIGM AND ITSALTERNATIVES 1
In the study of the-economic development of LDCs the analysis of the ex-pansion of urban employment and the attendant process of internal migra-tion is of central importance. Economic analysis and policy in the fiftieswere dominated by the paradigms proposed by Ragnar Nurkse and W.Arthur Lewis which draw largely rosy conclusions from the possibility ofan "unlimited" supply-of labor from the rural to the urban areas at a moreor less constant real wage. Surplus labor in traditional agriculture in "dis-guised unemployment" was expected to create favorable conditions for therapid accumulation of capital through the reinvestment of profits-in themodern sector of LDCs, if only the 'state or the "capitalists" took advant-age of this source of concealed savings. No prior act of savings was neces-sary through a lowering of real wages, as the enclosures might conceivablyhave brought about during the industrial revolution in Britain.2 The discus-sions of the 1950s did not pay particular attention to problems which mightdevelop in the ujrban labor market. The rural-urban wage gap was not ex-pected to be large (Lewis talked of 30% higher real wages in the urbanareas as normal), and unemployment or underemployment in the urban areascould not be substantial: migrants who in the urban areas could not securean income at least as much as they enjoyed in the rural areas by sharing inthe family pot would return to the farms even if their marginal contribu-tion to the rural family income was very small.
'The v;ews expressed in this paper are of the author and not of World Bank. Mythanks are due to Lalit Deshpande of 'Bombay University who conducted the fieldsurvey with the help of a large staff of interviewers over a period of two years. Heis, however, not in any way'responsible for the conclusions reached in this paper.
20ne school of thought contends that when the enclosure movement transformedland ownership from a communal to an individual basis, those with common rights toland had little alternative but to sell out to their more substantial neighbors and jointhe ranks of the landlcss.

170 DIPAK MAZLIMDAR
In the late sixties the paradigm of the urban labor market began tochange as observers became conscious of high rates of open unemploymentin many urban labor markets and urban poverty showed itself no less op..pressive than rural poverty. In the works of Frank (68), Todaro (69) andHarris and Todaro (70), the idea that rural-urban migration just meets theurban demand for labor was superseded by the concept that migrationis excessive. There are three distinct elements in this new paradigm:
-There is a large wage gap, maintained by institutional factors, bet-ween the rural sector and that part of the urban labor market which isdominated by factories or by public employment (variously termed the"formal", the "organized", or the "ILO sector").-People migrate in response to expected income, rather than the In-come they are actually likely to earn, so that they are prepared to ac-cept a period of unemployment in the bope of getting a high wage job.-Outside the "formal" sector, urban wages s :bject to competitive mar-ket forces can go down to significantly lower levels, and indeed are pus-hed down below the supply price of migrants as they crowd in to queuefor formal sector jobs. Such urban underemployment exists side by sidewith open unemployment.
I have called this view of migration and the urban labor market a para-digm because although the ideas have been summarized in simple mathe-matical models, and sometimes the models have produced some predict-ions about the urban labor market thit are not intuitively obvious, 3 theyhave not yet been tested empirically in any convincing way, and indeed it islikely that the formulations so far devised are too simple to be tested.4 To-daro, in his recent survey of the empirical testing of this group of ideas'was able to point only to studies of '`macro" migration functions, ratherthan studies of individual migrants behavior, as lending support to the ideathat migrants respond to expected rather than actual income differentials.Such functions only dem.onstrate that the rate of migration from a parti-cular area of origin is sensitive not only to the wage ievel, but also to em-
'Some examples are the follo%% ing. Urban job creation may aclually lead to a higherunemployment rate, cf. Todaro (76), revised by Blomqvist (78). Increases in employ-ment and wages in the formal sector may lead to a decline in average earnings overtime in the informal sector-Mazumdar (74). For the way induced migration affectsthe shadow wage rate in project evaluation, see Harris and Todaro, Mazumdar (76),Selowsky (78).
4 Little attempt seems to have been made in most formulations to go beyond highlysimplified views of the factors influencing migrants, decisions, and particularly theirexpectations about urban employment.
'Todaro (76), pp. 67-74,

Working of the Urban Labor Market 171
ployment conditions, in the destination point" -relationships that are intui-tively obvious and have been well documnented in the inter-regional migra-tion functions of various countries. 7 Such observations of behavior in theaggregate do little to explain the decision of the individual migrant to ac-cept unemployment, or an economic loss in a job paying less than he couldearn at home, with the hope of ultimately breaking into the high wage sec-tor, We shall return to this point later in this paper, but suffice it to sayhere that the length of time for which an individual migrant is prepared toaccept such loss is a crucial variable, to be examined both theoretically andempirically if the idea becind the Harris-Todaro type of migration functionis to be properly tested.
Before one comes to the migration function, and the urban unemploy-ment and/or underemployment it might generate, the initial postulate thatwages in the urban formal sector are artificially high must be studied care-fully. It is not enough to observe the apparent difference between the goingunskille(d wage in the factory or public sector and the wages prevalent inurban domestia service or in agriculture. One serious deficiency of both theLewis and the Harris-Todaro paradigms is that they treat labor supplied tothe urban market as of homogeneous quality. Yet peasant workers attractedto cities are likely to differ widely with respect to a whole list of variables-for example whether or not they have families to suipport in the city, bowlong they intend to stay in the city, or in a given type of work, their res-ponsiveness to urban work, and many others. The differential in wages oneobserves between the urban formal and informal sectors may in fact reflectdifferences in labor quality rather than the effect of institutions. In analyz-ing these wage differences it is possible, with moderate success, to allow fordifferences in standard human capital variables like education or experi-ence. Such variables have been shown to have a considerable influence onwage rates in LDCs, and perhaps a greater influence than in the industrialeconomies. Other indicators of labor quality, even when measurable, areless easily tractable in earnings function types of analysis, but may be ex-tremely important. We shall discuss this point more concretely later in thepaper.
Empirically it is difficult to quantify wage differences between sectors,if any, for labor of equivalent quality. But when the apparent differentialis large, and institutional factors in wage determination seem to be strong,care should be taken to see if differences in labor quality (other than the
6Little attempt seems to have been made in most formulations to go beyond highlysimplicified views of the factorsinfluencing migrants decisions', and particularly theirexpectations about urban employment.
7See a survey of the migration literature by Greenwood (75),
172 DIPAK MAZUMDAR
education-experience variables which are commonly controlled for) are notresponsible for a substantial part of the wage difference. Thlough wages inthe formal sector may appear to be determined by institutiong, employerscan always, ';o some extent, adjust the quality of labor they employ in orderto minimize labor costs if wages are altered substantially by institutionalforces.8 Indeed, institutional factors may often do no more than hastenchanges in labor quality standards that employers are already introducing.
OCne of the most important distinguishing features among rural-urban mig-rants in LDCs is the type of migration.' In particular, a distinction to bemade between individual migrants, who live in the urban areas withouttheir families, and migrants who bring up a family in town. Note that thedistinction is not between migrants who migrate xith or without theirfamilies, but between migrants with different family compositions in the urbanarea during their urban residence. Tn many LDCs a large proportion of malemigrants live on their own, or with similar migrants in all-male households.Such households exist side by side with families.
The importance of this distinction between the two types of migrantsis that they differ in their supply prices as well as in their desirability forurban employers. The difference in supply prices means that migrants withfamilies are willing to accept employment only at a higher urban wage thanindividual migrants. The major reasons for the difference in supply prices ofthe two types of migrants are: (a) the substantially hiigher housing costs forthe family migrant in town; (b) the lower earning strength of the famil intown, because women and children are less easily part of the urban laborforce than they are of the rural; and (c) the existence of disguised unemp-loyment on family farms, which could make the marginal contribution of
Upgrading and downgrading jobs in response to changes in labor market condi-tions, rather than altering the pay associated with the job, has been recognized as awidely practiced method of market adjustment, cf. Reder (55). The increase in laborproductivity in response to minimum wage legislat on, without a change in productiontechinques, is dramatically documented in a study of Puerto Rico by Gergory andReynolds (65).
9The difference between migrant types with respect to the permanence of theirattachment to the urban labor market have been stressed for a long time in Africanlabor history. One of the m-ainsprings of the effort to increase wages in the formal sec-tor of Africa through minimurm wages legislation has been the desire to stabilize mig-rating labor which was said to have been a drag on Afri-ean prodctivity.
Working of the Urban Labour Market 173
an individual worker low relative to the average income per earner of thefamily.'.
The reason for the higher demand price of family migrants is that theyare settled in the urban environmet, and likely to be more stable; the rela-tionship between stability and productivity of labour is well documented inthe literature."1 Certain types of employers will pay the higher wage thatwill attract family migrants, because the higher productivity of such wor-kers will more than offset their higher wage cost."2
The relationship between stability and productivity need not be equallystrong in all sectors of the urban labor market. In the formal factory sectorwe could expect employers to profit considerably from the existence of astable labor force. But in many parts of the informal sector-in smallshops or eating houses for example-productivity increase with stability oflabor is likely to be minimal. Under competitive conditions., then, wewould expect wage differentials to emerge in the urban labor market withthe higher wage sectors attracting more stable family migrants.
A. A Revised Hypothesis
I would thus like to suggest a revision of the current paradigm of theurban labor market stemming from the Harris-Todaro work, on each ofthe three points noted earlier:
- A wage gap exists between the formal urban sector and the rural areas,with formal urban sector wages reflecting the cost of employing migrantworkers accompanied by their families, who, like native urban workers,
10The family gains an amount equal to the average income because the departingmigrant no longer shares in the family pot, and it loses a smaller amount equal to thelatter, marginal product. Thus an individual wanting to help his family would be will-ing to migrate at a very low supply price, perhaps one that will merely cover his sub-sistence cost in town. This is especially relevant for people who migrate for only apart of the year (seasonal migration) or a part of their working life (periodic migra-tion). In African agriculture the disison of labor between the sexes means that able-bodied males. who are responsible largely for the heavy work of felling trees andclearing bushes, needed about every two years, could be absent for two years at atime without affecting the productivity of the family farm.
"The economic cost of non-stable labor has been widely studied for African urbanlabor, based as it was on the migrant labor system. An early and careful study of aNatal Dunlop Factor:! came to the conclusion that, because of the migratory tenden-cies of native workers, their productivity came to only 290% of that of European wor-kers while the potential productivity of a stable native worker was as high as 81% ofthe European worker's-University of Natal (5Oj, Chapter V.
12"t is necessary for this argument only that the bulk of stable labor be supplied byfamily migrants. Some individual migrants may indeed be stable without affectingthe reasoning.

174 DIPAK MAZUMDAR
are more stable and hence more productive than other migrants. Insti-tutional factors affecting wages may push up wages beyond this level,but not necessarily so, and certainly not by as much as cursory glanceat earnings &i'a for individual workors would suggest.
- There are different types of migrants attracted from the rural to theurban areas, and the analysis of equilibrium in the urban labor marketwill be incomplete if we leave out of account the different supply pricesof these different types. In particular, the supply price of individualmigrants will be substantially lower than that of family migrants.
- The difference in wages between the formal and other sectors of theurban labor market will be related to the difference in supply prices offamily and individual migrants. The high-wage formal sector will havea workforce k..ich contains a larger proportion of family migrants, whotend to be more permanent, than the nonformal sectors in which thelower wages will attract predominantly individual migrants of lesserstability.
-The revised hypothesis provides an explanation of wage differentials-between the rural and urban markets and between different sectors ofthe urban market. It does not -as the Harris-Todaro paradigm pur-ports to do-contain any prediction of excessive migration or urbanunemployment. But then we have yet to see empirical work whichdemonstrates that urban unemployment rates are extremely high exceptfor particular groups-mainly educated labor-for which specific ana-lysis and diagnosis are called for.'3
I have used the framework of this hypothesis, with its stress on diffe-rent migrant types, as the basis for the analysis of wage determination inthe textile industry of Bombay" before the Second World War. My attemptwas to provide explanations both for the rural-urban wage gap and forearnings differentials between casuals and permanents employed in the in-dustry. Thus the hypothesis is not so much a new proposal as an attemptto introduce into the analysis of urban labor markets in LDCs earlier ideaswhich had been inexplicably neglected in the current literature.
I was fortunate in obtaining the collaboration of Bombay University inundertaking a special survey of the Bombay labor market in the years1972-73. The Survey answered the need to obtain information on differentparts of the labor market-the formal as well as the informal-on a range
"See, for example, Mark Blaug and Richard Layard, Graduate Unemployment inIndia, London, 1970, and my own forthcoming work on the problem of urban unemp-loyment in Malaysia.
14 e Mazumdar (59) for an early theoretical suggestion and Mazumdar (73),
Working of the Urban Labor Market 175
of common topics. The Survey sample is described in Section II, after abrief review of the broad structure of the Bombay labor market.
In Section III we begin the analysis of the material obtained from theSurvey on the differences in earnings between sectors. Section IV sets outthe profile of the workforce in each sector to highlight its composition,distinguishing migrants in terms of their duration of residence in the cityand their period of work in their current job. Section V analyzes imperma-nence of migration in the different sectors in terms of the material present-ed in the previous sections, the question of waiting before the first job, andjob changes in the urban labor market. It then proceeds to discuss familysize in Bombay. The latter is a crucial variable in the argument linking iledegree of permanence of migration on the one hand, and the supply priceof migrants on the other. We conclude witlh a recapitulation of the mainresults.
We should be careful to note that throughout the analysis all the resultsrefer to male wage earniers only. Female workers are in a small minority inthe Bombay labor market. Our survey did collect information on females,but an analysis of this important topic is outside the scope of this paper.
SECTION II: THE BOMBAY LABOR MARKET AND A DESCRIPTIONOF THE SURVEY SAMPLE
A. Structure of the Bombay Labor Market
Heather and Vijay Joshi1 5 have given a breakdown of the city's labor forcebetween the organized ond the unorganized sectors, classified by industryand the worker type, for the year 1961. They used the employment datacollected by the Directorate of Employment and Training (which coveredall public sector establishments and privately owned establishments (,mploy-ing 25 or more workers) to map out the limits of the "organized" sector.The difference between this set of figures and the Census returns for thesame year give the structure of employment in the "unorganized" sector.The Joshis note that this classiflcation more or less identifies the organizedsector with workers who are effectively covcred by labor legislation,although theoretically the Factory Act extends beyond this limit to workersin establishments with no less than 1O employees, if they use electric powerin their operations.
15Heather Joshi and Vijay Joshi, Surplus Labour and City: A Study of Bombay (Delhi1976.

176 DIPAK MAZUMPAR
TABLE I
STRUCTURE OF EMPLOYMENT, GREATER BOMBAY, 1961(Percentages of the Total Workforce)
Industry Organized Total Unorganized Sector Others Employers TotalEmployees Employees
Manufacturing 28 12 7 2 43(including PrimaryProduction)
Construction andUtilities 3 1 * 1 4
Trade andCommerce 3 12 5 7 3 18
Transport and
Communications 6 5 3 2 * 11
Services 9 14 10 4 * 24
Total 50 45 26 19 5 100
fNote: The total workforce of Bombay in 1961 was 1.687 million. An asterisk meansless than 1%. Some totals do not add up exactly due to rounding.
Source: Joshi and Joshi, op. cit., Table III. 2, pp. 54-5.
Table 1 gives a breakdown of the employment structure in 1961 by broadcategorieg as calculated by the Joshis. The unorganized sector, which pro-vided about half of the employment in the city, accounted for a dispropor-tionately large share of trade, commerce and services, although it is interes-ting to note that the manufacturing unorganized sector was also quite large.A little less than half of the workers in the unorganized sector were non-employees. These were single workers, family workers and workers in house-hold industry. The category of single workers should be explained. TheBombay labor market, then as now, makes use of a large number of wor-kers employed on a daily contract, as and when work becomes available,much like dock labor in ind ustrial countries. These workers are not attach-ed to any particular enterprise but they do show a significant amount of
occupational and industrial specialization. There are well known areas inthe city, almost like market places, where such workers assemble each day

Working of the Urban Labor Market 177
and are hired on' a casual day-to-day basis. Such casual labor is a substan-tial part of the non-employee labor force of the unorganized sector; thefigure given for 1961 in the table probably underestimates the share of theunorganized sector in the total employment in Bambay at that time- This islikely because casual laborers working in the manufacturing sector wouldhave been included in the returng on total employment obtained by theDirectorate of Industfy from the individual enterprises. In the textile in-dustry such labor at this date could have accounted for as much as 20-25%of the work force.
B. Changes in the Composition of Emplojment, 1961-1971
Our survey of the labor market was undertaken in 1973-74. Joshi and Joshihave provided estimates of the growth of employment by sector for theintercensal decade 1961-1971. Their figures are given in Table 2.
It should be noted that the Census of 1971 used a different, and ineffect more conservative, definition of workers from that used in 1961. Thus,using the 1961 definition, the Census figure for workers for 1971 is an underestimate; Joshi and Joshi suggest of the order of 4 percent. The "organized"sector figures given in Table 2 were obtained from the returns of the Direc-torate of Industry and are not affected by this change in definition. Thus,allowing for the change in census definitions, the growth of organized sec-tor employment in Bombay lagged behind that of total employment by per-haps 1 percent per annum; the lag was greater for the manufacturing sectorof Greater Bombay. However, Table 2 also shows that if we include theexpansion of employment in the satellite towns of Thana urban districtsthe lag in the organized sector growth rate is substantially less.
TABLE 2
PERCENTAGE RISE IN EMPLOYMENT BETWEEN 1961 AND 1971
Greater Greater Bombay andBombay Thana Urban Districts
Population 43.8 46.1
Workers: Census 30.3 32.8
Workers: Organized 25.8 34.4
Manufacturing: Census 35.0 39.9
Manufacturing: Organized 22.3 35.0
Source : Joshi and Joshi, op. cit., Table III. 3, pp. 58-59.

178 DIPAK MAZUMDAR
Another aspect of the organized sector employment growth needs to benoted. It is the major change in the industrial composition of employmentin Bombay City during the decade. Employment in cotton mills, whichaccounted for almost one-half of total manufacturing employment in theorganized sector of the city in 1961, remained virtually stagnant through-out the decade. The increase in employment in organized industry camelargely from very high rates of growth in newer industries-particularly themore skill-intensive industries like petro-chemicals, pharmaceuticals andelectronics.
C. The Survery Sample
It was decided to cover three sectors of the market: (a) the single workersand the casuals as we have described them above; (b) the workers in thesmall-scale sector; and (c) the workers in factories. We also decided toexclude form the sample owner/workers and family workers who constitutean important proportion of the city's "informal" sector of workers. thestudy was deliberately limited to wage earners.
The sample framework was provided by lists of establishments in thecity-for factories, the list maitained by the Chief Inspector of Factories, andfor small establishments, the registers maintained by the Municipal WardOffices. The sample size of workers to be interviewed was predeterminedfor each of tiie three sectors of the labor market, and the total for eachsector was distributed among establishments belonging to different industr-ial groups, so as to ensure that for each sector of the market the sample ofestablishments reflected the industrial distribution of the wage earners.For each of the factories selected, the quota of workers to be interviewedwas selected at random from the employee rolls, while for the small-scalesector, whose average employment was' 2.9 workers per establishment, allthe wage earners in each of the sample establishment were surveyed. Thissize of the sample was about 2,700 workers in factories and 2,000 workersin small-scale units.
The casual workers are not attached to any establishments. Thus we donot have a sample frame for an establishment-based survey. It was decidedto survey 1,100 casual workers randomly selected from those who gatheredfor work in the well-known market places for casual workers, but takingcare to ensure that the industrial composition of the sample reflected theindustrial distribution of the population of single workers in the city, asderived from census data.
D. The Labor Market Problem in Bomnbay City: Open Uneinployment vs.Low Income
The survey emphasized the differences in earnings between sectors, and inter

Working of the Urban Labor Market 1i9
alia, the causes of low incomes. Those totally unemployed at the date of thesurvey were not included. The casual workers by definition were not emplo-yed on a regular basis, and would be unemploy-ed some days of the month,but the survey found only a small incidence of unemployment among them.The average number of days worked per month by the sample of malecasual workers was 23, giving an overall rate of underemployment of about10 percent (asguming 20 days to be full employment for most workers).
An aspect of unemployment captured for the entire sample was theperiod that migrants waited for their first job in the city. Migrants wereasked whether they had a fixed job or firm offer of a job before they came.At another point they were asked about the length of unemployment beforetheir flrst job rn Bombay at still another about who supported them duringtheir period of waiting. The results for the sample are reported in Table 3by sector.
TABLB 3
PERCENTAGES OF MIGRANTS WITH LITTLE WAITING BEFOREPIRST JOB
Sector Migrated with fixed No unemployment No needfor supportjob or firm offer beforefirst job because of no
waiting
Factory 21.2 32.2 45.2
Small-scale 24.9 36.3 49.8
Casual 13.8 20.0 n.a.
It is interesting to see how the proportion of migrants who said they hadno long wait increased as the quegtions were phrased more loosely. In boththe factory and small-scale sectors, it appears nearly half the sample of mi-grants more or les,s sailed into their first urban job. Waiting was clearlymore common among casual workers.
The distribution of migrants sampled by their reported period of actualunemployment before the first job is given in Table 3.
It is clear that those who were unemployed for a reasonably long period,say more than 3 months,1 6 were in a minority. It is also interesting to notethat this proportion was higher in the factory sector than in the other sec-tors-which is consistent with the model of queueing up for high wage jobs.
16We checked to see if these figures were affected by excluding from the samplethose who had arrived in the city as children. They were not.

180 DIPAK MAZUMDAR
In the absence of a model specified in detail it is difficult to assess the pre-valence of long periods of unemployment. Intuitively, a mere 15% of thesample waiting more than 6 months does not appear to be an excessive pro-portion in a normally functioning labor market, without a preponderance ofHarris-Todaro gamblers.
None of the migrants financed themselves, from savings or borrowings,while unemployed. Of those who needed help, 50" said they received sup-port from their family members-and rather more did so in the factorysector, perhaps a reflection of the higher income of the relatives who helpedthem. Even the two other types of helpers who were mentioned in signifi-cant numbers in the response of the workers to the questionnaire-viz. "castefellows" and "native persons" (from the same area of origin)-typically didnot accept any payment for their support.
We conclude that there is little evidence of the type of "investment inuneirployment" for the fresh migrant to the urban market which has beenstressed in the Harris-Todaro paradigm. Since much of urban unemploy-ment in their view is ascribed to this phenomenon, it would appear that thisparticular problem is not important in the Bombay labor market. On theother hand, as we shall see, the differences in earnings in different parts ofthe market are significant.
SECTION Iii: EARNINGS DIFFERENCE BETWEEN SECTORS
We begin our explorationi of the working of the Bombay labor market byanalyzing the difference in earnings bstween the tlhree sectors distinguished-casual, small-scale and factory. To make the comparison meaningful theanalysis is confined to male manual workers. The earnings of such workerswould, of course, be affected by their personal characteristics as well as bytheir sector of employment. We want to know about the extent of earningsdifferences after controlling for the human capital endowments of the wor-kers.
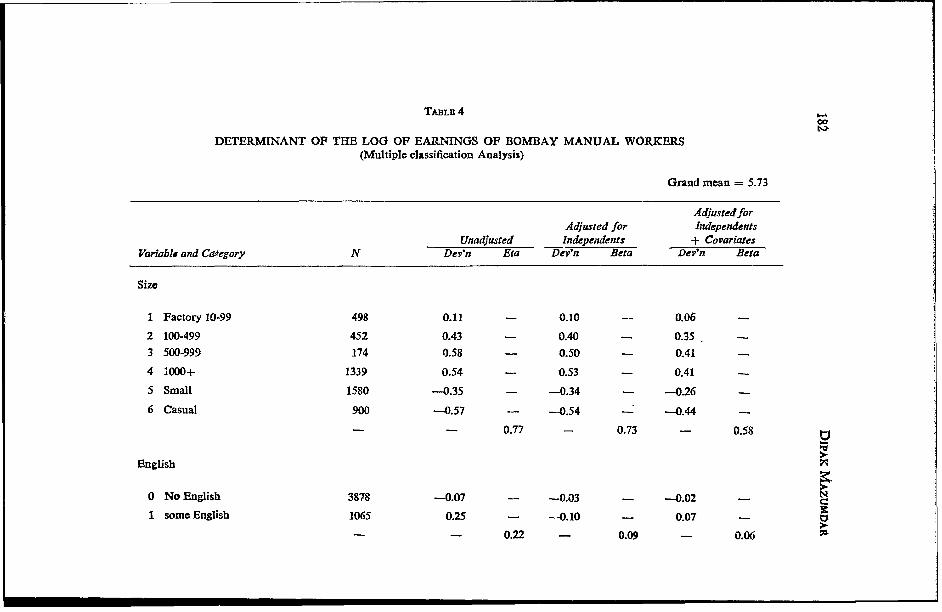
The form of analysis which we found most convenient to undertake forthis statistical exercise is Multiple Classification Analysis-"a method ofdisplaying the results of the analysis of variance especially when there areno significant interaction effects."" This form is particularly useful when theexplanatory variables are in categoric terms, so that they can best be enter-ed into the analysis as sets of dummy variables. The details can best beexplained by reference to Table 4 which sets out the results of the MultipleClassification Analysis of the log of earnings (LNWAGE)'8 in terms of sixexplanatory variables entered in categoric terms and two variables-age and
17SPSS. p. 409.'8Earnings are defined as total monthly earnings in cash pluts income in kind (food,
accomodationJ in the main employment.

Working of the Urban Labor Market 181
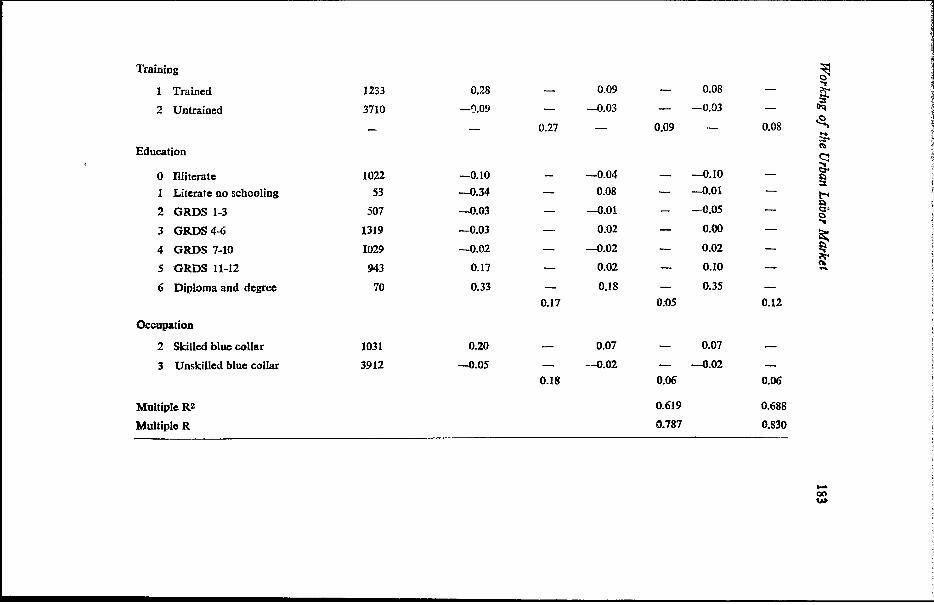
age)2 -used as continuous ones. The grand mean of 5.73 at the top of theTable gives the overall mean of the log by earnings of the entire sample.The first column of the Table lists the explanatory variables, and within eachgroup the categories which have been distinguished. Thus for sector of em-ployment (called SIZE) the explanatory variable categories distinguishnotonly the casual, and the small sectors, but also factories of four different sizegroups (in terms of employment). The other variables and the categorieswithin each variable can be readily read off from this column. The secondcolumn (N) gives the number of observations falling under each category.This is a very useful piece of information to display, since it gives the lela-tive importance of the different categories in the sample. The third columngives thc effect of each variable (i.e. each subcategory of those entered in theset of explanatory variables) upon monthly earnings of the sample when eachvariable is working alone: it is expressed as the gross deviation of the meanearnings of the particular category from the overall grand mean. The nextcolumn-col (4)-on the other hand, displays the "net" effect of each vari-able on earnings-that is after controllinig for the effect of the other vari-ables. The statistics-ETA and BETA-entered under columns (3) and (4)correspcnd to simple and partial correlation co-efficients-ETA gives theproportion of the variance in earnings explained by each variable (in thiscase each package of the subcategories used, e.g. Size, Education etc.).BETA, on the other hand, is the proportional reduction in the residualvariation after the effect of the other variables has been taken into account.The BETA statistics thus gives an idea of the ranking of each explanatoryvariable in explaining the monthly earnings of workers. The last columngives the set of deviations of earnings from the grand mean for each cate-gory when we control for the other explanatory variables which are enteredas continuous ones- called covariates. These arc AGE and (AGE) 2. It isseen that the gross deviations for the various categories are reduced whenother factors are controlled for in the last two categories.
The model performed remarkably well explaining no less than 69 per-cent of the variance. The program gives the significance of the variablesincluded (not shown). All of them were significant at the one percent level.The significance of the interaction among the independernt variables wasalso tested. Only two of the ten possible two-way interac-tions were signifi-cant-that between size and training, and that between training and occu-pation. Even in these two cases the F-values were pretty low-2.26 and2.30 respectively-compared to the explanatory variables taken singly.
The analysis of earnings in the MCA program given in Table 4 showsthe remarkable importance of the sector of work as the major determinantof earniings for manual workers in the Bombay labor market. This is reveal-ed by the ranking given by the BETA values and the spread of earnings
TABLD 4 1-
DETERMINANT OP THE LOG OF EARNINGS OF BOMBAY MANUAL WORKERS(Multiple classification Analysis)
Grand mean = 5.73
Adjusted forAdjusted for Independents
Unadjusted Independents + CovariatesVariable and Ctz.tegory N Dev'n Eta Dev'n Beta Dev'n Beta
Size
1 Factory 10-99 498 0.11 - 0.10 0.062 100-499 452 0.43 - 0.40 - 0.35.3 500-999 174 0.58 - 0.50 - 0.414 1000+ 1339 0.54 - 0.53 - 0.41S Small 1580 -0.35 - -0.34 - -0.266 Casual 900 -0.57 - -0.54 - -0.44
- 0.77 - 0.73 - 0.58
English
0 No English 3878 -0.07 -0.03 - -0.02 - N1 some English 1065 0.25 - --0.10 - 0.07 -
0.22 - 0.09 - 0.06
Training
1 Trained 1233 0.28 - 0.09 - 0.08 -
2 Untrained 3710 -0.09 - -0.03 - -0.03 -
- 0.27 - 0.09 - 0.08 '
Education
0 Illiterate 1022 -0.10 - -0.04 - -0.10 -
1 Literate no schooling 53 -0.34 - 0.08 - -0.01 -
2 GRDS 1-3 507 -0.03 - -0.01 - -0.05 -
3 GRDS 4-6 1319 -0.03 - 0.02 - 0.00 -
4 GRDS 7-10 1029 -0.02 - -0.02 - 0.02 -
S ORDS 11-12 943 0.17 - 0.02 - 0.10 -
6 Diploma and degree 70 0.33 - 0.18 - 0.350.17 0.05 0.12
Occupation
2 Skilled blue collar 1031 0.20 - 0.07 - 0.07
3 Unskilled blue collar 3912 -0.05 - -0.02 - -0.02 -
0.18 0.06 0.06
MultipleR2 0.619 0.688
Multiple R 0.787 0.830
Mp

184 DIPAK MA,UMDAR
between the subcategories within each variable. Thus taking education asthe next most important variable in the determination of earnings, the "net"spread in the log of earnings between illiterates and those with Diplomas is0.33. On the other hand, the spread of the log of earnings between casualworkers and those working in large factories is no less than 0.84.19 It is alsointeresting to note that within the factory sector itself, earnings of manualworkers are different after controlling for other factors. In particular thoseworking in factories employing 10-99 workers earn considerably less thanthose working in larger foctories, although they earn substantially higherthan casual workers or those in small establishments. The cut-off pointwithin the factory sector seems to come at the level of units with 100 ormore workers. The "net" difference in earnings in the three size classes dis-tinguished in factories above this size are not very large.
The importance of the net effect of the size of establishments on earn-ings within the factory sector cannot be overstressed. The Factory Act coversworkers generally in most units employing 10 or more workers. The factthat even within the units covered by labor and wage legislations, we findsignificant increase in earnings with factory size suggests that institutionalfactors are not entirely responsible for the result obtained.
We have already noted that the two-way interaction between SIZE andEDUCATION was not significant. This was independently varified by look-ing at the percentage distribution of workers in the three sectors by educa-tional levels-and no striking difference was observed. Evidently, education-al credentialism does not play any role in recruitment to the high wage sec-tor of the manual labor market in Bombay as has sometimes been suggestedin other LDCs.
SECTION IV: DIFFERENCES IN THE INCIDENCE OF
TEMPORARY MIGRATION
Having established the existence of very large differences in earnings bet-ween casual, small-scale sector, and factory workers, our next task is to
analyze the differences in the proportion of temporary migrants in the threesectors, before assessing how they correspond to differences in earnings.
Migration may be temporary in two senses. Migrants may come to thecity for some seasons of the year, but also take part in economic activity intheir rural areas of origin. No Significant number of the migrants sampledwere "temporary" in this sense. About a third of the entire sample had
not visited their ancestral homes at all during the Jast three years. Even theother two-thirds only visited occasionally, for short periods. About half of
19That is, controlling for other factors earnings of workers in the largest factories
are 2.3 times those of casual workers.

Working of the Urban Labor Market 185
those who did visit their native place said their purpose was to "visit rela-
tives". Only 14% mentioned helping family farms or businesses as reasonsfor visiting.
Migratior may also be seen as temporary if migrants decide to returnto their place of origin after a few years. Migrant workers who return neednot be the classical figures portrayed irt the economic literature of Africawho decide in advance to work in towns only for a limited period to earna fixed amount of cash. Their decision to remigrate may come graduallyduring their urban careers, and thus it is not possible to assess the impor-tance of this phenomenon by asking migrants in a sample survey theirintentiong about urban residence. In fact, in the Bombay survey 4 out of 5migrants asked about their purpose in migration indicated permanent em-ployment as their reason. Education came next in importance. Only in thecasual sector did a perceptible number-about 5% of the sample-explicitlyindicate that they came to the city for temporary employment; in the othersectors migrants with this declared purpose were negligible.2 0
Unfortunately, no accurate measures of return migration-its rate anddemographic composition-can be obtained from a one shot survey in anurban area. For such measures we need information at two points of timeon migrants' duration of residence, by age groups, such as can be derivedfrom census of population data. However, some suggestive conclusions-particularly on the differences between different sectors of the urban labormarket-may be inferred from the profiles of migrants.
Table 5 gives the percentage distribution of the workforce in each sectolrby duration of residence.
TABLE 5
PERCENTAGE DISTRIBUTION OF SAMPLE BY DURATION OFRESIDENCE IN THE CITY
Sector Years Natives1 1-2 3-5 6-10 11-20 20+
Casual 4.9 14.8 21.2 20.7 12.4 5.1 20.9
Small-Scale 4.5 8.6 16.3 17.0 19.3 14.0 20.3
Factory 0.1 0.8 4.3 10.3 30.4 32.6 22.3
2'Even in Kenya, where temporary migrants could be expected to be more com-mon, Rempel found that in his samp'e survey only about 13%o indicated their purposeof migration in a way that classified them as "circulator migrants"; cf. H. Rempel(1971).

186 DIPAK MAZUMDAR
The proportion of urban natives in the labor force is roughly the samein all three sectors. But the non-factory sector appears to be dominated byrecent migrants and the factory sector by long-term migrants: the propor-tion of migrants who have been in the city more than 10 years is larger inthe small-scale than in the casual sector, and much larger in the factorysector.
One point of clarification is called for regarding the proportions ofmigrant types just noted. A migrant is defined as someone who was bornoutside the city; hencc, migrants include those who came as children withtheir families; and were really brought up in the city.2" If such "child mig-rants" were disproportionately concentrated in the factory sector, our resultsjust quoted could be misleading. Table 6 shows, for each sector, the pro-portioin of migrants who came to the city as children, and the proportion ofrecent migrants assessed with and without these child migrants. It is seenthat the larger proportions of recent migrants found in non-factory sectorsare not due to a disproportionate concentration of child migrants in thefactory sector. Workers who migrated as children are indeed more likely tobe longer-term migrants no matter what the sector, so that when we confineour attention to migrants who came to the city as adults, recent migrantsform a greater proportion of the total migrants in every sector (see the lastcolumn of Table 6). Even so, the interesectoral differences in the proportionsof recent migrants are, if anything, increased.
TABLE 6
PROPORTIONS OF CHILD MIGRANTS AND RECENT MIGRANTS
Sector Proportion of Proportion of migrants ofmigrants who S years' or less durationcame at and Including child Excluding childbelow age 15 migrants migrants
Casual 17.2 40.9 444
Small-scale 29.6 29.4 32.9
Factory 33.5 5.2 6.8
2 l1n Indian cities mothers often return to their ancestral homes in the villages at thetime of childbirth. Thus the proportion of migrants in the population is exaggerated.

Working of the Urban Labor Market 187
The smaller proportion of recent migrants in the factory sector may becaused by one or a combination of three factors
- slow growth in factory employment;- a larger proportion of recruits to the factory sector being natives or long-
er duration migrants; and- return migration among migrants employed in the non-factory sectors.
As Table 2 suggested, in the last decade, employment in factories grewa little more slowly than that in the rest of the economy of GreaterBombay-a difference of about one percentage point per annum.22 A difference of this size is unlikely to explain the much larger percentages of-short-duration workers in the casual and small-scale sectors. The num-ber of new jobs coming up in each sector would also be affected by therate of turnover-and this rate could be lower in factories. Table 7 givesthe percentage distribution of workers in the different sectors by the dura-tion of their current job. It shows that factory workers hold their jobs formuch longer than those in the other sectors.
TABLE 7
PERCENTAGE DISTRIBUTION OF WORKERS BY DURATION OFCURRENT JOB23
SectorlYrs. year 1-2 3-4 5-6 7-9 10-14 15-19 20-29 30+
Casual 14.3 34.4 22.9 8.0 10.6 5.6 1.9 2.3 2.3
Small-scale 18.6 26.9 15.0 10.5 7,6 9.2 5.3 5.2 1.6
Factory 1.6 5.1 8.8 13.3 12.6 19.4 14.4 17.8 6.5
A. The Importance of Return Migration
It is now necessary to investigate how far the short periods for which wor-kers in the small- scale and casual sectors hold their jobs are due to jobmobility within the urban market, and how far they are due to return mig-ration. In the casual secotor, the number of jobs changed is a difficult con-cept because the workers are not attached to specific establishments: job
'2This is true of Greater Bombay but not of the surrounding urban area.23In the small-scale and the factory sectors "current job" means employment in
the enterprise in which he is currently working. In the casual sector It mcans the occu-pation he is currently pursuing.

188 DIPAK MAZUMDAR
mobility can only be measured if workerg change occupations or changesectors. Our survey, however, collected data on the number of job changesfrom the sample now employed in the small-scale and factory. sectors.Generally, the degree of mobility was surprisingly low. In both sectorsabout 40%/ of the migrants and 50- of the natives reported having no chan-ge of jobs at all in the urban market. Of course, this proportion drops withincrease in age, but even for the age group 35-44 the percentages of "non-movers" were as follows:
Migrants: in factories 38; in small-- scale sector 35.Natives: in factories 44; in small-scale sector 30.
Table 8 gives the average number of job changes by duration of resi-dence for the migrants in the two sectors. These are very low figures. Mig-rants on the average might have had one other job after being in Bombayabout 5 years in the small -scale sector, and 10 years in the factory sector.
TABLE 8
MIGRANTS: MEAN NUMBER OF JOBS CHANGED IN URBAN MARKET,BY DURATION OF RESIDENCE AND SECTOR OF CURRENT JOB
Duration ofResidence Small-scale Factory
(years)
less than 1 0.21 0-19
1-3 0-49 0.39
3-5 0.85 0.43
5-7 1.01 0.51
7-9 1.17 0.91
9-14 1.40 1.01
14-19 1.54 1.20
19-29 2.69 1.29
Above 30 1.85 1.50
These data on the low turnover rate of workers remaining in the urbanlabor market, together with the evidence in Table 10 that in the small scale

Working of the Urban Labor Market 189
sector a large proportion of the sample holds jobs only for short periods,
suggest that there is a higb incidence of return migration in this sector,
We know from the work of demographers that return migration is signi-
ficant in Bombay City. Zachariah (68), using information from the 1951
and 1961 censuses. found that in that decade outmigration from Bombay
was around 500,000 persons, of whlom three-quarters were returning mig-
rants. Roughly half the influx of population into Bombay during the decade
was offset through outmigration. As a percentage of the stock of migrant
population in 1961, the rate of outmigration was about 20%. Contrary to
some prevalent modlels, the peak rate. of outmigration was not among the
older, post-retirement, age groups. The hiphest rate of outmigration was
observed in the 30-35 age group.The 1971 census migration data have not yet been fully analyzed, but
preliminary calculations by Joshi and Joshi show that return migration con-
tinued in the decade 1961-71. However, along with a reduced rate of mig-
ration, relative to natural increase, the volume and rate of outmigration
seem to have fallen. Outmigration during 1961-71 probably offset one-
third rather than one-half of gross inmigration as in the previous decade.
This quantitative evidence of return migration for the Bombay popula-
tion as a whole provides only indirect evidence of the return migration of
migrants who have worked in the small-scale sector. To cast some light on
whether that sector has a higher than average incidence of return migra-
tion, Table 9 compares the distribution by duration of residence of the
migrant rmale population of Greater Bombay, obtained from the Census of
1971, with that for the small-scale sector of our sample.
Another possible reason for the differences shown in Table 12 is that mig-
rants may spend their early years in Bombay working in the casual-or small
scale sectors and then move to organized sector jobs. As we document more
firmly in the next section, such movement is of limited significance. Thus,
among migrants of- less than 10 years residence in Bombay, return migra-
tion is substantially more common among migrants in the small-scale and
casual sectors than it is for all migrants as a group-and we have already
seen that the average incidence of return migration is high.
TABLE 9
PERCENTAGE DISTRIBUTION OF MIGRANTS BY YEARSOF RESIDENCE IN GREATER BOMBAY, 1971
Population Years 1 1-4 5-9 10-14 15+
All male m;grant 2.4 12.6 18.7 15.2 51.1
Small-scale sector 5,7 22.5 23.7 16.6 31.5
Casual sector 6.2 37.2 29.0 13.4 14.2

190 DIPAK MAZUMrAR
B1 Return Migration, "Graduation", and the Harris-Todaro Paradigm
In the Harris-Todaro view of the migration process migrants enter the urbanlabor market through the "informal" sector, and if they fail to "graduate"to the formal sector within a reasonable (unspecified) period of time manyof them would return to their rural areas of origin. Thus, the larger propor-tion of recent migrants that we have observed in the small-scale sector, andthe greater importance of return migration that we have inferred in thissector are predicted both by the Harris-Todaro paradigm and the alterna-tive hypothesis advanced at the outset of this paper. The real distinguishingpoint of the two models is the mechanism of wage determination in theformal sector. In the Harris-Todaro view the elevated wage in the formalsector is institutionally maintained; in the alternative hypothesis it is deter-mined by the higher supply price of more permanent migrants. We shallturn to the question of what determines the higher formal sector wage inthe next section. But it might be appropriate at this stage to draw attentionto one aspect of the empirical evidence on "graduation" provided by oursample survey in Bombay City.
For the Harris-Todaro paradigm of the migration process, it is move-ment out of the nori-factory to the factory sector which is relevant. Suchmovement will only be a fraction of the total mobility discussed above.Evidence was collected in our survey about migrants with regular jobs now(both in the small-scale and factory sectors) who initially worked at casualjobs and subsequently moved to regular employment. Movers of this typewere only 11% of the total number of migrants who had changed jobs atleast once.24
Unfortunately, our data set at the moment does not allow us to quantifythe movement from the small-scale to the factory sector. But we have infor-mation on job changes within sectors, and thus can look at the 57% of thesample of migrants in the factory sector today who had changed jobs,. Dataon the industry of their first jobs in the city show that 67% of these work-ers started in manufacturing, where they are now. The other 330,, came fromdifferent industries-particularly trade and services. The trade and serviceestablishments in which the migrant factory workers of today and their firstjobs are very likely to have been in the small-scale sector. Thus, agsumingthat a fair proportion of those who changed jobs within manufacturing alsomoved from small manufacturing units to factories, perhaps as many as half
24The figure for those in the factory sector was higher-about 17°o- This partiallyreflets the casual system of recruitment of labor in the textile industry, discussed inMazumdar (1973), in which a worker serves as an apprentice or as a substitute vworkeron the day-to-day basis before getting a regular contract. The number of workers inthe textile industry affected by this system must be much smaller now, as employmentin textile factories has been stagnant for some time.

Working of the Urbatn Labor Market 191
of those who had changed jobs in the factory sample had moved from thesmall-scale sector. This makes the proportion of such movers about 25-30%bof the migrant sample in factories.
Thus there is a fair support for the "graduation" hypothesis for factoryworkers, but it is by no means the dominant pattern of entry into the fac-tory sector. It is also relevant to ask how long "graduation" takes for thefresh migrant, if he does in fact graduate to the factory sector.
In simple formalizations of the Harris-Todaro paradigm it is usual toexpress the new migrant's decision to come to the urban market as beinggoverned by his probability of getting a formal sector job. But surely a vcryimportant influence on his decision would be the length of time he wouldexpect to be in the informal or small-scale sector before his possible "gra-duation".
Some light might be shed on this question by examining the length ofresidence in the city of workers who have been employed in their currentjob for less than 5 years. Table 10 shows the distribution of these workersby length of urban residence, for the smali r'i- and the factory sectors.Among the factory workers with recently acquired jobs a relatively largenumber are natives of the city and migrants of longer duration. Furtlherprobing revealed that only a minority of these longer duration migrantscame to the city as children; the majority had had a prior spell of work inBombay City, presumably in the small-scale sector. Thus it appears fromTable 10, column 2 that, of the migrants recruited to the factory sector inthe last five years, nearly two-thirds had been in the city more than 5 yearsbefore obtaining a factory job.
A point of some importance begins to emerge at this stage. If conditionsin Bombay City are typical of those in urban labor markets, what kind ofimportance will a potential migrant to the city attach to the probabiiity ofgetting a factory job, if he has no prior connection to the factory sector? Ifthe recent past is any guide, the number of factory jobs opening up in thenext 5 years in Bombay City will be very limited, and even for this smallnumber, the new arrival would have less than one-third the chance of gett-ing a job of the natives and the longer term migrants already in the market.The small-scale sector has several times more jobs opening up, and thepossibility of a new migrant getting such a job is substantially higher thanthat of other job seekers. It would appear that unless the potential migrant'stime horizon is inordinately long, the economic gains from employment inthe small-scale sector must weigh much more heavily on his decision-mak-ing than conditions in the factory sector, even though the wages in thelatter are so much higher.
But we are already begging the question about higher wages in the fac-tory sector. The higher wages in factories-which our analysis in Section IIIestablishes-may not be artificially raised by institutional factors. Our

192 DIPAK MAZUMDAR
TABLE 1 0
PROPORTIONS OF NATIVES AND MIGR XNTS AMONG THOSEWITH RECENTLY ACQUIRED JOBS
Sector Duration Natives Migrants Migrants Migrants Migrantsof of 5 of 6 10, of 11-16 of 16+
Residence years' years years years(luration dutration dutration dutration
Factory 27.1 28.3 17.8 10.8 16.1
Small-scale 20.3 45.5 14. 9.7 10.2
alternative hypothesis offered in Section I would ascribe a large part of thewage difference between the sectors to a difTerence between the supply pricesof temporary individual migrants on the one lband, and those of more per-manent familv migrants on the other. It is to a discussion of this group ofissues that we turn in Section V.
SECTION V: "TEMPORARINESS" OF MIGRATION, EATUNINGSAND FAMILY SIZE
Despite the lack of direct evidence, we have established that the threesectors of the Bombay labor market differ substantially in terms of the pro-pensity of migrant workers to remigrate. Migrants in the factory sector,where earnings are highest, have typically been in the city longer thanmigrants in other sectors; those in the casual sector, where earnings arelowest, appear to be much more recent arrivals. To this extent the positiveassociation of the level of earnings and the permanence of migration hasbeen established. In fact, we can go further. The small-scale sector samplecan be brokern down into shops and commercial establishments on the onehand, and eating houses and hotels on tl-he other. In the latter, whichaccounts for about a fifth of the establishments sampled, a high proportionof those employed are very recent migrants. Natives were practically non-existent in this subsample; migrants with duration of 2 years or lesg consti-tuted 25% of the subsample, and those with less than 5 years' duration 52,,%.The respective figures for commercial establishmentE! arid shops were 22%,native, 12% migrants with less than 2 years' Yesidence, and 28;,, migrantswith less than 5 years'. The earnings in eating houses and hotels were sub-stantially lower-almost 45% in eating below the average for shops andcommercial establishments in gross terms, and 22% below controlling forother significant factors such as workers' educational levels.
The relationship between the degree of permanence of migration and theleyel of earnings is governed, in the hypothesis set out in Section I, by thp

Working of the Urban Labor Market 193
family size of the migrant, which determines his supply price. A stylized
contrast was presented between the individual migrant who is temporarily in
the urban labor market all by himself, and the permanent type who stays in
town with his family. In reality, of course, there will be no such stark con-
trast: along with a continuous distribution of migrants by their degree of
permanence (approximated by the duration of residence). We will observe a
continuous distribution of family sizes. The critical link between tho perma-
nence of migration and the supply price of the migrant is then his average
family size in Bombay or, alternatively, the proportion of his total family
living with him in Bombay.A comment on each of the two aspects of the variable average family
size in Bombay (hereafter called FSB) is called for-its relationship to the
permanence of migration, and to the supply price of migrants. First, Bombay
has an unusual predominance of single family households. (This is reflected
in the city's abnormal sex ratio. The 1971 Census reported that there were
only 716 females in the city's population for every 1,000 males.) The pro-
portion of single-member families is substantial in all three sectors of the
labor market included in our sample survey-45% in the casual, 49% in the
small-scale and 28%o in the factory sector. The proportion of such families
among migrants drops with duration of residence in the city, but is still high
among long-term migrants. Even among migrant factory workers, about a
third of those of 20-25 years duration are single-member families. The
question that arises is : does not this possibility of lone workers being more
or less permanent migrants undercut the link between FSB and the perma-
nance of migration? The answer is that the relationship is valid as long as
family size in Bombay increases with the duration of residence, signifying the
necessity of attracting larger proportions of bigger families at the margin to
achieve a more permanent workforce.Second, the supply price of migrants can be expected to increase with
family size because of the higlher cost of living in town and a higher
dependency ratio.-5 But the supply price has not been observed. All we can
do in the subsequent analysis is to test for a significant relationship between
FSB and the income of the earner. But establishing this link does not
prove that lower earnings in certtin se-s<;rs are caused by the lower supply
price of migrants witlh smaller families. It is only consistent with the hypo-
thesis, and we have to refer to other evidence to strengthen the direction
of the causal link, if we can.Our first task, then, is to assess the strength of the relationship between
FSB and the permanence of migration (as approximated by the duration of
:5The majority of single migrants were found to be in "free" accommodation. Inthe factory sector, 14% of the single migrants slept at their place of work, 38% livedwith friends and relatives without any payment, and only 36% lived in rented houses.

194 DIPAK MAZUMDAR
residence on the one hand, and the income of the principal earner of the familyon the other. For each sector, separately, a multivariate analysis of FSB wasundertaken with the duration of residence in Bombay and the income ofthe principal earner as explanatory variables. Control variables were usedfor the family size at home (in the rural areas) and income of the ,amily intown other than that of the principal earner. In each sector all four vari-ables were significant and together explained 28-37% of the variance.26 Inthe small-scale and the factory sectors, but most of all in the casual sector,the income of the principal earner and the duration of residence werepositively correlated. Hence, we used the interaction terms (in categories ofthe product of the two variables) in the final multiple classification analysis.As an example, the results for the small-scale sector are portrayed in Graph1. The major point emerging from the graph is that while the average fam-ily size of migrants increases both with the income of the principal earner andwith the duration of residence, it is much more sensitive to the former. It isseen that even 10 years duration of residence does not increase migrants'family size in Bombay to near the level of the natives, except at monthlyincome levels of Rs. 401-800. On the other hand, migrants with an incomelevel above Rs. 800, irrespective of their duration of residence, have a FSBmore like that of Bombay natives.
If the relationship between the FSB and earnings holds within each sec-tor, we can expect thie average FSB to vary across broad sectors of the labormarket in the same way as "net" earnings. This is indeed what we find, asthe data in Table 11 show.
TABLE 1 1
AVERAGE SIZE OF FAMILY IN BOMBAY
Sector Migrant Non-migrant All
Factory 3.30 5.59 3.99
Casual 2.34 4.49 2.88
Small-scale (All) 2.30 5.59 2.97
Shops - - 3.t0 I
CommercialEstablishments - 3.44
Eating Houses - 1.17
26The majority of single migrants were found to be in "free" accommodation. Inthe factory sector, 14% of the single migrants slept at their place of work, 38% livedwith friends and relatives without any payment, and only 36% lived in rented houses.
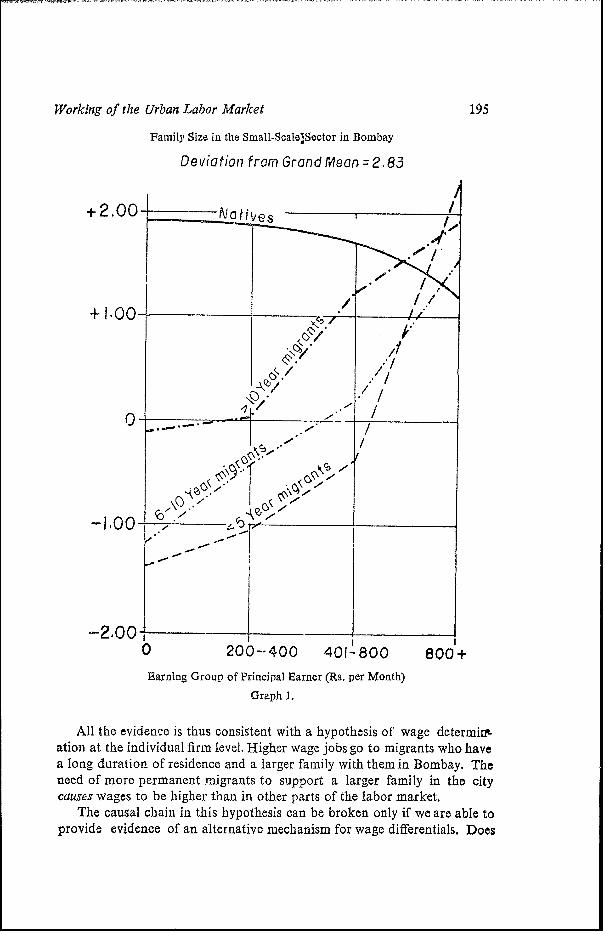
Working of the Urban Labor Market 195
Family Size in the Small-Scale]Sector in Bombay
Deviation from Grand Meon.= 2.883
+ 2.00
0~~~ I,"z
1.00- - 1
200 -400 401- 800 8/ +
Earning Group of Principal Earner (Rs. per Month)
Graph 1.
All the evidence is thus consistent with a hypothesis of wage determiration at the individual firm level. Higher wage jobs go to migrants who havea long duration of residence and a larger family with them in Bombay. Theneed of more permanent migrants to support a larger family in the citycauses wages to be higher than in other parts of the labor market.
The causal chain in this hypothesis can be broken only if we are able toprovide evidence of an alternative mechanism for wage differentials. Does
196 DIPAK MAZUMOAR
the hypothesis that wages are institutionally determined provide such analternative in the Bombay labor market? Outside the factory sector thereare no institutional influences on wages, and thus the evidence of differen-ces within the non-factory sector with respect to earnings, duration of resi-dence of migrants, and family size may be crucial. The fact that through-out the non-factory sector earnings rise with the duration of residence andthe size of the family in Bombay tends to support the hypothesis.
In the factory sector wages have been institutionally determined, alongwith other conditions of work, for about a decade. But two points should benoticed. First, my work on wages in the textile industry in the city showedthe existence of a substantial wage gap with respect to certain other types oflabor in the labor market for many years, well before the era of instituti-ons2 7
. Second, ft is not at all clear that institutional wage setting has increasedreal earnings of workers in Bombay factories significantly since the SecondWorld War. At the same time, the factory labor force, as we have seen,shows a very high degree of permanence of residence and stability ofjob tenure-even more than it did before the institutional interventions ofthe post-war years.
SECTION VI: CONCLUSIONS
The following are the major conclusions of the paper, some less unequi-vocally proved than others.
Differences in earnings are substantial between sectors of the labor-market, and are only reduced when we control for factors (such as educa-tion) typically allowed for in earnings function analysis. Workers in thelargest factories earn just above twice as much as casual workers.
Activities with low r levels of earnings have a larger proportion of mig-rants with a short duration of urban residence. Takern in conjunction withthe distribution of workers by length of work in the current job, and thedegree of mobility within the labor market, this phenomenon suggests ahigher incidence of return migrartioln in low wage activities.
Family size in Bombay is also significantly smaller for migrants in lowwage activities. This finding is consistent with the lhypothesis which linksthe lower supply price of temporary migrants (because of the smallerfamily size) to the lower wages established in these activities.
The alternative view of wage differences caused by institutional factors.is a second runner, because the mechanism outlined by us is seen to oper-ate within the non-factory sector, in which institutions do not play anyobvious role in wage determination. Factory wages in Bombay have beendetermined by institutions since 1950 but there is no evidence to suggest
27 Mazumdar (1973).

Working of the Urban Labor Market 197
that the latter have widened the differential with respect to the nonfac-tory sectors beyond what is caused by differences in the supply prices ofmigrants.
The Harris-Todaro paradigm of migration responding to the expectationof an elev.ited factory sector wage is not useful unless it can be demonstratedthat wages are, in fact, higlher than the relevant supply prices. It is furtherweakend by the small number of new jobs opening up for fresh migrants inmarkets like the Bombay one.
Unemployment before the first urban job was very uncommon amongBombay migrants. "Graduation" in the urban labor market is significant,but given the low rate of mobility, the process does not work quicklyenough to make much difference to the calculation of migrants.
REFER EN CES
Barnum. I.N. and Sabot, R H., "Education, Employment Probabilities and Rural-Urban Migration in Tanzania," Economic Development and Cultural Change,1977.
Blaug, Mark, and Layard, R.S. and Woodhall, M., The Causes of Gradtiate Unemploy-ment in India, 1969.
B!omqvist, A.G., '"Ur)an Job Creation and the Unemployment in LDCs," Journal ofDevelopment Economics, 1978.
Frank, C R. Jr., "Urban Unemployment in Africa," Oxford Economic Papers, 1968.Greenwood, H., "Research in Internal Migration in the United States," The Journal
of Economic Literatuire, 1975.Gregory, P. and Reynold, L.G., Wages, Productivity and Induvtrialization in Puerto
R;co, 1965. (Homewood, Illinois, 1965).Harris, J.R. and Todaro, M.P., 'Migration, Unemployment and Development: A
Two-Sector Analysis," Amnerican Econ.'mic Reviewv. 1970.Joshi, Heather and Joshi, Vijay, Surpltuv Lab"r and thte City: A Study of Bombay. Delhi
1976.Lewis, W..\., "Econornic Developmenlt with Unlimited SuLppJy of Labor," Manchester
School, 1954.Mazumdar, D.,!"Underemp!oyment in A-griculture and the Industrial Wage Rate,"
Economica, 1959.Mazumdar D., "Labour Supply in Early Industrialization : The Case of the Bombay
Textile Industry," Ecoizonoic History Review, 1973.Mazumdar, D. "The Theory of Urban Underemployment in Less Developed Count-
ries." World Ban,% .Staff Working Paper No. 198, 1975.Mazumdar D., "The Ruratl-Urban Wage Gap Migiration and the Shadow Wage." Ox-
*ford Economic Papers, 1976.Nurkse, R., Capital Formation in Less Developed Countries. London, 1979.Reder, M.W. "The Theory or Occupational Skill Differentials," A nerican Economic
Review, 1955.Rempel, H. "Labor Migration into Urban Centres and Urban Unemployment in
Kenya." Unpublished Ph. D. dissertation, Madison, Wisconsin, 1971.Selowsky, M. and Pinera, Sebastian, "-The Opportunity Cost of Labor and the Re-
turns to Education Under Unemployment and Labor Market Segmentation,"Quarterly Journal of Economics, 1978.

198 DIPAK MAZUMDAR
Todaro, M.P., "A model of Labor Migration and Urban Unemployment in LDCs,"Ameri can Economic Review, 1969.
Todaro, M.P. "Urban Job Expansion, Induced Migration and Rising Unemploy-ment," Journal of Development Economics, 1976.
University of Natal, "The African Factory Worker," Durban. Zachariah, K.C. 1968."Migrants in Greater Bombay. "Bombay, 1950.

No. 278. Oli IavrJlvshvn and Martin Wolf, "Recent Trends in Trade among DevelopingCountries," European E-con omweic Rez7iezw
No. 279. Nancy Birdsall, "Fertility and Economic Change in Eighteenth and Nineteenth CenturyEurope: A Comment," Popuatihon and Develo)pmtent Reviezw
No. 280. Walter Schaefer-Kehnert and John D. Von Pischke, "Agricultural Credit Policy inDeveloping Countries," translated from Hand buifch dier Landiwirtisczaft und Ern1tihrung inLIJi Entwick-lunsltindern (includes original German text)
No. 281. Bela Balassa, "Trade Policy in Mexico," lV1rhl Develo)pmnent
No. 28 la. Bela Balassa, "La politica de comercio exterior de Mexico," C'oinercio Exterior
No. 282. Clive Bell and Shantayanan Devarajan, "Shadow Prices for Project Evaluation underAlternativ,e Macroeconomic Specifications," The Quaiirteri-it Jou1irnatll otf Econtomics
No. 283. Anne 0. Krueger, "Frade Policies in Developing Countries," Handboffiok of blc'iall ,titalEconomiics;
No. 284. Anne 0. Krueger and Baran Tuncer, "An Empirical Test of the Infant IndustryArgument," Amierican Ec(itonomic Rev,iezv
No. 2 85. Bela Balassa, "Economic Policies in Portugal," Econolini
No. 286. F. Bourguignon, G. Michel, and D. Miqueu, "Short-run Rigidities and Long-runAdjustments in a Computable General Equilibrium Model of Income Distribution andDevelopment," Jlurnal Oif Develop7mnent Economicls
N o. 28:. Michael A. Cohen, "The Challenge of Replicabilitv: Toward a New Paradigm forUrban Shelter in Developing Countries," Regiotnal L)eD't u',tf Dialog?ue
No. 288. Hollis B. Chenerv, "Interaction between Theory and Observation in Development,"
No. 289. J. B. Knight and R. H-. Sabot. "Educational Expansion and the Kuznets Effect," "1th,b liit,ici Econtomnic Reviewv
No. 290. Mfalcolm D. Bale and Ulrich Koester, "Maginot Line of Europeani Farm Policies," ThleI tV rld Ecot)nomuni
No. 291. Danny NM. Leip.zger. "Lending versus Giving: The Economics of Foreign Assi"tanie,"I^x .'. IDevelopl7mnent
No. 292. Gregory K. Ingram, "Land in Perpectii e: Its Role in the Structure of Cities," WlrldCoiigress onii Laneld Roli.-1, 190)
No. 293. Rakesh MTohan and Rodrigo Villamizar. "rhe Evolution of Land Values in the Contextof Rapid Urban Groi,w,th: A Case Study of Bogoti and Cali, Colombia," l'i Co llres,;01, Lanzdf Rictu, 1' "LI
No. 294. Barend A. de Vries, "International Ramifications of the External Debt Situation," i1Iit,1` 1I X' Bank Revlc,ie Special fpe'pr.!
No. 295. Rakesh N1,'han. "The %Iorphology of lUrbanisation in India," Economnic and RlPiticai1' '
No. 29o. Dean T. Janison and Peter R. N It,ck, "Farmer Education and Farm Efficiency in Nepal:The Role of Schoolln,n, Extc'Lnii,n Services, and Cognitive Skills ,' D!W'; D ',lII;':t
No. 29-. Sweder van X%'iini'ergcn. "The 'Dutch Disease': A Disease after All?"' Thlie Ewonomic,
N(1. 2c73,. AIrnti Drud and Wafik NM. Grais, M\adreconoic ALijuLtniwnI in -hailand: Demand. LinagCrent1 and (SiipPl. Condfitions,." Joirnai ot I(;c A\ b1 L ..'
No. 299. Shujiro LUrata, "Factor Inputs and Japanese MNInUfAdUlurin- Trade Structure," /; 'I RevieI Lono;es ,>; . .SJ
Issues of the World Bank Reprint Series are available free of charge fromthe address on the bottom of the back cover.