GAO-21-58, SUBSTANCE USE DISORDER: Reliable Data Needed ...
75
SUBSTANCE USE DISORDER Reliable Data Needed for Substance Abuse Prevention and Treatment Block Grant Program Report to Congressional Committees December 2020 GAO-21-58 United States Government Accountability Office
Transcript of GAO-21-58, SUBSTANCE USE DISORDER: Reliable Data Needed ...

SUBSTANCE USE DISORDER
Reliable Data Needed for Substance Abuse Prevention and Treatment Block Grant Program
Report to Congressional Committees
December 2020
GAO-21-58
United States Government Accountability Office

United States Government Accountability Office
Highlights of GAO-21-58, a report to congressional committees
December 2020
SUBSTANCE USE DISORDER Reliable Data Needed for Substance Abuse Prevention and Treatment Block Grant Program
What GAO Found According to Substance Abuse and Mental Health Services Administration (SAMHSA) data, the number of substance use disorder (SUD) treatment facilities and services increased since 2009. However, potential gaps in treatment capacity remain. For example, SAMHSA data show that, as of May 2020, most counties did not have all levels of SUD treatment available, including outpatient, residential, and hospital inpatient services; nearly one-third of counties had no levels of treatment available. Stakeholders GAO interviewed said it is important to have access to each level for treating individuals with varying SUD severity.
Availability of Substance Use Disorder Treatment Levels, by County, as of May 2020
SAMHSA primarily relies on the number of individuals served to assess the effect of three of its largest grant programs on access to SUD treatment and recovery support services. However, GAO found the agency lacks two elements of reliable data—that they be consistent and relevant—for the number of individuals served under the Substance Abuse Prevention and Treatment Block Grant (SABG) program. For example, grantee reporting includes individuals served outside of the program, which limits this measure’s relevance for program assessment of access. SAMHSA plans to implement data quality improvements for the SABG program starting in fiscal year 2021. However, the agency has not identified specific changes needed to improve the information it collects on individuals served. As SAMHSA moves forward with its plans, it will be important for it to identify and implement such changes. Doing so will allow SAMHSA to better assess whether the SABG program is achieving a key goal of improving access to SUD treatment and recovery services or whether changes may be needed.
View GAO-21-58. For more information, contact Alyssa M. Hundrup at (202) 512-7114 or [email protected].
Why GAO Did This Study Treatment for SUD—the recurrent use of substances, such as illicit drugs, causing significant impairment—can help individuals reduce or stop substance use and improve their quality of life. SUDs, and in particular drug misuse, have been a persistent and long-standing public health issue in the United States.
Senate Report 115-289 contains a provision for GAO to review SUD treatment capacity. This report, among other things, describes what is known about SUD treatment facilities, services, and overall capacity; and examines the information SAMHSA uses to assess the effect of three grant programs on access to SUD treatment. GAO analyzed national SAMHSA data on SUD treatment facilities and providers, and reviewed studies that assessed treatment capacity. GAO also reviewed documentation for three of SAMHSA’s largest grant programs available to states, and compared the agency’s grant data quality to federal internal control standards. Finally, GAO interviewed SAMHSA officials and stakeholders, including provider groups.
What GAO Recommends GAO is recommending that SAMHSA identify and implement changes to the SABG program’s data collection efforts to improve two elements of reliability—the consistency and relevance—of data collected on individuals served. SAMHSA concurred with this recommendation.

Page i GAO-21-58 Substance Use Disorder
Letter 1
Background 9 The Number of SUD Treatment Facilities and MAT Services Has
Increased Since 2009, but Potential Gaps in Capacity and Barriers to Expanding Capacity Remain 20
Selected States Used SAMHSA Grant Funds for SUD Treatment Services and Other Efforts to Expand Access, but States Reported Challenges in Spending Some Funds 35
SAMHSA Uses Various Information to Assess the Grant Programs’ Effect on SUD Treatment and Recovery Service Access, but Data on Individuals Served Are Unreliable 45
Conclusions 51 Recommendation for Executive Action 51 Agency Comments 52
Appendix I Levels of Care for Substance Use Disorder Treatment 53
Appendix II Clinical and Therapeutic Services for Substance Use Disorder Treatment 55
Appendix III Substance Abuse Prevention and Treatment Block Grant Program Treatment and Recovery Support Expenditures 57
Appendix IV State Opioid Response Grant Program Awards, Spending, and Amounts Remaining Unspent 60
Appendix V Summary of Selected Findings from Evaluations of the SABG and STR Grant Programs 62
Appendix VI Comments from the Department of Health and Human Services 64
Contents

Page ii GAO-21-58 Substance Use Disorder
Appendix VII GAO Contacts and Staff Acknowledgments 66
Related GAO Products 67
Tables
Table 1: SAMHSA’s 2019-2023 Strategic Plan Priority Areas, Objectives, and Activities Related to Expanding Access to Substance Use Disorder Treatment 16
Table 2: Description of Three Selected Substance Abuse and Mental Health Services Administration (SAMHSA) Grant Programs 18
Table 3: Percentage of Facilities by Type of Clinical and Therapeutic Services Offered for Substance Use Disorder Treatment at Least Sometimes, in 2009 and 2018 22
Table 4: Selected States’ SABG and STR Grant Program Expenditures and Percentage Spent on Treatment and Recovery Support Services, 2018 36
Table 5: Percentage of Selected States’ Substance Use Disorder Treatment and Recovery Support Budget Provided by Three SAMHSA Grant Programs, State Fiscal Year 2019 36
Table 6: Selected States’ State Targeted Response to the Opioid Crisis (STR) Grant Awards and Expenditures, as of April and October 2019 40
Table 7: Selected States’ State Opioid Response (SOR) Grant Program Award and Amount Spent and Percentage Remaining Unspent, as of August 2020 41
Table 8: Examples of Strategies Reported by Selected States to Address Challenges in Spending State Targeted Response to the Opioid Crisis Grant and State Opioid Response Grant Program Funds 44
Table 9: N-SSATS Categories of Substance Use Disorder (SUD) Treatment and Corresponding Levels of Care for Adults from the American Society of Addiction Medicine’s Continuum of Care for SUD Treatment 53
Table 10: Examples of Clinical and Therapeutic Services for Substance Use Disorder Treatment 55
Table 11: Nationwide Substance Abuse Prevention and Treatment Block Grant Program Expenditures on Treatment and Recovery Support Services, Fiscal Years 2010-2019 57

Page iii GAO-21-58 Substance Use Disorder
Table 12: Total Substance Abuse Prevention and Treatment Block Grant Expenditures and Proportion Spent by State on Treatment and Recovery Support Services, Fiscal Year 2019 58
Table 13: Total State Opioid Response Grant Program Award, Amount Spent, and Percentage Remaining Unspent by State, as of August 2020 60
Table 14: External Evaluation Reports and Selected Findings Related to Assessing Access to Treatment and Recovery Support Services for the SABG and STR Grant Programs 62
Figures
Figure 1: Types of Drugs Involved in Drug Overdose Deaths, 2002 through 2018 10
Figure 2: American Society of Addiction Medicine’s Continuum of Care for Substance Use Disorder Treatment by Level of Treatment Intensity 13
Figure 3: Substance Abuse Treatment Facilities by Level of Care, in 2009 and 2018 21
Figure 4: Facilities Offering Medication-Assisted Treatment (MAT) by Medication Type, 2009-2018 23
Figure 5: Number of Providers with a DATA 2000 Waiver by Provider Type, 2009-2019 25
Figure 6: Number of Providers with a DATA 2000 Waiver by Patient Limit, 2009-2019 26
Figure 7: Availability of Continuum of Care for Substance Use Disorder Treatment, by County, as of May 1, 2020 30
Figure 8: Counties by Availability of Each Level of Care for Substance Use Disorder Treatment, as of May 1, 2020 32

Page iv GAO-21-58 Substance Use Disorder
Abbreviations COVID-19 Coronavirus Disease 2019 DATA 2000 Drug Addiction Treatment Act of 2000 ECHO Extension for Community Healthcare Outcomes GPRA Government Performance and Results Act of 1993 HHS Department of Health and Human Services MAT medication-assisted treatment N-SSATS National Survey of Substance Abuse Treatment
Services SABG Substance Abuse Prevention and Treatment Block
Grant program SAMHSA Substance Abuse and Mental Health Services
Administration SOR State Opioid Response grant program STR State Targeted Response to the Opioid Crisis grant
program SUD substance use disorder SUPPORT Act Substance Use-Disorder Prevention that Promotes
Opioid Recovery and Treatment for Patients and Communities Act
TEDS Treatment Episode Data Set
This is a work of the U.S. government and is not subject to copyright protection in the United States. The published product may be reproduced and distributed in its entirety without further permission from GAO. However, because this work may contain copyrighted images or other material, permission from the copyright holder may be necessary if you wish to reproduce this material separately.

Page 1 GAO-21-58 Substance Use Disorder
441 G St. N.W. Washington, DC 20548
December 14, 2020
The Honorable Roy Blunt Chairman The Honorable Patty Murray Ranking Member Subcommittee on Labor, Health and Human Services, Education, and Related Agencies Committee on Appropriations United States Senate
The Honorable Rosa DeLauro Chairwoman The Honorable Tom Cole Ranking Member Subcommittee on Labor, Health and Human Services, Education, and Related Agencies Committee on Appropriations House of Representatives
Drug misuse—the use of illicit drugs and the misuse of prescription drugs—has been a persistent and long-standing public health issue in the United States. It has resulted in significant loss of life and a negative effect on society and the economy, including billions of dollars in costs related to health care, criminal justice, reduced workplace productivity, education, and human services. These costs are borne by individuals who misuse drugs, as well as their families and employers, private businesses and nonprofit organizations, and federal, state, and local governments.1
Drug misuse and related deaths in the United States have continued to increase. According to 2019 survey data from the Substance Abuse and Mental Health Services Administration (SAMHSA), 21 percent of the U.S. population (57.2 million people) misused or abused drugs, an increase
1See GAO, Drug Misuse: Sustained National Efforts Are Necessary for Prevention, Response, and Recovery, GAO-20-474 (Washington, D.C.: March 26, 2020).
Letter

Page 2 GAO-21-58 Substance Use Disorder
from an estimated 18 percent in 2015.2 In addition, according to the Centers for Disease Control and Prevention, the rate of drug overdose deaths increased from 6.1 deaths per 100,000 people in 1999 to 20.7 in 2018.3 Moreover, in light of the Coronavirus Disease 2019 (COVID-19) pandemic affecting the nation, there are heightened concerns that stresses stemming from COVID-19—including social distancing, isolation, challenges accessing treatment or support services—could exacerbate the drug crisis and result in further increases in drug overdose deaths.4
In October 2017, the Acting Secretary of the Department of Health and Human Services (HHS) first declared the opioid crisis a public health emergency and the declaration has been in effect since that time.5 In addition, in March 2020, we determined that national efforts to prevent, respond to, and recover from drug misuse is an area that will be included
2Substance Abuse and Mental Health Services Administration, Center for Behavioral Health Statistics and Quality, Key Substance Use and Mental Health Indicators in the United States: Results from the 2019 National Survey on Drug Use and Health (Rockville, Md.: September 2020).
3H. Hedegaard, A.M. Miniño, and M. Warner, “Drug Overdose Deaths in the United States, 1999-2018,” NCHS Data Brief no. 356 (Hyattsville, Md.: National Center for Health Statistics, 2020).
4For example, a survey conducted in April and May 2020 of 1,079 substance use disorder patients and family members impacted by substance use disorders found 20 percent of respondents reported increased substance use since the COVID-19 pandemic began, 34 percent reported changes in treatment or recovery support services, and 14 percent reported being unable to access needed services due to the pandemic. See Addiction Policy Forum, COVID-19 Pandemic Impacts on Patients, Families and Individuals in Recovery from Substance Use Disorders (North Bethesda, Md.: June 2020).
5A public health emergency triggers the availability of certain authorities under federal law that enable federal agencies to take actions, such as accessing the Public Health Emergency Fund, temporarily reassigning certain state and local personnel, and waiving certain administrative requirements. These authorities may allow the federal government to increase support to and reduce administrative burdens on state and local governments and federal grantees affected by or responding to the public health emergency. A public health emergency declaration is in effect until the Secretary declares the emergency no longer exists, or 90 days after the declaration, whichever occurs first. A declaration that expires may be renewed by the Secretary. See 42 U.S.C. § 247d(a). Since first being declared a public health emergency in October 2017, the emergency declaration for the opioid crisis has been renewed 11 times, most recently in July 2020. For more information on public health emergency authorities and the opioid crisis, see GAO, Opioid Crisis: Status of Public Health Emergency Authorities, GAO-18-685R (Washington, D.C.: Sept. 26, 2018).

Page 3 GAO-21-58 Substance Use Disorder
on our 2021 High Risk List—a list of programs and operations that are “high risk” because, among other things, they need transformation.6
When substance use—including drug misuse—progresses to a point that it is clinically diagnosed as causing significant impairments in health and social functioning, it is characterized as a substance use disorder (SUD).7 Access to SUD treatment—behavioral health therapies and, in some cases, certain medications—is important, because of the harmful consequences of untreated conditions, which may result in worsening health, increased medical costs, negative effects on employment and workplace performance, strained personal and social relationships, and possible incarceration. Treatment for SUDs can help individuals reduce or stop substance use, manage their symptoms, and improve their health and ability to function.
However, research suggests that a substantial number of individuals with SUDs may not receive treatment or receive less than the recommended treatment, even among those with serious conditions. For example, in 2019, SAMHSA estimated that 18.9 million people aged 12 or older needed SUD treatment, but did not receive such treatment at a specialty facility in the past year.8
To help address SUDs and curb increases in overdose deaths, SAMHSA, within HHS, administers a number of grant programs. Three of the largest of these grant programs are the Substance Abuse Prevention and Treatment Block Grant (SABG), the State Targeted Response to the Opioid Crisis (STR) grant, and the State Opioid Response (SOR) grant. These grant programs aim to, among other things, expand access to SUD treatment and recovery support services. SAMHSA data show that in fiscal year 2018, these three grant programs combined provided
6See GAO-20-474. For more information about the High Risk List, see https://www.gao.gov/highrisk/overview.
7The diagnosis of an SUD is made by a trained professional based on 11 symptoms defined in the Fifth Edition of the Diagnostic and Statistical Manual of Mental Disorders. The number of diagnostic symptoms present defines the severity of the disorder, ranging from mild to severe. See American Psychiatric Association, Diagnostic and Statistical Manual of Mental Disorders, 5th ed. (Arlington, Va.: 2013).
8Substance Abuse and Mental Health Services Administration, Center for Behavioral Health Statistics and Quality, Key Substance Use and Mental Health Indicators in the United States: Results from the 2019 National Survey on Drug Use and Health, HHS Pub. No. PEP20-07-01-001, NSDUH Series H-55 (Rockville, Md.: 2020).

Page 4 GAO-21-58 Substance Use Disorder
approximately $3.4 billion in grants to states, the District of Columbia, and U.S. territories and other U.S. jurisdictions for SUD prevention, treatment, and recovery support services.
Senate Report 115-289, accompanying the Departments of Labor, Health and Human Services, and Education Appropriations Act, 2019, includes a provision for GAO to review SUD treatment capacity, availability, and needs.9 This report
1. describes what is known about the number of SUD treatment facilities and services, overall treatment capacity, and barriers to expanding capacity;
2. describes how selected states have used funding from the three SAMHSA grant programs (SABG, STR, and SOR) to expand access to SUD treatment and recovery support services; and
3. examines the information SAMHSA uses to assess the effect of the three grant programs on expanding access to SUD treatment and recovery support services.
To describe what is known about the number of SUD treatment facilities and services, overall treatment capacity, and barriers to expanding capacity, we obtained and analyzed SAMHSA data, reviewed relevant literature, and interviewed knowledgeable stakeholders. Regarding SAMHSA data, we obtained the following:
• Data from SAMHSA’s National Survey of Substance Abuse Treatment Services (N-SSATS) from 2009 through 2018, the most recent years of data available at the time of our review.10 We analyzed N-SSATS data on the characteristics of SUD treatment facilities to describe trends in SUD treatment facilities, including the level of intensity and type of SUD treatment services offered.
• Data collected by SAMHSA on providers that have received a Drug Addiction Treatment Act of 2000 (DATA 2000) waiver from 2009 through 2019, the most recent full year for which data were available.
9S. Rep. No. 115-289, at 169 (2018) (accompanying H.R. 3158, 115th Cong. (2018)), which is related to the Department of Defense and Labor, Health and Human Services, and Education Appropriations Act, 2019 and Continuing Appropriations Act, 2019, Pub. L. No. 115-245 (Sept. 28, 2018).
10Data from SAMHSA’s N-SSATS for 2019 were released in August 2020, after the time of our review.

Page 5 GAO-21-58 Substance Use Disorder
From this data source, we analyzed data on the number and characteristics of providers with a DATA 2000 waiver, such as the waiver limit and type of health care professional, to describe trends in providers with a DATA 2000 waiver.11
• Data as of May 1, 2020, from SAMHSA’s Behavioral Health Treatment Services Locator. We analyzed data on the location of SUD treatment facilities and the level of treatment intensity offered at these facilities to determine the extent to which SUD treatment facilities that collectively offered various treatment intensity levels were located in counties across the United States.12
To assess the reliability of each of the three data sources, we reviewed documentation and interviewed SAMHSA officials about how they collected and verified the data, and we checked the data for obvious errors. We determined that the N-SSATS data, data on providers with a DATA 2000 waiver, and Behavioral Health Treatment Services Locator data were reliable for our purposes of describing what these data sources indicate about trends and gaps in the level of SUD treatment and type of services available.
We reviewed studies that examined SUD treatment capacity, including the availability and characteristics of SUD treatment providers in the United States. To identify these studies, we searched bibliographic databases, including Medline and Scopus, and conducted literature searches for studies published from January 2014 through February 2020. Among the studies we identified, we determined 11 were relevant, because they measured the extent to which SUD treatment was available across the United States and based their findings on data no older than 2015. Finally, we interviewed a non-generalizable sample of stakeholders from 11 organizations who are knowledgeable about SUD treatment
11Qualifying practitioners—including physicians, nurse practitioners, and physician assistants—may apply to SAMHSA to obtain a DATA 2000 waiver to dispense or prescribe buprenorphine, a medication approved by the Food and Drug Administration to treat opioid use disorder, to a limited number of patients for opioid use disorder treatment in an office-based setting, such as a doctor’s office.
12According to SAMHSA, approximately 95 percent of treatment facilities surveyed in N-SSATS elect to be included in the Behavioral Health Treatment Services Locator.

Page 6 GAO-21-58 Substance Use Disorder
capacity issues.13 We selected these stakeholders based on relevance of their published or other work to our reporting objective and by asking individuals we interviewed to identify additional stakeholders using a snowball sampling method. During our interviews, we asked stakeholders about any trends or gaps in SUD treatment capacity, and any challenges or barriers to expanding capacity and in measuring capacity with available data.
To describe how selected states have used funding from three SAMHSA grant programs to expand access to treatment and recovery support services for SUDs, we reviewed available data and documentation on the SABG, STR grant, and SOR grant programs. We selected these grant programs because (1) all 50 states and the District of Columbia were eligible to receive and were awarded grant funds; (2) the funds could be used to expand access to treatment; (3) they were among the largest of SAMHSA’s grant programs in terms of dollars awarded; and (4) the grant programs were financed through discretionary funds.14 We reviewed and analyzed data that the states and the District of Columbia submitted to SAMHSA about their expenditures, individuals served, type of services provided, and other measures related to each of the three programs:
• for the SABG program, the information and data were for fiscal years 2010 through 2019;
• for the STR grant program, the information and data were for years 2017 and 2018; and
13We interviewed knowledgeable stakeholders from the following 11 organizations: American Society of Addiction Medicine; Johns Hopkins Bloomberg School of Public Health, Center for Mental Health and Addiction Policy Research; Mathematica; National Association for Alcoholism and Drug Abuse Centers, the Association for Addiction Professionals; National Association of Addiction Treatment Providers; National Association of State Alcohol and Drug Abuse Directors; The Pew Charitable Trusts’ Substance Use Prevention and Treatment Initiative; RTI International; Shatterproof; University of Kentucky Center for Drug and Alcohol Research; and University of Washington School of Public Health.
14For each of the three grant programs—SABG, STR, and SOR—all 50 states, the District of Columbia, and U.S. territories and other U.S. jurisdictions were eligible for funding. For the purposes of this report, we limited our review to the 50 states and the District of Columbia.

Page 7 GAO-21-58 Substance Use Disorder
• for the SOR grant program, the information and data were for fiscal year 2019.15
These were the most recent data available for each of the programs at the time of our review. We also analyzed SAMHSA’s data on the amount of funds withdrawn from federal accounts, as of August 2020, by each state and the District of Columbia for the SOR grant program.16 To assess the reliability of these data, we reviewed documentation and interviewed SAMHSA officials about how they collected and verified data. We also checked the data for obvious errors and verified the expenditure data with selected states. We determined that the expenditure data and data on the amount of funds withdrawn from federal accounts we received from SAMHSA were reliable for purposes of describing total spending, amounts of unspent funds, and the extent to which states used funding for SUD treatment and recovery support services.
In addition, we interviewed officials from state agencies in seven selected states that received funding from the three grant programs (Alabama, Kentucky, Michigan, New Hampshire, New Mexico, Ohio, and Utah). We selected this non-generalizable sample of states to reflect variation in (1) the prevalence of SUDs related to illicit drug use and rates of drug overdose deaths, (2) geographic diversity, and (3) whether the state had expanded Medicaid eligibility to certain low-income adults under the Patient Protection and Affordable Care Act. During the interviews with state officials, we asked about, among other things, activities the states implemented using the grant funding to expand access to treatment and recovery support services, and any challenges states experienced in using the funding. We also asked states to provide information about their state’s budget for SUD treatment and recovery support services for state fiscal year 2019. For the most recent year available for each grant program, we reviewed the annual progress reports that the states submitted to SAMHSA that described the activities the states
15The first STR grant program year began in May 2017, and ended in April 2018; the second year began in May 2018, and ended in April 2019. The first year of the SOR grant program began on September 30, 2018, and ended on September 29, 2019.
16According to agency officials, SAMHSA provided this data on the amount of funds withdrawn from federal accounts for the SOR programs, because the data provide real-time information about the amount of SOR grant program funds that states have spent.

Page 8 GAO-21-58 Substance Use Disorder
implemented using the grant funds.17 We also interviewed SAMHSA officials about the three grant programs, including activities states implemented with the grant funds to expand access to treatment and recovery support services, any challenges states experienced using the grant funding, and efforts SAMHSA has implemented or plans to implement to address any challenges.
To examine the information SAMHSA uses to assess the effect of its three grant programs on expanding access to treatment and recovery support services for SUDs, we reviewed agency documentation that describes grantee reporting requirements, and policies and procedures related to monitoring and evaluating the grant programs’ performance. We also interviewed SAMHSA officials about grantee reporting requirements, grant program performance monitoring, and the agency’s efforts to assess the programs’ effects on access to treatment.
We compared the quality of SAMHSA’s grant program data to federal standards for internal control. We determined that the information and communication component of the federal standards for internal control was significant to this objective. The underlying principles of this control state that management should use quality information to achieve the entity’s objectives and address risks.18
We conducted this performance audit from July 2019 to December 2020 in accordance with generally accepted government auditing standards. Those standards require that we plan and perform the audit to obtain sufficient, appropriate evidence to provide a reasonable basis for our findings and conclusions based on our audit objectives. We believe that the evidence obtained provides a reasonable basis for our findings and conclusions based on our audit objectives.
17For the SABG program, we reviewed the state fiscal year 2019 annual progress reports for the seven selected states. For the STR grant program, we reviewed the states’ fiscal year 2018 annual progress reports, which was the last year for which states submitted progress reports, because the grant program expired in fiscal year 2019. For the SOR grant program, we reviewed the states’ fiscal year 2019 mid-year progress reports.
18See GAO, Standards for Internal Control in the Federal Government, GAO-14-740G (Washington, D.C.: Sept. 10, 2014). Internal control is a process effected by an entity’s oversight body, management, and other personnel that provides reasonable assurance that the objectives of an entity will be achieved.

Page 9 GAO-21-58 Substance Use Disorder
According to data from the Centers for Disease Control and Prevention, over 716,000 people died as the result of a drug overdose from 2002 through 2018.19 The overall rate of drug overdose deaths has generally increased since 2002, though certain drugs have been more involved in the increase in death rates, most notably synthetic opioids, cocaine, and psychostimulants.20 (See fig. 1.) In addition, in 2017, the most recent year for which data were available at the time of our review, an estimated 967,615 nonfatal drug overdoses were treated in emergency departments, an increase of 4 percent from 2016.21
19See GAO-20-474.
20According to the Centers for Disease Control and Prevention, drug overdose deaths in the United States decreased from 70,237 in 2017 to 67,367 in 2018. However, preliminary data from the agency suggest that overdose deaths may have reached 72,041—a record high—in 2019 with some data pending as of this report. See Centers for Disease Control and Prevention, “Provisional Drug Overdose Death Counts,” accessed October 13, 2020, https://www.cdc.gov/nchs/nvss/vsrr/drug-overdose-data.htm. Drug overdose deaths may involve more than one drug, and the drugs most frequently involved in overdose deaths were often found in combination with each other.
21These data are from analysis conducted by the Centers for Disease Control and Prevention using the Agency for Healthcare Research and Quality, Healthcare Cost and Utilization Project’s Nationwide Emergency Department Sample—a nationally representative, stratified sample of emergency department visits from nonfederal, hospital-based emergency departments in 36 states and the District of Columbia. See A. M. Vivolo-Kantor et al., “Nonfatal Drug Overdoses Treated in Emergency Departments—United States, 2016-2017,” Morbidity and Mortality Weekly Report, vol. 69, no. 13 (April 3, 2020).
Background
Need for SUD Treatment

Page 10 GAO-21-58 Substance Use Disorder
Figure 1: Types of Drugs Involved in Drug Overdose Deaths, 2002 through 2018
Notes: Measurement of specific drug overdose death rates can be affected by a number of factors, including that the substances tested for and the circumstances under which the toxicology tests are performed vary by jurisdiction. Also, drug overdose deaths may involve multiple drugs; deaths involving more than one drug group were counted in all relevant categories. Rates are not mutually exclusive and should not be summed. The Centers for Disease Control and Prevention adjusts national drug overdose death rates for age to control for the changing age distribution of the population, and thereby allows comparisons of rates over time and between groups. GAO’s examination of these trends controls for the age distribution of the population, but does not consider whether changes in the distribution of sex, race, and other population characteristics may influence drug overdose death rates.
The recent trends in drug overdoses, as well as data collected by SAMHSA on SUD prevalence, indicate a significant need for SUD treatment and other services. Each year, SAMHSA conducts its National Survey on Drug Use and Health, which collects information from a nationally representative sample of the civilian, non-institutionalized population aged 12 years or older. Respondents are asked about, among other things, their use of alcohol, tobacco, illicit drugs, and misuse of prescription drugs, as well as any treatment they received in the prior year and reasons for not receiving treatment for perceived unmet needs.

Page 11 GAO-21-58 Substance Use Disorder
According to 2019 survey data, approximately 20.4 million people aged 12 or older had a SUD, including an estimated 8.3 million people aged 12 or older with a SUD caused by dependence on or abuse of illicit drugs.22 Of the 20.4 million individuals, an estimated 18.9 million needed, but did not receive, specialty treatment in the 12 months prior to the 2019 survey. Common reasons cited for not receiving treatment included
• not being ready to stop using (40 percent); • not knowing where to get treatment (24 percent); • having no health care coverage and not being able to afford the cost
of treatment (21 percent); and • stigma around receiving treatment, such as fear that getting treatment
would cause their neighbors or community to have a negative opinion of them (17 percent) or have a negative effect on their job (17 percent).
The need for SUD treatment is commonly defined in terms of prevalence of SUDs, but measuring treatment need with available data sources has limitations. In particular, the National Survey on Drug Use and Health defines treatment need broadly, according to whether individuals surveyed meet certain diagnostic criteria or if they received treatment for that condition at a specialty facility. However, many individuals—as many as half—may recover without receiving treatment.23 Therefore, relying on the number of surveyed individuals who meet certain diagnostic criteria may overestimate potential need for treatment service provision.
At the same time, data from the National Survey on Drug Use and Health may underestimate need. The survey does not collect information from those persons who are in residential SUD treatment settings, or from the incarcerated, homeless individuals not living in a shelter, and active military individuals—populations that research has shown are more likely
22The 8.3 million people with an illicit drug use disorder corresponds to 3 percent of the U.S. population, which has generally remained the same since 2015. Illicit drugs include marijuana, cocaine, heroin, hallucinogens, inhalants, and methamphetamine. Illicit drugs also include prescription psychotherapeutic drugs, such as stimulants, tranquilizers or sedatives, and pain relievers.
23Assistant Secretary for Planning and Evaluation, U.S. Department of Health and Human Services, Needs Assessment Methodologies in Determining Treatment Capacity for Substance Use Disorders: Final Report (Washington, D.C.: September 2019).

Page 12 GAO-21-58 Substance Use Disorder
to have a SUD.24 In addition, the survey does not collect information on the severity of individuals’ SUDs, which would be needed to determine the level or amount of services individuals may require.
SUD treatment aims to help people reduce or stop harmful substance use, improve health and social functioning, and manage the risk of relapse. Based on an individual’s needs, treatment may occur in a variety of settings—including outpatient, residential, and hospital inpatient—and the intensity of treatment can vary both within and across setting types.25 The American Society of Addiction Medicine developed a set of guidelines for assessing and making treatment decisions for individuals with SUDs.26 The guidelines also include standardized, commonly accepted nomenclature for describing a continuum of SUD treatment across broad levels of care. Within the broad levels, there are additional gradations, resulting in nine discrete levels of care that each have specific treatment and provider requirements.27 (See fig. 2.) Each of these nine levels of care reflects differing degrees of intensity that correspond to a specific service. The American Society of Addiction Medicine levels of SUD treatment are increasingly recognized as a standard for defining a comprehensive continuum of care against which existing SUD treatment systems can be measured.28
24Institute of Medicine, Substance Use Disorders in the U.S. Armed Forces (Washington, D.C.: 2013); Substance Abuse and Mental Health Services Administration, Behavioral Health Services for People Who are Homeless: A Review of the Literature, Treatment Improvement Protocol, No. 55 (Rockville, Md.: 2015); and U.S. Department of Justice, Drug Use, Dependence, and Abuse Among State Prisoners and Jail Inmates, 2007-2009 (Washington, D.C.: June 2017).
25Outpatient services typically include care without an overnight stay in settings, such as offices and clinics of physicians and other medical professionals; residential services typically include 24-hour care provided in non-hospital settings; and hospital inpatient services typically include 24-hour care provided in hospital settings.
26The American Society of Addiction Medicine is a professional medical society representing over 6,000 professionals in the field of addiction medicine across the United States.
27For more information, see American Society of Addiction Medicine, What Are the ASAM Levels of Care? (May 13, 2015), accessed July 28, 2020, https://www.asam.org/asam-criteria/about.
28See, for example, Assistant Secretary for Planning and Evaluation, Needs Assessment Methodologies, p. 29; and Medicaid and CHIP Payment and Access Commission, Report to Congress on Medicaid and CHIP (Washington, D.C.: June 2018).
Continuum of Care for SUD Treatment

Page 13 GAO-21-58 Substance Use Disorder
Figure 2: American Society of Addiction Medicine’s Continuum of Care for Substance Use Disorder Treatment by Level of Treatment Intensity
Through N-SSATS, SAMHSA tracks whether facilities offer one or more of six levels of SUD treatment, which generally correspond to the American Society of Addiction Medicine’s continuum of care. Specifically, each level of SUD treatment described in the N-SSATS questionnaire is accompanied by a notation indicating the corresponding level of care from the American Society of Addiction Medicine’s continuum of care for SUD treatment. However, N-SSATS differs from the American Society of Addiction Medicine’s continuum in that it does not ask about the early intervention level (level 0.5) and it consolidates some of the levels from the American Society of Addiction Medicine’s continuum. For a description of the levels of care captured in N-SSATS and the

Page 14 GAO-21-58 Substance Use Disorder
corresponding American Society of Addiction Medicine’s level of care and definitions, see appendix I.
SUD treatment generally involves diagnostic services to determine the nature and extent of the condition, clinical and therapeutic treatment services, and may include medications. Clinical and therapeutic treatment services, which can be used to treat any type of SUD, use various techniques to modify an individual’s behaviors and improve coping skills, such as incentives and reinforcements to reward individuals who reduce their substance use. See appendix II for more information about clinical and therapeutic treatment services for SUDs.
For those with an opioid use disorder, medication-assisted treatment (MAT)—which combines behavioral therapy and the use of certain medications—has been shown to reduce opioid use and to increase treatment retention (i.e., reducing dropouts) compared with other treatments. Three medications are currently approved by the Food and Drug Administration for use in MAT for opioid addiction: methadone, buprenorphine, and naltrexone.29
Two of the three MAT medications—methadone and buprenorphine—carry a potential for misuse and are governed at the federal level by the Controlled Substances Act.30 When used for MAT, treatment involving these two medications must take place in certain authorized settings: as part of a federally regulated opioid treatment program or in other office-based settings, such as a physician’s office, within certain restrictions.31 Methadone may generally only be administered or dispensed within an opioid treatment program, as prescriptions for methadone cannot be 29The Food and Drug Administration has approved the following formulations of buprenorphine for use in MAT to treat opioid addiction: buprenorphine with and without naloxone, buprenorphine sub-dermal implant, and extended release injectable buprenorphine. For naltrexone, the Food and Drug Administration has approved extended release injectable naltrexone for use in MAT to treat opioid addiction.
30Enacted in 1970, the Controlled Substances Act and its implementing regulations establish a framework through which the federal government regulates the use of these substances for legitimate medical, scientific, research, and industrial purposes, while preventing them from being diverted for illegal purposes.
31The term “opioid treatment program” refers both to a program or a practitioner engaged in opioid treatment of individuals. See 42 C.F.R. § 8.2. Opioid treatment programs are also called narcotic treatment programs or, often, methadone clinics. They may offer opioid medications, counseling, and other services for individuals addicted to heroin or other opioids.
Types of SUD Treatment Services

Page 15 GAO-21-58 Substance Use Disorder
issued when used for opioid use disorder treatment. Buprenorphine may be administered or dispensed within an opioid treatment program, or prescribed by a provider with a DATA 2000 waiver.32
Qualifying practitioners must apply to SAMHSA to obtain a DATA 2000 waiver to dispense or prescribe buprenorphine to a limited number of patients for opioid use disorder treatment in an office-based setting, such as a doctor’s office. Until 2016, only physicians were eligible to receive a DATA 2000 waiver. However, the Comprehensive Addiction and Recovery Act of 2016 amended the Controlled Substances Act to allow nurse practitioners and physician assistants to also receive a DATA 2000 waiver.33
In general, providers are limited to treating 30 patients in the first year under a DATA 2000 waiver and may apply to increase to 100 patients after a year. However, providers that meet certain eligibility criteria can treat 100 patients in their first year and may apply to increase to up to 275 patients after a year.34 To qualify for a DATA 2000 waiver, providers must have a valid Drug Enforcement Administration registration, be appropriately licensed under state law, and meet applicable certification, training, or experience requirements.
32Specifically, DATA 2000 amended the Controlled Substances Act to authorize SAMHSA to grant qualifying practitioners a waiver of the separate registration requirement applicable to opioid treatment programs, for the purpose of treating opioid addiction with Food and Drug Administration-approved Schedule III, IV, or V opioid medications. Currently, the only Schedule III, IV, or V medication approved by the Food and Drug Administration to treat opioid addiction is buprenorphine.
33The Comprehensive Addiction and Recovery Act of 2016 allowed nurse practitioners and physician assistants to obtain a waiver through October 1, 2021. Pub. L. No. 114-198, § 303(a)(1), 130 Stat. 695, 720 (July 22, 2016). In 2018, the Substance Use-Disorder Prevention that Promotes Opioid Recovery and Treatment for Patients and Communities Act (SUPPORT Act) eliminated the time limit, thereby permanently allowing nurse practitioners and physician assistants to obtain a DATA 2000 waiver. Pub. L. No. 115-271, § 3201(b), 132 Stat. 3894, 3943 (Oct. 24, 2018). The SUPPORT Act also authorizes certified registered nurse anesthetists, certified nurse midwives, and clinical nurse specialists to obtain DATA 2000 waivers until October 1, 2023.
34Providers are eligible to treat 100 patients in their first year with a DATA 2000 waiver if they (1) hold a board certification in addiction medicine or addiction psychiatry; or (2) provide MAT in a “qualified practice setting,” which must provide coverage for patient medical emergencies outside of office hours, and patient access to case-management services, among other requirements.

Page 16 GAO-21-58 Substance Use Disorder
In addition to SUD treatments, recovery support services exist that are designed to help engage and support individuals in treatment and provide ongoing support after treatment to maximize their potential to live independently in the community. There are a variety of recovery support services such as peer providers—individuals who use their own personal experience recovering from a SUD along with practical guidance to support others in their recovery—to help individuals who are transitioning out of treatment to connect with community services and address barriers that may hinder the recovery process. Other examples include recovery housing, which can provide a substance-free environment and support from fellow recovering residents, and recovery high schools, which help students recovering from SUDs focus on their education.
SAMHSA—the agency within HHS that leads federal efforts to advance the behavioral health of the nation—developed a 5-year strategic plan (fiscal years 2019 through 2023) for carrying out its mission to reduce the impact of substance abuse and mental illness across American communities.35 The plan states that one of SAMHSA’s core principles is to improve access to the full continuum of treatment services for SUDs. The plan also outlines priority areas and measurable objectives, two of which relate to expanding access to SUD treatment. (See table 1.) According to agency officials, SAMHSA has set out to accomplish these objectives through various activities, including the use of SAMHSA grant program funding.
Table 1: SAMHSA’s 2019-2023 Strategic Plan Priority Areas, Objectives, and Activities Related to Expanding Access to Substance Use Disorder Treatment
Priority and objective(s) Examples of activities to accomplish the objective Priority 1: Combating the opioid crisis through the expansion of prevention, treatment, and recovery support services
Objective 1.3: Improve access to, utilization of, and engagement and retention in prevention, treatment, and recovery support services
Support, through SAMHSA funding, training, and technical assistance, the adoption of evidence-based policies, programs, and practices to prevent opioid misuse, and to diagnose and treat opioid use disorders and co-occurring substance use and mental health disorders.
Leverage SAMHSA funding to expand access to medication-assisted treatment (MAT) and recovery support services for individuals with opioid use disorder, including through efforts to increase the number of MAT providers and programs, the advancement of telehealth approaches and use of mobile technologies, and through the implementation of comprehensive service delivery models.
35Substance Abuse and Mental Health Services Administration, SAMHSA Strategic Plan FY2019-FY2023, accessed August 28, 2020, https://www.samhsa.gov/about-us/strategic-plan-fy2019-fy2023.
Recovery Support Services
SAMHSA’s Support of SUD Treatment
Page 17 GAO-21-58 Substance Use Disorder
Priority and objective(s) Examples of activities to accomplish the objective Priority 3: Advancing prevention, treatment, and recovery support services for substance use
Objective 3.4: Support the identification and adoption of evidence-based practices, programs, and policies that prevent substance use, increase provision of substance use disorder treatment, and enable individuals to achieve long-term recovery
Utilize SAMHSA funding, training, and technical assistance to expand integration of substance use and misuse prevention, treatment, and community-based recovery support services into primary and specialty care settings to improve access, utilization, and quality of care for individuals with or at risk of substance use disorders and co-occurring substance use and mental disorders.
Leverage SAMHSA funding, training, and technical assistance to expand and explore new and emerging evidence-based recovery approaches.
Source: Substance Abuse and Mental Health Services Administration (SAMHSA). | GAO-21-58.
Note: This table describes a subset of the priorities, objectives, and activities SAMHSA laid out in its 5-year strategic plan for carrying out its mission to reduce the impact of substance abuse and mental illness in fiscal years 2019 through 2023. Other priorities defined in the plan are related to addressing serious mental illness and emotional disturbances, and strengthening health practitioner training and education. Some of these other priorities may also relate to expanding access to substance use disorder treatment, according to SAMHSA officials.
SAMHSA administers several grant programs that aim to, among other things, expand access to SUD treatment and recovery support services. Three of the largest grant programs the agency administers include the SABG, STR grant, and SOR grant programs, though funding for the STR grant program expired in fiscal year 2019. (See table 2.) All 50 states, the District of Columbia, U.S. territories and certain other U.S. jurisdictions are eligible for SABG, STR grant, and SOR grant funding.36 Each grantee may distribute the grant funds to local government entities, administrative service organizations, or directly to prevention and treatment service providers, among others, in accordance with the grantee’s plan for expending the funds.
36Other jurisdictions eligible to receive grant funding include the five U.S. territories (Puerto Rico, the U.S. Virgin Islands, American Samoa, the Commonwealth of the Northern Mariana Islands, and Guam), three freely associated states (Federated States of Micronesia, Republic of the Marshall Islands, and Republic of Palau), and, for SABG, one tribal entity (Red Lake Band of the Chippewa Indians). For the purposes of this report, we limited our examination of the three SAMHSA grant programs to the 50 states and the District of Columbia.
SAMHSA Grant Programs

Page 18 GAO-21-58 Substance Use Disorder
Table 2: Description of Three Selected Substance Abuse and Mental Health Services Administration (SAMHSA) Grant Programs
Grant program Description Substance Abuse Prevention and Treatment Block Grant (SABG)
Established in 1992 and one of SAMHSA’s largest grant programs, the program’s purpose is to help grantees plan, implement, and evaluate activities that prevent and treat substance abuse. The overall goal of the program is to support and expand substance abuse prevention and treatment services while providing maximum flexibility to grantees. The SABG program targets five priority populations and service areas: (1) pregnant women and women with dependent children; (2) persons who inject drugs; (3) tuberculosis services; (4) early intervention services for HIV/AIDS; and (5) primary prevention services. Mandatory allocations: Grantees must spend no less than 20 percent of their allotment on substance abuse primary prevention strategies directed at individuals not identified to be in need of treatment. Grantees identified as HIV-designated states must spend no less than 5 percent of their allotment on early intervention services for HIV disease. No more than 5 percent can be spent on administrative costs. Grant type: Formula grant based on population in need of services in the state, a costs of services index, and total taxable revenue of the state. The 50 states, District of Columbia, and U.S. territories and freely associated states, and one tribal entity are eligible for funding. Funding amount: Approximately $1.8 billion in fiscal year 2019.
State Targeted Response to the Opioid Crisis (STR)
Established in 2016 (and first awarded in May 2017), the program aimed to address the opioid crisis by increasing access to treatment services for opioid use disorders, including medication-assisted treatment; reducing unmet treatment need; and reducing opioid overdose related deaths through the provision of prevention, treatment, and recovery activities for opioid use disorder, including prescription opioids, as well as illicit drugs, such as heroin. Grant type: Discretionary grant. The 50 states, District of Columbia, and U.S. territories and freely associated states were eligible for funding. The amount awarded to each state and U.S. jurisdiction was determined by a formula that accounted for unmet need for opioid use disorder treatment and drug poisoning deaths. Funding amount: $485 million per year, for up to 2 years. One year supplements were awarded to three states for a total of $1 million in fiscal year 2018. Funding for the program expired in fiscal year 2019.
State Opioid Response (SOR)
Established in 2018 (and first awarded in September 2018), the program aims to address the opioid crisis by increasing access to medication-assisted treatment using the three Food and Drug Administration-approved medications—methadone, buprenorphine, and naltrexone—for the treatment of opioid use disorder, reducing unmet treatment need, and reducing opioid overdose related deaths through the provision of prevention, treatment, and recovery activities for opioid use disorder, including prescription opioids, heroin, and illicit fentanyl and fentanyl analogs. Starting in fiscal year 2020, grantees were allowed to use SOR grant funds to also support evidence-based prevention, treatment, and recovery support services to address stimulant misuse and use disorders, including cocaine and methamphetamine. Set-aside: The program includes a 15 percent set-aside for the 10 states with the highest mortality rate related to drug overdose deaths. Grant type: Discretionary grant. The 50 states, District of Columbia, U.S. territories and freely associated states are eligible for funding. The amount awarded to each state and U.S. jurisdiction is determined by a formula that accounts for unmet need for opioid use disorder treatment and drug poisoning deaths. Funding amount: Approximately $933 million in fiscal year 2018; a supplement of approximately $486 million in March 2019; approximately $933 million in fiscal year 2019; and approximately $1.4 billion in fiscal year 2020. The grant program project period ran from September 30 through September 29 of the following year.
Source: GAO review of SAMHSA documents. | GAO-21-58.
For each of the three grant programs, grantees are required to submit, every 6 months or annually, progress and financial reports containing summary information on their progress toward meeting goals (grant

Page 19 GAO-21-58 Substance Use Disorder
program goals and goals grantees set); the number of individuals served, including by certain types of treatment provided; and grant expenditure amounts. In addition, grantees are to report to SAMHSA data collected by providers about the individuals served through the grant programs:
• For the SABG and STR grant programs, data on individuals served who were admitted to a publicly funded SUD treatment facility are to be reported through SAMHSA’s Web Block Grant Application System. Data reported by states into this system are aggregated from SAMHSA’s Treatment Episode Data Set (TEDS), a data system created to comply with mental health and substance abuse data collection required by the Public Health Service Act and later adapted to measure the SABG program’s outcomes. Individual-level data collected by providers at admission and discharge for each individual’s episode of treatment is to be reported into TEDS. These data include information about each individual’s demographic characteristics; history of substance use and prior treatment; the type of services provided, such as MAT; and levels of treatment provided, such as short-term residential or intensive outpatient.
• For the SOR program, data on individuals served by the grant program are reported through SAMHSA’s Performance Accountability and Reporting System. Data reported by states into this system are collected by SUD treatment and recovery support services providers using a questionnaire that, according to SAMHSA officials, the agency developed to help the Department of Health and Human Services meet requirements of the Government Performance and Results Act of 1993 (GPRA) and the GPRA Modernization Act of 2010. The questionnaire, referred to as the GPRA Client Outcome Measures tool (GPRA tool), is administered by providers at client intake, 6-month follow-up, and discharge from a SAMHSA funded treatment program to collect data about each individual served. Information collected about the individuals served includes their demographic characteristics, SUD diagnoses, and treatment services provided.
SAMHSA’s 5-year strategic plan also includes a specific priority area to improve data collection, analysis, dissemination, and program and policy evaluation for its grant programs. The strategic plan defines measurable objectives and activities to meet this priority area, some of which include making improvements to data collected for the grant programs. Specifically, the strategic plan states that the agency will develop consistent data collection strategies to identify and track mental health and substance use needs across the nation, including through TEDS for the SABG program. The plan also states that the agency will ensure that

Page 20 GAO-21-58 Substance Use Disorder
all SAMHSA grant programs are evaluated in a robust, timely, and high-quality manner by, among other things, capturing real-time data for its discretionary grant programs, including the collection of SOR grant program data to track programmatic and client progress, as well as the impact of the program.
The number of SUD treatment facilities and facilities that offered certain services, such as detoxification and MAT services, and the number of providers with a DATA 2000 waiver have increased since 2009, according to SAMHSA data. However, it is unclear to what extent these increases have affected overall SUD treatment capacity, because of data limitations. Further, SAMHSA data, studies we reviewed, and stakeholders we interviewed suggest there are gaps in SUD treatment capacity and barriers to expanding SUD treatment capacity.
Based on our review of SAMHSA data, we found that from 2009 through 2018, the overall number of SUD treatment facilities, including the number of facilities that offered certain treatment services, such as detoxification and specific clinical and therapeutic services, have increased. From 2009 through 2019, the number of facilities that offered MAT medications and providers with DATA 2000 waivers to prescribe buprenorphine also increased.
Our analysis of SAMHSA’s N-SSATS data shows that the overall number of SUD treatment facilities increased from 2009 through 2018—from 13,513 facilities to 14,809 facilities—with an average annual increase of 1 percent. According to our analysis, the largest absolute increases in treatment facilities were among those that offered less intensive levels of care, including regular outpatient and intensive outpatient treatment. Facilities that offered more intensive levels of care—outpatient day or partial hospitalization, short-term residential, and hospital inpatient treatment—had smaller increases in the absolute number of facilities, or in the case of long-term residential treatment, the number decreased. (See fig. 3.) Eight of the 11 stakeholders we interviewed commented on the increase in the number of facilities that offered outpatient treatment, with four of these stakeholders noting that the increase was a positive development. These stakeholders said that greater use of outpatient care may be attributed to increased understanding that SUDs can be treated successfully in outpatient settings—particularly with the growth in MAT—
The Number of SUD Treatment Facilities and MAT Services Has Increased Since 2009, but Potential Gaps in Capacity and Barriers to Expanding Capacity Remain SAMHSA Data Show SUD Treatment Facilities and MAT Services Have Increased Since 2009
SUD Treatment Facilities and Services Offered

Page 21 GAO-21-58 Substance Use Disorder
and that treatment in residential or hospital inpatient treatment facilities may not always be necessary or the best treatment option for some individuals.
Figure 3: Substance Abuse Treatment Facilities by Level of Care, in 2009 and 2018
Note: See appendix I for a description of each level of care.
Our analysis of N-SSATS data also shows that the number of facilities that offered detoxification and certain clinical and therapeutic services—which may be used for treating a wide range of SUDs or in conjunction with MAT medications to provide the counseling and behavioral therapy component of MAT—also increased from 2009 through 2018.37 Specifically, the number of facilities that offered detoxification services—which may be offered in outpatient, residential, or hospital inpatient settings—increased from 2,593 facilities in 2009 to 2,981 facilities in 2018, with an average annual increase of about 2 percent. Similarly, the
37Detoxification is a set of interventions aimed at managing acute intoxication and withdrawal.

Page 22 GAO-21-58 Substance Use Disorder
number of facilities that offered certain clinical and therapeutic services, such as cognitive-behavioral therapy, motivational interviewing, and trauma-related counseling, also increased from 2009 through 2018. (See table 3.) In contrast, the percentage of facilities that offered other types of services, such as 12-step facilitation, decreased during this time period.
Table 3: Percentage of Facilities by Type of Clinical and Therapeutic Services Offered for Substance Use Disorder Treatment at Least Sometimes, in 2009 and 2018
Clinical and therapeutic servicesa
Percentage of all facilities that offered service (2009)
(total number of facilities: 13,513)
Percentage of all facilities that offered service (2018)
(total number of facilities: 14,809)
Substance abuse counseling 99 99 Relapse prevention 96 96 Cognitive-behavioral therapy 91 94 Motivational interviewing 85 93 Brief intervention 80 83 Anger management 83 83 Trauma-related counseling 65 82 12-step facilitation 79 72 Dialectical behavior therapy 47b 58 Contingency management/motivational incentives 60 56 Rational emotive behavioral therapy 49 45 Matrix model 37 45 Computerized substance abuse treatment 14c 17 Community reinforcement plus vouchers 14 12 Other treatment approaches 16 9
Source: GAO analysis of Substance Abuse and Mental Health Services Administration data. | GAO-21-58
Notes: The National Survey of Substance Abuse Treatment Services (N-SSATS) reports on the frequency of use of the clinical and therapeutic services listed above, including responses always or often, sometimes, rarely, never, and not familiar with this approach. “At least sometimes” is the sum of responses for always or often and sometimes. aSee appendix II for descriptions of the clinical and therapeutic services. bN-SSATS did not record data for dialectical behavior therapy until 2015. The total number of facilities in 2015 was 13,873. cN-SSATS did not record data for computerized substance abuse treatment until 2012. The total number of facilities in 2012 was 14,311.
Our analysis of N-SSATS data also found that the number of treatment facilities that offered MAT increased from 2009 through 2018. Specifically, the number of facilities that offered methadone, buprenorphine, or naltrexone increased by an average of 9 percent per year from 2009
Facilities and Providers that Offered MAT Services

Page 23 GAO-21-58 Substance Use Disorder
through 2018—from 2,926 facilities to 6,259 facilities. According to N-SSATS data, most of the increase during this time was in the number of facilities that offered buprenorphine and naltrexone, although there was also a slight increase in the number of facilities that offered methadone.38 (See fig. 4.)
Figure 4: Facilities Offering Medication-Assisted Treatment (MAT) by Medication Type, 2009-2018
Notes: The Food and Drug Administration approved naltrexone for the treatment of opioid use disorders in October 2010. The 2011 National Survey of Substance Abuse Treatment Services was the first year that data on the number of facilities that offered naltrexone for MAT was reported. “Buprenorphine” includes buprenorphine with and without naloxone, buprenorphine sub-dermal implant, and extended-release injectable buprenorphine. “Naltrexone” refers to extended release
38From 2009 through 2018, the number of facilities that offered buprenorphine increased by an average of 9 percent each year, and the number of facilities that offered methadone increased by an average of 2 percent each year. From 2011 through 2018, the number of facilities that offered naltrexone increased by an average of 21 percent each year. The Food and Drug Administration approved naltrexone for the treatment of opioid use disorders in October 2010. The 2011 N-SSATS was the first year that data on the number of facilities that offered naltrexone for MAT was reported.

Page 24 GAO-21-58 Substance Use Disorder
injectable naltrexone. “Any MAT type” includes all facilities providing these medications, as well as facilities with opioid treatment programs providing methadone, buprenorphine, or naltrexone.
SAMHSA’s data show an increase in the number of providers with DATA 2000 waivers to prescribe buprenorphine from 2009 through 2019. Specifically, as of December 2019, SAMHSA data showed that there was a total of 77,223 providers with a DATA 2000 waiver, which represented an average annual increase of 16 percent from 2009 when there were 18,055 waivered providers. Cumulatively, the potential capacity of waivered providers—the maximum number of patients a provider may prescribe buprenorphine to as determined by their waiver limit—increased by an average of 19 percent per year from 2009 through 2019, from 794,840 patients to 4,634,365 patients.
The number of waivered providers has increased across all provider types since 2009. From 2009 through 2019, the number of physicians with DATA 2000 waivers increased from 18,055 providers to 58,884 providers. After becoming eligible to receive waivers in 2016, there were 14,508 nurse practitioners and 3,789 physician assistants with waivers by December 2019.39 (See fig. 5.)
39The Comprehensive Addiction and Recovery Act of 2016 permitted qualified nurse practitioners and physician assistants to receive a DATA 2000 waiver. SAMHSA’s data on the number of DATA 2000-waivered providers includes one record for a waivered nurse practitioner in 2015 and 2016; our analysis excludes these records and shows all data for nurse practitioners and physician assistants beginning in 2017. In 2018, the SUPPORT Act provided temporary eligibility to obtain a DATA 2000 waiver to clinical nurse specialists, certified registered nurse anesthetists, and certified nurse midwives. However, due to the relatively small number of DATA 2000 waivers obtained by these providers by the end of 2019—17, two, and 23, respectively—we excluded these providers from analyses of waivered providers by provider type.

Page 25 GAO-21-58 Substance Use Disorder
Figure 5: Number of Providers with a DATA 2000 Waiver by Provider Type, 2009-2019
Notes: The Drug Addiction Treatment Act of 2000 (DATA 2000) allows qualified providers to apply to SAMHSA to obtain a waiver to dispense or prescribe buprenorphine to a limited number of patients for opioid use disorder treatment in an office-based setting. Data on the number of nurse practitioners and physician assistants with a DATA 2000 waiver begins in 2017 as these types of providers were not allowed to obtain a DATA 2000 waiver until the enactment of the Comprehensive Addiction and Recovery Act of 2016.
The number of providers with DATA 2000 waivers also increased across all waiver patient limits since 2009. From 2009 through 2019, the number of providers with 30-patient waivers increased from 14,483 to 57,838 providers, and the number of providers with 100-patient waivers increased from 3,617 to 13,694 providers. Additionally, since becoming

Page 26 GAO-21-58 Substance Use Disorder
available in 2016, the number of providers that obtained 275-patient waivers grew to 5,563 providers.40 (See fig. 6.)
Figure 6: Number of Providers with a DATA 2000 Waiver by Patient Limit, 2009-2019
Notes: The Drug Addiction Treatment Act of 2000 (DATA 2000) allows qualified providers to apply to SAMHSA obtain a waiver to dispense or prescribe buprenorphine to a limited number of patients for opioid use disorder treatment in an office-based setting. Data on the number of providers with a 275-patient waiver begins in 2016, the first year in which waivers with a patient limit of 275 were made available. This figure contains data for all eligible provider types, including physicians, nurse practitioners, physician assistants, clinical nurse specialists, certified registered nurse anesthetists, and certified nurse midwives.
40In certain circumstances, providers with a current waiver to treat 100 patients may request a temporary waiver increase to treat up to 275 patients to address emergency situations, referred to as a 275E waiver. According to SAMHSA’s data, relatively few providers had a 275E waiver from 2017 through 2019—there were 128 275E waivers as of December 2019—and we, therefore, excluded them from our analyses of waivered providers by waiver limit.
Page 27 GAO-21-58 Substance Use Disorder
Despite increases in the number of SUD treatment facilities and MAT services since 2009, it is unclear the extent to which these increases have affected overall SUD treatment capacity, for several reasons. Data from N-SSATS provides information on the number of treatment facilities nationwide, but the data do not capture the full spectrum of treatment providers and therefore the data likely underestimate SUD treatment capacity nationwide. For example, N-SSATS data do not capture SUD treatment provided in private practices, such as private physicians who are unaffiliated with a substance abuse treatment program or facility, or treatment provided in primary care settings or prisons.
Further, there are other ways to measure overall SUD treatment capacity than the number of treatment facilities and the types of services offered, according to a study we reviewed.41 For example, the size and skills of a facility’s workforce and the number of individuals that a facility can serve are also important aspects of understanding overall treatment capacity. However, N-SSATS does not collect information on the SUD treatment workforce. Although SAMHSA collects data on the capacity of outpatient facilities, the agency does not include this information in its annual N-SSATS report.
Additionally, N-SSATS contains other data that indicate capacity for facilities that offer residential and hospital inpatient treatment—the number of beds designated for SUD treatment and the utilization rate of those beds—but these measures suggest that capacity may have declined from 2009 through 2017.42 For example, from 2009 through 2017:
• N-SSATS data show the number of beds designated for SUD treatment in residential (non-hospital) treatment settings decreased by an average of 2 percent each year—from 110,795 beds to 91,601
41Assistant Secretary for Planning and Evaluation, Needs Assessment Methodologies, p. 12.
42Substance abuse treatment clients may also occupy non-designated beds, and therefore, the number of beds designated for substance abuse treatment may underestimate actual capacity. Since 2013, N-SSATS does not collect data on the number of designated substance abuse treatment beds in even-numbered years and, therefore, the 2017 N-SSATS was the most recent year in which this data was available at the time of our analysis.
Extent of Overall SUD Treatment Capacity is Unclear

Page 28 GAO-21-58 Substance Use Disorder
beds, while the utilization rate of these beds increased by an average of 1 percent each year—from 89 percent to 94 percent.43
• The data also show that the number of beds designated for SUD treatment in hospital inpatient treatment settings decreased by an average of 0.1 percent each year—from 12,829 beds to 12,707 beds, while the utilization rate of these beds increased by an average of 2 percent each year—from 84 percent to 98 percent.
Moreover, despite growth in the number of providers with DATA 2000 waivers, including at the higher waiver limits, it is unclear to what extent this growth increased actual MAT treatment capacity. We previously reported that waivered providers treat fewer opioid use disorder patients than their waiver limit.44 For example, in our January 2020 report, we found that according to a survey of physicians, nurse practitioners, and physician assistants who obtained a waiver or increased their patient waiver limit in 2017, these providers were treating, on average, about one-third of their patient limit. As we explained in our report, the reasons why providers may not treat the maximum number of patients allowed by their waiver limit include not being specialists in addiction medicine or not wanting to treat a larger number of patients. Further, according to SAMHSA, approximately 45 percent of providers with a DATA 2000 waiver do not choose to be listed on the agency’s Behavioral Health Treatment Services Locator.
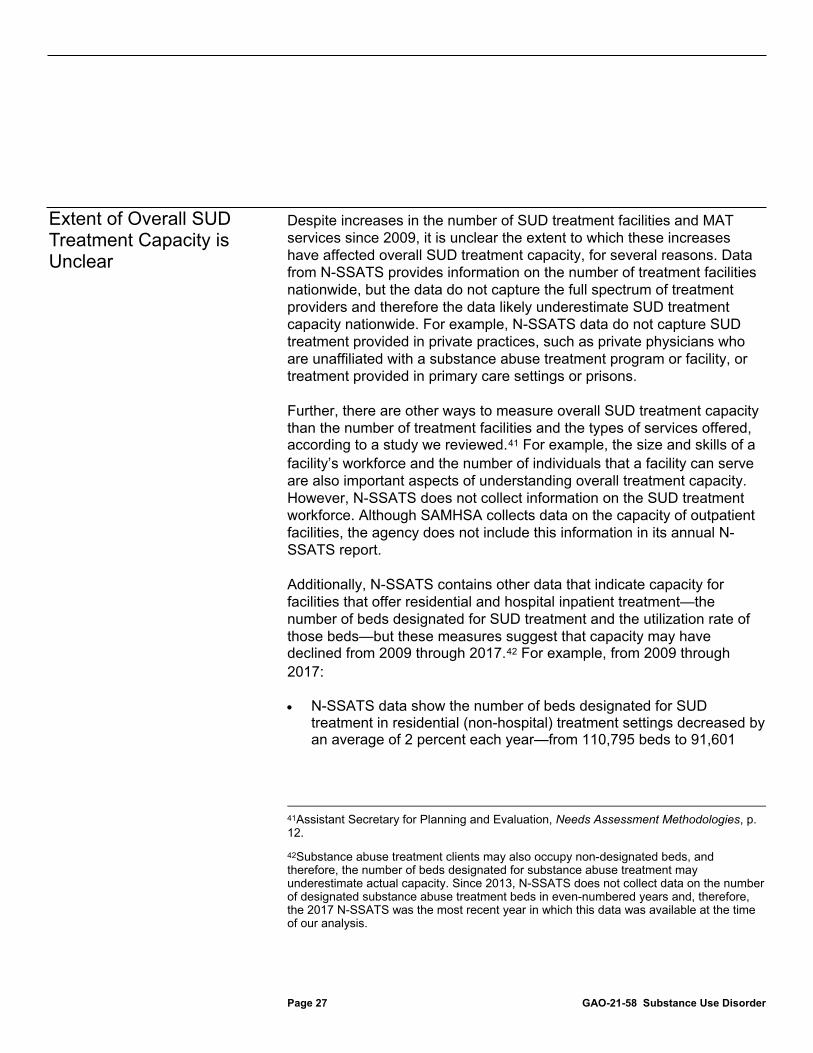
According to SAMHSA data, as of May 1, 2020, most counties in the United States—2,236 (69 percent)—had at least one level of care for SUD treatment available, but about one third of counties—997 (31 percent)—had no treatment facilities that offered any level of care.45 Among the counties in which at least one level of care was available, 189 (6 percent of all counties) had all six levels of care—the full continuum of 43According to N-SSATS, utilization rates were calculated by dividing the number of clients by the number of beds designated for SUD treatment. N-SSATS data show that the overall number of clients in treatment increased from 2009 through 2017. Specifically, the number of clients in hospital inpatient treatment increased by an average of 3 percent per year during this time, while the number of clients in residential (non-hospital) treatment decreased by an average of 0.4 percent per year. The number of clients in outpatient treatment increased by an average of 1.9 percent per year.
44GAO, Opioid Use Disorder: Barriers to Medicaid Beneficiaries’ Access to Treatment Medications, GAO-20-233 (Washington, D.C.: January 24, 2020).
45We based our analysis on the 3,233 counties or county equivalents as defined by the U.S. Census Bureau, including the District of Columbia, within the 50 states and U.S. territories.
SAMHSA Data and Stakeholders Identified Potential Gaps in SUD Treatment Capacity

Page 29 GAO-21-58 Substance Use Disorder
substance use disorder treatment—available, while 2,047 (63 percent) had between one and five levels of care—partial continuum of substance use disorder treatment—available. (See fig. 7.) As noted, the six levels of care generally correspond to the nine levels of the American Society of Addiction Medicine’s continuum of care.46
46Through N-SSATS, SAMHSA tracks whether facilities offer one or more of six levels of SUD treatment, which generally correspond to the American Society of Addiction Medicine’s continuum of care for SUD treatment. Specifically, each level of SUD treatment described in the N-SSATS questionnaire is accompanied by a notation indicating the corresponding level of care from the American Society of Addiction’s continuum of care for SUD treatment. For a description of the levels of care captured in N-SSATS and the corresponding American Society of Addiction Medicine’s level of care and definitions, see appendix I.
Page 30 GAO-21-58 Substance Use Disorder
Figure 7: Availability of Continuum of Care for Substance Use Disorder Treatment, by County, as of May 1, 2020
Notes: The continuum of care for substance use disorder (SUD) treatment refers to different levels of intensity of treatment that each have specific treatment and provider requirements. SAMHSA collects information in its annual National Survey of Substance Abuse Treatment Services (N-SSATS) on six levels of treatment across the continuum: regular outpatient treatment, intensive outpatient treatment, outpatient day treatment/partial hospitalization, long-term residential treatment, short-term residential treatment, and hospital inpatient treatment. “No levels of care” refers to counties in which there were no treatment facilities that offered any level of care. “Partial continuum” refers to counties that did not have a facility, or a combination of facilities, that offered all levels of the continuum of care for SUD treatment, but had at least one treatment facility that offered at least one level of care. “Full continuum” refers to counties in which there was a facility, or a combination of facilities, that offered all six levels of the continuum of SUD treatment.

Page 31 GAO-21-58 Substance Use Disorder
Ten of the 11 stakeholders we interviewed said it was important for individuals to have access to all levels—the full continuum—of care within a reasonable distance from their communities.47 The stakeholders indicated that lack of such access could result in a variety of adverse consequences, including individuals being placed into a level of treatment that is misaligned to their needs, individuals not seeking treatment at all, or individuals experiencing worse outcomes up to and including death.
In addition, according to SAMHSA’s data, there are areas of the country without certain levels of care. Overall, we found there is greater availability of lower-intensity levels of care than higher-intensity levels of care. (See fig. 8.) For example, most counties (67 percent) had a facility that offered regular outpatient treatment. However, 75 percent did not have a facility that offered long-term residential treatment, and 90 percent did not have a facility that offered hospital inpatient treatment. Individuals may seek treatment outside of their communities, but six of the eight stakeholders that commented on this issue indicated, for example, that doing so may not be ideal if the individual is not able to be linked to continued treatment services in their community, or if they have other ongoing obligations within their community, such as family, education, or work.
47Stakeholders that commented on this issue did not specifically define the geographic size of “community,” which therefore may be larger or smaller than an individual county.
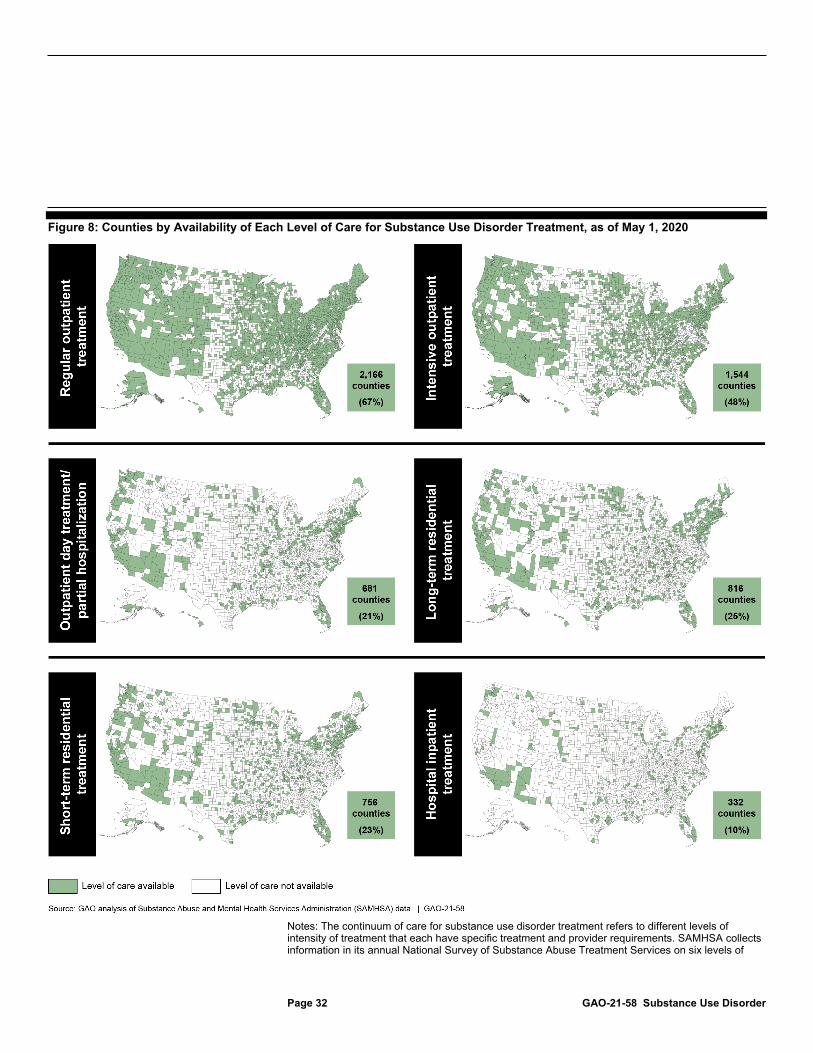
Page 32 GAO-21-58 Substance Use Disorder
Figure 8: Counties by Availability of Each Level of Care for Substance Use Disorder Treatment, as of May 1, 2020
Notes: The continuum of care for substance use disorder treatment refers to different levels of intensity of treatment that each have specific treatment and provider requirements. SAMHSA collects information in its annual National Survey of Substance Abuse Treatment Services on six levels of

Page 33 GAO-21-58 Substance Use Disorder
treatment across the continuum: regular outpatient treatment, intensive outpatient treatment, outpatient day treatment/partial hospitalization, long-term residential treatment, short-term residential treatment, and hospital inpatient treatment. See appendix I for descriptions of each level of care.
According to SAMHSA data, stakeholders we interviewed, and studies we reviewed, there may also be gaps in the availability of facilities that offer MAT medications and providers with DATA 2000 waivers. For example, according to N-SSATS data, in 2018, 42 percent of treatment facilities offered any of the three types of MAT medication. Regarding each MAT medication, N-SSATS data show the following:
• 33 percent of treatment facilities offered buprenorphine, • 28 percent offered naltrexone, and • 10 percent offered methadone.
Among the 11 stakeholders we interviewed, seven also noted potential gaps in the availability of MAT medications and highlighted examples such as gaps in methadone treatment, limited availability of MAT medications in rural areas of the country, and an overall shortage of providers with DATA 2000 waivers. For example, one stakeholder noted that facilities with opioid treatment programs—the only type of facilities that can offer all three MAT medications—are thinly dispersed across large rural counties. In addition, one study we reviewed found that, as of November 2018, as much as 35 percent of all counties in the United States—57 percent of rural counties—did not have a provider with a DATA 2000 waiver to prescribe buprenorphine.48 Further, two other studies we reviewed found that some areas that lacked MAT providers were also areas with a high need for opioid use disorder treatment.49
48R. Ghertner, “U.S. Trends in the Supply of Providers with a Waiver to Prescribe Buprenorphine for Opioid Use Disorder in 2016 and 2018,” Drug and Alcohol Dependence, vol. 204, (2019).
49See, for example, Department of Health and Human Services, Office of Inspector General, Geographic Disparities Affect Access to Buprenorphine Services for Opioid Use Disorder, OEI-12-17-00240 (Washington, D.C.: January 2020); and C. H. A. Andrilla et al., “Geographic Distribution of Providers with a DEA Waiver to Prescribe Buprenorphine for the Treatment of Opioid Use Disorder: a 5-Year Update,” The Journal of Rural Health, vol. 35, (2019): pp. 108–112.

Page 34 GAO-21-58 Substance Use Disorder
Based on interviews with 11 stakeholders and our past work, we found there are barriers to increasing SUD treatment capacity that include the following:
• Shortages in the treatment workforce. Each of the stakeholders identified workforce shortages as a barrier to expanding treatment capacity. Among the reasons the stakeholders cited were that there is a general shortage of a qualified, well-trained SUD treatment workforce, particularly in rural areas. SUD treatment capacity cannot be expanded if there are not providers willing and able to provide treatment. Some of the reasons that stakeholders provided for workforce shortages were low reimbursement rates and pay, lack of training to adequately prepare the workforce, and high turnover rates among the workforce.
• Insurance reimbursement and payment models. Eight stakeholders commented that insurance reimbursement and payment models are barriers to expanding treatment capacity. For example, low reimbursement rates and reimbursement for only certain SUD treatment services were cited as barriers to offering the full continuum of care for SUD treatment and expanding treatment capacity.50 Four of the stakeholders also noted that payment models may not be structured in a way that incentivizes providers to offer certain types of SUD treatment.
• Federal and state requirements. Eight stakeholders said that federal and state requirements may also serve as barriers to expanding treatment capacity. For example, stakeholders noted that the training required to receive a DATA 2000 waiver—and simply the requirement for providers to obtain the waiver—was a barrier that dissuaded some providers from seeking a DATA 2000 waiver, thereby limiting MAT availability. In our January 2020 report, we also found that some providers may be reluctant to get a waiver due to the hours of training associated with obtaining one.51 Six stakeholders also noted that state and federal regulations regarding opioid treatment programs can be restrictive, limiting expansion of treatment capacity in terms of facilities that can dispense methadone.
50We previously reported on the effect of changes in Medicaid payment rates for SUD treatment in selected states on the availability of SUD treatment services, including SUD treatment provider participation in the states’ Medicaid programs. For more information, see GAO, MEDICAID: States’ Changes to Payment Rates for Substance Use Disorder Services, GAO-20-260 (Washington, D.C.: Jan. 30, 2020).
51See GAO-20-233.
Stakeholders Identified Barriers to Expanding SUD Treatment Capacity

Page 35 GAO-21-58 Substance Use Disorder
• Stigma. Seven stakeholders stated that the stigma that surrounds SUD treatment is a barrier to expanding treatment capacity as it may lead some providers to be less willing to provide treatment services. Four of the stakeholders also said that stigma was a barrier to expanding MAT in particular, due to the stigma that surrounds treating SUDs using MAT medications.
Our analysis of SAMHSA data shows that the seven selected states we reviewed used funds they received from the three SAMHSA grant programs—the SABG, STR grant, and SOR grant programs—to pay for SUD treatment services and other efforts, such as provider training, to expand access to SUD treatment and recovery support services.52 SAMHSA data show each of the selected states spent more than two-thirds of their combined SABG and STR grant funds in 2018—the most recent year for which expenditure data were available for both programs—on treatment and recovery support services.53 (See table 4.) See appendix III for further details about the amount of SABG program funding spent by all 50 states and the District of Columbia on treatment and recovery support services.
52The selected states were Alabama, Kentucky, Michigan, New Hampshire, New Mexico, Ohio, and Utah.
53The data include SABG expenditures for state fiscal year 2018, and STR grant program expenditures for May 2018 through April 2019. The three selected grant programs require different categories of expenditure reporting, depending on the program. For example, the STR grant program requires states to report expenditures by separate activity categories, including opioid use disorder prevention, treatment, and recovery support services, as well as administration. The SABG program requires states to report expenditures on SUD non-primary prevention and treatment, primary prevention efforts, tuberculosis services, and administration. For the SABG program, treatment and non-primary prevention expenditures may also include expenditures on recovery support services. According to SAMHSA officials, the agency does not collect expenditure data by type of activity for the SOR grant program, because states are not required to spend a specific amount of SOR funding on certain activities, unlike for the SABG and STR grant programs.
Selected States Used SAMHSA Grant Funds for SUD Treatment Services and Other Efforts to Expand Access, but States Reported Challenges in Spending Some Funds

Page 36 GAO-21-58 Substance Use Disorder
Table 4: Selected States’ SABG and STR Grant Program Expenditures and Percentage Spent on Treatment and Recovery Support Services, 2018
State Total grant expenditures
in dollarsa Dollars spent on treatment and
recovery support services Percentage spent on treatment and recovery support services
Alabama 35,253,064 26,874,555 76 Kentucky 31,502,472 24,270,004 77 Michigan 65,983,505 45,083,770 68 New Hampshire 15,744,827 11,441,201 73 New Mexico 14,221,337 9,899,818 70 Ohio 92,286,291 66,537,577 72 Utah 18,077,026 12,431,352 69
Source: GAO analysis of the Substance Abuse and Mental Health Services Administration (SAMHSA) data. | GAO-21-58
Note: The table includes SAMHSA’s Substance Abuse Prevention and Treatment Block Grant (SABG) expenditures for state fiscal year 2018 and State Targeted Response to the Opioid Crisis (STR) grant program expenditures for May 2018 through April 2019. State Opioid Response (SOR) grant program expenditure data are not included, because SAMHSA does not collect expenditure data by type of activity, such as by treatment or recovery support activities, for the SOR grant program. aTotal expenditures include dollars spent on treatment and recovery support services in addition to dollars spent on other activities, such as primary prevention and administrative activities, including program evaluation and quality assurance.
According to officials in the selected states, the three SAMHSA grant programs are critical to expanding access to SUD treatment and recovery support services in their states. Collectively, the grant programs provided each state with at least one-third of their annual budget for SUD treatment and recovery support services in 2019. (See table 5.)
Table 5: Percentage of Selected States’ Substance Use Disorder Treatment and Recovery Support Budget Provided by Three SAMHSA Grant Programs, State Fiscal Year 2019
State
Total state treatment and recovery support
budget in dollars Dollars provided by
three grant programs
Percentage of treatment and recovery support budget
from the three grant programs Alabama 60,666,084 31,130,622 51 Kentucky 66,336,157 45,393,025 68 Michigan 258,701,374 91,494,507 35 New Hampshire 30,851,155 23,517,637 76 New Mexico 12,002,257 9,623,117 80 Ohioa — — — Utah 58,544,870 24,926,019 43
Source: GAO analysis of state reported data. | GAO-21-58
Notes: A dash (—) reflects no information available.

Page 37 GAO-21-58 Substance Use Disorder
The three Substance Abuse and Mental Health Services Administration (SAMHSA) grant programs are the Substance Abuse Prevention and Treatment Block Grant, State Targeted Response to the Opioid Crisis grant, and State Opioid Response grant programs. States reported that the remaining budgeted SUD treatment dollars came from state general funds or other federal sources, such as other SAMHSA grant programs. Alabama and Michigan’s fiscal year runs from October 1 through September 30, while the other five states’ fiscal years run from July 1 through June 30. Treatment activities generally include diagnostic services to determine the nature and extent of a condition and may include a combination of medication and behavioral therapy. Recovery support activities include services provided in support of treatment and ongoing support after treatment, such as specialized housing, peer support, and employment services. aAlthough we requested data on the state’s SUD treatment and recovery support budget, Ohio did not provide this data.
Our analysis of state and SAMHSA documentation shows that among the seven selected states, activities funded by the three grant programs in fiscal years 2017 through 2020 to expand access to treatment and recovery support services included the following:
Direct provision of treatment and recovery support services. Each of the seven selected states used grant funding to pay for direct treatment services provided to the uninsured, or to individuals who had insurance, but did not have coverage for certain SUD treatment and recovery support services.54 For example, New Hampshire officials said that their state used SABG and SOR grant program funds to supplement the cost of room and board for residential treatment, an expense that is not covered by the state’s Medicaid plan.55 Kentucky officials said that they used STR grant funding to pay for treatment for individuals who are above the state’s Medicaid financial eligibility limit and do not have other insurance. Further, Utah officials told us they used SABG funding to pay for treatment as individuals cycled on and off Medicaid coverage due to the state’s monthly review of individuals’ Medicaid eligibility status.
Officials from selected states that had implemented Medicaid expansions since 2014 (six of the seven states included in our review) described
54Private health plan coverage for SUD treatment does not always cover all types of services. For example, a study conducted by the HHS Office of the Assistant Secretary for Planning and Evaluation found that in 2014 through 2015, out of more than 4,600 health plans reviewed, approximately 5 percent covered outpatient detoxification or outpatient withdrawal management services for opioid use disorder treatment. See Department of Health and Human Services, Office of the Assistant Secretary for Planning and Evaluation, Use of Medication-Assisted Treatment for Opioid Use Disorders in Employer-Sponsored Health Insurance: Final Report (Washington, D.C.: February 2019).
55For each of the grant programs, grant funds cannot be used to supplant current funding of existing activities, including the funding of services provided under the states’ Medicaid programs.

Page 38 GAO-21-58 Substance Use Disorder
recent changes in the use of grant funding to support direct treatment services, in particular for the SABG grant program.56 According to these officials, Medicaid expansion and inclusion of more treatment coverage under the states’ Medicaid programs freed up grant resources to use for other purposes. This, officials said, allowed the SABG program to fund a wider range of activities, such as training providers, building treatment system databases and other infrastructure, or increasing the reimbursement rates for treatment services so states can compete for and retain providers in publicly funded facilities. Officials in Alabama, the one non-expansion state we reviewed, said that because the state has limited Medicaid dollars for SUD treatment, it relies heavily on all three of the grant programs’ funding to support its provision of SUD treatment services for the uninsured.
Initiatives and delivery models to improve access. Each of the seven selected states used grant funding for state-led efforts to implement new models for SUD treatment delivery that research has found improve treatment access and retention. For example, according to state officials, states created 24-hour treatment referral hotlines, treatment centers of excellence that provide expert consultation to support office-based treatment providers, telehealth initiatives to bring treatment to rural communities, and emergency department and first responder programs to initiate immediate treatment engagement after acute overdose incidents (see sidebar).
Training and education to create or enhance provider capacity. Each of the seven selected states used grant funding for various provider capacity building activities, such as expanding the number of DATA 2000 waivered providers, training peer recovery coaches, and enhancing the skills of providers about evidence-based treatment practices. For example, according to Utah officials, the state used SABG funding to conduct online trainings for medical and SUD treatment professionals on screening, brief intervention, and referral to treatment—an evidence-based practice for early intervention and treatment engagement. Alabama officials told us the state used STR and SOR grant funds to hire 16 peer recovery support staff. New Mexico officials told us the state launched online and in-person trainings to increase the number of providers with
56The six states that expanded Medicaid for certain low-income adults under the Patient Protection and Affordable Care Act are Kentucky, Michigan, New Hampshire, New Mexico, Ohio, and Utah.
Examples of State Initiatives and Delivery Models to Improve Substance Use Disorder Treatment and Recovery Support Service Access Kentucky’s Bridge Clinics & Inpatient Consultation: The Bridge Clinic model provides rapid access to treatment for individuals who have experienced an overdose or opioid-related complication by providing access to Food and Drug Administration-approved medication for opioid use disorder in emergency departments and hospitals, as well as onsite engagement with peer support and care coordination. Linkage to ongoing treatment is provided upon discharge. New Hampshire’s Doorway Project: New Hampshire instituted a series of Doorways to serve as single points of entry for substance misuse services. There are nine Doorway locations across the state, ensuring that no one in the state is more than an hour away from help. Doorways provide access to various substance use disorder treatment and recovery support services, including assessment services, referral to treatment and recovery support services, and resources for prevention and awareness. Doorways connect with providers, known as provider spokes, to ensure communication and coordination for client care. New Mexico’s Project ECHO: The Extension for Community Healthcare Outcomes (ECHO) model is a mentoring model developed at the University of New Mexico that utilizes televideo-conferencing technology to enable university-based experts to share knowledge and skills on treatment approaches with rural clinicians spread across the state managing patients with opioid use disorder. Source: GAO analysis. | GAO-21-58

Page 39 GAO-21-58 Substance Use Disorder
DATA 2000 waivers using STR grant funds and continued the program with SOR grant funds.
According to officials in the seven selected states, the states typically spend all their SABG funds within each funding cycle. However, officials in three states told us their states faced challenges in spending STR grant funding within the grant program’s 2-year project period. Each of the selected states, with the exception of Alabama, requested no-cost extensions to allow an additional 12-month period to spend STR grant funds.57 As of October 31, 2019—6 months into the 12-month no-cost extension period—our analysis of SAMHSA data shows that, of the six states that requested no-cost extensions, three of the states had spent 90 percent or more of their STR funds, though Michigan and New Hampshire had about 20 percent unspent and Kentucky had 14 percent of their STR funds remaining unspent.58 (See table 6.) In March 2020, the HHS Office of Inspector General issued a report recommending that SAMHSA work closely with states during the no-cost extension period to address challenges to timely spending.59
57SAMHSA allows grant recipients a one-time post award amendment to request an extension of up to 12 months on their project, called a no-cost extension. The purpose of the no-cost extension is to ensure completion of the originally approved project, or to permit the orderly phase-out of a project that will not receive continuation support.
58While the 12 month no-cost extension period ended on April 30, 2020, SAMHSA officials told us that states had not yet submitted expenditure data at the time of our review, because the agency granted states an extension in submitting this data due to their competing priorities in addressing COVID-19.
59U.S. Department of Health and Human Services, Office of Inspector General, States’ Use of Grant Funding for a Targeted Response to the Opioid Crisis, OEI-BL-18-00460 (Washington, D.C.: March 2020).

Page 40 GAO-21-58 Substance Use Disorder
Table 6: Selected States’ State Targeted Response to the Opioid Crisis (STR) Grant Awards and Expenditures, as of April and October 2019
State Total award (in dollars)
Percentage unexpended, after year two
(as of April 2019)
Percentage unexpended, after 6 of 12-month extension
(as of October 2019) Alabama 15,935,746 0 n/aa Kentucky 21,056,186 30 14 Michigan 32,745,360 55 21 New Hampshireb 6,256,732 47 22 New Mexico 9,585,102 5 4 Ohio 52,121,004 9 8 Utah 11,074,916 7 5
Source: GAO analysis of the Substance Abuse and Mental Health Services Administration (SAMHSA) data. | GAO-21-58
Notes: The first STR grant program year began in May 2017 and ended in April 2018; the second year began in May 2018 and ended in April 2019. aThe term n/a refers to states that did not request a 12-month no-cost extension. SAMHSA allows grant recipients a one-time post award amendment to request an extension of up to 12 months on their project, called a no-cost extension. The purpose of the no-cost extension is to ensure completion of the originally approved project, or to permit the orderly phase-out of a project that will not receive continuation support. bNew Hampshire received a supplemental award of $333,000 in fiscal year 2018, as one of three states with the highest proportion of overdose deaths per 100,000 people.
Regarding the SOR grant program, early indicators showed that states may face challenges spending these grant funds, similar to the STR grant program. For example, SAMHSA data on SOR grant program spending show that, as of August 2020, four of the states had yet to withdraw at least half of their funding from SAMHSA’s grant award accounts with 1 month remaining until the end of the first 2 years of the grant program in September 2020. (See table 7.) As with the STR grant program, states may request no-cost extensions to provide an additional 12 months to use the remaining SOR grant funds. All seven states received a no-cost extension for their SOR grant award.60 SAMHSA data on the amount of funds states have withdrawn from federal accounts, as of August 2020, also show that fully spending SOR grant award funds was a challenge for most states in addition to the seven states we reviewed. (See app. IV for more information about SOR grant program spending for all 50 states and the District of Columbia.)
60The first SOR grant program year began on September 30, 2018, and ended on September 29, 2019; the second year began on September 30, 2019, and ended on September 29, 2020.

Page 41 GAO-21-58 Substance Use Disorder
Table 7: Selected States’ State Opioid Response (SOR) Grant Program Award and Amount Spent and Percentage Remaining Unspent, as of August 2020
Selected state
Fiscal years 2018 and 2019 award with
supplement (in dollars)a
Total spent, as of August 2020
(in dollars)
Percentage remaining unspent,
as of August 2020 Alabama 34,662,711 26,375,803 24 Kentucky 79,387,128 39,325,817 50 Michigan 70,400,720 22,807,589 68 New Hampshire 57,962,137 25,901,744 55 New Mexico 13,384,943 10,040,063 25 Ohio 140,703,888 57,047,078 59 Utah 20,071,660 14,275,785 29
Source: GAO analysis of the Substance Abuse and Mental Health Services Administration (SAMHSA) data. | GAO-21-58
Note: The amount spent is based on the amount states have withdrawn from SAMHSA’s grant award accounts as of August 2020. aSAMHSA first awarded the SOR grant to states in federal fiscal year 2018, but the grant year began on September 30, 2018, and ended on September 29, 2019. In March 2019, SAMHSA awarded approximately $486 million to supplement the approximately $933 million that SAMHSA had awarded to states in the first year of the SOR grant program. SOR grants were awarded for the second year of the grant program in fiscal year 2019, but that grant period began on September 30, 2019, and ended on September 29, 2020. SAMHSA allowed each of the seven states a one-time post award amendment to request an extension of up to 12 months on their project, called a no-cost extension. The purpose of the no-cost extension is to ensure completion of the originally approved project, or to permit the orderly phase-out of a project that will not receive continuation support. All seven states received a no-cost extension for their SOR grant award.
Officials from the seven states said they have faced several challenges in spending their STR and SOR grant funds, including the following:
Lengthy contracting. Officials from five states—Alabama, Kentucky, New Hampshire, Ohio, and Utah—told us that they had difficulty spending STR and SOR grant funding in the first year, because of lengthy contracting processes. For example, these state officials said that it can take several months (e.g., New Hampshire officials said 6 to 9 months and Kentucky officials said 2 to 4 months) to finalize contracts with new providers before services can be delivered, due to extensive state procurement procedures. The procedures can include, for example, an internal review of the state’s procurement plan, a bidding process whereby the state issues a request for proposals and potential sub-recipients apply for funding, state review and approval of sub-recipient applications, and final processing of contracts. In states that contract to county governments or administrative service organizations, further sub-contracting processes can occur, though officials from the selected states said that, in general, contracting to such entities is more efficient than

Page 42 GAO-21-58 Substance Use Disorder
contracting to several individual providers in each community throughout the state.
Implementation delays. Officials from Ohio and Utah reported that due to delays in the approval of the updated GPRA tool—the client-level data collection tool used by SOR grantees—states were delayed in initiating sub-contracts and implementing SOR grant program activities.61 For example, Ohio officials said providers were hesitant to participate in the SOR grant program, because they did not know what their data collection responsibilities would be under the program. Ohio officials also said providers were reluctant to start new programming under the SOR grant until their STR-funded programs had ended.
Provider reluctance to participate. Officials from five states—Alabama, New Hampshire, New Mexico, Ohio, and Utah—told us that some providers and local jurisdictions were reluctant to accept grant funding, because the providers were uncertain whether funding would continue beyond the grants’ 2-year project period. Building workforce capacity needed for treatment provision, such as hiring new staff, requires long-term financing, according to two of the officials. For example, officials from New Hampshire and New Mexico said that some providers were hesitant to invest in hiring staff without assurances about how they would support those staff long term. State officials from four states also told us that some providers in their state were initially reluctant to provide MAT, including obtaining a DATA 2000 waiver to prescribe buprenorphine. This was partially due to stigma around treating individuals with an opioid use
61The Office of Management and Budget was required to approve the new GPRA tool in accordance with the Paperwork Reduction Act. The initial version of the new GPRA data tool was approved by the Office of Management and Budget in February 2019 for use by all discretionary grant programs administered by SAMHSA’s Center for Substance Abuse Treatment. However, SAMHSA officials said that, given the complexity of the SOR grant program and large financial investment by Congress in the program, the agency modified the initial GPRA tool specifically for the SOR grant program. The SOR-specific GPRA tool was approved by the Office of Management and Budget in June 2019.
Page 43 GAO-21-58 Substance Use Disorder
disorder, uncertainty about how to provide MAT, and the potential burden of providing MAT.62
Insufficient treatment capacity. Officials from each of the seven states told us that a main barrier to expending the grant funds is insufficient SUD treatment capacity and a lack of treatment providers in their state, especially in rural areas where there is a shortage of health care overall. In general, the areas most in need of services are the areas that have the fewest resources, according to the officials. For example, New Hampshire officials said that rural areas of the state have been particularly hard hit by the opioid crisis, but there are minimal treatment resources in those areas compared to the state’s urban centers. This was also the case in Kentucky and Ohio, according to officials in those states.
State officials from the seven selected states told us that an adequate SUD treatment workforce was especially lacking, including professionals trained in providing SUD treatment, such as physicians with a specialty in addiction medicine or licensed clinical social workers with training or experience in counseling individuals with SUDs. For example, officials from New Hampshire said that sub-recipients in their state cannot expend all of their awarded funds when they cannot find the necessary workforce to provide the contracted services. According to Ohio officials, some communities within the state did not apply for the grant funding, because they do not have the basic infrastructure necessary to use the funding.
Restriction of funding to opioid use disorder. Officials from six states—Kentucky, Michigan, New Hampshire, New Mexico, Ohio, and Utah—said the delay in spending STR and SOR grant funding was because the funding was restricted to treating individuals with opioid use disorder. For example, Ohio officials said that one of the reasons the state did not spend approximately 50 percent of its first year SOR grant funding was because the funding had been restricted to treating opioid 62State officials’ comments align with research findings on provider reluctance to adopt MAT prescribing. For example, a survey of physician attitudes toward prescribing buprenorphine found that physicians are reluctant to obtain DATA 2000 waivers to prescribe buprenorphine due to concerns about drug diversion, fears of attracting a large caseload of patients requesting buprenorphine, and requirements for additional training. Physicians also reported that they were reluctant to increase the number of opioid use disorder patients they treat, because the physicians lacked referral resources to counseling services, and also felt they did not have sufficient time to treat the additional patients. See A. S. Huhn and K. E. Dunn, “Why Aren’t Physicians Prescribing More Buprenorphine? Author Manuscript,” Journal of Substance Abuse Treatment, vol. 78 (2017).

Page 44 GAO-21-58 Substance Use Disorder
addiction, despite the fact that Ohio has seen a significant rise in misuse of stimulants, including methamphetamines and cocaine. However, because of a change in federal law, starting in fiscal year 2020, states were allowed to use SOR grant funds to also address stimulants.63
To help address these challenges, officials in the selected states told us they have adopted a variety of strategies, such as limiting the number of sub-grant contracts, leveraging existing resources, and training their SUD treatment workforce early in the grant program. See table 8 for additional information related to these examples.
Table 8: Examples of Strategies Reported by Selected States to Address Challenges in Spending State Targeted Response to the Opioid Crisis Grant and State Opioid Response Grant Program Funds
Strategy Description Sub-contract with an administrative service organization or other third party
To overcome difficulties with lengthy contracting processes, New Mexico officials told us the state contracts with an administrative services organization that administers funds the state receives from the federal government and the state general fund. According to these officials, if the state were to allocate contracts on its own to a small provider in a rural area of the state, for example, that process (individual providers contracting directly with the state) would take about 6 months. However, because the state only has to contract with a single administrative services organization that, in turn, contracts with all of the smaller individual providers, each individual contract can be completed within about 30 days. Likewise, officials in Kentucky stated that rather than sub-contracting with the 10 federally qualified health centers in the state, they instead partnered with the Kentucky Primary Care Association, which then disbursed funds to the health centers.
Leverage existing resources To avoid lengthy contracting processes with new providers, Alabama officials told us the state instead decided to provide funding to providers with existing state contracts and then worked with them to expand their services, such as to other communities. In Ohio, where the funding is provided to county boards, officials explained that they helped build partnerships between counties with limited infrastructure and neighboring counties with more provider capacity. For example, the state was able to get a county board to agree to accept funding by partnering that county with a larger, more urban county that would provide access to the urban treatment providers by offering transportation services.
Invest in workforce training upfront To address the grant programs’ funding uncertainty, New Mexico officials said that they focused on projects that required initial start-up funding, but could be sustained long-term with other funding sources, such as training and building capacity in the workforce, especially to increase providers who can provide medication-assisted treatment (MAT). Kentucky also invested in the training, employment, and supervision of peer recovery specialists, whose services are then paid for by Medicaid. State officials also told us that they are investing in better ways to use the existing workforce capacity. In Michigan, the state is using State Opioid Response grant funds for student loan repayment to incentivize DATA 2000 waivered providers to serve communities in what Michigan calls its “MAT desert,” which are areas where there is a very limited number of providers offering MAT.
Source: GAO analysis. | GAO-21-58
63See Further Consolidated Appropriations Act, 2020, Pub. L. No. 116-94, div. A, tit. II, 133 Stat. 2534, 2566 (2019).

Page 45 GAO-21-58 Substance Use Disorder
SAMHSA also provides states with assistance to help address challenges to spending grant funds. For example, our analysis of agency documentation shows that in 2018, SAMHSA awarded an STR technical assistance contract to the American Academy of Addiction Psychiatry, which partnered with 27 other national organizations to form the Opioid Response Network. This network provides training and technical assistance focusing on applying evidence-based practices in prevention, treatment, and recovery support to meet locally identified needs. In addition, SAMHSA and state officials said the agency provides assistance through monthly phone calls, periodic webinars on topics such as implementing MAT in the criminal justice system and the integration of recovery and clinical services, and state site visits.
SAMHSA uses various information sources to assess how the agency’s three grant programs—the SABG, STR grant, and SOR grant—may be expanding access to SUD treatment and recovery support services. For instance, SAMHSA uses data collected in national surveys, such as N-SSATS, and other national data sources, such as data on prescriptions for MAT medications, according to agency officials. SAMHSA officials also said grant project officers discuss states’ efforts to expand access to treatment and recovery support services, collect information about states’ grant program implementation, and provide states with any needed technical assistance in routine telephone conversations and during periodic monitoring site visits.
SAMHSA’s primary method for assessing whether its three grant programs are expanding access to SUD treatment and recovery support services is by collecting data on the number of individuals served with funding from the grant programs, according to agency officials.64 For instance, officials said that SAMHSA grant project officers compare data on individuals served reported to SAMHSA by states in annual progress reports and through online data collection tools to states’ program goals related to treatment and recovery support service access.
64SAMHSA uses additional data sources to assess the overall performance of the agency’s grant programs, according to SAMHSA officials. Specifically, SAMHSA uses a set of National Outcome Measures to monitor performance of the SABG, STR grant, and SOR grant programs on selected outcomes of those programs, such as changes in drug abstinence, housing and job stability, and retention in treatment. However, the National Outcome Measures do not include a measure of access to treatment and recovery support services for SUDs.
SAMHSA Uses Various Information to Assess the Grant Programs’ Effect on SUD Treatment and Recovery Service Access, but Data on Individuals Served Are Unreliable
Page 46 GAO-21-58 Substance Use Disorder
SAMHSA also uses data on the number of individuals served to report grant program performance, such as in the agency’s annual budget justification reports, and for grant program assessments. For example, agency officials told us that SAMHSA’s Office of Evaluation is leading an effort to create one-to-two page summary profiles for each of its grant programs, which they planned to complete by October 1, 2020.65 Officials said that, among other things, these profiles will describe the grant programs’ performance on key accomplishments, and will include aggregated data on the number of individuals served at a national level. The officials said that they intend to use the profiles for external reporting to Congress and other stakeholders. They also plan to use the profiles for internal program monitoring, to serve as a starting point to identify where SAMHSA may need to look more closely at issues found in the data, such as any racial disparities in access to SUD treatment services. In addition, outside entities, such as the HHS Office of Inspector General, have used SAMHSA’s data on individuals served to inform grant program evaluation activities.66 (See app. V for a summary of selected findings from evaluations of the SABG and STR grant programs.)
However, based on our review of agency data and documentation and interviews with officials from seven selected states, we found that SAMHSA does not have reliable—consistent, relevant, and timely—data on the number of individuals provided treatment and recovery support
65The summary profile for the SOR grant program was publicly released on December 7, 2020. See Substance Abuse and Mental Health Services Administration, State Opioid Response Grants, accessed December 7, 2020 at https://www.samhsa.gov/sites/default/files/state-opioid-response-sor-report.pdf. The agency did not publicly release a profile for the SABG program when it released the SOR grant program profile. Funding for the STR grant program expired in fiscal year 2019.
66Among other things, the evaluation conducted by the HHS Office of Inspector General found that SAMHSA did not collect sufficient data to assess how successful the STR grant program was at achieving its goal of expanded access to MAT. See Department of Health and Human Services, Office of the Inspector General, States’ Use of Grant Funding for a Targeted Response to the Opioid Crisis, OEI-BL-18-00460 (Washington, D.C.: 2020). Generally, the SABG and STR grant program evaluation efforts have not focused on assessing the effects of the grant programs on access to treatment and recovery support services, and SAMHSA has not contracted for an external evaluation of the SOR grant program.

Page 47 GAO-21-58 Substance Use Disorder
services with funding from the three grant programs for the following reasons:67
Data are inconsistently reported. Across the SABG, STR grant, and SOR grant programs, grantee data submitted in states’ annual progress reports on the number of individuals served and services provided are defined and reported differently depending on the state. This makes the data inconsistent for calculating individuals served nationwide. For example, our review of data submitted to SAMHSA in annual SOR progress reports showed that Maryland submitted data to SAMHSA on the number of individuals served for a single early intervention treatment service by counting each of four separate components of the single service as a separate individual, resulting in a count of four individuals per each individual served.68 Additionally, in our interviews with officials from the selected states, officials from three selected states told us that their counts of individuals who were provided treatment also include counts of those who were provided recovery support services, because their data systems or contracted providers do not always track these services separately. SAMHSA officials said that states have not notified the agency of any difficulties defining or distinguishing individuals provided treatment versus recovery support services, but if they did, SAMHSA would offer technical assistance to states to improve reporting consistency. For the SABG program, states submit to SAMHSA in their annual progress reports data on the aggregate number of individuals served by the grant program as collected through TEDS. However, according to SAMHSA’s annual TEDS reports, TEDS data collection practices vary by state.69 For example, states may or may not include individuals enrolled in SUD treatment programs based in the criminal justice system in state counts of individuals served. Likewise, for
67Consistent data are data that are sufficiently clear and well defined to yield comparable results in similar analyses. Relevant data have a logical connection with, or bearing upon, identified information requirements. Timely data are data collected at a sufficiently useful time so that they can be used for effective monitoring. See GAO, Assessing Data Reliability, GAO-20-283G (Washington, D.C.: Dec. 16, 2019); and GAO-14-704G.
68Maryland reported treating 163,950 individuals through SOR grant funding in fiscal year 2019, more than 50 percent of the total number of individuals that states reported having treated with SOR grant funding across the 50 states and the District of Columbia in that year.
69Substance Abuse and Mental Health Services Administration, Center for Behavioral Health Statistics and Quality, Treatment Episode Data Set (TEDS) 2017: Admissions to and Discharges from Publicly-Funded Substance Use Treatment, (Rockville, Md.: 2019)

Page 48 GAO-21-58 Substance Use Disorder
detoxification facilities, which can generate large numbers of individual treatment counts, states do not uniformly consider them treatment facilities and therefore do not uniformly report information on such treatment into TEDS.70
Data counting individuals served outside of the SABG program are not relevant. For the SABG program, our analysis of SAMHSA documentation shows that state-reported data on the number of individuals receiving treatment services includes broader counts of individuals served through all public funding, not just by the SABG grant program. Therefore, these broader counts do not allow for a calculation of the number of individuals served only by the SABG program. As such, this limits the relevance of this measure for assessing the effects of the grant program on access.71 For example, in a SABG-funded facility that also receives state Medicaid funding, patients treated for an SUD through the Medicaid program would also be reported as being served by the SABG program. SAMHSA officials told us that the agency has a long-standing agreement with states to use these data as a proxy measure, since the funding supports state grantees’ broader public SUD treatment delivery systems. Data on individuals served by the SOR grant program are not timely. As noted, states submit information on the aggregate number of individuals served to SAMHSA in their annual progress reports for the SOR grant program. However, states are not consistently reporting these data, as described above. To enhance SAMHSA’s ability to receive consistent, real-time, and more detailed data, SAMHSA began to collect data in June 2019 on individuals served using the SOR grant program’s GPRA tool.72 Through this tool, states are required to collect data at client intake, as well as at 6-month
70A 2009 evaluation report also noted data collection inconsistencies with the TEDS tool used to measure SABG program performance and recommended data improvements. See Substance Abuse and Mental Health Services Administration, Independent Evaluation of the Substance Abuse Prevention and Treatment Block Grant Program: Final Evaluation Report (Rockville, Md.: 2009).
71According to instructions SAMHSA provides to states, states are to submit unduplicated counts of individuals served by the grant program based on the total number of persons that are admitted for substance abuse treatment in SABG-funded treatment facilities, regardless of what public funding source supported their treatment.
72The GPRA tool is a questionnaire used to collect data about each individual served by the SOR grant program, including their demographics, SUD diagnoses, treatment services provided, and outcome measures. The data tool requests intake; 6-month follow-up; and discharge data to calculate outputs, such as number of individuals served; and outcomes of the program, such as drug abstinence.

Page 49 GAO-21-58 Substance Use Disorder
follow-up and at discharge, and submit these data to SAMHSA on a rolling basis.73
However, we found that states have been delayed in submitting GPRA data to SAMHSA. Therefore, SAMHSA does not have the timely data the agency sought with which to assess how many individuals received services during the grant program’s first year. States are to submit GPRA data on individuals served by the SOR grant program on an ongoing basis. As of September 30, 2020, the end of the second grant program year, state grantees had submitted 105,443 intake surveys through the GPRA tool. In contrast, through their annual progress reports, states reported that 283,485 individuals received treatment services and 142,184 individuals received recovery support services during the first grant program year in 2019. SAMHSA and state officials told us states were delayed in submitting SOR GPRA data for various reasons. In particular, although SAMHSA awarded program funds to states in September 2018, SAMHSA was not able to provide the GPRA tool for use by states until June 2019.74 The release of the tool was delayed to allow the agency to modify the GPRA tool specifically for the SOR grant program and obtain Office of Management and Budget approval of the SOR-specific tool, according to SAMHSA officials. As a result, officials in Utah told us they had to, for example, re-negotiate contracts with their providers to incorporate reporting requirements for the GPRA tool, and officials in New Mexico said the state had to backfill missing data that had not been collected up to that point, which caused delays in submitting data to SAMHSA.
SAMHSA has taken some steps to improve the reliability of the data it collects on individuals served by the SOR grant and SABG programs.75 Regarding the SOR grant program, SAMHSA officials said that the agency’s adoption of the GPRA tool in June 2019 will provide a more reliable, alternative source of data on individuals served by the program 73For the SOR grant program, data on individuals served by the grant program collected through the GPRA tool are reported through SAMHSA’s Performance Accountability and Reporting System.
74The initial GPRA tool was approved by the Office of Management and Budget in February 2019 for use by all discretionary grant programs administered by the SAMHSA’s Center for Substance Abuse Treatment. However, agency officials said that, given the complexity of the SOR grant program and large financial investment from Congress in the program, the agency modified the initial version of the GPRA tool specifically for the SOR grant program. The SOR-specific GPRA tool was approved by the Office of Management and Budget in June 2019.
75SAMHSA officials noted that it is unnecessary to take steps to improve the reliability of STR grant program data since funding for the STR program expired in fiscal year 2019.

Page 50 GAO-21-58 Substance Use Disorder
than the inconsistent data submitted by states in their annual progress reports. States are to submit data as collected through the GPRA tool on individuals served by the SOR grant program on an ongoing basis. SAMHSA also sent an email in July 2020 to SOR grant recipients explaining that SAMHSA will review compliance with the GPRA tool data collection requirements when considering any states’ requests for no-cost extensions and will place grant funding on hold until states implement any necessary corrective actions to rectify any lags or lapses in data collection.
Regarding the SABG program, SAMHSA officials said that they plan to follow the agency’s strategic plan, which states that the agency aims to reassess TEDS, the tool it uses to collect data on individuals served by the program. The strategic plan notes that SAMHSA intends to convene states and other stakeholders to jointly develop options for revising or replacing the data collection tool.76 According to agency officials, the agency will begin these efforts in fiscal year 2021 and plans to complete updates to TEDS by the end of fiscal year 2023. However, it is unclear whether these planned efforts will resolve the data consistency and relevance problems we identified for data on numbers of individuals served. In particular, the agency has yet to identify the specific changes it plans to make to improve the consistency of TEDS data reported across states or to ensure that TEDS collects data for those individuals served with SABG program funds separate from those served with other funding sources. Although SAMHSA officials said using the GPRA tool could provide a solution to data inconsistencies, SAMHSA did not pursue prior efforts to adopt the GPRA tool to collect data for the SABG program, because states told SAMHSA that reporting the GPRA individual-level data is burdensome.
In the meantime, the lack of consistent and relevant information on individuals served for the SABG program are inconsistent with federal internal control standards. Those standards state that management
76In SAMHSA’s fiscal years 2019-2023 Strategic Plan, one of the agency’s priority objectives is to develop consistent data collection strategies to identify and track mental health and substance use needs across the nation. As one strategy to achieve this objective, SAMHSA plans to reassess TEDS. According to the strategic plan, key activities for this strategy include (1) working with states to address what data can be collected when considering changing service delivery and financing systems, including the continuum of care, while facilitating high-quality and timely collection of TEDS data as required by the SABG program; and (2) convening and supporting partnerships with states and other stakeholders to develop options to revise or replace TEDS data collections.

Page 51 GAO-21-58 Substance Use Disorder
should use quality information, such as reliable data, to achieve the entity’s objectives and respond to risks.77 Without reliable data on the number of individuals served using funding from the SABG program, SAMHSA cannot accurately assess the extent to which this program is achieving the agency’s goal of improving access to SUD treatment and recovery support services.
Access to SUD treatment is of critical importance given the significant effects SUD—including opioid and other drug misuse—has had on our nation and in light of further potential negative impacts stemming from the COVID-19 pandemic. SAMHSA plays an important role in supporting SUD treatment access through its three grant programs, and states have indicated that those programs have been critical sources of funding for expanding access to SUD treatment and recovery support services.
SAMHSA primarily relies on data on the number of individuals served to assess the extent to which its grant programs have expanded access to SUD treatment and recovery support services, yet we found those data to be unreliable across the grant programs. SAMHSA has begun to improve the consistency of data for the SOR grant program with the implementation of the GPRA tool in June 2019 and has taken actions to ensure more timely collection of the data. The agency also has plans to begin efforts in fiscal year 2021 to improve the data it collects through TEDS for the SABG program. As it moves forward with these plans, it will be important for SAMHSA to identify and implement changes to improve the consistency and relevance of the data it collects on the number of individuals served. Doing so will allow SAMHSA to better understand the extent to which the SABG program is expanding access to critical SUD treatment and recovery support services, and make any adjustments to its approach in administering the grant program. More reliable data will also provide a more accurate picture of the grant program’s impact on access for grantees, Congress, and others who rely on this information.
The Assistant Secretary for Mental Health and Substance Use should identify and implement changes to the SABG program’s data collection efforts to improve two elements of reliability—consistency and relevance—of data collected on the number of individuals who receive
77See GAO-14-704G.
Conclusions
Recommendation for Executive Action

Page 52 GAO-21-58 Substance Use Disorder
SUD treatment and recovery support services with funding from the SABG program. (Recommendation 1)
We provided a draft of this report to HHS for review and comment. In its written comments (reproduced in app. VI), SAMHSA concurred with our recommendation. The agency stated that it plans to review SABG data collection metrics in 2021, and noted that it anticipates working to improve the quality and timeliness of this data as part of this effort. HHS also provided technical comments, which we incorporated as appropriate.
We are sending copies of this report to the appropriate congressional committees, Secretary for Health and Human Services, and other interested parties. In addition, the report is available at no charge on the GAO website at http://www.gao.gov.
If you or your staff members have any questions about this report, please contact me at (202) 512-7114 or [email protected]. Contact points for our Offices of Congressional Relations and Public Affairs may be found on the last page of this report. GAO staff who made key contributions to this report are listed in appendix VII.
Alyssa M. Hundrup Acting Director, Health Care
Agency Comments

Appendix I: Levels of Care for Substance Use Disorder Treatment
Page 53 GAO-21-58 Substance Use Disorder
The Substance Abuse and Mental Health Services Administration’s National Survey of Substance Abuse Treatment Services (N-SSATS) asks treatment facilities whether they offer one or more of six substance use disorder (SUD) treatment categories. Each category described in the survey is accompanied by a notation indicating the corresponding level of care from the American Society of Addiction Medicine’s continuum of care for SUD treatment.1 Table 9 describes the corresponding American Society of Addiction Medicine’s level of care for each N-SSATS treatment category.
Table 9: N-SSATS Categories of Substance Use Disorder (SUD) Treatment and Corresponding Levels of Care for Adults from the American Society of Addiction Medicine’s Continuum of Care for SUD Treatment
N-SSATS category
Corresponding American Society of Addiction Medicine’s continuum of care level for adults and definition
Regular outpatient Level 1.0 outpatient services: Fewer than 9 hours of service per week for recovery or motivational enhancement therapies or strategies.
Intensive outpatient Level 2.1 intensive outpatient services: 9 or more hours of service per week to treat multidimensional instability.
Outpatient day or partial hospitalization
Level 2.5 partial hospitalization services: 20 or more hours of service per week for multidimensional instability not requiring 24-hour care
Long-term residential Level 3.1 clinically managed low-intensity residential services: 24-hour living support and structure with available trained personnel; at least 5 hours of clinical service per week or step-down from more intensive care.
Level 3.3 clinically managed population-specific high-intensity residential services: 24-hour care with trained counselors to stabilize multidimensional imminent danger. Less intense milieu and group treatment for those with cognitive or other impairments unable to use full active milieu or therapeutic community.
Short-term residential Level 3.5 clinically managed high-intensity residential services: 24-hour care with trained counselors to stabilize multidimensional imminent danger and prepare for outpatient treatment. Patients in this level are able to tolerate and use full active milieu or therapeutic community.
1For more information, see American Society of Addiction Medicine, What Are the ASAM Levels of Care? (May 13, 2015), accessed Aug. 10, 2020, https://www.asamcontinuum.org/knowledgebase/what-are-the-asam-levels-of-care/.
Appendix I: Levels of Care for Substance Use Disorder Treatment

Appendix I: Levels of Care for Substance Use Disorder Treatment
Page 54 GAO-21-58 Substance Use Disorder
N-SSATS category Corresponding American Society of Addiction Medicine’s continuum of care level for adults and definition
Hospital inpatient Level 3.7 medically monitored intensive inpatient services withdrawal management: 24-hour nursing care with physician availability for significant problems in acute intoxication, withdrawal potential, or both; biomedical conditions and complications; above symptoms may or may not be accompanied by emotional, behavioral, or cognitive conditions and complications. Staffed by designated addiction treatment, mental health, and general medical personnel who provide a range of services in a 24-hour treatment setting.
Level 4 medically managed intensive inpatient services: 24-hour nursing care and daily physician care for severe, unstable problems with acute intoxication, withdrawal potential, or both; biomedical conditions and complications; above symptoms may or may not be accompanied by emotional, behavioral, or cognitive conditions and complications. Counseling is available 16 hours a day to engage patient in treatment.
Source: GAO analysis of information from the Substance Abuse and Mental Health Services Administration and American Society of Addiction Medicine. | GAO-21-58
Note: The American Society of Addiction Medicine’s continuum of care for SUD treatment also has an early intervention level of care, level 0.5. The early intervention level of care (level 0.5) involves assessment and education for at-risk individuals who do not meet diagnostic criteria for SUDs. The National Survey of Substance Abuse Treatment Services (N-SSATS) does not ask facilities whether they provide this level of care.
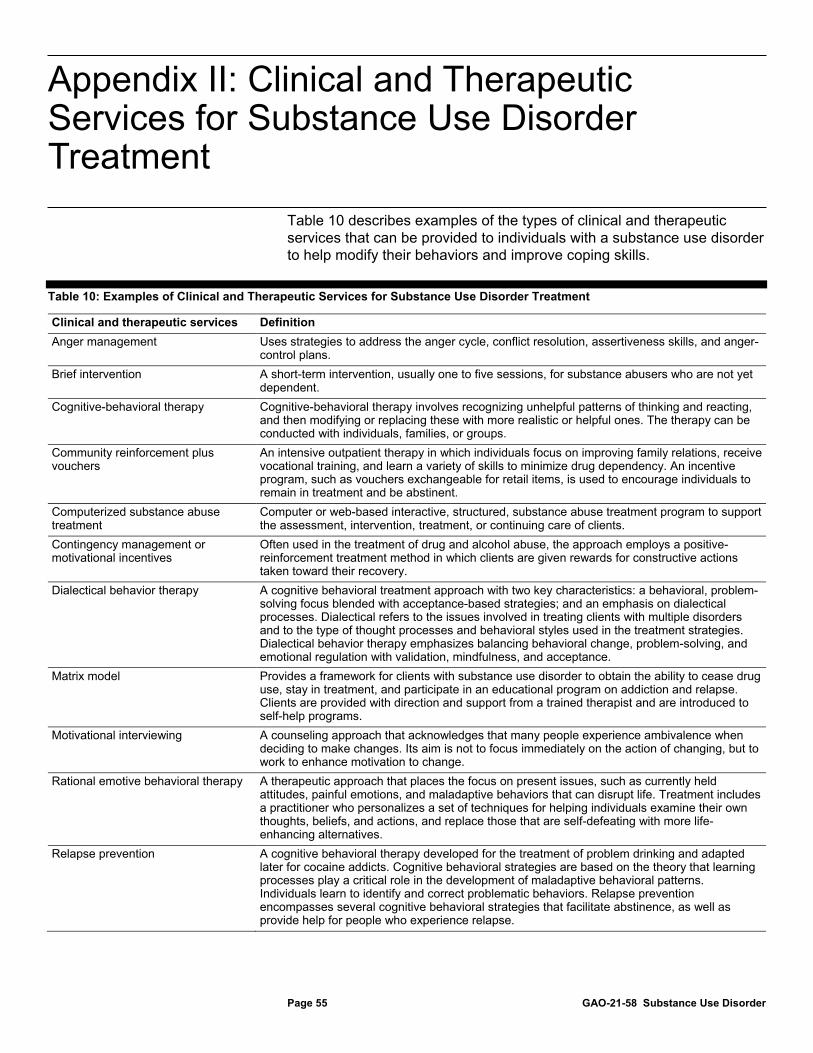
Appendix II: Clinical and Therapeutic Services for Substance Use Disorder Treatment
Page 55 GAO-21-58 Substance Use Disorder
Table 10 describes examples of the types of clinical and therapeutic services that can be provided to individuals with a substance use disorder to help modify their behaviors and improve coping skills.
Table 10: Examples of Clinical and Therapeutic Services for Substance Use Disorder Treatment
Clinical and therapeutic services Definition Anger management Uses strategies to address the anger cycle, conflict resolution, assertiveness skills, and anger-
control plans. Brief intervention A short-term intervention, usually one to five sessions, for substance abusers who are not yet
dependent. Cognitive-behavioral therapy Cognitive-behavioral therapy involves recognizing unhelpful patterns of thinking and reacting,
and then modifying or replacing these with more realistic or helpful ones. The therapy can be conducted with individuals, families, or groups.
Community reinforcement plus vouchers
An intensive outpatient therapy in which individuals focus on improving family relations, receive vocational training, and learn a variety of skills to minimize drug dependency. An incentive program, such as vouchers exchangeable for retail items, is used to encourage individuals to remain in treatment and be abstinent.
Computerized substance abuse treatment
Computer or web-based interactive, structured, substance abuse treatment program to support the assessment, intervention, treatment, or continuing care of clients.
Contingency management or motivational incentives
Often used in the treatment of drug and alcohol abuse, the approach employs a positive-reinforcement treatment method in which clients are given rewards for constructive actions taken toward their recovery.
Dialectical behavior therapy A cognitive behavioral treatment approach with two key characteristics: a behavioral, problem-solving focus blended with acceptance-based strategies; and an emphasis on dialectical processes. Dialectical refers to the issues involved in treating clients with multiple disorders and to the type of thought processes and behavioral styles used in the treatment strategies. Dialectical behavior therapy emphasizes balancing behavioral change, problem-solving, and emotional regulation with validation, mindfulness, and acceptance.
Matrix model Provides a framework for clients with substance use disorder to obtain the ability to cease drug use, stay in treatment, and participate in an educational program on addiction and relapse. Clients are provided with direction and support from a trained therapist and are introduced to self-help programs.
Motivational interviewing A counseling approach that acknowledges that many people experience ambivalence when deciding to make changes. Its aim is not to focus immediately on the action of changing, but to work to enhance motivation to change.
Rational emotive behavioral therapy A therapeutic approach that places the focus on present issues, such as currently held attitudes, painful emotions, and maladaptive behaviors that can disrupt life. Treatment includes a practitioner who personalizes a set of techniques for helping individuals examine their own thoughts, beliefs, and actions, and replace those that are self-defeating with more life-enhancing alternatives.
Relapse prevention A cognitive behavioral therapy developed for the treatment of problem drinking and adapted later for cocaine addicts. Cognitive behavioral strategies are based on the theory that learning processes play a critical role in the development of maladaptive behavioral patterns. Individuals learn to identify and correct problematic behaviors. Relapse prevention encompasses several cognitive behavioral strategies that facilitate abstinence, as well as provide help for people who experience relapse.
Appendix II: Clinical and Therapeutic Services for Substance Use Disorder Treatment

Appendix II: Clinical and Therapeutic Services for Substance Use Disorder Treatment
Page 56 GAO-21-58 Substance Use Disorder
Clinical and therapeutic services Definition Substance abuse counseling A short-term treatment that has been generalized for a variety of disorders, including opiate
drug dependence and cocaine abuse. The therapy includes supportive techniques, which encourage the client to discuss personal experiences, and expressive techniques, which enable the client to work through interpersonal relationship issues and gain greater self-understanding.
Trauma-related counseling Cognitive behavior techniques adapted for clients suffering from post-traumatic stress disorder and other effects of abuse and trauma.
Twelve-step facilitation A support group made up of people who share the same addiction. The 12 steps refer to the steps recovering addicts must take to overcome their addiction as part of this program. Attendees at group meetings share their experiences, challenges, successes, and failures, and provide peer support for each other.
Source: GAO analysis of information from the Substance Abuse and Mental Health Services Administration. | GAO-21-58
Note: This table is intended to describe various types of clinical and therapeutic services for the treatment of substance use disorders. It is not an exhaustive list of all such services.

Appendix III: Substance Abuse Prevention and Treatment Block Grant Program Treatment and Recovery Support Expenditures
Page 57 GAO-21-58 Substance Use Disorder
Tables 11 and 12 describe the amount of Substance Abuse Prevention and Treatment Block Grant (SABG) program funding spent nationwide on treatment and recovery support services. Specifically, the tables describe the amount spent from states’ fiscal years 2010 through 2019, as well as by state and the District of Columbia for fiscal year 2019, the most recent year data was available at the time of our review.
Table 11: Nationwide Substance Abuse Prevention and Treatment Block Grant Program Expenditures on Treatment and Recovery Support Services, Fiscal Years 2010-2019
State fiscal year in which funding was spent
Amount spent on treatment and recovery support
services (dollars in billions)a Total expenditures (dollars in billions)
Percentage spent on treatment and recovery
support services 2010 1.19 1.68 71 2011 1.19 1.67 71 2012 1.17 1.66 71 2013 1.18 1.66 71 2014 1.13 1.59 71 2015 1.11 1.58 70 2016 1.08 1.54 70 2017 1.04 1.48 70 2018 1.36 1.85 73 2019 1.26 1.75 72 Total 11.72 16.47 71
Source: GAO analysis of the Substance Abuse and Mental Health Services Administration data. | GAO-21-58
Notes: Data includes 50 states and the District of Columbia. aTreatment services generally include diagnostic services to determine the nature and extent of a condition, clinical and therapeutic treatment services, and may include medications. Recovery support services include services provided in support of treatment and ongoing support after treatment, such as specialized housing, peer support, and employment services. These expenditures exclude dollars spent on primary prevention, such as education and mentoring designed to reduce the risk of substance abuse by individuals, and states’ administrative costs to operate and oversee the program, such as quality assurance and research and evaluation.
Appendix III: Substance Abuse Prevention and Treatment Block Grant Program Treatment and Recovery Support Expenditures

Appendix III: Substance Abuse Prevention and Treatment Block Grant Program Treatment and Recovery Support Expenditures
Page 58 GAO-21-58 Substance Use Disorder
Table 12: Total Substance Abuse Prevention and Treatment Block Grant Program Expenditures and Proportion Spent by State on Treatment and Recovery Support Services, Fiscal Year 2019
State Total expenditures
(in dollars) Percentage spent on treatment and recovery support services
New Mexico 7,926,062 81 Alaska 5,889,694 81 Oregon 15,545,972 80 Hawaii 8,954,312 80 North Carolina 46,564,680 79 South Dakota 5,878,970 79 Ohio 65,021,777 78 Arizona 43,568,212 78 Oklahoma 15,771,352 78 Alabama 21,097,572 78 Kentucky 20,378,612 78 Maine 6,967,796 78 Idaho 8,625,542 78 Arkansas 16,745,585 77 California 295,019,438 76 Missouri 29,526,049 76 Wyoming 3,891,143 76 Wisconsin 26,802,186 76 Virginia 41,467,614 76 Mississippi 13,533,727 76 District of Columbia 8,344,519 75 Indiana 29,560,896 74 West Virginia 8,107,249 74 Nebraska 7,336,095 73 Kansas 12,310,310 73 New Hampshire 8,742,074 73 Massachusetts 39,845,084 72 Colorado 26,826,019 72 Minnesota 23,716,207 72 Pennsylvania 52,481,490 72 South Carolina 23,537,157 72 Washington 38,395,277 72 Iowa 12,087,088 71 Georgia 59,367,894 71

Appendix III: Substance Abuse Prevention and Treatment Block Grant Program Treatment and Recovery Support Expenditures
Page 59 GAO-21-58 Substance Use Disorder
State Total expenditures
(in dollars) Percentage spent on treatment and recovery support services
North Dakota 7,348,697 71 Michigan 56,058,757 71 Louisiana 21,964,482 70 Connecticut 17,644,672 70 Florida 109,678,642 70 Illinois 56,457,526 68 Maryland 34,079,985 68 Tennessee 31,684,072 68 New Jersey 46,834,920 68 Nevada 16,837,571 67 New York 115,621,320 67 Vermont 6,658,285 65 Texas 137,592,961 65 Utah 13,564,148 62 Delaware 12,454,846 62 Montana 6,967,796 47 Rhode Island 6,359,032 46
Source: GAO analysis of the Substance Abuse and Mental Health Services Administration data. | GAO-21-58
Note: Treatment services generally include diagnostic services to determine the nature and extent of a condition, clinical and therapeutic treatment services, and may include medications. Recovery support services include services provided in support of treatment and ongoing support after treatment, such as specialized housing, peer support, and employment services. These expenditures exclude dollars spent on primary prevention, such as education and mentoring designed to reduce the risk of substance abuse by individuals, and states’ administrative costs to operate and oversee the program, such as quality assurance and research and evaluation.

Appendix IV: State Opioid Response Grant Program Awards, Spending, and Amounts Remaining Unspent
Page 60 GAO-21-58 Substance Use Disorder
Table 13 describes the amount of State Opioid Response grant funding awarded to each state and the District of Columbia, and the amount each state spent and had remaining unspent, as of August 2020, the most recent data available at the time of our analysis.
Table 13: Total State Opioid Response Grant Program Award, Amount Spent, and Percentage Remaining Unspent by State, as of August 2020
State
Fiscal years 2018 and 2019 award with
supplement (in dollars) Amount spent
(in dollars) Percentage
remaining unspent Alabama 34,662,711 26,375,803 24 Alaska 10,158,170 5,480,791 46 Arizona 51,119,182 20,822,508 59 Arkansas 13,042,210 7,608,975 42 California 176,140,210 139,498,810 21 Colorado 38,064,939 21,025,275 45 Connecticut 28,069,136 22,492,983 20 Delaware 31,763,538 20,016,854 37 District of Columbia 53,281,759 11,089,027 79 Florida 126,243,378 73,796,592 42 Georgia 50,141,736 17,100,141 66 Hawaii 10,180,426 2,953,499 71 Idaho 10,368,358 4,132,175 60 Illinois 73,111,196 24,623,526 66 Indiana 45,767,296 18,680,099 59 Iowa 11,142,259 4,533,456 59 Kansas 10,207,255 2,776,732 73 Kentucky 79,387,128 39,325,817 50 Louisiana 29,608,038 11,770,581 60 Maine 11,154,294 6,474,957 42 Maryland 83,653,244 32,328,798 61 Massachusetts 90,488,566 45,652,365 50 Michigan 70,400,720 22,807,589 68 Minnesota 22,372,425 8,847,207 60 Mississippi 19,255,904 8,746,138 55 Missouri 46,314,104 35,836,830 23 Montana 10,164,593 3,067,785 70 Nebraska 9,060,914 3,706,047 59 Nevada 18,207,814 4,734,690 74
Appendix IV: State Opioid Response Grant Program Awards, Spending, and Amounts Remaining Unspent
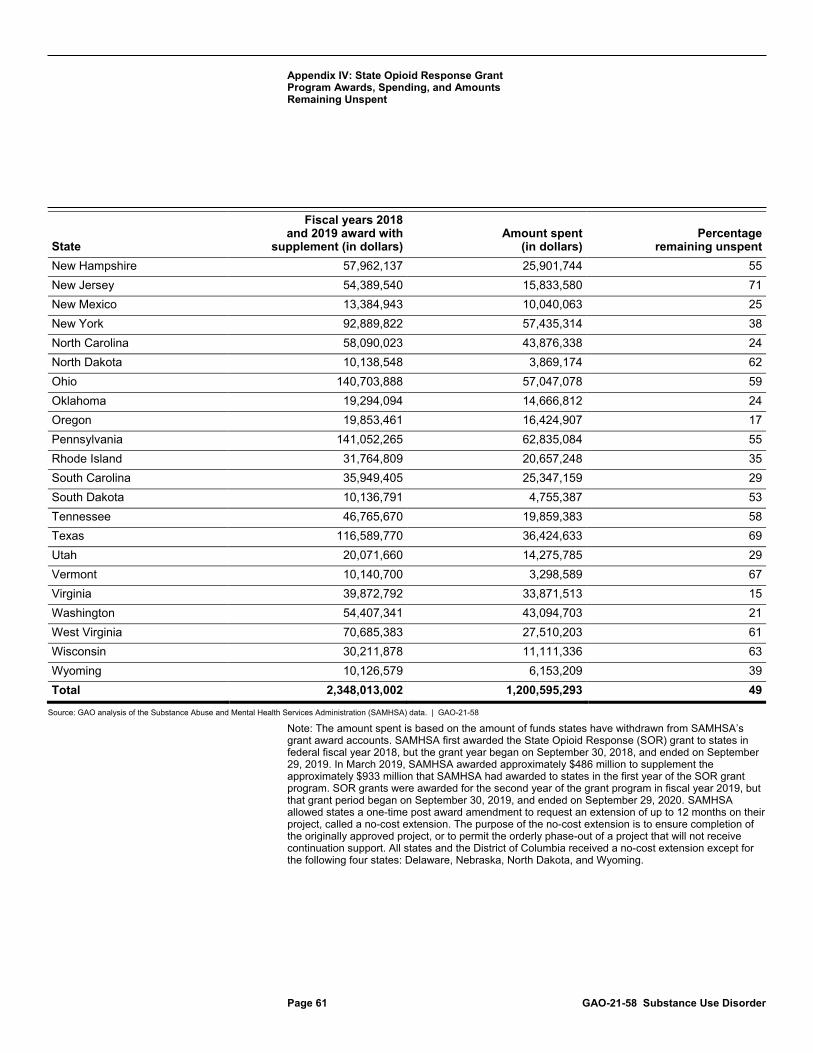
Appendix IV: State Opioid Response Grant Program Awards, Spending, and Amounts Remaining Unspent
Page 61 GAO-21-58 Substance Use Disorder
State
Fiscal years 2018 and 2019 award with
supplement (in dollars) Amount spent
(in dollars) Percentage
remaining unspent New Hampshire 57,962,137 25,901,744 55 New Jersey 54,389,540 15,833,580 71 New Mexico 13,384,943 10,040,063 25 New York 92,889,822 57,435,314 38 North Carolina 58,090,023 43,876,338 24 North Dakota 10,138,548 3,869,174 62 Ohio 140,703,888 57,047,078 59 Oklahoma 19,294,094 14,666,812 24 Oregon 19,853,461 16,424,907 17 Pennsylvania 141,052,265 62,835,084 55 Rhode Island 31,764,809 20,657,248 35 South Carolina 35,949,405 25,347,159 29 South Dakota 10,136,791 4,755,387 53 Tennessee 46,765,670 19,859,383 58 Texas 116,589,770 36,424,633 69 Utah 20,071,660 14,275,785 29 Vermont 10,140,700 3,298,589 67 Virginia 39,872,792 33,871,513 15 Washington 54,407,341 43,094,703 21 West Virginia 70,685,383 27,510,203 61 Wisconsin 30,211,878 11,111,336 63 Wyoming 10,126,579 6,153,209 39 Total 2,348,013,002 1,200,595,293 49
Source: GAO analysis of the Substance Abuse and Mental Health Services Administration (SAMHSA) data. | GAO-21-58
Note: The amount spent is based on the amount of funds states have withdrawn from SAMHSA’s grant award accounts. SAMHSA first awarded the State Opioid Response (SOR) grant to states in federal fiscal year 2018, but the grant year began on September 30, 2018, and ended on September 29, 2019. In March 2019, SAMHSA awarded approximately $486 million to supplement the approximately $933 million that SAMHSA had awarded to states in the first year of the SOR grant program. SOR grants were awarded for the second year of the grant program in fiscal year 2019, but that grant period began on September 30, 2019, and ended on September 29, 2020. SAMHSA allowed states a one-time post award amendment to request an extension of up to 12 months on their project, called a no-cost extension. The purpose of the no-cost extension is to ensure completion of the originally approved project, or to permit the orderly phase-out of a project that will not receive continuation support. All states and the District of Columbia received a no-cost extension except for the following four states: Delaware, Nebraska, North Dakota, and Wyoming.

Appendix V: Summary of Selected Findings from Evaluations of the SABG and STR Grant Programs
Page 62 GAO-21-58 Substance Use Disorder
Table 14 describes external evaluations of the Substance Abuse and Mental Health Services Administration’s Substance Abuse Prevention and Treatment Block Grant (SABG) and State Targeted Response to the Opioid Crisis (STR) grant programs, and the evaluations’ findings about the grant programs’ effects on access to substance use disorder treatment and recovery support services.
Table 14: External Evaluation Reports and Selected Findings Related to Assessing Access to Treatment and Recovery Support Services for the SABG and STR Grant Programs
Evaluator Year published Title
Selected findings
Substance Abuse Prevention and Treatment Block Grant (SABG) program Contractor 2009 Independent Evaluation
of the SABG Program: Final Evaluation Report
The evaluation resulted in six key findings, including: The program improved state substance use disorder prevention and treatment system infrastructure and capacity. The program’s funding, requirements, and federal guidance were leveraged by states to yield outcomes that were beyond what was intended or expected to sustain and improve state substance abuse prevention and treatment systems. The program contributed to state collaborations with other agencies and stakeholders.
State Targeted Response to the Opioid Crisis (STR) grant programa Department of Health and Human Services – Office of the Inspector General
2020 States’ Use of Grant Funding for a Targeted Response to the Opioid Crisis
Analysis of grant program data found: Almost a third of the total nationwide STR grant program funding remained unspent after 2 years. Across all states, 65 percent of STR grant program spending was devoted to improving access to treatment in general for opioid use disorder, and as a result, states reported that the number of patients receiving any type of opioid use disorder treatment increased substantially during the grant period. SAMHSA does not collect sufficient data to assess how successful the STR grant program was at achieving its goal of expanded access to MAT.
Appendix V: Summary of Selected Findings from Evaluations of the SABG and STR Grant Programs

Appendix V: Summary of Selected Findings from Evaluations of the SABG and STR Grant Programs
Page 63 GAO-21-58 Substance Use Disorder
Evaluator Year published Title
Selected findings
Contractor 2019 State Targeted Response to the Opioid Crisis (Opioid STR) Grant Program Formative and Process Evaluation Seventh Quarterly Reportb
Surveys of state and territory officials found: STR grant program funding was used by 47 states and territories to support peer recovery support services. Seven to 10 states and territories (depending on the medication) reported using STR grant program funding to newly implement medication-assisted treatment (MAT) services. Thirty to 38 states and territories (depending on the medication) reported using the STR grant program funding to expand or enhance MAT services already available before the grant. States and territories also used STR grant program funding to develop, expand, or enhance treatment services that address problems that commonly arise among people with opioid use disorder, such as co-occurring mental health problems; and recovery support services, such as transportation and housing.
Source: GAO analysis. | GAO-21-58
Notes: No external evaluations of the State Opioid Response grant program have been conducted, according to the Substance Abuse and Mental Health Services Administration (SAMHSA) officials. aIn 2015, the Department of Health and Human Services’ Office of the Inspector General issued a memorandum report evaluating SABG program grantee compliance with SAMHSA’s National Outcomes Measures required reporting. In 2019, the Department of Health and Human Services’ Office of the Inspector General also released an assessment of SAMHSA’s award process for the STR grant program. Neither of the two reports evaluated the impacts of the programs on access. See the Department of Health and Human Services, Office of the Inspector General, SAMHSA Has Improved Outcome Reporting for the Substance Abuse Prevention and Treatment Block Grant, OEI-04-12-00160 (Washington, D.C.: 2015); and the Department of Health and Human Services, Office of the Inspector General, The Substance Abuse and Mental Health Services Administration Followed Grant Regulations and Program-Specific Requirements When Awarding State Targeted Response to the Opioid Crisis Grants, A-03-17-03302 (Washington, D.C.: 2019). bSAMHSA has since terminated the evaluation contract and a final report will not be produced, according to SAMHSA officials.

Appendix VI: Comments from the Department of Health and Human Services
Page 64 GAO-21-58 Substance Use Disorder
Appendix VI: Comments from the Department of Health and Human Services

Appendix VI: Comments from the Department of Health and Human Services
Page 65 GAO-21-58 Substance Use Disorder

Appendix VII: GAO Contacts and Staff Acknowledgments
Page 66 GAO-21-58 Substance Use Disorder
Alyssa M. Hundrup at (202) 512-7114 or [email protected]
In addition to the contacts named above, Carolyn L. Yocom (Director), Karen Doran (Assistant Director), Katie Mack (Analyst-in-Charge), Robert Dougherty, Cynthia Khan, Drew Long, Elise Pressma, and Matthew W. Rowen made key contributions to this report. Also contributing were Leia Dickerson, Vikki Porter, Jennifer Rudisill, and Emily Wilson Schwark.
Appendix VII: GAO Contacts and Staff Acknowledgments
GAO Contacts
Staff Acknowledgments

Related GAO Products
Page 67 GAO-21-58 Substance Use Disorder
Substance Use Disorder: Medicaid Coverage of Peer Support Services for Adults. GAO-20-616. Washington, D.C.: August 6, 2020.
Opioid Use Disorder: Treatment with Injectable and Implantable Buprenorphine. GAO-20-617. Washington, D.C.: August 4, 2020.
Drug Misuse: Sustained National Efforts Are Necessary for Prevention, Response, and Recovery. GAO-20-474. Washington, D.C.: March 26, 2020.
Medicaid: States’ Changes to Payment Rates for Substance Use Disorder Services. GAO-20-260. Washington, D.C.: January 30, 2020.
Opioid Use Disorder: Barriers to Medicaid Beneficiaries’ Access to Treatment Medications. GAO-20-233. Washington, D.C.: January 24, 2020.
Drug Control: The Office of National Drug Control Policy Should Develop Key Planning Elements to Meet Statutory Requirements. GAO-20-124. Washington, D.C.: December 18, 2019.
Mental Health and Substance Use: State and Federal Oversight of Compliance with Parity Requirements Varies. GAO-20-150. Washington, D.C.: December 13, 2019.
Veterans Health Care: Services for Substance Use Disorders, and Efforts to Address Access Issues in Rural Areas. GAO-20-35. Washington, D.C.: December 2, 2019.
Substance Use Disorder: Prevalence of Recovery Homes, and Selected States’ Investigations and Oversight. GAO-20-214T. Washington, D.C.: October 24, 2019.
Medicaid: Opioid Use Disorder Services for Pregnant and Postpartum Women, and Children. GAO-20-40. Washington, D.C.: October 24, 2019.
Drug Policy: Assessing Treatment Expansion Efforts and Drug Control Strategies and Programs. GAO-19-535T. Washington, D.C.: May 9, 2019.
Drug Policy: Preliminary Observations on the 2019 National Drug Control Strategy. GAO-19-370T. Washington, D.C.: March 7, 2019.
Related GAO Products

Related GAO Products
Page 68 GAO-21-58 Substance Use Disorder
Behavioral Health: Research on Health Care Costs of Untreated Conditions is Limited. GAO-19-274. Washington, D.C.: February 28, 2019.
Opioid Use Disorders: HHS Needs Measures to Assess the Effectiveness of Efforts to Expand Access to Medication-Assisted Treatment. GAO-18-44. Washington, D.C.: October 31, 2017.
Opioid Addiction: Laws, Regulations, and Other Factors Can Affect Medication-Assisted Treatment Access. GAO-16-833. Washington, D.C.: September 27, 2016.
(103666)
The Government Accountability Office, the audit, evaluation, and investigative arm of Congress, exists to support Congress in meeting its constitutional responsibilities and to help improve the performance and accountability of the federal government for the American people. GAO examines the use of public funds; evaluates federal programs and policies; and provides analyses, recommendations, and other assistance to help Congress make informed oversight, policy, and funding decisions. GAO’s commitment to good government is reflected in its core values of accountability, integrity, and reliability.
The fastest and easiest way to obtain copies of GAO documents at no cost is through our website. Each weekday afternoon, GAO posts on its website newly released reports, testimony, and correspondence. You can also subscribe to GAO’s email updates to receive notification of newly posted products.
The price of each GAO publication reflects GAO’s actual cost of production and distribution and depends on the number of pages in the publication and whether the publication is printed in color or black and white. Pricing and ordering information is posted on GAO’s website, https://www.gao.gov/ordering.htm.
Place orders by calling (202) 512-6000, toll free (866) 801-7077, or TDD (202) 512-2537.
Orders may be paid for using American Express, Discover Card, MasterCard, Visa, check, or money order. Call for additional information.
Connect with GAO on Facebook, Flickr, Twitter, and YouTube. Subscribe to our RSS Feeds or Email Updates. Listen to our Podcasts. Visit GAO on the web at https://www.gao.gov.
Contact FraudNet:
Website: https://www.gao.gov/fraudnet/fraudnet.htm
Automated answering system: (800) 424-5454 or (202) 512-7700
Orice Williams Brown, Managing Director, [email protected], (202) 512-4400, U.S. Government Accountability Office, 441 G Street NW, Room 7125, Washington, DC 20548
Chuck Young, Managing Director, [email protected], (202) 512-4800 U.S. Government Accountability Office, 441 G Street NW, Room 7149 Washington, DC 20548
Stephen J. Sanford, Acting Managing Director, [email protected], (202) 512-4707 U.S. Government Accountability Office, 441 G Street NW, Room 7814, Washington, DC 20548
GAO’s Mission
Obtaining Copies of GAO Reports and Testimony Order by Phone
Connect with GAO
To Report Fraud, Waste, and Abuse in Federal Programs
Congressional Relations
Public Affairs
Strategic Planning and External Liaison
Please Print on Recycled Paper.