GAO-21-380, PRESCRIPTION DRUGS: Medicare Spending on …
45
PRESCRIPTION DRUGS Medicare Spending on Drugs with Direct-to-Consumer Advertising Report to Committee on the Judiciary, U.S. Senate May 2021 GAO-21-380 United States Government Accountability Office
Transcript of GAO-21-380, PRESCRIPTION DRUGS: Medicare Spending on …
PRESCRIPTION DRUGS
Medicare Spending on Drugs with Direct-to-Consumer Advertising
Report to Committee on the Judiciary, U.S. Senate
May 2021
GAO-21-380
United States Government Accountability Office

United States Government Accountability Office
Highlights of GAO-21-380, a report to Committee on the Judiciary, U.S. Senate
May 2021
PRESCRIPTION DRUGS Medicare Spending on Drugs with Direct-to-Consumer Advertising
What GAO Found Drug manufacturers spent $17.8 billion on direct-to-consumer advertising (DTCA) for 553 drugs from 2016 through 2018, and spending was relatively stable at about $6 billion each year. Almost half of this spending was for three therapeutic categories of drugs that treat chronic medical conditions, such as arthritis, diabetes, and depression. GAO also found that nearly all DTCA spending was on brand-name drugs, with about two-thirds concentrated on 39 drugs, about half of which entered the market from 2014 through 2017.
Medicare Parts B and D and beneficiaries spent $560 billion on drugs from 2016 through 2018, $324 billion of which was spent on advertised drugs. Of the 553 advertised drugs, GAO found Medicare Parts B and D spending for 104 and 463 drugs, respectively. Among the drugs with the highest Medicare spending, some also had the highest DTCA spending. Specifically, among the top 10 drugs with the highest Medicare Parts B or D expenditures, four were also among the top 10 drugs in advertising spending in 2018: Eliquis (blood thinner), Humira (arthritis), Keytruda (cancer), and Lyrica (diabetic pain).
Medicare Spending on Advertised Drugs, 2016 - 2018
GAO’s review of four advertised drugs found that drug manufacturers changed their DTCA spending during key events, such as increasing spending when a drug was approved to treat additional conditions or decreasing spending following the approval of generic versions. GAO also found that DTCA may have contributed to increases in Medicare beneficiary use and spending among four selected drugs from 2010 through 2018. However, other factors likely contributed to a drug’s Medicare beneficiary use and spending, making it difficult to isolate the relationship between drug advertising, use and spending. For example, GAO’s review of four selected drugs showed that increases in unit prices were a factor, while stakeholders GAO interviewed cited other contributing factors such as doctors’ prescribing decisions and manufacturers’ drug promotions directed to doctors.
View GAO-21-380. For more information, contact John Dicken at (202) 512-7114 or [email protected].
Why GAO Did This Study Drug manufacturers use advertising on television and in other media to promote the use of their drugs to consumers and to encourage them to visit their doctors for more information. From 2016 through 2018, the Medicare program and beneficiaries spent $560 billion on drugs, and spending is projected to increase with the use of newer, more expensive drugs and an increase in beneficiaries.
GAO was asked to examine DTCA and Medicare spending on advertised drugs. This report examines (1) drug manufacturer spending on DTCA; (2) Medicare spending on advertised drugs; and (3) changes in DTCA spending and Medicare use and spending for selected drugs.
GAO analyzed DTCA spending data from Nielsen Media, and Medicare Parts B and D Drug Spending Dashboard data, from 2016 through 2018 (the most recent available data at the time of GAO’s analysis). GAO also analyzed DTCA spending and Medicare data for a non-generalizable selection of four advertised drugs over a longer period—from 2010 through 2018. The four drugs were selected to reflect differences in DTCA and Medicare spending, beneficiary use, and medical conditions treated. GAO also interviewed or obtained information from officials representing 14 stakeholder groups (including research, trade, and physician organizations; and drug manufacturers of the four selected drugs) about DTCA spending and drug use and spending.
The Department of Health and Human Services provided technical comments on a draft of this report, which GAO incorporated as appropriate.

Page i GAO-21-380 Drug Advertising
Letter 1
Background 7 Manufacturers Spent About $6 Billion Each Year from 2016
through 2018 on Direct-to-Consumer Advertising, with Spending Concentrated on a Small Portion of Drugs 9
More than Half of Medicare Part B and Part D Spending Was for Advertised Drugs from 2016 through 2018 15
Changes in Advertising Spending Were Often Related to Key Drug Events and May Have Contributed to Increases in Beneficiary Use and Spending for Four Selected Drugs 18
Agency Comments 21
Appendix I Drugs with Highest Medicare and Direct-to-Consumer Advertising Spending 23
Appendix II Spending on Direct-to-Consumer Advertising, Medicare Beneficiary Use, and Medicare Spending for Eliquis 24
Appendix III Spending on Direct-to-Consumer Advertising, Medicare Beneficiary Use, and Medicare Spending for Namenda XR 27
Appendix IV Spending on Direct-to-Consumer Advertising, Medicare Beneficiary Use, and Medicare Spending for Neulasta 31
Appendix V Spending on Direct-to-Consumer Advertising, Medicare Beneficiary Use, and Medicare Spending for Zytiga 35
Appendix VI GAO Contact and Staff Acknowledgments 39
Contents
Page ii GAO-21-380 Drug Advertising
Tables
Table 1: Drug Manufacturer Spending on Direct-to-Consumer Advertising and Characteristics of Advertised Drugs, 2016 through 2018 10
Table 2: Medicare Part B and Part D Spending on Advertised Drugs, 2016 through 2018 16
Table 3: Number of Drugs with High Medicare Spending and High Direct-to-Consumer Advertising (DTCA) Spending, 2016 through 2018 17
Table 4: Top 25 Drugs with Highest Medicare Part D and Part B Spending, and Top 25 Drugs with Highest Direct-to-Consumer Advertising Spending, 2018 23
Table 5: Direct-to-Consumer Advertising Spending and Medicare Part D Use and Spending for Eliquis, 2013 through 2018 26
Table 6: Direct-to-Consumer Advertising Spending and Medicare Part D Use and Spending for Namenda XR, 2013 through 2018 30
Table 7: Direct-to-Consumer Advertising Spending and Medicare Part B Use and Spending for Neulasta, 2010 through 2018 34
Table 8: Direct-to-Consumer Advertising Spending and Medicare Part D Use and Spending for Zytiga, 2011 through 2018 38
Figures
Figure 1: Direct-to-Consumer Advertising Spending by Media Type, 2016 through 2018 13
Figure 2: Direct-to-Consumer Advertising Spending and Medicare Part D Use and Spending for Eliquis, 2013 through 2018 25
Figure 3: Direct-to-Consumer Advertising Spending and Medicare Part D Use and Spending for Namenda XR, 2013 through 2018 29
Figure 4: Direct-to-Consumer Advertising Spending and Medicare Part B Use and Spending for Neulasta, 2010 through 2018 33
Figure 5: Direct-to-Consumer Advertising Spending and Medicare Part D Use and Spending for Zytiga, 2011 through 2018 37

Page iii GAO-21-380 Drug Advertising
Abbreviations CMS Centers for Medicare & Medicaid Services DTCA Direct-to-consumer advertising FDA Food and Drug Administration HCPCS Healthcare Common Procedure Coding System
This is a work of the U.S. government and is not subject to copyright protection in the United States. The published product may be reproduced and distributed in its entirety without further permission from GAO. However, because this work may contain copyrighted images or other material, permission from the copyright holder may be necessary if you wish to reproduce this material separately.

Page 1 GAO-21-380 Drug Advertising
441 G St. N.W. Washington, DC 20548
May 18, 2021
The Honorable Richard J. Durbin Chair The Honorable Charles E. Grassley Ranking Member Committee on the Judiciary United States Senate
In 2018, the Medicare program and its beneficiaries spent more than $200 billion on prescription drugs and biologics.1 This spending has increased significantly over time, more than doubling from about $86 billion in 2009.2 Further, spending is expected to continue to grow, in part, because of the use of newer, more expensive drugs and biologics as well as an increase in the Medicare population resulting from the aging population.3
Some health care provider and consumer organizations have raised questions about whether a significant increase in consumer advertising by drug manufacturers may be contributing to the overall increase in spending for prescription drugs, including in the Medicare program. This consumer advertising, also referred to as “direct-to-consumer advertising” (DTCA), targets consumers through television, the internet and other media. A study of this advertising found that from 1997 to 2016, total DTCA spending increased from approximately $1 billion to $6 billion as manufacturers purchased more television advertisements, which tend to
1Medicare Payment Advisory Commission, A Data Book: Health Care Spending and the Medicare Program (Washington, D.C.: July 2020).
Drugs are chemically synthesized, while biological products (which we refer to in this report as biologics) are derived from living sources, such as humans, animals, and microorganisms. Biologics include materials, such as viruses, therapeutic sera, toxins, antitoxins, vaccines, or analogous products to prevent, treat, or cure human diseases or injuries.
For the purpose of this report, we use the term “drugs” to refer to both drugs and biologics, except when otherwise specified.
2Medicare Payment Advisory Commission report, July 2020.
3Medicare Payment Advisory Commission, Report to the Congress: Medicare Payment Policy (Washington, D.C.: March 15, 2019).
Letter
Page 2 GAO-21-380 Drug Advertising
cost more than other media forms. As a result, consumers’ exposure to drug advertisements on television significantly increased during this time.4
Drug manufacturers have stated that drug advertisements can educate consumers about undiagnosed medical conditions and can help them obtain needed treatment earlier, which in turn, may reduce spending on other types of medical care. In addition, drug advertisements may encourage compliance in taking medications among patients, according to drug manufacturers. In contrast, some consumer and provider organizations have stated that the increase in drug manufacturers’ consumer advertising has likely contributed to the growth in prescription drug spending because of inappropriate drug use or unnecessary costs. In 2015, for example, the American Medical Association called for a ban on DTCA given concerns that it may inflate consumer demand for newer and more expensive brand drugs, even when such drugs may not be appropriate or there are less costly alternatives available, such as generics.5
You asked us to provide information on recent trends in DTCA spending and in Medicare spending on prescription drugs, including Medicare spending on drugs that were advertised to Medicare beneficiaries and other consumers. This report describes:
1. drug manufacturer spending on DTCA for prescription drugs from 2016 through 2018;
2. Medicare spending on prescription drugs that were the subject of DTCA from 2016 through 2018; and
3. changes in drug manufacturer DTCA spending, Medicare spending, and Medicare use for selected drugs from 2010 through 2018.
To describe drug manufacturer spending on DTCA for prescription drugs from 2016 through 2018, we analyzed advertising expenditure data from Nielsen Media, a company that monitors media in national and local markets for advertisements. We analyzed DTCA expenditures for prescription drugs that were advertised in the United States from 2016 4L.M. Schwartz and S. Woloshin, “Medical Marketing in the United States, 1997-2016,” Journal of the American Medical Association, vol. 321, no. 1 (2019).
5A generic drug is a chemically synthesized drug equivalent to an approved brand-name drug in active ingredient, dosage form, safety, strength, route of administration, quality, performance characteristics, and intended use.

Page 3 GAO-21-380 Drug Advertising
through 2018, which was the most recently available data at the time of our analysis.6 Specifically, we analyzed the total number of advertised drugs and expenditures for each drug, as well as total expenditures aggregated across all advertised drugs, for each year. We also ranked the advertised drugs by total expenditures to identify drugs with the highest spending that comprised the majority of DTCA spending in each year. We analyzed total DTCA expenditures aggregated across all advertised drugs according to the media type—network and cable television, magazines, digital and other media—in which they appeared, for each year.7 In addition, we described the characteristics of advertised drugs according to whether they were a drug or biologic, a brand or generic (or biosimilar, for biologics), and according to therapeutic class.8 For those drugs with the highest spending—that comprised the majority of DTCA spending—we also collected information from the Food and Drug Administration (FDA), such as the year FDA approved the drug for marketing and when generic (or biosimilar, for biologics) competitors were approved.9 To assess the reliability of the DTCA expenditure data, we compared expenditures against published expenditures for advertised drugs, reviewed methodology documentation, and interviewed Nielsen
6Nielsen Media obtains DTCA expenditures from various sources including the media sites it monitors (e.g., television networks) and other sources (e.g., advertising research companies).
7Nielsen Media defined digital advertisements as those that appear on approximately 5,000 U.S. websites and that can be viewed on desktop computers, tablets, or mobile devices. They include display advertisements with text and images as well as video advertisements that automatically play before the content the user has selected. Nielsen Media officials told us that at the time of our analysis, they did not monitor digital advertisements that appeared on social media websites. Thus, it is likely that our estimate of digital DTCA spending is an underestimate.
8A biosimilar is a biological product that is highly similar to an FDA-approved biological product and has no clinically meaningful differences in terms of safety and effectiveness.
We used FDA’s database of approved drug products, Drugs@FDA, and other FDA sources to classify advertised drugs as drugs or biologics and the IBM Micromedex RED BOOK database to classify drugs as brand or generic and to assign therapeutic class. To classify biologics as biosimilars, we used FDA sources, including the Purple Book, a database with information on licensed biological products.
9We used Drugs@FDA to identify the year FDA approved a drug. In addition, we used FDA’s Orange Book, a database of approved drug products with therapeutic equivalence evaluations, to identify generic competitors, and FDA’s Purple Book, and other FDA sources, to identify biosimilar competitors.

Page 4 GAO-21-380 Drug Advertising
Media officials. We determined that these data were sufficiently reliable for the purposes of our reporting objective.
To complement our data analysis, we interviewed a non-generalizable selection of 14 stakeholders about drug manufacturers’ use of, and spending on, DTCA. These stakeholders included representatives from six drug manufacturers, two trade groups, one advertising agency, one health care provider organization, and four academic researchers. We selected six drug manufacturers that advertised their drugs to consumers (including four manufacturers of the drugs we selected to further analyze DTCA and Medicare spending over time, as described below). We selected two trade groups that broadly represented the views of drug manufacturers, an organization representing family physicians, an advertising agency that is active in drug marketing and four researchers that had expertise in research in drug advertising and drug use.
To describe Medicare spending for prescription drugs that were the subject of direct-to-consumer advertising from 2016 through 2018, we used publicly available expenditure data from the Medicare Part B and Part D Drug Spending Dashboards.10 These data are maintained by the Centers for Medicare & Medicaid Services (CMS) and were the most recently available Medicare prescription drug data at the time of our analysis.11
We focused on Medicare spending for outpatient and retail prescription drugs that are covered under Medicare Parts B and D.12 We identified the drugs that were the subject of DTCA (as described above), and then we compared the total amounts Medicare Parts B and D spent on these 10Medicare Part D is an optional outpatient prescription drug benefit offered by Medicare—the federally financed health insurance program for persons aged 65 and over, individuals under age 65 with certain disabilities, and individuals with end-stage renal disease. Medicare Part B, which is voluntary, also provides coverage for drugs that are typically administered by a doctor. Most beneficiaries choose to enroll in Medicare Part B.
11The Medicare Parts B and D Drug Spending Dashboards are interactive, web-based tools that present spending, use and price information for Medicare Part B and Part D drugs. Not all spending data for Medicare Parts B and D were included in the data. For example, drugs with fewer than 11 Medicare claims in 2018 were excluded from their respective data. In addition, the Medicare Part B Drug Spending Dashboard excludes drug spending among beneficiaries in the Medicare Advantage program (which represented approximately 30 percent of the Medicare population at the time of our analysis).
12We did not include Medicare spending for outpatient drugs covered under the Medicare Advantage program.
Page 5 GAO-21-380 Drug Advertising
drugs to the total amount Medicare Parts B and D spent for all drugs. Spending for Medicare Part B drugs includes the amounts paid by the Medicare Part B program and beneficiary payments (e.g., deductibles), and spending for Medicare Part D drugs includes the amounts paid by Part D plans and beneficiary payments (e.g., deductibles). Part B spending is based on Medicare billing codes that in some cases may include spending for more than one drug.13 Also, the Medicare Part D spending amounts in the Drug Spending Dashboard data do not take into account drug manufacturer rebates and other price concessions.14 As a result, actual Medicare Part B and D spending amounts for certain prescription drugs are lower. We ranked Medicare Parts B and D drugs by total Medicare expenditures and compared them to the drugs that we determined had the highest DTCA spending in each year, as described above.15 To assess the reliability of the Medicare prescription drug data, we reviewed methodology documentation and interviewed agency officials about the data. We determined that these data were sufficiently reliable for the purposes of our reporting objective.
To examine changes in manufacturer DTCA spending, Medicare spending and Medicare use for selected drugs from 2010 through 2018, we analyzed advertising expenditure data from Nielsen Media and expenditure and beneficiary use data from the Medicare Parts B and D Drug Spending Dashboards for a selection of four prescription drugs. As examples, we selected four brand-name drugs that were advertised by drug manufacturers to reflect differences among several factors. These factors included the drug’s treated medical condition, the length of time since FDA approved the drug for use, the drug’s total Medicare Parts B
13Medicare Part B spending amounts are based on Healthcare Common Procedure Coding System (HCPCS) billing codes. Some HCPCS codes include spending for more than one drug (e.g., brand-name drugs and their generic versions). It is not possible to break out spending amounts for individual drugs included under such codes.
14Rebates are a type of price concession, which is generally paid by manufacturers but other price concessions could include discounts by pharmacies. These price concessions reduce the amount that Medicare pays for drugs. As Part B drug prices are determined by law, individual rebates do not directly factor into Medicare Part B spending.
15We also analyzed the number of beneficiaries who used advertised Parts B and D drugs. We calculated this number (total beneficiary use of advertised drugs) based on the sum of unique beneficiaries who used each advertised drug. We compared this amount to a similar number we calculated for total beneficiary use of all Medicare drugs (advertised and not advertised). For both of these calculated numbers, beneficiaries who use more than one drug are counted for each of the drugs they use. Therefore, total beneficiary use does not reflect the number of unique beneficiaries.

Page 6 GAO-21-380 Drug Advertising
and D expenditures and beneficiary use, and the drug’s total DTCA spending (from 2016 through 2018).16
The four drugs we selected were Eliquis, Namenda XR, Neulasta, and Zytiga.17 These drugs provide illustrative examples of how manufacturers used DTCA for these drugs during the period reviewed, but cannot be generalized to other advertised drugs. For each selected drug, we analyzed changes in drug manufacturers’ expenditures for DTCA from 2010 through 2018, in relation to corresponding changes in the number of unique Medicare beneficiaries who used the drug. We also analyzed changes in Medicare Parts B and D expenditures and the average Medicare Part B or Part D price per dosage unit of the drug during this time period.18 Because Medicare Part D expenditures in the Drug Spending Dashboard data do not take into account rebates, the Medicare Part D drug price per dosage unit also does not reflect rebates.
To assess the reliability of the DTCA expenditure data, we compared expenditures against published expenditures for advertised drugs, reviewed methodology documentation, and interviewed Nielsen Media officials. To assess the reliability of the Medicare prescription drug data, we reviewed methodology documentation and interviewed agency officials about the data. We determined that these data were sufficiently reliable for the purposes of our reporting objective.
We also interviewed officials from the drug manufacturers of the four selected drugs (among the six drug manufacturers described above) to obtain insight on their DTCA spending and changes in spending during the time period we analyzed. In particular, we asked manufacturers about 16The length of time a drug has been on the market reflects key events as the drug progresses through its product life cycle. These events include the drug’s launch and decline in market share, for example, as FDA approves generic versions of the drug and they enter the market.
17Eliquis is used to reduce the risk of stroke and dangerous blood clots. Namenda XR is used to treat moderate-to-severe Alzheimer’s disease. Neulasta is used to treat infection due to low white blood cell count associated with chemotherapy. Zytiga is used to treat men with late-stage prostate cancer.
18Specifically, we analyzed annual percent changes over time in spending, price, and use. For spending and price changes that occurred over 4 years, we present the amounts in both nominal and real terms (adjusted for inflation using the gross domestic product index). CMS calculates the average Medicare price per dosage unit by dividing Medicare drug spending by the number of dosage units (which is weighted by the volume of prescription claims).

Page 7 GAO-21-380 Drug Advertising
the factors that might have influenced their DTCA spending decisions for the selected drugs over time. In addition, we asked the drug manufacturers (and the other stakeholders, as described above) to provide their insights on the overall relationship between DTCA spending, drug use and drug spending, and we reviewed articles on this relationship, which we obtained through internet and database searches, FDA, and other stakeholders.19 We provided the manufacturers of the selected drugs with a draft summary of our findings for each of the four drugs to verify their accuracy and incorporated any technical comments as appropriate.
We conducted this performance audit from September 2019 to May 2021 in accordance with generally accepted government auditing standards. Those standards require that we plan and perform the audit to obtain sufficient, appropriate evidence to provide a reasonable basis for our findings and conclusions based on our audit objectives. We believe that the evidence obtained provides a reasonable basis for our findings and conclusions based on our audit objectives.
Drug manufacturers use consumer advertising to promote the use of their drugs. These advertisements inform consumers about the availability of prescription drugs and the medical conditions that they treat. Manufacturers may also aim to persuade consumers that a drug may be a good option for the treatment of a particular medical condition. Additionally, because a health care provider’s prescription is necessary for consumers to obtain a drug, drug advertising may also encourage consumers to visit their doctors to obtain more information about drugs and the medical conditions that they treat.20
DTCA can appear in various media, including broadcast advertisements (such as those on television and radio), print advertisements (such as
19Specifically, we reviewed peer-reviewed articles on the relationship between DTCA and use and federal spending. We searched the following databases (for studies from 2009 through 2020) as part of our background search: ProQuest, SCOPUS, EBSCO, and Dialog. We searched for terms including “direct-to-consumer”, “DTC”, “federal or spend”, “use”, and “Medicare.”
20Drug manufacturers also purchase separate drug advertisements and other types of promotions directed to doctors and other health care providers to encourage them to prescribe drugs to their patients. Drug manufacturers may choose to advertise their drugs directly to consumers through DTCA, directly to providers, or to both.
Background Direct-to-Consumer Drug Advertising
Page 8 GAO-21-380 Drug Advertising
those in magazines and newspapers), internet advertisements (such as video and web banner advertisements that appear on drug companies’ and other websites), and advertisements in other media, such as movie theaters and on outdoor billboards. Drug manufacturers may focus their drug advertising for a particular drug in one type of media, or they may advertise the same drug across a variety of different media.
Medicare Part B covers drugs and biologics that are typically administered by a doctor or under a doctor’s supervision, in the office or at a hospital outpatient department. Part B drugs include injectable drugs, such as chemotherapy and vaccines, some oral cancer drugs, and drugs that are infused or inhaled through durable medical equipment (e.g., pain drugs delivered through an infusion pump). Medicare Part B drugs are generally purchased by doctors or hospitals. Medicare’s payment rates for most Part B drugs are based on the average amount that purchasers paid to manufacturers, net of discounts and rebates, referred to as the average sales price (ASP).21 In addition to the amount paid by the Medicare Part B program, Medicare spending for Part B drugs includes the amount paid by Medicare beneficiaries, which includes the beneficiary’s deductible and coinsurance.22
Medicare’s Part D Prescription Drug program covers drugs and biologics that beneficiaries generally administer themselves at home and that they obtain at outpatient pharmacies.23 All of the Part D drug plans into which beneficiaries may enroll must cover all drugs in certain therapeutic
21For most Part B drugs, Medicare sets the payment rate equal to the ASP plus an additional 6 percent.
22Beneficiaries are generally responsible for 20 percent of the payment rate for Part B drugs, which may be covered all or in part by a supplemental health insurance policy such as a plan purchased from a private company, an employer-sponsored retiree health plan, or Medicaid.
23Medicare Part D is the voluntary program for Medicare beneficiaries who enroll in Part D drug plans.
Medicare Parts B and D Prescription Drugs

Page 9 GAO-21-380 Drug Advertising
classes.24 Part D plans also cover other types of drugs that they include on their drug formularies. Part D drug prices are based on negotiations between Part D drug plans and drug manufacturers, which can result in rebates or discounts.25 In addition to the amount paid by the Medicare Part D plan (net of manufacturers’ rebates or discounts), Medicare spending for Part D drugs includes the amounts paid by beneficiaries that are enrolled in a plan. This could include the beneficiary’s deductible and cost-sharing payments.
From 2016 through 2018, drug manufacturers spent about $18 billion—roughly $6 billion each year—to advertise over 500 drugs to consumers. Manufacturers concentrated the majority of their DTCA spending on about 40 drugs, about half of which FDA had approved for use from 2014 through 2017. Advertisements that appeared on television comprised the largest share of manufacturers’ spending across the 3 years.
Our analysis of DTCA expenditures shows that drug manufacturers spent $17.8 billion to advertise 553 drugs and biologics during the 2016 to 2018 period, as shown in table 1. Manufacturers’ spending was relatively stable at about $6 billion in each of the 3 years, increasing by a total of about
24Known as the protected classes, these therapeutic classes are: (1) anticonvulsants, (2) antidepressants, (3) antineoplastics, (4) antipsychotics, (5) antiretrovirals, and (6) immunosuppressants for the treatment of transplant rejection. Sponsors are required to include all covered Part D drugs in these statutorily specified categories, unless an exception applies, until such time as the Secretary identifies categories of clinical concern through notice and comment rulemaking. 42 U.S.C. § 1395w-104(b)(3)(G). The Secretary has not promulgated final regulations establishing categories and classes of clinical concern, so the protected classes remain those categories and classes that are listed in statute. See 42 C.F.R. § 423.120(b)(2)(v) (2019).
25Part D plans may negotiate rebates or discounts with manufacturers in exchange for driving more utilization of a specific drug, such as including more favorable placement of that drug on the plan’s formulary.
Manufacturers Spent About $6 Billion Each Year from 2016 through 2018 on Direct-to-Consumer Advertising, with Spending Concentrated on a Small Portion of Drugs Manufacturers Spent Almost $18 Billion to Advertise Over 500 Drugs to Consumers from 2016 through 2018

Page 10 GAO-21-380 Drug Advertising
$265 million (about 5 percent) from 2016 through 2018. Our findings on DTCA spending and characteristics of advertised drugs include:
• The amount manufacturers spent to advertise individual drugs across the 3-year period varied significantly, ranging from less than $10,000 per drug (for 139 drugs) to more than $100 million per drug (for 48 drugs). On average, manufacturers spent about $32 million per drug on DTCA during the 2016 to 2018 period.
• Manufacturers purchased advertising for about 34 percent of advertised drugs in only 1 of the 3 years (or 186 of 553 drugs) and about 38 percent were advertised all three years (or 208 of the 553 drugs).
• Of the 553 advertised drugs and biologics, about 77 percent were drugs.26 Also, nearly all of the 553 drugs and biologics were brand-name (546) rather than generics or biosimilars.
Table 1: Drug Manufacturer Spending on Direct-to-Consumer Advertising and Characteristics of Advertised Drugs, 2016 through 2018
Drug Advertising Spending and Characteristics 2016 2017 2018 2016 - 2018
combined Drug manufacturers’ total spending on direct-to-consumer advertising (in billions of dollars)
5.8 5.9 6.1 17.8
Number of advertised drugs and biologics 365 383 380 553a Number of advertised brand-name drugs and biologics
362 378 376 546a
Number of advertised generic drugs and biosimilar biologics
3 5 4 7a
Source: GAO analysis of Nielsen Media, Redbook, and Food and Drug Administration data. │ GAO-21-380 aThe number of advertised drugs and biologics for 2016 to 2018 combined is the number of unique drugs or biologics across the 3 years. The sum of the individual years is greater than this number because manufacturers advertised many of the same drugs in multiple years.
In addition, we found that drug manufacturers spent almost half—$8.2 billion of the $17.8 billion—on drugs in three therapeutic categories, corresponding with three types of chronic medical conditions. These three types of conditions are inflammatory conditions (e.g., arthritis, gout), endocrine and metabolic disorders (e.g., type 2 diabetes,
26While biologics comprised about 23 percent of all advertised drugs, they account for less than 2 percent of the total number of approved drug products.

Page 11 GAO-21-380 Drug Advertising
hypothyroidism), and conditions affecting the central nervous system (e.g., depression, multiple sclerosis). We found the following.
• The rheumatoid arthritis biologic Humira, manufactured by AbbVie, had the highest amount of DTCA spending during the 2016 to 2018 period—$1.4 billion—among all drugs and biologics, not just among those that treat inflammatory conditions.27
• The type 2 diabetes biologic Trulicity and neuropathic pain drug Lyrica had the highest spending across the 3 years among drugs that treat endocrine and metabolic disorders and conditions affecting the central nervous system, respectively. Pfizer spent $913 million to advertise Lyrica during this time, and Lilly spent $655 million to advertise Trulicity.
Consistent with our finding that DTCA spending was concentrated on chronic medical conditions, officials from five drug manufacturers told us that they are generally more likely to focus consumer advertising on drugs that are used to treat and manage chronic medical conditions or that affect a large portion of the population. In comparison, officials from three drug manufacturers stated that they would typically advertise drugs that treat rare or complex conditions directly to doctors and other health care providers. Other stakeholders we interviewed similarly noted that drugs that treat more prevalent conditions are more likely to be advertised to consumers because of their potential to capture a larger market of drug use and sales.
We found that drug manufacturers concentrated their consumer advertising spending on 39 drugs during the 2016 to 2018 period, accounting for almost $12 billion of the total $17.8 billion (67 percent) in DTCA spending. We identified these 39 drugs because they represented the top 25 drugs in advertising spending for each of the 3 years.28 In general, the level of concentration in DTCA spending was similar in 2016, 2017 and 2018, as the top 25 drugs in each year comprised about 66 percent of total DTCA spending.
27Humira, initially approved by FDA in 2002, is also approved to treat other medical conditions such as Crohn’s disease and psoriasis.
28The total number of drugs that comprised the top 25 drugs in advertising spending in each year—2016, 2017, and 2018—was less than 75 drugs because several drugs were in the top 25 for two or three of these years.
Manufacturers Concentrated Advertising Spending on Almost 40 Drugs, About Half of Which Had Been Recently Approved

Page 12 GAO-21-380 Drug Advertising
Our analysis also shows that 21 of the 39 drugs that comprised the majority of DTCA spending were approved by FDA from 2014 through 2017. Thus, the DTCA spending that we observed from 2016 through 2018 for the 21 drugs and biologics represented manufacturer spending within the first 5 years that they were approved by FDA. As an example, in 2015 FDA approved the biologic Cosentyx to treat plaque psoriasis and the drug’s manufacturer, Novartis, spent over $470 million to advertise it in the 2016 to 2018 period of our review.
On the other hand, 18 of the 39 drugs were approved prior to 2014.29 Among these drugs we found a few that had been approved by FDA about 20 years prior to the period we reviewed. For example, the biologic Enbrel was first approved to treat rheumatoid arthritis in 1998. While FDA approved a biosimilar of Enbrel in 2016, it is not yet available for use, according to FDA officials. Only two of the 39 drugs that comprised the majority of DTCA spending had available generic versions.30
Officials from one drug manufacturer told us that they tended to spend more to advertise a drug soon after FDA’s approval to promote consumer awareness of the new drug and the medical condition that it is approved to treat. Officials from four manufacturers said that they generally reduce advertising spending once a drug has become more established in the market and once there may be broader consumer awareness of the drug. Other stakeholders also noted that DTCA spending tended to be greater early in the drug’s product life cycle, for example, to help establish market share for a new type of treatment.
Our analysis of DTCA spending across the different types of media shows that drug television advertising comprised about 76 percent of total DTCA spending ($13.4 billion of the $17.8 billion) during the 2016 to 2018 period, the largest share of manufacturers’ spending. (See fig. 1.) This share was followed by spending on magazine advertisements ($3.6
29Specifically, the 18 drugs were approved by FDA from 1998 through 2013.
30As an example, FDA approved the erectile dysfunction drug Viagra in 1998 and the first generic version of Viagra became available in 2017. Almost all of the 39 drugs had brand-name competitors.
Television Advertisements Comprised the Largest Share of Spending

Page 13 GAO-21-380 Drug Advertising
billion), digital advertisements ($603 million), and advertisements in other types of media, such as newspapers and movie theaters ($113 million).31
Figure 1: Direct-to-Consumer Advertising Spending by Media Type, 2016 through 2018
Notes: Direct-to-consumer advertising spending is based on drug advertisements in national and local markets. Television advertisements are broadcast on network and cable channels and magazine advertisements are in consumer-oriented magazines. Digital advertisements appear on websites that can be viewed on desktop computers, tablets, or mobile devices. The other category includes advertisements in newspapers, on radio and outdoors (e.g., kiosks), and in movie theaters. Nielsen Media’s data did not include digital advertisements on social media websites such as Facebook at the time of our analysis, thus it is likely that our estimate of digital DTCA spending is an underestimate. Numbers may not add up to totals due to rounding.
Although television advertising comprised the largest share of manufacturers’ spending on DTCA, we found that drug manufacturers purchased television advertisements for a relatively small portion of advertised drugs. Specifically, manufacturers advertised 113 drugs (or about 20 percent of the 553 advertised drugs) on television during the 2016 to 2018 period. Among the drugs advertised on television, AbbVie’s spending of about $1.2 billion on television advertising for Humira was the highest amount of spending for television advertisements during this period and represented about 87 percent of AbbVie’s total DTCA
31The other category includes newspaper, radio, outdoor, and movie theater advertisements.
Because Nielsen Media’s DTCA data did not include advertisements on social media websites such as Facebook at the time of our analysis, it is likely that our estimate of digital DTCA spending is an underestimate.

Page 14 GAO-21-380 Drug Advertising
spending for Humira. We found that drugs with television advertisements were also more likely than the other drugs (440) to appear in magazine advertisements.32 Further, nearly all of the 553 advertised drugs that we reviewed were advertised online—regardless of whether they were also advertised on television.
Officials from five of the drug manufacturers we interviewed told us that, in addition to their overall budget for DTCA, characteristics specific to individual drugs and patients often influenced manufacturers’ decisions about which type of media to use. For example, officials from two manufacturers said that television advertisements may be advantageous for drugs that treat common medical conditions. One other stakeholder further explained that television advertisements reach a larger audience than other types of media and older patients may be more likely than younger patients to obtain consumer information from television. In comparison, other stakeholders noted that a manufacturer may concentrate its DTCA spending on digital advertising to promote the use of a drug that treats a rare condition. One stakeholder explained that a manufacturer can better target its digital advertisements to the population of affected patients—for example, those that participate in online patient advocacy groups.
32Although few of the 440 drugs without television advertisements were advertised in magazines, magazine advertisements comprised the largest portion of total advertising spending on these drugs.
Page 15 GAO-21-380 Drug Advertising
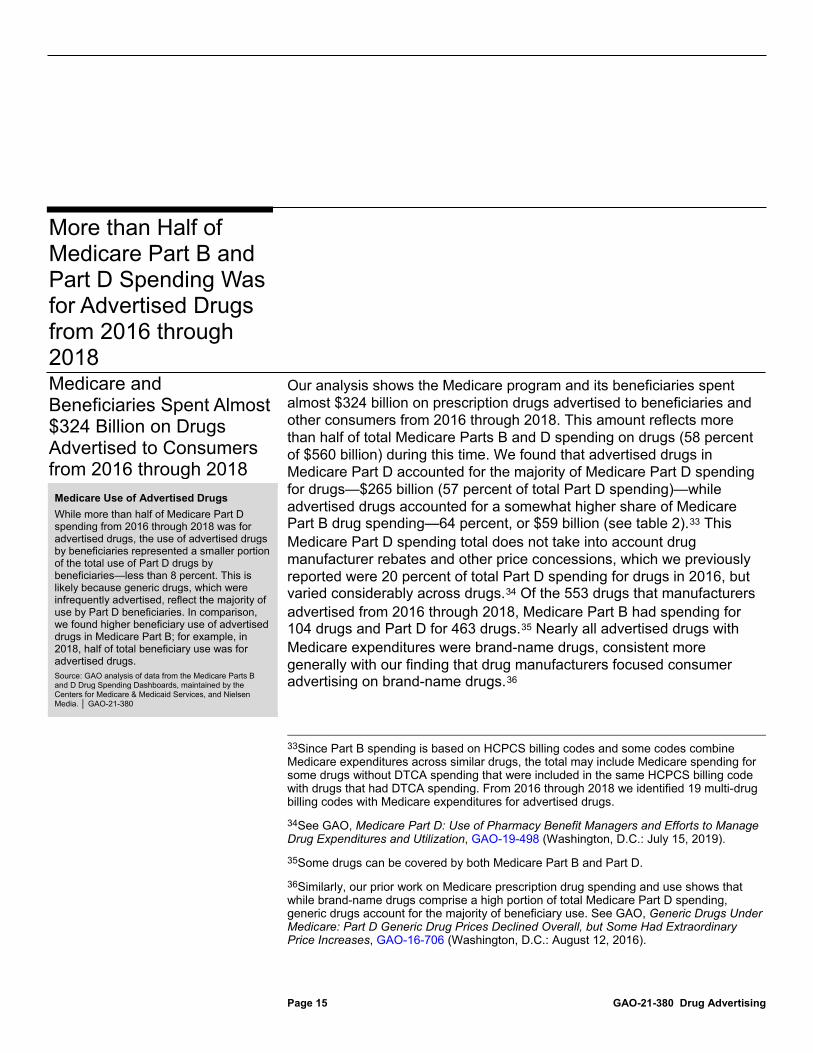
Our analysis shows the Medicare program and its beneficiaries spent almost $324 billion on prescription drugs advertised to beneficiaries and other consumers from 2016 through 2018. This amount reflects more than half of total Medicare Parts B and D spending on drugs (58 percent of $560 billion) during this time. We found that advertised drugs in Medicare Part D accounted for the majority of Medicare Part D spending for drugs—$265 billion (57 percent of total Part D spending)—while advertised drugs accounted for a somewhat higher share of Medicare Part B drug spending—64 percent, or $59 billion (see table 2).33 This Medicare Part D spending total does not take into account drug manufacturer rebates and other price concessions, which we previously reported were 20 percent of total Part D spending for drugs in 2016, but varied considerably across drugs.34 Of the 553 drugs that manufacturers advertised from 2016 through 2018, Medicare Part B had spending for 104 drugs and Part D for 463 drugs.35 Nearly all advertised drugs with Medicare expenditures were brand-name drugs, consistent more generally with our finding that drug manufacturers focused consumer advertising on brand-name drugs.36
33Since Part B spending is based on HCPCS billing codes and some codes combine Medicare expenditures across similar drugs, the total may include Medicare spending for some drugs without DTCA spending that were included in the same HCPCS billing code with drugs that had DTCA spending. From 2016 through 2018 we identified 19 multi-drug billing codes with Medicare expenditures for advertised drugs.
34See GAO, Medicare Part D: Use of Pharmacy Benefit Managers and Efforts to Manage Drug Expenditures and Utilization, GAO-19-498 (Washington, D.C.: July 15, 2019).
35Some drugs can be covered by both Medicare Part B and Part D.
36Similarly, our prior work on Medicare prescription drug spending and use shows that while brand-name drugs comprise a high portion of total Medicare Part D spending, generic drugs account for the majority of beneficiary use. See GAO, Generic Drugs Under Medicare: Part D Generic Drug Prices Declined Overall, but Some Had Extraordinary Price Increases, GAO-16-706 (Washington, D.C.: August 12, 2016).
More than Half of Medicare Part B and Part D Spending Was for Advertised Drugs from 2016 through 2018 Medicare and Beneficiaries Spent Almost $324 Billion on Drugs Advertised to Consumers from 2016 through 2018 Medicare Use of Advertised Drugs While more than half of Medicare Part D spending from 2016 through 2018 was for advertised drugs, the use of advertised drugs by beneficiaries represented a smaller portion of the total use of Part D drugs by beneficiaries—less than 8 percent. This is likely because generic drugs, which were infrequently advertised, reflect the majority of use by Part D beneficiaries. In comparison, we found higher beneficiary use of advertised drugs in Medicare Part B; for example, in 2018, half of total beneficiary use was for advertised drugs. Source: GAO analysis of data from the Medicare Parts B and D Drug Spending Dashboards, maintained by the Centers for Medicare & Medicaid Services, and Nielsen Media. │ GAO-21-380
Page 16 GAO-21-380 Drug Advertising
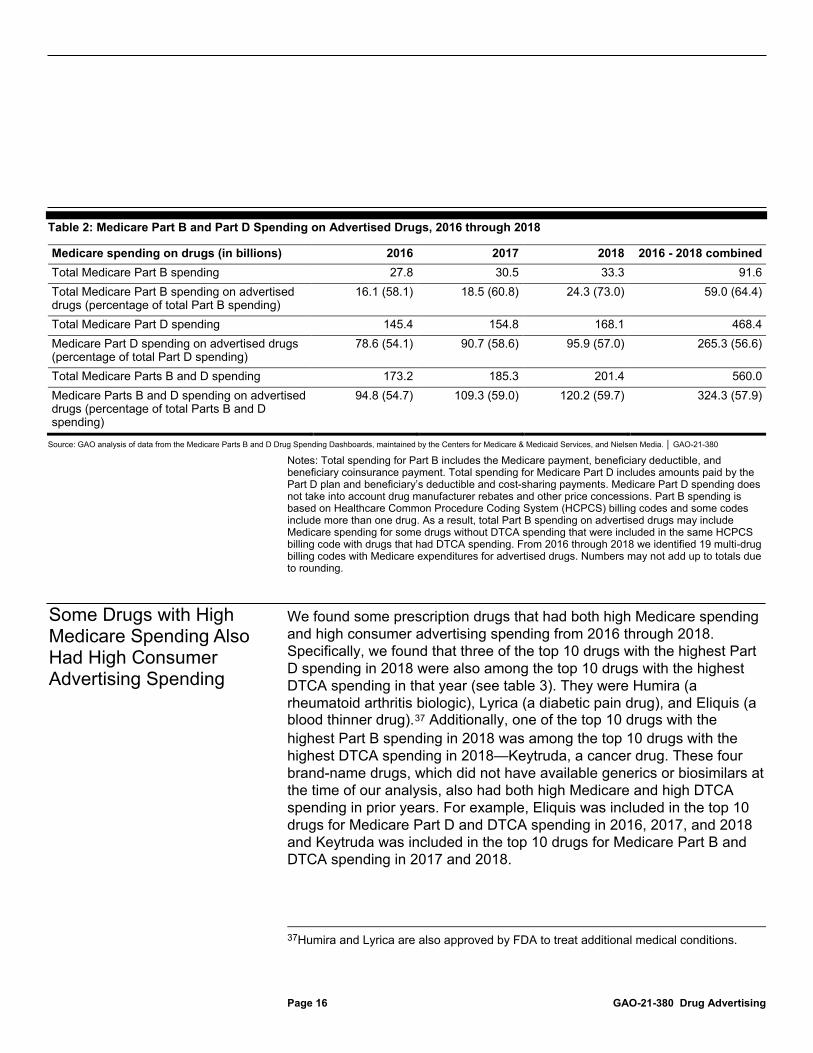
Table 2: Medicare Part B and Part D Spending on Advertised Drugs, 2016 through 2018
Medicare spending on drugs (in billions) 2016 2017 2018 2016 - 2018 combined Total Medicare Part B spending 27.8 30.5 33.3 91.6 Total Medicare Part B spending on advertised drugs (percentage of total Part B spending)
16.1 (58.1) 18.5 (60.8) 24.3 (73.0) 59.0 (64.4)
Total Medicare Part D spending 145.4 154.8 168.1 468.4 Medicare Part D spending on advertised drugs (percentage of total Part D spending)
78.6 (54.1) 90.7 (58.6) 95.9 (57.0) 265.3 (56.6)
Total Medicare Parts B and D spending 173.2 185.3 201.4 560.0 Medicare Parts B and D spending on advertised drugs (percentage of total Parts B and D spending)
94.8 (54.7) 109.3 (59.0) 120.2 (59.7) 324.3 (57.9)
Source: GAO analysis of data from the Medicare Parts B and D Drug Spending Dashboards, maintained by the Centers for Medicare & Medicaid Services, and Nielsen Media. │ GAO-21-380
Notes: Total spending for Part B includes the Medicare payment, beneficiary deductible, and beneficiary coinsurance payment. Total spending for Medicare Part D includes amounts paid by the Part D plan and beneficiary’s deductible and cost-sharing payments. Medicare Part D spending does not take into account drug manufacturer rebates and other price concessions. Part B spending is based on Healthcare Common Procedure Coding System (HCPCS) billing codes and some codes include more than one drug. As a result, total Part B spending on advertised drugs may include Medicare spending for some drugs without DTCA spending that were included in the same HCPCS billing code with drugs that had DTCA spending. From 2016 through 2018 we identified 19 multi-drug billing codes with Medicare expenditures for advertised drugs. Numbers may not add up to totals due to rounding.
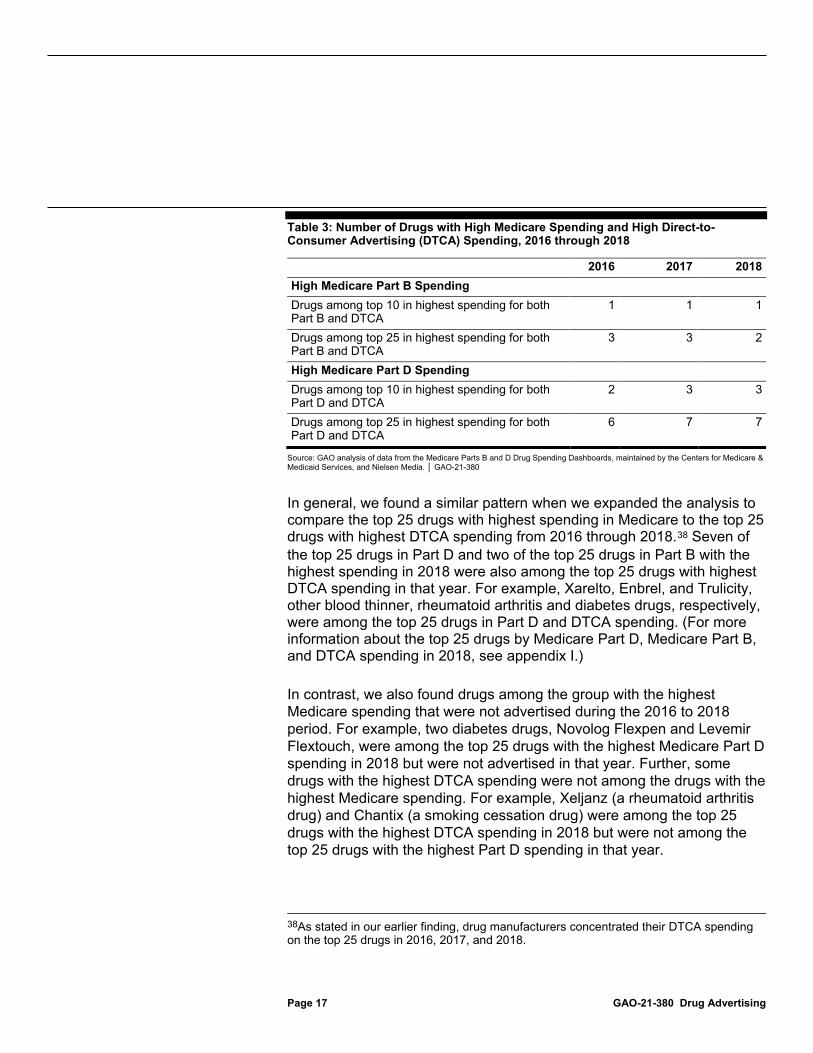
We found some prescription drugs that had both high Medicare spending and high consumer advertising spending from 2016 through 2018. Specifically, we found that three of the top 10 drugs with the highest Part D spending in 2018 were also among the top 10 drugs with the highest DTCA spending in that year (see table 3). They were Humira (a rheumatoid arthritis biologic), Lyrica (a diabetic pain drug), and Eliquis (a blood thinner drug).37 Additionally, one of the top 10 drugs with the highest Part B spending in 2018 was among the top 10 drugs with the highest DTCA spending in 2018—Keytruda, a cancer drug. These four brand-name drugs, which did not have available generics or biosimilars at the time of our analysis, also had both high Medicare and high DTCA spending in prior years. For example, Eliquis was included in the top 10 drugs for Medicare Part D and DTCA spending in 2016, 2017, and 2018 and Keytruda was included in the top 10 drugs for Medicare Part B and DTCA spending in 2017 and 2018.
37Humira and Lyrica are also approved by FDA to treat additional medical conditions.
Some Drugs with High Medicare Spending Also Had High Consumer Advertising Spending
Page 17 GAO-21-380 Drug Advertising
Table 3: Number of Drugs with High Medicare Spending and High Direct-to-Consumer Advertising (DTCA) Spending, 2016 through 2018
2016 2017 2018 High Medicare Part B Spending Drugs among top 10 in highest spending for both Part B and DTCA
1 1 1
Drugs among top 25 in highest spending for both Part B and DTCA
3 3 2
High Medicare Part D Spending Drugs among top 10 in highest spending for both Part D and DTCA
2 3 3
Drugs among top 25 in highest spending for both Part D and DTCA
6 7 7
Source: GAO analysis of data from the Medicare Parts B and D Drug Spending Dashboards, maintained by the Centers for Medicare & Medicaid Services, and Nielsen Media. │ GAO-21-380
In general, we found a similar pattern when we expanded the analysis to compare the top 25 drugs with highest spending in Medicare to the top 25 drugs with highest DTCA spending from 2016 through 2018.38 Seven of the top 25 drugs in Part D and two of the top 25 drugs in Part B with the highest spending in 2018 were also among the top 25 drugs with highest DTCA spending in that year. For example, Xarelto, Enbrel, and Trulicity, other blood thinner, rheumatoid arthritis and diabetes drugs, respectively, were among the top 25 drugs in Part D and DTCA spending. (For more information about the top 25 drugs by Medicare Part D, Medicare Part B, and DTCA spending in 2018, see appendix I.) In contrast, we also found drugs among the group with the highest Medicare spending that were not advertised during the 2016 to 2018 period. For example, two diabetes drugs, Novolog Flexpen and Levemir Flextouch, were among the top 25 drugs with the highest Medicare Part D spending in 2018 but were not advertised in that year. Further, some drugs with the highest DTCA spending were not among the drugs with the highest Medicare spending. For example, Xeljanz (a rheumatoid arthritis drug) and Chantix (a smoking cessation drug) were among the top 25 drugs with the highest DTCA spending in 2018 but were not among the top 25 drugs with the highest Part D spending in that year.
38As stated in our earlier finding, drug manufacturers concentrated their DTCA spending on the top 25 drugs in 2016, 2017, and 2018.

Page 18 GAO-21-380 Drug Advertising
Our analysis of DTCA spending on four selected drugs from 2010 through 2018 found that drug manufacturers changed their level of DTCA spending in relation to key drug events. We also found that manufacturer spending on consumer advertising may have been one of several factors contributing to increases in Medicare beneficiary use and spending during the time of our analysis.
We found that manufacturers changed DTCA spending on the selected drugs in relation to key drug events that occurred from 2010 through 2018. Examples of events where manufacturers increased DTCA spending included promoting the use of a drug near the time when it was first introduced in the market, once FDA approved the drug to treat additional medical conditions, or as FDA approved the use of a new method for administering the drug to patients. In contrast, we found that manufacturers decreased their spending on DTCA as a drug progressed through its product life cycle, including when generic versions of the drug approved by FDA entered the market. Most manufacturers said that there is often less need for consumer advertising when a drug is near the end of its product life cycle because the drug is older and therefore more familiar to patients. The following are examples of changes in manufacturer spending on DTCA in relation to key drug events for the selected drugs that we reviewed over a 9-year period:
• Approved new method for administering drug: Amgen increased its DTCA spending on its biologic Neulasta (which is approved to reduce the risk of infection in patients receiving chemotherapy) by $57 million after FDA approved a new method to administer it to patients with cancer in December 2014. Specifically, Amgen’s DTCA spending on Neulasta went from about $2 million in 2014 to $59 million in 2016. Even though FDA initially approved Neulasta for use in 2002, Amgen
Changes in Advertising Spending Were Often Related to Key Drug Events and May Have Contributed to Increases in Beneficiary Use and Spending for Four Selected Drugs Spending on Consumer Advertising for Four Selected Drugs Often Changed in Relation to Key Drug Events

Page 19 GAO-21-380 Drug Advertising
officials told us they increased their DTCA spending from 2015 to 2016 to promote the drug’s new delivery method.39
• Approved generics enter the market: In contrast, Janssen nearly ended its DTCA spending on the prostate cancer drug Zytiga as FDA approved a generic version of the drug. Specifically, Janssen decreased DTCA spending from about $191,000 in 2017 to nearly $0 in 2018, when the generic was approved. Janssen officials told us that the company’s decrease in DTCA spending was consistent with the practice among drug manufacturers to reduce DTCA spending as FDA approved generics for use.
Appendices II-V provide details about each selected drug, including how consumer advertising may be related to corresponding changes in Medicare beneficiary use and Medicare spending.
We found that manufacturer spending on DTCA from 2010 through 2018 may have been a factor in increases in the use of selected drugs among Medicare beneficiaries and in Medicare spending. For example:
• Bristol Myers Squibb increased its DTCA spending on Eliquis (a blood thinner drug) by over $150 million from 2013 to 2016. At the same time, Medicare Part D beneficiary use increased from almost 47,000 beneficiaries to about 827,000 beneficiaries, and Part D spending increased from $45 million to $1.9 billion. In 2014, FDA approved Eliquis to treat additional indications, which according to company officials contributed to the company’s decision to expand consumer advertising. This decision likely contributed to some of the growth in Part D beneficiary use during this time.
• AbbVie increased its DTCA spending on the Alzheimer’s drug Namenda XR by almost $76 million from 2013 through 2015. During this period, the number of Medicare beneficiaries who used the drug increased by almost 300,000, and Medicare Part D spending grew over twentyfold, from $46 million to $952 million.
While these examples illustrate how consumer advertising may contribute to increased Medicare use, events such as FDA approval for additional indications, would likely have led to increases in drug use on their own (i.e., without consumer advertising).
39Approved by FDA in 2014, the new delivery method allowed patients undergoing chemotherapy to receive Neulasta at home via a prefilled automatic injection device.
Consumer Advertising May Have Contributed to Increased Medicare Beneficiary Use and Spending for Four Selected Drugs, but Other Factors Contributed

Page 20 GAO-21-380 Drug Advertising
Consistent with our analysis, some of the studies we reviewed found that DTCA spending is associated with increased drug use and drug spending. For example, a 2017 study found an association between television drug advertisements and sales volume (based on doses dispensed) for two cholesterol drugs in 75 market areas.40 The study reported that for every 100-point increase in gross rating points (a measure of advertising intensity) for the two drugs within a market, there was about a 2 percent increase in drug doses that were dispensed to patients.41 Several stakeholders we interviewed also acknowledged that DTCA spending is one factor that likely contributes to drug use and spending, including in the Medicare program.
Beyond DTCA spending, stakeholders we interviewed cited a number of other factors that likely contribute to the overall use of drugs and drug spending, including in Medicare. These factors included doctors’ prescribing decisions, health plan formulary controls, a drug’s therapeutic benefit, and manufacturer spending on drug promotions directed to doctors. Some stakeholders said that, in their view, DTCA spending likely contributes less to overall drug use and spending compared to these other factors. For example, several stakeholders explained that while DTCA may encourage and help consumers to have informed conversations about their medical conditions and treatment options with health care providers, it is the provider’s judgment about the medical condition and therapeutic benefit of that drug that ultimately determines if the drug is prescribed to the patient. An official from a provider organization noted that while patients may request new prescription drugs that they see advertised on television (e.g., to treat diabetes and hypertension), they often modify their requests after learning about the cost of the drugs compared to alternative drugs. This official also noted that physicians may be reluctant to prescribe an advertised drug that is new to the market because its safety may not be well understood or because of other factors, such as the availability of alternative drugs. Moreover, several stakeholders emphasized that the number of
40H. Chang et al., “Effect of Direct-to-Consumer Advertising (DTCA) on Statin Use in the United States,” Medical Care, vol. 55, no. 8 (2017): pp. 759-764. For examples of other studies, see M. P. Gray et al., “Impact of direct-to-consumer drug advertising during the Super Bowl on drug utilization,” Research in Social and Administrative Pharmacy, vol. 16 (2020): pp. 1136–1139; and M. Daubresse et al., “Effect of Direct-to-Consumer Advertising on Asthma Medication Sales and Healthcare Use,” American Journal of Respiratory and Critical Care Medicine, vol. 192, no. 1 (2015): pp. 40-46.
41Gross rating points are calculated by multiplying the percentage of the target audience reached per airing of an advertisement by the number of times the advertisement aired.
Page 21 GAO-21-380 Drug Advertising
contributing factors makes it difficult to isolate the relationship between DTCA spending, drug use, and spending. For example, two stakeholders stated that drug manufacturers often advertise a particular drug to consumers while concurrently promoting the same drug to doctors and other health care providers, making it difficult to assess the independent relationship between DTCA spending and drug use and spending.
Further, price was another factor contributing to the growth in Medicare expenditures that we observed among the selected drugs. That is, our analysis found that drug manufacturers of each selected drug consistently increased per unit prices throughout the 2010 to 2018 period we reviewed, regardless of increased DTCA spending. For example, Bristol Myers Squibb increased the per unit price of Eliquis by 10 percent per year on average throughout our review period, from $4.36 in 2013 to $7.00 in 2018, while Medicare spending increased by about 157 percent per year on average, from about $45 million to about $5 billion.42 Appendices II-V provide information about increases in per unit prices for our selected drugs.
We provided a draft of this report to the Department of Health and Human Services for comment, and the department provided technical comments, which we incorporated as appropriate.
As agreed with your offices, unless you publicly announce the contents of this report earlier, we plan no further distribution until 30 days from the report date. At that time, we will send copies to the appropriate congressional committees, the Secretary of Health and Human Services, and other interested parties. In addition, the report will be available at no charge on the GAO website at https://www.gao.gov.
42Adjusted for inflation, the increase in per unit price would be 8 percent and the increase in Medicare spending would be 152 percent. We used the compound annual growth rate to calculate the average annual percentage change from 2013 through 2018.
Agency Comments

Page 22 GAO-21-380 Drug Advertising
If you or your staff have any questions about this report, please contact me at (202) 512-7114 or [email protected]. Contact points for our Offices of Congressional Relations and Public Affairs may be found on the last page of this report. GAO staff who made key contributions to this report are listed in appendix VI.
John E. Dicken Director, Health Care

Appendix I: Drugs with Highest Medicare and Direct-to-Consumer Advertising Spending
Page 23 GAO-21-380 Drug Advertising
Table 4: Top 25 Drugs with Highest Medicare Part D and Part B Spending, and Top 25 Drugs with Highest Direct-to-Consumer Advertising Spending, 2018 Spending in dollars
Source: GAO analysis of data from the Medicare Parts D and B Drug Spending Dashboards, maintained by the Centers for Medicare & Medicaid Services, and Nielsen Media.│ GAO-21-380
Notes: Medicare Part B spending amounts are based on Healthcare Common Procedure Coding System (HCPCS) billing codes and some codes include spending for more than one drug. Spending for Prolia, Orencia, Fluzone High-Dose, Gammaked, and Botox are based on such codes. Medicare Part D spending does not take into account drug manufacturer rebates and other price concessions. aThis drug was among the top 25 drugs in spending for both Medicare Part D and advertising spending. bThis drug was among the top 25 drugs in spending for both Medicare Part B and advertising spending.
Appendix I: Drugs with Highest Medicare and Direct-to-Consumer Advertising Spending
Top 25 Medicare Part D Drugs (Brand Name)
Total Part D Spending
Top 25 Medicare Part B Drugs (Brand Name)
Total Part B Spending
Top 25 Drugs Advertised to Consumers (Brand Name)
Total Direct-to-Consumer
Advertising Spending
1. Eliquisa 4,992,184,164 Eylea 2,573,938,387 Humiraa 502,669,516 2. Revlimid 4,065,088,801 Keytrudab 1,813,727,267 Xeljanz 258,463,717 3. Xareltoa 3,358,810,708 Opdivo 1,715,907,188 Lyricaa 245,401,444 4. Januvia 3,228,917,720 Rituxan 1,699,302,442 Trulicitya 243,636,695 5. Lyricaa 2,950,257,661 Prolia 1,416,968,973 Chantix 212,200,575 6. Advair Diskus 2,394,014,929 Neulasta 1,370,995,237 Otezla 185,447,454 7. Humiraa 2,388,794,497 Lucentis 1,215,701,656 Keytrudab 179,812,336 8. Lantus Solostar 2,370,490,822 Remicade 1,149,653,207 Cosentyx 175,993,822 9. Imbruvica 1,867,207,013 Avastin 1,011,988,293 Eliquisa 173,836,505 10. Symbicort 1,751,221,156 Herceptin 821,766,302 Ibrancea 148,897,381 11. Harvoni 1,726,263,039 Orencia 799,286,087 Verzenio 142,320,417 12. Novolog Flexpen 1,712,623,585 Darzalex 645,375,454 Xareltoa 141,467,580 13. Levemir Flextouch 1,584,105,950 Ocrevus 488,832,130 Botoxb 133,021,371 14. Ibrancea 1,507,730,890 Alimta 471,369,648 Eucrisa 126,287,514 15. Zytiga 1,475,649,551 Fluzone High-Dose 461,229,754 Entresto 126,052,418 16. Spiriva 1,425,533,899 Velcade 443,373,929 Taltz 123,149,033 17. Trulicitya 1,360,642,452 Prevnar 13 432,793,750 Jardiance 121,645,116 18. Victoza 1,341,681,068 Sandostatin Lar Depot 414,142,370 Rexulti 117,398,949 19. Lantus 1,253,375,347 Soliris 395,796,137 Enbrela 117,286,162 20. Enbrela 1,247,769,463 Xolair 395,083,351 Dupixent 104,203,804 21. Copaxone 1,208,097,769 Gammagard Liquid 378,891,063 Entyvio 102,236,251 22. Humalog 1,199,656,304 Gammaked 370,456,943 Ozempic 99,389,859 23. Xtandi 1,182,615,333 Cimzia 366,371,065 Repatha 98,527,012 24. Latuda 1,172,672,481 Botoxb 348,391,516 Vraylar 94,530,194 25. Breo Ellipta 1,159,269,757 Simponi Aria 296,770,201 Anoro Ellipta 93,396,536

Appendix II: Spending on Direct-to-Consumer Advertising, Medicare Beneficiary Use, and Medicare Spending for Eliquis
Page 24 GAO-21-380 Drug Advertising
This appendix provides additional information on drug manufacturer spending on direct-to-consumer advertising (DTCA) for Eliquis, its use among Medicare beneficiaries, and total Medicare spending, from 2013 through 2018.
Source: GAO summary of FDA information. I GAO-21-380
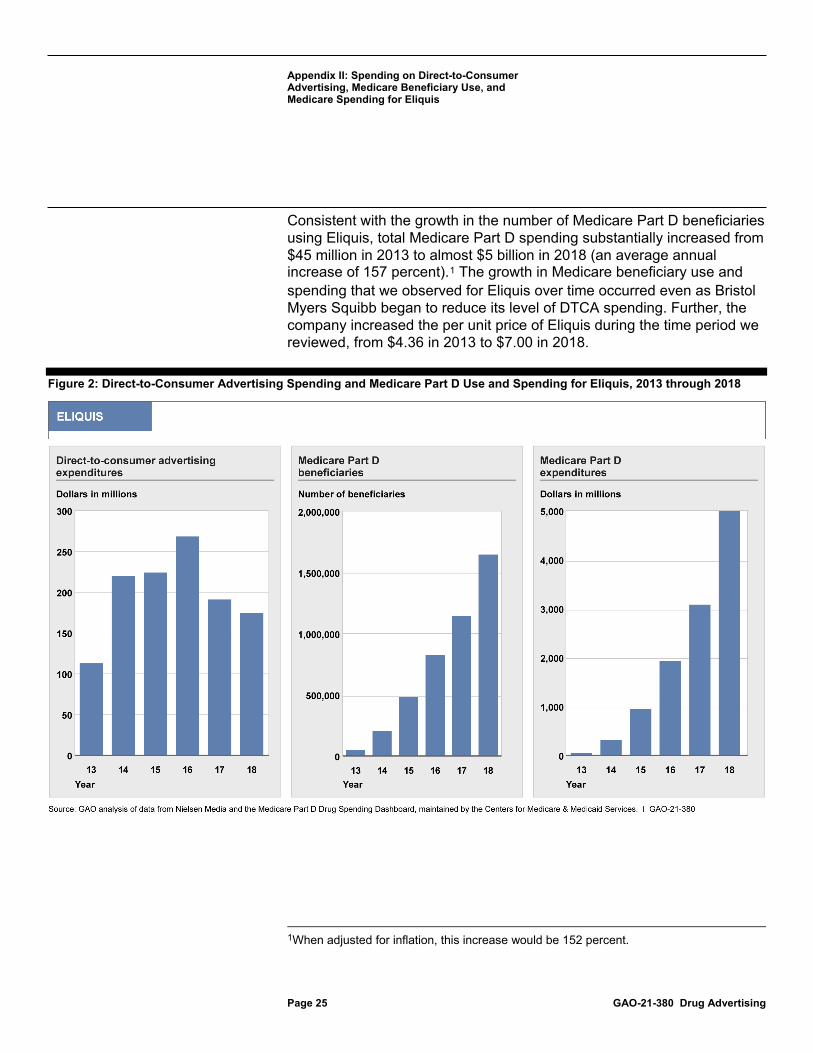
Bristol Myers Squibb launched its advertising campaign for Eliquis in 2013, shortly after FDA approved the drug for use in December 2012. The company continued to increase its level of spending on consumer advertising from $113 million in 2013 through 2016, the year it spent $268 million (see figure 2 and table 5). During this time, FDA approved Eliquis for the treatment of additional medical conditions. In 2014, Eliquis was approved to reduce the risk of blood clots following hip replacement surgery and to treat blood clots that occur in the lungs. Officials from Bristol Myers Squibb told us that these additional indications contributed to their decision to expand advertising of Eliquis during this time. Following 2016, the company reduced its level of DTCA spending. According to Bristol Myers Squibb officials, the decrease in DTCA reflects the marketing practice for a drug that is near the end of its product life cycle (including when generic versions of the drug approved by FDA enter the market). Officials further explained that the need to educate consumers about a drug generally diminishes near the end of the life cycle.
The number of Medicare Part D beneficiaries who used Eliquis significantly increased during the time Bristol Myers Squibb advertised Eliquis to consumers, increasing from about 47,000 beneficiaries in 2013 to 1.6 million beneficiaries in 2018 (an average annual increase of 104 percent). We observed a sharp increase in the use of Eliquis from 2013 to 2014—the same time the company nearly doubled its DTCA spending. Specifically, Part D beneficiary use grew from about 47,000 to 204,000 from 2013 to 2014, also reflecting the approval of the drug for additional indications.
Appendix II: Spending on Direct-to-Consumer Advertising, Medicare Beneficiary Use, and Medicare Spending for Eliquis
Eliquis is a “blood thinner” drug that is administered orally. It was approved by FDA on December 28, 2012, for use to reduce the risk of stroke and dangerous blood clots. Other similar drugs, such as Xarelto (a brand competitor), were available for use when Eliquis was approved. Unlike the drug Coumadin, which has been on the market for over 60 years, Eliquis and other similar drugs do not require monitoring with periodic blood tests. FDA approved the first generic version of Eliquis in December 2019. The company Bristol Myers Squibb manufactures Eliquis.
Appendix II: Spending on Direct-to-Consumer Advertising, Medicare Beneficiary Use, and Medicare Spending for Eliquis
Page 25 GAO-21-380 Drug Advertising
Consistent with the growth in the number of Medicare Part D beneficiaries using Eliquis, total Medicare Part D spending substantially increased from $45 million in 2013 to almost $5 billion in 2018 (an average annual increase of 157 percent).1 The growth in Medicare beneficiary use and spending that we observed for Eliquis over time occurred even as Bristol Myers Squibb began to reduce its level of DTCA spending. Further, the company increased the per unit price of Eliquis during the time period we reviewed, from $4.36 in 2013 to $7.00 in 2018.
Figure 2: Direct-to-Consumer Advertising Spending and Medicare Part D Use and Spending for Eliquis, 2013 through 2018
1When adjusted for inflation, this increase would be 152 percent.
Appendix II: Spending on Direct-to-Consumer Advertising, Medicare Beneficiary Use, and Medicare Spending for Eliquis
Page 26 GAO-21-380 Drug Advertising
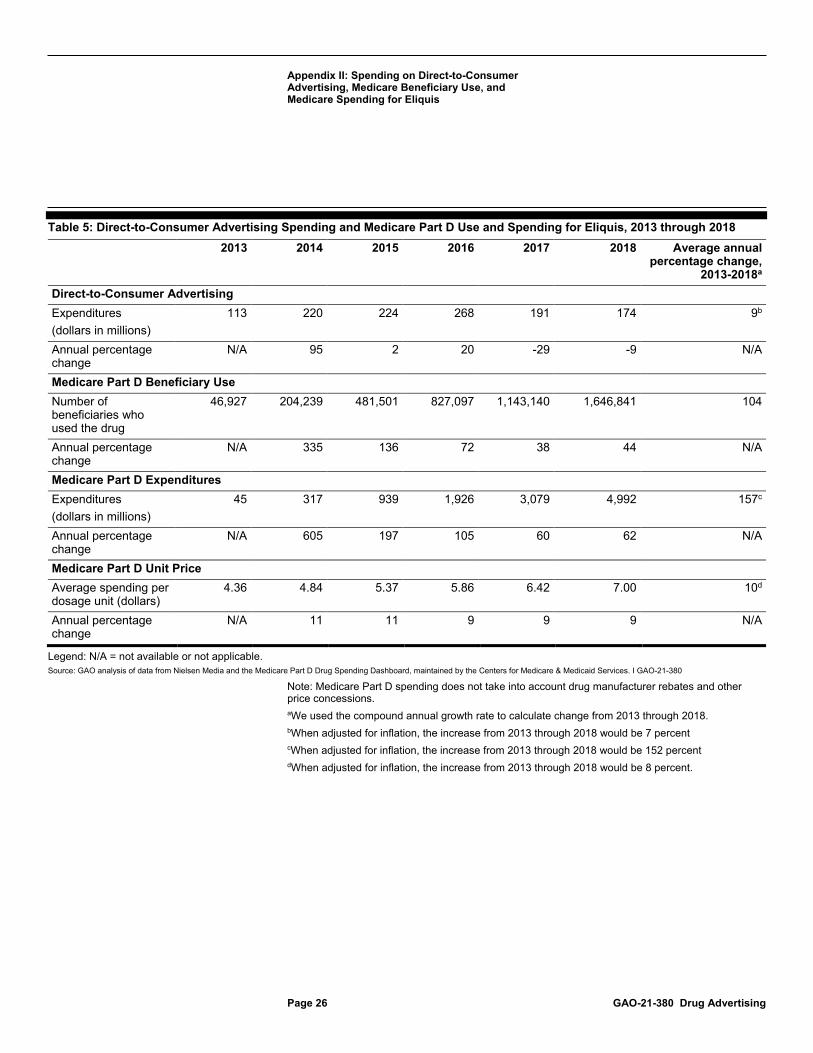
Table 5: Direct-to-Consumer Advertising Spending and Medicare Part D Use and Spending for Eliquis, 2013 through 2018 2013 2014 2015 2016 2017 2018 Average annual
percentage change, 2013-2018a
Direct-to-Consumer Advertising Expenditures (dollars in millions)
113 220 224 268 191 174 9b
Annual percentage change
N/A 95 2 20 -29 -9 N/A
Medicare Part D Beneficiary Use Number of beneficiaries who used the drug
46,927 204,239 481,501 827,097 1,143,140 1,646,841 104
Annual percentage change
N/A 335 136 72 38 44 N/A
Medicare Part D Expenditures Expenditures (dollars in millions)
45 317 939 1,926 3,079 4,992 157c
Annual percentage change
N/A 605 197 105 60 62 N/A
Medicare Part D Unit Price Average spending per dosage unit (dollars)
4.36 4.84 5.37 5.86 6.42 7.00 10d
Annual percentage change
N/A 11 11 9 9 9 N/A
Legend: N/A = not available or not applicable. Source: GAO analysis of data from Nielsen Media and the Medicare Part D Drug Spending Dashboard, maintained by the Centers for Medicare & Medicaid Services. I GAO-21-380
Note: Medicare Part D spending does not take into account drug manufacturer rebates and other price concessions. aWe used the compound annual growth rate to calculate change from 2013 through 2018. bWhen adjusted for inflation, the increase from 2013 through 2018 would be 7 percent cWhen adjusted for inflation, the increase from 2013 through 2018 would be 152 percent dWhen adjusted for inflation, the increase from 2013 through 2018 would be 8 percent.

Appendix III: Spending on Direct-to-Consumer Advertising, Medicare Beneficiary Use, and Medicare Spending for Namenda XR
Page 27 GAO-21-380 Drug Advertising
This appendix provides additional information on drug manufacturer spending on direct-to-consumer advertising (DTCA) for Namenda XR, its use among Medicare beneficiaries, and total Medicare spending, from 2013 through 2018.
Source: GAO summary of FDA information. I GAO-21-380
Our analysis of Namenda XR from 2013 through 2018 shows that Allergan increased DTCA spending from negligible spending in 2013 to a peak of about $76 million in 2015. (See fig. 3 and table 6.) While Namenda XR was approved by FDA in 2010, it was not available in the United States until 2013, the first year the company advertised the drug, according to AbbVie officials familiar with Allergan’s advertising of this drug. After 2016, DTCA spending declined to zero as of 2017. AbbVie officials told us that Allergan decreased its advertising of Namenda XR because it chose to reallocate advertising resources to Namzaric, a drug that FDA approved in 2014 to treat certain types of moderate to severe dementia in people with Alzheimer’s disease. Officials explained that the use of Namzaric (a once a day drug) reduces the multiple pill burden for patients who were concurrently taking Namenda XR and Aricept. Namzaric is a combination of both of these drugs, and the company highlighted this advantage in its advertising of Namzaric.1 Allergan spent about $91 million to advertise Namzaric to consumers from 2016 through 2018.
We found that Medicare Part D beneficiary use generally increased concurrently with Allergan’s DTCA campaign, increasing to a peak of 400,735 in 2015, and then declining in the following years as Allergan
1Namenda XR and Aricept belong to different drug classes and work in different ways to treat the symptoms of dementia that are found in patients with Alzheimer’s disease.
Appendix III: Spending on Direct-to-Consumer Advertising, Medicare Beneficiary Use, and Medicare Spending for Namenda XR
Namenda XR is a drug that is administered orally. It was approved by FDA on June 21, 2010, for use to treat moderate to severe dementia in people with Alzheimer’s disease. Namenda XR is a once-a-day extended release formulation of the drug Namenda, which has been on the market since 2003. The extended release formulation is intended to facilitate patient adherence to treatment as Namenda is administered twice daily. Prior to Namenda, the drug Aricept (manufactured by the company Eisai America, Inc.) had been available to treat mild to moderate dementia in patients with Alzheimer’s disease. FDA approved the first generic versions of Namenda XR in 2016, which became available in the market in 2018. The company Allergan manufactured Namenda and Namenda XR until AbbVie acquired Allergan in May 2020.
Appendix III: Spending on Direct-to-Consumer Advertising, Medicare Beneficiary Use, and Medicare Spending for Namenda XR
Page 28 GAO-21-380 Drug Advertising
discontinued its DTCA and instead promoted the alternative Namzaric. Our analysis shows that about 194,000 Medicare Part D beneficiaries used Namzaric from 2016 through 2018, which may have contributed to the decline in beneficiary use of Namenda XR. In addition, beneficiary use of the generic versions of Namenda XR in 2018 was likely another contributing factor.2
Total Medicare Part D spending on Namenda XR substantially increased with the growth in the number of Medicare Part D beneficiaries that used Namenda XR. Specifically, Part D spending on Namenda XR grew from $46 million in 2013 and peaked at about $1 billion in 2016.3 Following 2016, Medicare spending decreased with the decline in beneficiary use. Further, the company increased the per unit price of Namenda XR during the time period we reviewed, from $8.90 in 2013 to $14.26 in 2018 (an average annual increase of 10 percent).4
2We found that about 171,000 Medicare Part D beneficiaries used a generic version of Namenda XR in 2018.
3Beyond Allergan’s increase in DTCA spending on Namenda XR from 2013 through 2015, the increase in Medicare beneficiary use and spending that we observed during this time may have been accelerated, in part, by the February 2014 announcement of Allergan’s intention to withdraw Namenda from the market the following summer. This would have been well in advance of the July 2015 expiration of Namenda’s patent protection and the concurrent availability of generic versions of the drug. Medicare beneficiaries may have switched from Namenda to Namenda XR in 2014 in response to this announcement. However, as a result of injunctive relief obtained by the state of New York, Namenda remained on the market until the entry of generic versions. See, New York ex rel. Schneiderman v. Actavis PLC, 787 F.3d 638 (2nd Cir. 2015).
4When adjusted for inflation, this increase would be 8 percent.

Appendix III: Spending on Direct-to-Consumer Advertising, Medicare Beneficiary Use, and Medicare Spending for Namenda XR
Page 29 GAO-21-380 Drug Advertising
Figure 3: Direct-to-Consumer Advertising Spending and Medicare Part D Use and Spending for Namenda XR, 2013 through 2018

Appendix III: Spending on Direct-to-Consumer Advertising, Medicare Beneficiary Use, and Medicare Spending for Namenda XR
Page 30 GAO-21-380 Drug Advertising
Table 6: Direct-to-Consumer Advertising Spending and Medicare Part D Use and Spending for Namenda XR, 2013 through 2018
2013 2014 2015 2016 2017 2018
Average annual percentage change,
2013-2018a Direct-to-Consumer Advertising Expenditures (dollars in millions)
0.0023b 4.6 75.6 56.9 0.0 0.0 N/A
Annual percentage change
N/A 195,358 1,550 -25 N/A N/A N/A
Medicare Part D Beneficiary Use Number of beneficiaries who used the drug
63,483 327,729 400,735 367,739 283,539 164,313 21
Annual percentage change
N/A 416 22 -8 -23 -42 N/A
Medicare Part D Expenditures Expenditures (dollars in millions)
46 511 952 1,032 891 251 40c
Annual percentage change
N/A 1,003 86 8 -14 -72 N/A
Medicare Part D Unit Price Average spending per dosage unit (dollars)
8.90 9.93 10.85 12.04 13.14 14.26 10d
Annual percentage change
N/A 12 9 11 9 8 N/A
Legend: N/A = not available or not applicable. Source: GAO analysis of data from Nielsen Media and the Medicare Part D Drug Spending Dashboard, maintained by the Centers for Medicare & Medicaid Services. I GAO-21-380
Note: Medicare Part D spending does not take into account drug manufacturer rebates and other price concessions. aWe used the compound annual growth rate to calculate change from 2013 through 2018. bThe manufacturer spent $2,343 to advertise this drug in 2013. cWhen adjusted for inflation, the increase from 2013 through 2018 would be 38 percent. dWhen adjusted for inflation, the increase from 2013 through 2018 would be 8 percent.

Appendix IV: Spending on Direct-to-Consumer Advertising, Medicare Beneficiary Use, and Medicare Spending for Neulasta
Page 31 GAO-21-380 Drug Advertising
This appendix provides additional information on drug manufacturer spending on direct-to-consumer advertising (DTCA) for Neulasta, its use among Medicare beneficiaries, and total Medicare spending, from 2010 through 2018.
Source: GAO summary of FDA information. I GAO-21-380
Our analysis of Neulasta from 2010 through 2018 shows a notable increase in DTCA spending that began in 2015 and continued through 2018. Specifically, Amgen spent about $27 million to advertise Neulasta to consumers in 2015 and steadily increased this amount to about $74 million in 2018. (See fig. 4 and table 7.) Amgen officials told us the company expanded its advertising during this time to educate patients about Neulasta’s new delivery method, which FDA approved in December 2014. Amgen advertised Neulasta throughout the entire period we reviewed, and officials said there was already a considerable amount of patient awareness of Neulasta since it had been available for use since 2002. In comparison, officials indicated there was significantly less awareness of Neulasta’s new delivery method.
We did not find a concurrent increase in the use of Neulasta among Medicare Part B beneficiaries during the time Amgen expanded its DTCA campaign. That is, the number of Medicare Part B beneficiaries who used Neulasta slightly decreased from 2015 through 2018, from about 97,000 to 89,000.1 The availability of Fulphila (a biosimilar of Neulasta),
1We also examined the use of Neulasta among Medicare Part D beneficiaries. Similar to Part B, we found a decline in Part D beneficiary use from 2015 through 2018 as the number decreased from about 3,800 to 3,400.
Appendix IV: Spending on Direct-to-Consumer Advertising, Medicare Beneficiary Use, and Medicare Spending for Neulasta
Neulasta is an injectable biologic that FDA approved on January 31, 2002, for use to reduce the risk of a type of infection that is caused by chemotherapy. At the time of its approval, the biologic Neupogen was available for this purpose. Compared to Neupogen, Neulasta requires less frequent dosing, meaning patients required fewer injections and fewer doctor office visits. The company Amgen manufactures both Neulasta and Neupogen. In 2014, FDA approved a new delivery method for Neulasta that allows a patient to receive treatment at home. Known as the on-body injector, a health care provider applies the injector to the patient’s skin and it automatically delivers the dose about a day later. In 2018, FDA approved the first biosimilar to Neulasta.
Appendix IV: Spending on Direct-to-Consumer Advertising, Medicare Beneficiary Use, and Medicare Spending for Neulasta
Page 32 GAO-21-380 Drug Advertising
beginning in 2018, may have been a contributing factor to the decrease in Part B beneficiary use from 2017 to 2018.2
Total Medicare Part B spending on Neulasta steadily increased over the time period we reviewed, including prior to the time Amgen expanded its DTCA campaign, and as beneficiary use slightly declined. Specifically, Medicare Part B spending grew from about $834 million to $1.4 billion from 2010 through 2018 (an average annual increase of 6 percent) while beneficiary use decreased from about 96,000 to 89,000.3 Amgen increased the per unit price of Neulasta during this time, from about $2,400 in 2010 to over $4,100 in 2018 (an average annual increase of 7 percent).4
2We found that about 1,700 Medicare Part B beneficiaries used Fulphila in 2018, the year that FDA approved it for use.
3When adjusted for inflation, this increase would be 5 percent.
Amgen officials noted that since 2018, FDA’s approval of additional biosimilars to Neulasta has likely resulted in additional decreases in Part B beneficiary use of Neulasta and lower Medicare spending for these therapies.
Medicare Part D spending on Neulasta increased from 2011 through 2018, from about $28 million to $85 million as beneficiary use increased from about 2,200 to 3,400. Medicare Part D spending does not take into account drug manufacturer rebates and other price concessions.
4When adjusted for inflation, this increase would be 5 percent.

Appendix IV: Spending on Direct-to-Consumer Advertising, Medicare Beneficiary Use, and Medicare Spending for Neulasta
Page 33 GAO-21-380 Drug Advertising
Figure 4: Direct-to-Consumer Advertising Spending and Medicare Part B Use and Spending for Neulasta, 2010 through 2018

Appendix IV: Spending on Direct-to-Consumer Advertising, Medicare Beneficiary Use, and Medicare Spending for Neulasta
Page 34 GAO-21-380 Drug Advertising
Table 7: Direct-to-Consumer Advertising Spending and Medicare Part B Use and Spending for Neulasta, 2010 through 2018
2010 2011 2012 2013 2014 2015 2016 2017 2018
Average annual
percentage change,
2010-2018a Direct-to-Consumer Advertising
Expenditures (dollars in millions)
0.3 0.4 0.8 0.6 1.7 26.6 58.7 70.5 73.8 99b
Annual percentage change
N/A 23 115 -19 156 1498 121 20 5 N/A
Medicare Part B Beneficiary Use
Number of beneficiaries who used the drug
96,365 101,957 103,396 100,804 98,432 96,536 95,906 91,233 88,742 -1
Annual percentage change
N/A 6 1 -3 -2 -2 -1 -5 -3 N/A
Medicare Part B Expenditures Expenditures (dollars in millions)
834 972 1,060 1,098 1,173 1,259 1,374 1,400 1,371 6c
Annual percentage change
N/A 17 9 4 7 7 9 2 -2 N/A
Medicare Part B Unit Price
Average spending per dosage unit (dollars)
2,415 2,615 2,788 2,960 3,270 3,551 3,869 4,143 4,138 7d
Annual percentage change
N/A 8 7 6 10 9 9 7 0 N/A
Legend: N/A = not available or not applicable. Source: GAO analysis of data from Nielsen Media and the Medicare Part B Drug Spending Dashboard, maintained by the Centers for Medicare & Medicaid Services.│ GAO-21-380
aWe used the compound annual growth rate to calculate change from 2010 through 2018. bWhen adjusted for inflation, the increase from 2010 through 2018 would be 95 percent. cWhen adjusted for inflation, the increase from 2010 through 2018 would be 5 percent dWhen adjusted for inflation, the increase from 2010 through 2018 would be 5 percent.
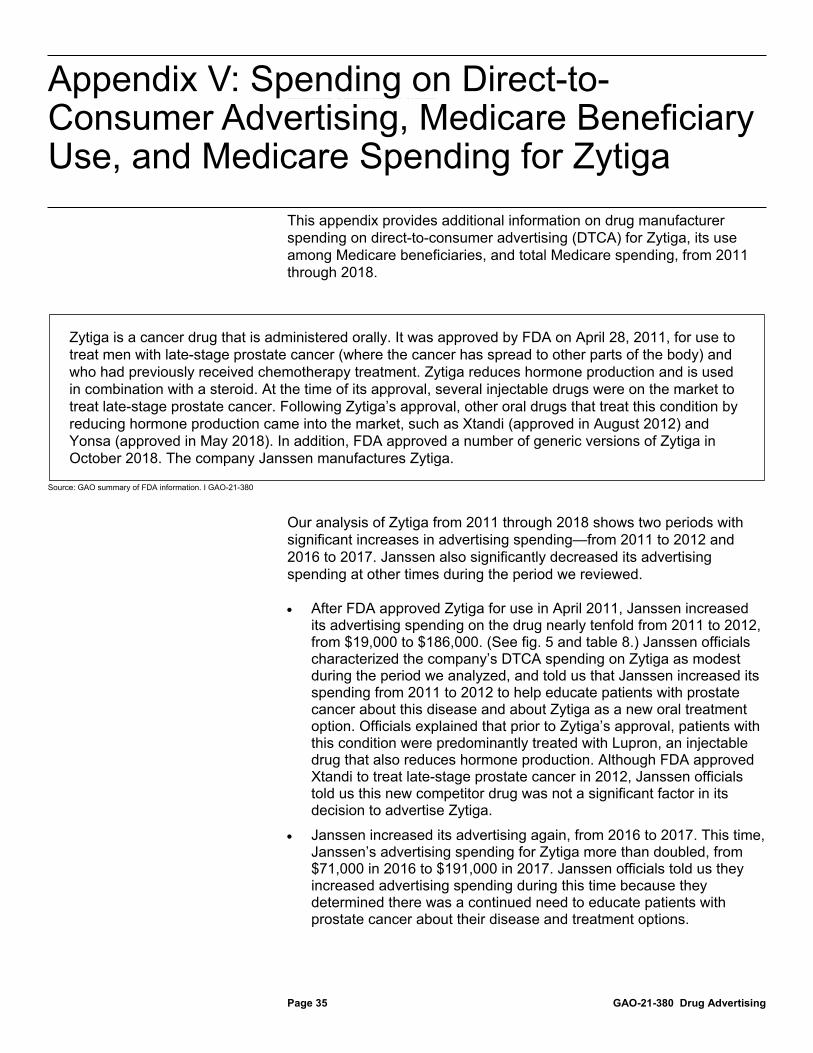
Appendix V: Spending on Direct-to-Consumer Advertising, Medicare Beneficiary Use, and Medicare Spending for Zytiga
Page 35 GAO-21-380 Drug Advertising
This appendix provides additional information on drug manufacturer spending on direct-to-consumer advertising (DTCA) for Zytiga, its use among Medicare beneficiaries, and total Medicare spending, from 2011 through 2018.
Source: GAO summary of FDA information. I GAO-21-380
Our analysis of Zytiga from 2011 through 2018 shows two periods with significant increases in advertising spending—from 2011 to 2012 and 2016 to 2017. Janssen also significantly decreased its advertising spending at other times during the period we reviewed.
• After FDA approved Zytiga for use in April 2011, Janssen increased its advertising spending on the drug nearly tenfold from 2011 to 2012, from $19,000 to $186,000. (See fig. 5 and table 8.) Janssen officials characterized the company’s DTCA spending on Zytiga as modest during the period we analyzed, and told us that Janssen increased its spending from 2011 to 2012 to help educate patients with prostate cancer about this disease and about Zytiga as a new oral treatment option. Officials explained that prior to Zytiga’s approval, patients with this condition were predominantly treated with Lupron, an injectable drug that also reduces hormone production. Although FDA approved Xtandi to treat late-stage prostate cancer in 2012, Janssen officials told us this new competitor drug was not a significant factor in its decision to advertise Zytiga.
• Janssen increased its advertising again, from 2016 to 2017. This time, Janssen’s advertising spending for Zytiga more than doubled, from $71,000 in 2016 to $191,000 in 2017. Janssen officials told us they increased advertising spending during this time because they determined there was a continued need to educate patients with prostate cancer about their disease and treatment options.
Appendix V: Spending on Direct-to-Consumer Advertising, Medicare Beneficiary Use, and Medicare Spending for Zytiga
Zytiga is a cancer drug that is administered orally. It was approved by FDA on April 28, 2011, for use to treat men with late-stage prostate cancer (where the cancer has spread to other parts of the body) and who had previously received chemotherapy treatment. Zytiga reduces hormone production and is used in combination with a steroid. At the time of its approval, several injectable drugs were on the market to treat late-stage prostate cancer. Following Zytiga’s approval, other oral drugs that treat this condition by reducing hormone production came into the market, such as Xtandi (approved in August 2012) and Yonsa (approved in May 2018). In addition, FDA approved a number of generic versions of Zytiga in October 2018. The company Janssen manufactures Zytiga.
Appendix V: Spending on Direct-to-Consumer Advertising, Medicare Beneficiary Use, and Medicare Spending for Zytiga
Page 36 GAO-21-380 Drug Advertising
• In contrast, Janssen significantly decreased its advertising spending at other times. For example, after 2017, we found that Janssen nearly ended its advertising of Zytiga as demonstrated by its low level of spending in 2018. Janssen officials explained that this decrease (100 percent) occurred because Zytiga was approaching the end of its product life cycle. FDA approved generic versions of Zytiga in 2018.
We found notable increases in Medicare Part D beneficiary use during the same two periods that Janssen significantly increased its advertising spending. However, overall, the number of Medicare Part D beneficiaries who used Zytiga increased by about 30 percent (an average annual increase) during the period we reviewed—from about 3,900 beneficiaries in 2011 to 24,000 in 2018—even when Janssen decreased its advertising spending.
• Medicare beneficiary use sharply increased from 3,936 in 2011 to 8,357 in 2012 (112 percent), when Janssen launched its initial advertising campaign and increased its DTCA spending nearly tenfold. Beneficiary use continued to increase in the next 2 years, although at a lower rate.1
• In addition, we found an 18 percent increase in the use of Zytiga among Medicare beneficiaries from 2016 to 2017—during the same time Janssen more than doubled its advertising spending.
• In contrast, we also found increases in beneficiary use when Janssen decreased its advertising spending. For example, from 2017 to 2018 beneficiary use increased by 27 percent as Janssen decreased its advertising spending on Zytiga by 100 percent. Because FDA approved Zytiga to treat an additional indication for late-stage prostate cancer in February 2018, part of this increase was likely related to the expanded use of Zytiga at this time.
Consistent with the growth in the number of Medicare Part D beneficiaries using Zytiga, total Medicare Part D spending substantially increased during the time of our review (even when Janssen reduced its advertising spending).
1In December 2012, Zytiga received FDA approval for an additional indication for late-stage prostate cancer that may have contributed to some of the increase in beneficiary use we observed during this time.

Appendix V: Spending on Direct-to-Consumer Advertising, Medicare Beneficiary Use, and Medicare Spending for Zytiga
Page 37 GAO-21-380 Drug Advertising
• Medicare Part D spending on Zytiga grew from $71 million in 2011 to about $1.5 billion in 2018 (an average annual increase of 54 percent).2
• Further, the company increased the per unit price of Zytiga during the time period we reviewed, from $43 in 2011 to almost $86 in 2018 (an average annual increase of 10 percent).3
Figure 5: Direct-to-Consumer Advertising Spending and Medicare Part D Use and Spending for Zytiga, 2011 through 2018
2When adjusted for inflation this increase would be 52 percent. Janssen officials noted that the approval of generic versions of Zytiga in 2018 led to an expansion in overall beneficiary use and a reduction in Medicare spending in 2019 for Zytiga and its generic versions.
3When adjusted for inflation, this increase would be 9 percent. The increase in per unit price is based on Zytiga’s 250 mg dose. In 2017 Janssen launched a 500 mg dose, and its per unit price was $159.58 in 2017 and $173.10 in 2018. Janssen officials explained that while the 500 mg dose has a higher per unit price than the 250 mg, it reduces patient dosing.

Appendix V: Spending on Direct-to-Consumer Advertising, Medicare Beneficiary Use, and Medicare Spending for Zytiga
Page 38 GAO-21-380 Drug Advertising
Table 8: Direct-to-Consumer Advertising Spending and Medicare Part D Use and Spending for Zytiga, 2011 through 2018
2011 2012 2013 2014 2015 2016 2017 2018
Average annual percentage
change, 2011-2018a
Direct-to-Consumer Advertising Expenditures (dollars in thousands)
19 186 92 52 <0.5 71 191 <0.5 -69b
Annual percentage change
N/A 877 -51 -43 -99 15,222 170 -100 N/A
Medicare Part D Beneficiary Use Number of beneficiaries that used the drug
3,936 8,357 14,191 17,044 16,965 16,249 19,114 24,289 30
Annual percentage change
N/A 112 70 20 -0.46 -4 18 27 N/A
Medicare Part D Expenditures Expenditures (dollars in millions)
71
224
470
707
790 823 936 1,476 54c
Annual percentage change
N/A 216 109 51 12 4 14 58 N/A
Medicare Part D Unit Priced Average spending per dosage unit (dollars)
43 49 54 60 66 71 79 86 10e
Annual percentage change
N/A 13 11 10 10 9 10 9 N/A
Legend: N/A = not available or not applicable. Source: GAO analysis of data from Nielsen Media and the Medicare Part D Drug Spending Dashboard, maintained by the Centers for Medicare & Medicaid Services. I GAO-21-380
Note: Medicare Part D spending does not take into account drug manufacturer rebates and other price concessions. aWe used the compound annual growth rate to calculate changes from 2011 through 2018. bWhen adjusted for inflation, the decrease from 2011 through 2018 would be -69 percent. cWhen adjusted for inflation, the increase from 2011 through 2018 would be 52 percent. dThe Medicare per unit price is based on Zytiga’s 250 mg dose. In 2017, Janssen launched a 500 mg dose and its per unit price was $159.58 in 2017 and $173.10 in 2018. The annual percentage change in per unit price for Zytiga’s 500 mg dose from 2017 to 2018 was 8 percent. eWhen adjusted for inflation, the increase from 2011 through 2018 would be 9 percent.

Page 39 GAO-21-380 Drug Advertising
John Dicken, (202) 512-7114 or [email protected].
In addition to the contact named above, Pam Dooley (Assistant Director), Jessica L. Preston (Analyst-in-Charge), Todd Anderson, Robert Copeland, Matt Green, and Carmen Rivera-Lowitt made key contributions to this report. Also contributing were Sam Amrhein, George Bogart, and Ethiene Salgado-Rodriguez.
Appendix VI: GAO Contact and Staff Acknowledgments
GAO Contact Staff Acknowledgments
(103777)
The Government Accountability Office, the audit, evaluation, and investigative arm of Congress, exists to support Congress in meeting its constitutional responsibilities and to help improve the performance and accountability of the federal government for the American people. GAO examines the use of public funds; evaluates federal programs and policies; and provides analyses, recommendations, and other assistance to help Congress make informed oversight, policy, and funding decisions. GAO’s commitment to good government is reflected in its core values of accountability, integrity, and reliability.
The fastest and easiest way to obtain copies of GAO documents at no cost is through our website. Each weekday afternoon, GAO posts on its website newly released reports, testimony, and correspondence. You can also subscribe to GAO’s email updates to receive notification of newly posted products.
The price of each GAO publication reflects GAO’s actual cost of production and distribution and depends on the number of pages in the publication and whether the publication is printed in color or black and white. Pricing and ordering information is posted on GAO’s website, https://www.gao.gov/ordering.htm.
Place orders by calling (202) 512-6000, toll free (866) 801-7077, or TDD (202) 512-2537.
Orders may be paid for using American Express, Discover Card, MasterCard, Visa, check, or money order. Call for additional information.
Connect with GAO on Facebook, Flickr, Twitter, and YouTube. Subscribe to our RSS Feeds or Email Updates. Listen to our Podcasts. Visit GAO on the web at https://www.gao.gov.
Contact FraudNet:
Website: https://www.gao.gov/about/what-gao-does/fraudnet
Automated answering system: (800) 424-5454 or (202) 512-7700
Orice Williams Brown, Managing Director, [email protected], (202) 512-4400, U.S. Government Accountability Office, 441 G Street NW, Room 7125, Washington, DC 20548
Chuck Young, Managing Director, [email protected], (202) 512-4800 U.S. Government Accountability Office, 441 G Street NW, Room 7149 Washington, DC 20548
Stephen J. Sanford, Acting Managing Director, [email protected], (202) 512-4707 U.S. Government Accountability Office, 441 G Street NW, Room 7814, Washington, DC 20548
GAO’s Mission
Obtaining Copies of GAO Reports and Testimony Order by Phone
Connect with GAO
To Report Fraud, Waste, and Abuse in Federal Programs
Congressional Relations
Public Affairs
Strategic Planning and External Liaison
Please Print on Recycled Paper.