GAO-02-412 Veterans' Benefits: VBA's Efforts to Implement ...
PRESCRIPTION DRUGS
Department of Veterans Affairs Paid About Half as Much as Medicare Part D for Selected Drugs in 2017
Report to the Ranking Member, Committee on the Budget, U.S. Senate
December 2020
GAO-21-111
United States Government Accountability Office
United States Government Accountability Office
Highlights of GAO-21-111, a report to the Ranking Member, Committee on the Budget, U.S. Senate
December 2020
PRESCRIPTION DRUGS Department of Veterans Affairs Paid About Half as Much as Medicare Part D for Selected Drugs in 2017
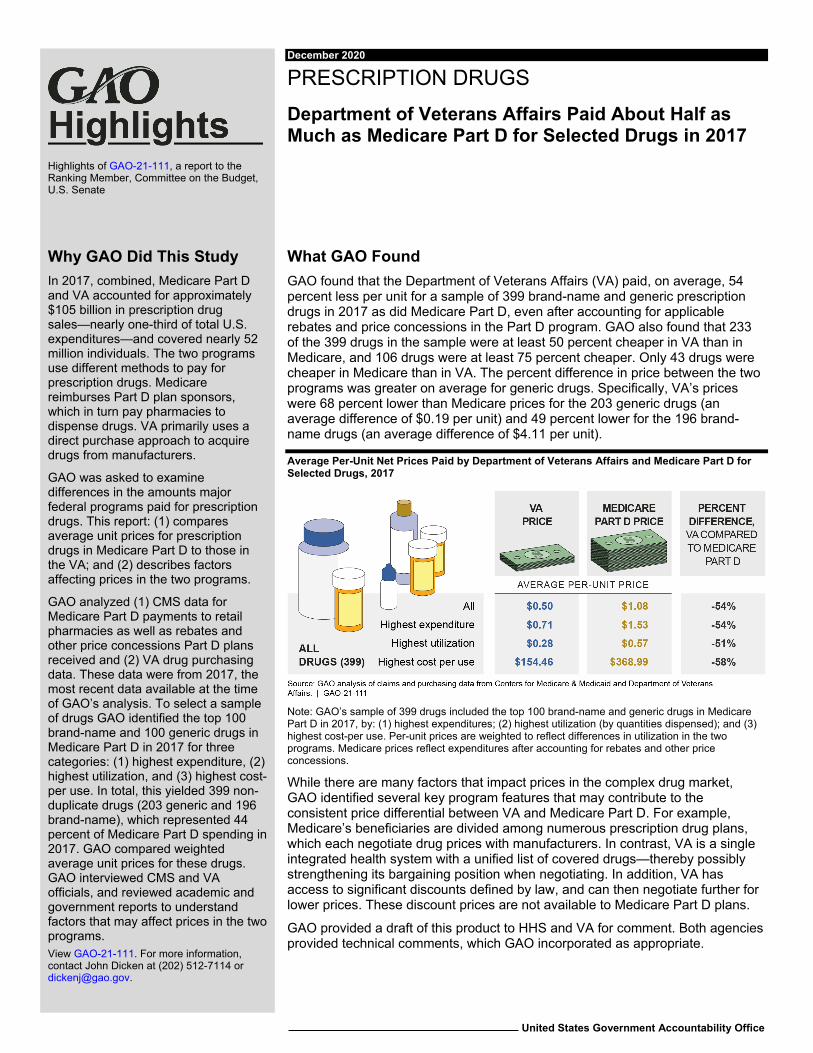
What GAO Found GAO found that the Department of Veterans Affairs (VA) paid, on average, 54 percent less per unit for a sample of 399 brand-name and generic prescription drugs in 2017 as did Medicare Part D, even after accounting for applicable rebates and price concessions in the Part D program. GAO also found that 233 of the 399 drugs in the sample were at least 50 percent cheaper in VA than in Medicare, and 106 drugs were at least 75 percent cheaper. Only 43 drugs were cheaper in Medicare than in VA. The percent difference in price between the two programs was greater on average for generic drugs. Specifically, VA’s prices were 68 percent lower than Medicare prices for the 203 generic drugs (an average difference of $0.19 per unit) and 49 percent lower for the 196 brand-name drugs (an average difference of $4.11 per unit).
Average Per-Unit Net Prices Paid by Department of Veterans Affairs and Medicare Part D for Selected Drugs, 2017
Note: GAO’s sample of 399 drugs included the top 100 brand-name and generic drugs in Medicare Part D in 2017, by: (1) highest expenditures; (2) highest utilization (by quantities dispensed); and (3) highest cost-per use. Per-unit prices are weighted to reflect differences in utilization in the two programs. Medicare prices reflect expenditures after accounting for rebates and other price concessions.
While there are many factors that impact prices in the complex drug market, GAO identified several key program features that may contribute to the consistent price differential between VA and Medicare Part D. For example, Medicare’s beneficiaries are divided among numerous prescription drug plans, which each negotiate drug prices with manufacturers. In contrast, VA is a single integrated health system with a unified list of covered drugs—thereby possibly strengthening its bargaining position when negotiating. In addition, VA has access to significant discounts defined by law, and can then negotiate further for lower prices. These discount prices are not available to Medicare Part D plans.
GAO provided a draft of this product to HHS and VA for comment. Both agencies provided technical comments, which GAO incorporated as appropriate.
View GAO-21-111. For more information, contact John Dicken at (202) 512-7114 or [email protected].
Why GAO Did This Study In 2017, combined, Medicare Part D and VA accounted for approximately $105 billion in prescription drug sales—nearly one-third of total U.S. expenditures—and covered nearly 52 million individuals. The two programs use different methods to pay for prescription drugs. Medicare reimburses Part D plan sponsors, which in turn pay pharmacies to dispense drugs. VA primarily uses a direct purchase approach to acquire drugs from manufacturers.
GAO was asked to examine differences in the amounts major federal programs paid for prescription drugs. This report: (1) compares average unit prices for prescription drugs in Medicare Part D to those in the VA; and (2) describes factors affecting prices in the two programs.
GAO analyzed (1) CMS data for Medicare Part D payments to retail pharmacies as well as rebates and other price concessions Part D plans received and (2) VA drug purchasing data. These data were from 2017, the most recent data available at the time of GAO’s analysis. To select a sample of drugs GAO identified the top 100 brand-name and 100 generic drugs in Medicare Part D in 2017 for three categories: (1) highest expenditure, (2) highest utilization, and (3) highest cost-per use. In total, this yielded 399 non-duplicate drugs (203 generic and 196 brand-name), which represented 44 percent of Medicare Part D spending in 2017. GAO compared weighted average unit prices for these drugs. GAO interviewed CMS and VA officials, and reviewed academic and government reports to understand factors that may affect prices in the two programs.

Page i GAO-21-111 Prescription Drugs
Letter 1
Background 3 VA Paid Half as Much on Average as Medicare Part D for
Selected Drugs in 2017 5 Program Structure, Formulary Management, and Other Factors
May Contribute to Price Differences between Medicare Part D and VA 9
Agency Comments 13
Appendix I Objectives, Scope, and Methodology 15
Appendix II GAO Contact and Staff Acknowledgments 18
Table
Table 1. Average Per-Unit Prices for Selected Drugs, by CMS Designated Class, 2017 12
Figures
Figure 1. Average Per-Unit and Percentage Differences in Prices Paid by Department of Veterans Affairs Relative to Medicare Part D for Selected Drugs, 2017 6
Figure 2. Percentage Differences in Per-Unit Price for All Selected Drugs, Overall and by Brand-name and Generic Status, Department of Veterans Affairs Relative to Medicare Part D, 2017 8
Contents

Page ii GAO-21-111 Prescription Drugs
Abbreviations CMS Centers for Medicare & Medicaid Services HHS Department of Health and Human Services PBM pharmacy benefit manager VA Department of Veterans Affairs
This is a work of the U.S. government and is not subject to copyright protection in the United States. The published product may be reproduced and distributed in its entirety without further permission from GAO. However, because this work may contain copyrighted images or other material, permission from the copyright holder may be necessary if you wish to reproduce this material separately.
Page 1 GAO-21-111 Prescription Drugs
441 G St. N.W. Washington, DC 20548
December 15, 2020
The Honorable Bernard Sanders Ranking Member Committee on the Budget United States Senate
Dear Mr. Sanders:
Medicare Part D and the Department of Veterans Affairs (VA) account for a substantial portion of U.S. prescription drug expenditures.1 In 2017, the two programs combined accounted for approximately $105 billion in retail prescription drug sales—nearly one-third of total U.S. expenditures—and covered nearly 52 million individuals.2 The two programs use different methods to pay for prescription drugs based on program design differences and statutory authorities. Specifically, Medicare Part D pays pharmacies by reimbursing plan sponsors, which are in turn responsible for paying retail pharmacies to dispense drugs to beneficiaries. VA primarily uses a direct purchase approach to acquire drugs directly from manufacturers which are then dispensed to eligible veterans.
Given the substantial level of federal spending on prescription drugs, you requested that we compare prices paid for prescription drugs across federal programs. In this report, we
1. compare prices paid by Medicare Part D and VA in 2017; and 2. describe factors potentially contributing to differences in these prices.
1Part D is an optional outpatient prescription drug benefit offered by Medicare—the federally financed health insurance program for persons aged 65 and over, individuals under age 65 with certain disabilities, and individuals with end-stage renal disease. (Medicare also has a drug benefit available under Part B—primarily for physician administered drugs—which is outside the scope of this report.) VA health care—including its prescription drug program—is for veterans who served in active military duty and who were discharged or released under conditions other than dishonorable.
2National Health Expenditures Data, http://www.cms.gov/Research-Statistics-Data-and-Systems/Statistics-Trends-and-Reports/NationalHealthExpendData/NationalHealthAccountsHistorical, accessed 9/16/2020. Retail prescription drug purchases occur in pharmacies, drug stores, supermarkets, and mail-order establishments.
Letter
Page 2 GAO-21-111 Prescription Drugs
To compare prices paid for prescription drugs by Medicare Part D and VA, we selected a sample of prescription drugs—hereafter referred to as “the basket”—and then calculated unit prices paid by each of these two programs.3 To select the basket of drugs, we used Medicare data since the Part D program represents the vast majority of federal drug spending compared to VA. We used prescription drug event data collected by the Centers for Medicare & Medicaid Services (CMS) to determine brand-name and generic drug gross expenditure and utilization levels (i.e., quantity of drugs dispensed) for Medicare Part D in 2017—the most recent data available at the time of our analysis.4 We combined the prescription drug event data, representing Medicare Part D plan payments to retail pharmacies for drugs, with 2017 data on direct and indirect remuneration—obtained from CMS—representing applicable rebates and other price concessions paid by manufacturers or others to Part D plans.
We identified, for 2017, the top 100 brand-name and 100 generic drugs in Medicare Part D for each of the following three categories: the highest expenditures; the highest utilization (based on number of units dispensed); and the highest expenditures per unit (excluding any drugs with fewer than 50 associated claims). We subtracted all rebates and concessions from gross expenditures to yield net expenditures. We then analyzed 2017 VA expenditures and utilization for these same drugs, using VA purchasing data that reflect drug prices following all negotiations.5 Our final basket contained 399 non-duplicate drugs (203
3Throughout this report, unit prices refer to net prices—prices after accounting for any applicable rebates and other price concessions.
4Plan sponsors submit a prescription drug event record to CMS each time a beneficiary obtains a prescription drug. The record contains information on the beneficiary receiving the drug, the price paid by the plan sponsor to the pharmacy, and applicable beneficiary cost-sharing. We used information from Red Book, a compendium published by Truven Health Analytics, to identify drugs as brand-name or generic. For all Part D drugs, we calculated gross expenditures based on a drug’s price, which includes ingredient costs, dispensing fees, sales taxes, and applicable vaccine administration fees. We excluded some claims, such as those paid by third parties outside of Medicare. For all such exclusions, see Appendix I.
5Such negotiations may yield price concessions. VA’s purchasing data includes information on all drugs purchased for patients in VA’s medical centers, consolidated mail outpatient pharmacy, and in the Community Care setting. Similar to what we did with the Part D data, we excluded any drugs with fewer than 50 units dispensed.
Page 3 GAO-21-111 Prescription Drugs
generic and 196 brand-name).6 Lastly, we compared weighted average unit prices of Part D and VA for each category of drugs—all drugs, brand-name drugs, generic drugs.7 For all of the data we analyzed, we took steps to assess their reliability, including interviewing knowledgeable officials, conducting data checks for outliers and anomalies, and comparing to published information when available. After taking these steps, we determined that the data were sufficiently reliable for the purposes of our reporting objectives. Appendix I provides additional details on our methodology.
To describe factors potentially contributing to price differences across the two programs, we reviewed government reports, academic literature, past GAO work, and interviewed agency officials from both CMS and VA.
We conducted this performance audit from January 2019 to December 2020 in accordance with generally accepted government auditing standards. Those standards require that we plan and perform the audit to obtain sufficient, appropriate evidence to provide a reasonable basis for our findings and conclusions based on our audit objectives. We believe that the evidence obtained provides a reasonable basis for our findings based on our audit objectives.
In 2017, Medicare Part D covered 42.5 million individuals and had an estimated $93.9 billion in expenditures. These expenditures include payments to private insurers—known as plan sponsors—for offering drug coverage that reimburses retail pharmacies (including mail order pharmacies) for dispensing drugs to beneficiaries. Plan sponsors submit bids yearly to CMS. The bids include the sponsors’ estimates of the expected cost to provide prescription drug coverage to beneficiaries, including negotiated drug costs, administrative costs, and anticipated profits. As such, CMS pays plan sponsors prospectively to provide drug
6Throughout our analysis, we refer to drugs based on unique combinations of active ingredient, strength, dosage form, and route of administration, which we identified using Red Book.
7Weights are based on the proportion each drug accounts for in the total quantity of drugs in each category. Because the weights are based on proportional utilization, the indexes allow us to compare per-unit prices regardless of the underlying quantities of drugs utilized in each program. In addition to analyzing price differences between brand-name drugs and generic drugs, we also compared weighted average unit prices of drugs that, based on their therapeutic classes, were part of a Medicare Part D protected class.
Background Medicare Part D
Page 4 GAO-21-111 Prescription Drugs
coverage for beneficiaries, and then annually reconciles payments at the end of the year based on actual transactions. The CMS payments are intended to cover several facets of cost, including, for example, dispensing costs.
Medicare beneficiaries may receive Part D coverage through either stand-alone prescription drug plans that supplement traditional Medicare, or through Medicare Advantage plans (Part C) that generally must cover all Medicare hospital and outpatient medical benefits and usually include Part D drug coverage. These plans may differ in the premiums charged to CMS and beneficiaries; beneficiary cost-sharing (e.g., deductibles); formularies—the list of covered drugs; pharmacies available to beneficiaries for filling prescriptions; and the drug prices, rebates, and other price concessions negotiated with manufacturers and pharmacies.8 Most sponsors use pharmacy benefit managers (PBM) to help manage drug benefits and negotiate with drug manufacturers to obtain rebates and other price concessions, while other sponsors perform these activities themselves or in a partnership with a PBM. Manufacturers pay the rebates to plan sponsors and PBMs after the drug is dispensed by the pharmacy.
Although Medicare Part D plans can generally design their own formularies, plan sponsors are required to provide access to all, or substantially all, drugs covered under certain therapeutic classes of drugs, known as Medicare protected classes, unless an exception applies.9 Plans are limited in the formulary restrictions they can apply to these drugs. Additionally, CMS generally requires plan sponsors to provide coverage for at least two drugs in each therapeutic class and
8A deductible is a fixed dollar amount that beneficiaries must pay before coverage takes effect. Beneficiary cost-sharing may also include a flat amount (copayment) or a percentage of the drug’s costs (coinsurance).
9The protected classes are: (1) anticonvulsants, (2) antidepressants, (3) antineoplastics, (4) antipsychotics, (5) antiretrovirals, and (6) immunosuppressants for the treatment of transplant. Sponsors are required to include all covered Part D drugs in these statutorily specified categories, unless an exception applies, until such time as the Secretary identifies categories of clinical concern through notice and comment rulemaking. 42 U.S.C. § 1395w-104(b)(3)(G). The Secretary has not promulgated final regulations establishing categories and classes of clinical concern, so the protected classes remain those categories and classes that are listed in statute. See 42 C.F.R. § 423.120(b)(2)(v) (2019).

Page 5 GAO-21-111 Prescription Drugs
limits plans from making mid-year formulary restrictions except in certain circumstances.10
VA provides prescription drug coverage for approximately 9 million enrolled veterans through its outpatient medical clinics and mail order pharmacy program—the Consolidated Mail Outpatient Pharmacy, or CMOP.11 In fiscal year 2017, VA’s prescription drug spending—for outpatient care—totaled about $4.8 billion, according to VA officials.12 VA has significant control over its prescription drug program—a singular purchaser with a unified national formulary. In general, medications must be prescribed by a VA provider, filled at a VA pharmacy, and listed on the national formulary. VA also fills prescriptions from authorized non-VA providers (i.e., in the Community Care setting). VA may provide nonformulary drugs in cases of medical necessity.
VA primarily uses a direct purchase approach to acquire drugs. VA uses the pharmaceutical prime vendor program—a single vendor awarded by contract—to acquire drugs directly from manufacturers for distribution through its facilities.13 After distributing the drugs, the prime vendor does a “charge-back” to the manufacturer to obtain the difference between its purchase price and the VA negotiated sales price. As such, VA’s prices are generally not subject to markups, and its prices do not include costs for storage, overhead, or dispensing.
In 2017, VA, on average, paid less per unit than did Medicare Part D across the combined basket of brand-name and generic drugs in our sample and within all subcategories we analyzed. Specifically, for the combined basket of 399 brand-name and generic drugs, VA paid an average 54 percent less per unit than Medicare Part D. Additionally, VA paid between 51 and 58 percent less than Medicare Part D for each of the three subcategories of drugs we used to select our combined basket—highest total expenditures, highest utilization, and highest cost-
10See 42 C.F.R. §§ 423.120(b)(2)(i), (6) (2019).
11VA provides approximately 80 percent of all outpatient prescriptions via mail order utilizing the Consolidated Mail Outpatient Pharmacy, a system of seven automated pharmacies.
12Total drug spending—including that for inpatient care—was $7 billion in fiscal year 2017.
13According to VA officials, the prime vendor gives VA additional discounts that further lower the negotiated drug prices. We discuss discounts and negotiations—for both VA and the Part D program—later in this report.
Department of Veterans Affairs
VA Paid Half as Much on Average as Medicare Part D for Selected Drugs in 2017
Page 6 GAO-21-111 Prescription Drugs
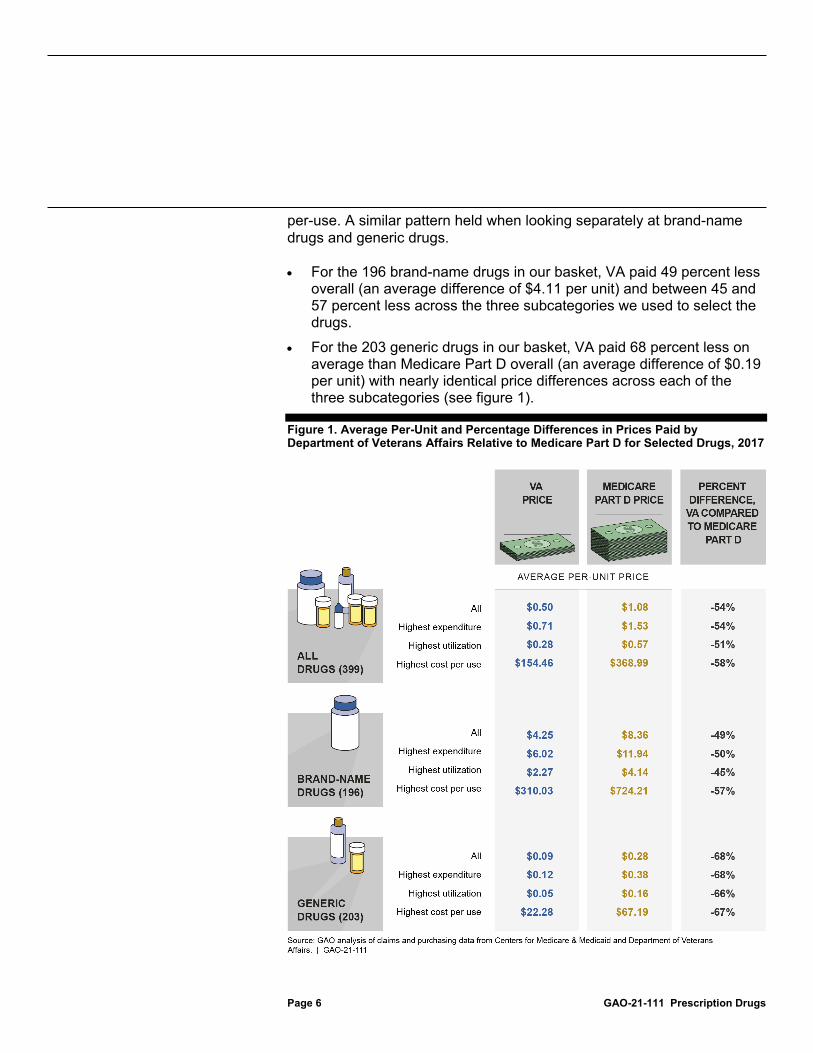
per-use. A similar pattern held when looking separately at brand-name drugs and generic drugs.
• For the 196 brand-name drugs in our basket, VA paid 49 percent less overall (an average difference of $4.11 per unit) and between 45 and 57 percent less across the three subcategories we used to select the drugs.
• For the 203 generic drugs in our basket, VA paid 68 percent less on average than Medicare Part D overall (an average difference of $0.19 per unit) with nearly identical price differences across each of the three subcategories (see figure 1).
Figure 1. Average Per-Unit and Percentage Differences in Prices Paid by Department of Veterans Affairs Relative to Medicare Part D for Selected Drugs, 2017

Page 7 GAO-21-111 Prescription Drugs
Note: To identify drugs for this analysis, we used Medicare data for calendar year 2017 to determine the 100 drugs with the highest cost (by total net expenditures); the 100 drugs with the highest utilization (by quantities dispensed), and the 100 drugs that had the highest costs per-use. In total, we analyzed 399 nonduplicate drugs. Per-unit prices are weighted by the proportion each drug accounts for in the overall quantity of drugs for each defined group (i.e., all drugs, brand-name drugs, generic drugs). Medicare prices reflect expenditures after accounting for rebates and other price concessions.
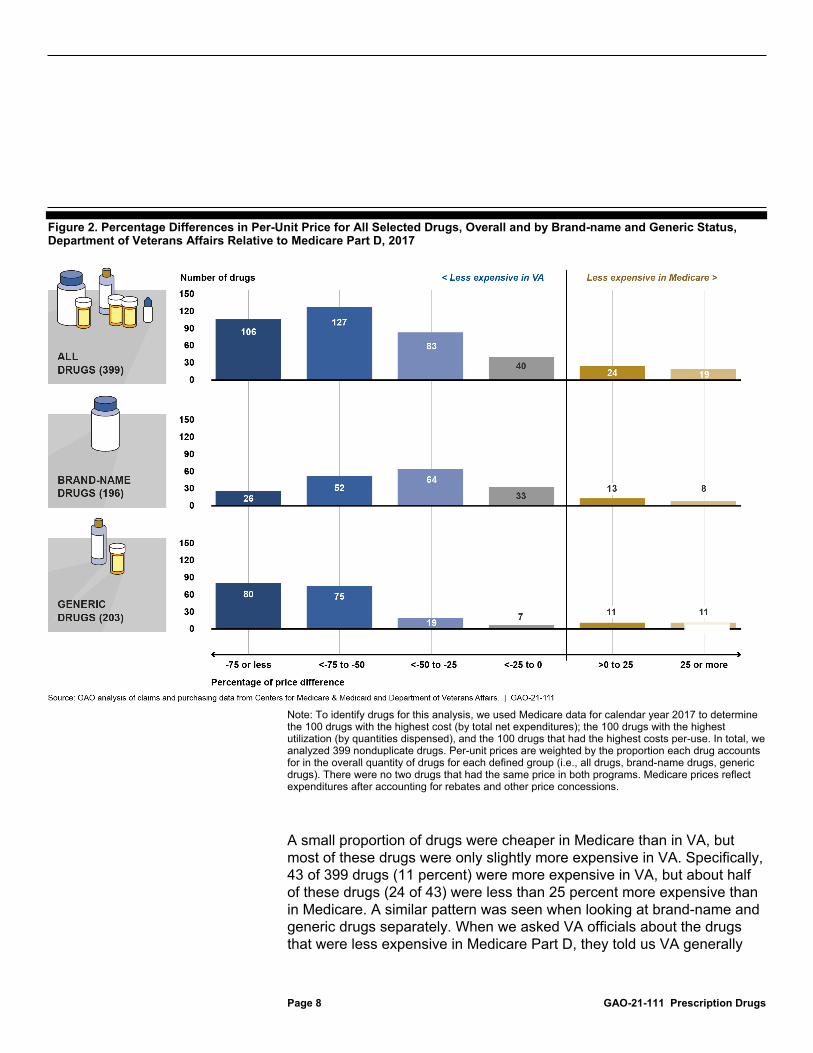
A large majority of the individual drugs in the combined brand-name and generic drug basket were at least 25 percent cheaper in VA than in Medicare, and a slight majority were at least 50 percent cheaper. Specifically, 316 of the 399 drugs (79 percent) were at least 25 percent cheaper in VA than in Medicare Part D, while 233 out of the 399 drugs (58 percent) were at least 50 percent cheaper, as shown in figure 2. This pattern was similar when looking at brand-name and generic drugs separately, with 142 of 196 brand-name drugs (72 percent) and 174 of 203 generic drugs (86 percent) being at least 25 percent cheaper in VA. Generic drugs in particular saw the highest proportion of its drugs (80 of 203 drugs) being at least 75 percent cheaper in VA than in Medicare.
Page 8 GAO-21-111 Prescription Drugs
Figure 2. Percentage Differences in Per-Unit Price for All Selected Drugs, Overall and by Brand-name and Generic Status, Department of Veterans Affairs Relative to Medicare Part D, 2017
Note: To identify drugs for this analysis, we used Medicare data for calendar year 2017 to determine the 100 drugs with the highest cost (by total net expenditures); the 100 drugs with the highest utilization (by quantities dispensed), and the 100 drugs that had the highest costs per-use. In total, we analyzed 399 nonduplicate drugs. Per-unit prices are weighted by the proportion each drug accounts for in the overall quantity of drugs for each defined group (i.e., all drugs, brand-name drugs, generic drugs). There were no two drugs that had the same price in both programs. Medicare prices reflect expenditures after accounting for rebates and other price concessions.
A small proportion of drugs were cheaper in Medicare than in VA, but most of these drugs were only slightly more expensive in VA. Specifically, 43 of 399 drugs (11 percent) were more expensive in VA, but about half of these drugs (24 of 43) were less than 25 percent more expensive than in Medicare. A similar pattern was seen when looking at brand-name and generic drugs separately. When we asked VA officials about the drugs that were less expensive in Medicare Part D, they told us VA generally

Page 9 GAO-21-111 Prescription Drugs
used alternate strengths or dose forms of the same drug, or, a therapeutic alternative. VA officials stated that these alternatives were often less expensive than the corresponding drugs in Medicare Part D.
The consistent differences we found between Medicare Part D and VA prices illustrate how the programs’ differing structures and authorities contribute to differing prices for the same drugs in our study. However, it is important to acknowledge that the prescription drug market is complex, so many factors may affect drug prices in Medicare Part D plans and in VA. For example, there may be differences in utilization practices between the programs based on the diverse needs of their beneficiary populations and the availability of therapeutic alternatives to a given drug. Still, we have identified the following as key factors that may help explain the consistent price differences described above.14
• Program Size. Larger programs may have increased leverage to negotiate lower drug price. While Medicare Part D is a much larger program overall than VA, the unified structure of VA may provide additional leverage in negotiations with drug manufacturers. Medicare Part D’s 42.5 million beneficiaries are divided among numerous prescription drug plans. The Part D plans compete for enrollees, and therefore have the incentive to offer benefits—including lower drug prices and competitive premiums. The larger a plan’s market share, the more leverage it may have for obtaining favorable drug prices on behalf of its enrollees. In December 2017, the largest plan had approximately 5.6 million enrollees, with most having enrollment of under 1 million individuals.15 In contrast to Medicare Part D, VA represents a single unified plan, capable of acting for all its enrolled veterans; thus, in effect, it had an enrollment of 9 million individuals in
14See, for example, GAO, Medicare Part D: Use of Pharmacy Benefit Managers and Efforts to Manage Drug Expenditures and Utilization, GAO-19-498 (Washington, D.C.: July 15, 2019); Prescription Drugs: Comparison of DOD, Medicaid, and Medicare Part D Retail Reimbursement Prices, GAO-14-578 (Washington, D.C.: June 30, 2014); Prescription Drugs: Comparison of DOD and VA Direct Purchase Prices, GAO-13-358 (Washington, D.C.: Apr. 19, 2013); and Prescription Drugs: Overview of Approaches to Control Prescription Drug Spending in Federal Programs, GAO-09-819T (Washington, D.C.: June 24, 2009).
15CMS, “Monthly Enrollment by Contract: 2017-12,” Medicare Advantage/Part D Contract and Enrollment Data, accessed August 26, 2020 from https://www.cms.gov/Research-Statistics-Data-and-Systems/Statistics-Trends-and-Reports/MCRAdvPartDEnrolData/Monthly-Enrollment-by-Contract-Items/Enrollment-by-Contract-2017-12.
Program Structure, Formulary Management, and Other Factors May Contribute to Price Differences between Medicare Part D and VA
Page 10 GAO-21-111 Prescription Drugs
2017. Consequently, VA’s large purchasing volume may strengthen its bargaining position when negotiating.16
• Fixed Discounts and Negotiations.VA has access to statutory discounts on its drug purchases—not available to Part D plans. The two programs have very different authorities to bargain and negotiate with drug manufacturers and other market participants. VA has access to a number of prices when purchasing drugs—including: • Federal Supply Schedule prices that are available to all direct
federal purchasers and are intended to be no more than the prices manufacturers charge their most-favored nonfederal customers under comparable terms and conditions; and
• “Big Four” prices that are available to four federal agencies—including VA—and are 24 percent lower than the average non-federal prices paid to manufacturers.
VA receives additional discounts if drug prices rise faster than general inflation (which prices often have done).17 Furthermore, VA may be able to negotiate further price discounts with drug manufacturers for the drugs included on its formulary. In contrast, the Department of Health and Human Services (HHS)—including CMS—is prohibited from negotiating drug prices on behalf of all Medicare Part D plans.18 CMS does not have access to discounted price schedules such as the federal supply schedule. Therefore, Part D drug prices—including rebates and other concessions—are determined through private negotiations between the many plans (or their PBMs) and suppliers.19 Our analysis showed that, of the 43 drugs that were cheaper in Medicare, 26 drugs were cheaper only
16Additionally, in the Part D program, the larger a plan’s market share, the more leverage it may have for obtaining favorable drug prices on behalf of its enrollees. Nonetheless, as we note, currently the largest Part D plans have fewer enrollees than does VA.
17See 38 U.S.C. § 8126.
18The Medicare Part D statute specifically states that the Secretary of HHS may not interfere with negotiations between sponsors and drug manufacturers and pharmacies. See 42 U.S.C. § 1395w-111(i).
19In the Medicare Part D program, rebates do not directly affect the price beneficiaries pay at the pharmacy, which is based on the price before any price concessions are applied. However, the presence of a rebate may affect beneficiaries’ cost-sharing in other ways, such as by placing the drug on a preferred formulary tier with lower cost sharing in exchange for the rebate. Or, plan sponsors may use rebates to help offset the growth in drug costs, helping lower premiums for beneficiaries. See GAO-19-498.
Page 11 GAO-21-111 Prescription Drugs
after accounting for rebates. For example, for one anti-heartburn drug, manufacturer rebates lowered the price of the drug by over 70 percent. As a result, this drug went from being almost twice as expensive in Medicare before rebates—as compared to VA—to approximately 55 percent less expensive in Medicare, after rebates.20 It is important to note that even if HHS were granted authority to negotiate drug prices, the effectiveness of such negotiations would be contingent, at least in part, on Part D plans having more leverage to steer beneficiaries to use certain preferred drugs and away from nonpreferred drugs. For example, VA officials noted that their ability to negotiate drug prices with manufacturers is effective in part because manufacturers know that VA is able to directly steer use of drugs through its health care system. However, while Medicare’s statute allows plans to use formularies and benefit design to vary beneficiary cost-sharing levels for preferred or nonpreferred drugs, beneficiaries can often choose among competing plans that are more inclusive of drugs they anticipate using.
• Restrictive or Broad Formularies. Inclusion of drugs on a program’s formulary is another way to control the cost of prescription drugs, and can be an important bargaining tool for both VA and Part D.21 While VA and the individual Part D plans establish their drug formularies, VA has more direct control over the medications that are prescribed from its formulary because it primarily covers medications for eligible beneficiaries through prescriptions written by its own providers. In addition, as discussed earlier, VA has a single national formulary for all VA providers. As such, VA can steer utilization toward a limited number of drugs within a given therapeutic class.
Medicare Part D plans, on the other hand, generally have broad networks of pharmacies and as such may have broader formularies
20Our past work found that rebates and other price concessions paid to Part D plan sponsors and PBMs grew faster than Part D expenditures from 2014 through 2016. Specifically, gross expenditures (the amount paid to pharmacies by plan sponsors, or by the PBM on the sponsor’s behalf, and by the beneficiary) increased 20 percent, to $145.1 billion. During this same period, rebates and other price concessions increased 66 percent, to $29 billion—20 percent of 2016 gross expenditures. Consequently, net expenditures (gross expenditures less rebates and other price concessions) increased only 13 percent, to $116.1 billion. For more information, see GAO-19-498.
21In addition to inclusion on or exclusion from the formulary as a whole, drugs are often placed on different formulary tiers that correspond to different levels of cost sharing for beneficiaries. For example, Tier 1 prescription drugs are usually preferred generic drugs that have the lowest cost sharing, whereas Tier 5 prescription drugs are unique specialty drugs that carry larger cost sharing.
Page 12 GAO-21-111 Prescription Drugs
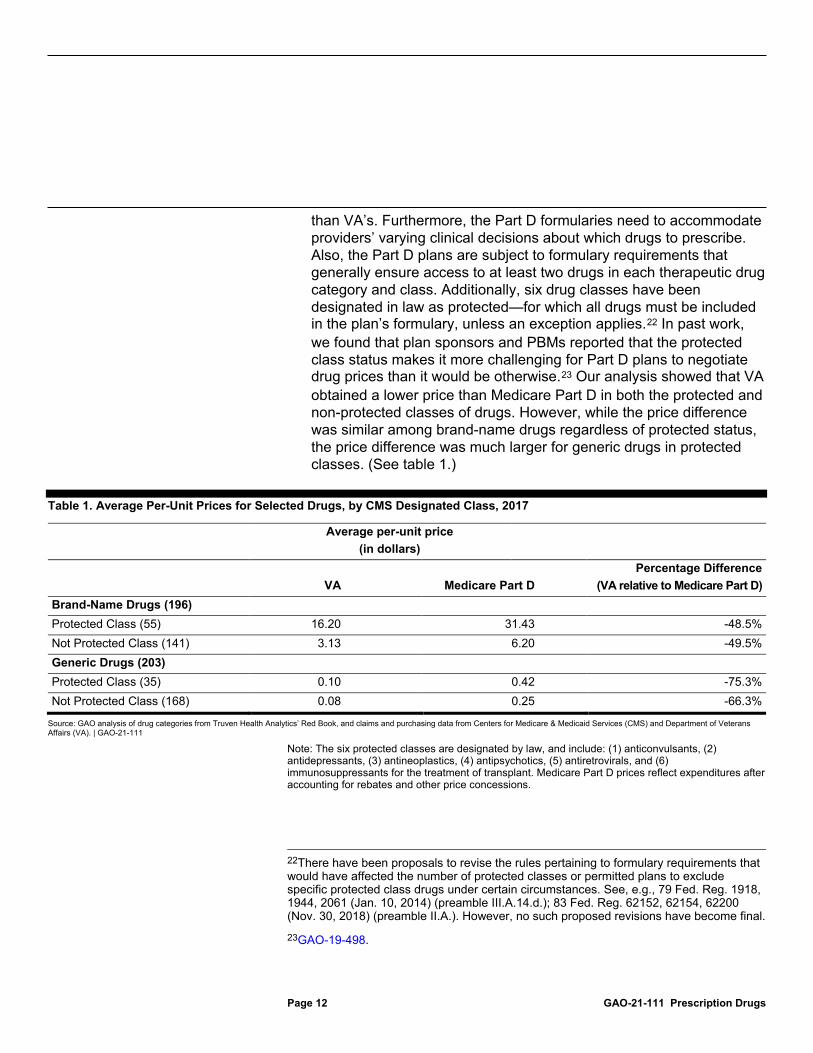
than VA’s. Furthermore, the Part D formularies need to accommodate providers’ varying clinical decisions about which drugs to prescribe. Also, the Part D plans are subject to formulary requirements that generally ensure access to at least two drugs in each therapeutic drug category and class. Additionally, six drug classes have been designated in law as protected—for which all drugs must be included in the plan’s formulary, unless an exception applies.22 In past work, we found that plan sponsors and PBMs reported that the protected class status makes it more challenging for Part D plans to negotiate drug prices than it would be otherwise.23 Our analysis showed that VA obtained a lower price than Medicare Part D in both the protected and non-protected classes of drugs. However, while the price difference was similar among brand-name drugs regardless of protected status, the price difference was much larger for generic drugs in protected classes. (See table 1.)
Table 1. Average Per-Unit Prices for Selected Drugs, by CMS Designated Class, 2017
Average per-unit price (in dollars)
VA Medicare Part D
Percentage Difference (VA relative to Medicare Part D)
Brand-Name Drugs (196)
Protected Class (55) 16.20 31.43 -48.5% Not Protected Class (141) 3.13 6.20 -49.5% Generic Drugs (203) Protected Class (35) 0.10 0.42 -75.3% Not Protected Class (168) 0.08 0.25 -66.3%
Source: GAO analysis of drug categories from Truven Health Analytics’ Red Book, and claims and purchasing data from Centers for Medicare & Medicaid Services (CMS) and Department of Veterans Affairs (VA). | GAO-21-111
Note: The six protected classes are designated by law, and include: (1) anticonvulsants, (2) antidepressants, (3) antineoplastics, (4) antipsychotics, (5) antiretrovirals, and (6) immunosuppressants for the treatment of transplant. Medicare Part D prices reflect expenditures after accounting for rebates and other price concessions.
22There have been proposals to revise the rules pertaining to formulary requirements that would have affected the number of protected classes or permitted plans to exclude specific protected class drugs under certain circumstances. See, e.g., 79 Fed. Reg. 1918, 1944, 2061 (Jan. 10, 2014) (preamble III.A.14.d.); 83 Fed. Reg. 62152, 62154, 62200 (Nov. 30, 2018) (preamble II.A.). However, no such proposed revisions have become final.
23GAO-19-498.
Page 13 GAO-21-111 Prescription Drugs
• Costs Included in Drug Prices. Medicare Part D’s drug price covers more costs than does VA’s. This structural distinction between the programs would account for at least a portion of the price differences. The price paid in Medicare Part D—to reimburse pharmacies via the plans—covers several facets of cost: dispensing fees, ingredient costs, sales taxes, and applicable vaccine administration fees. In addition, prescription drugs in Medicare Part D are generally sold to beneficiaries by retail pharmacies, and therefore generally include markups by one or more intermediaries (such as wholesalers and distributors). VA, on the other hand, uses a direct purchase approach to acquire drugs from manufacturers through the prime vendor program; therefore its prices are generally not subject to markups associated with distributing drugs through retail pharmacies. Furthermore, because VA distributes around 80 percent of its own drugs by mail, the prices do not include costs for storage, overhead, or dispensing. VA officials said it costs approximately $3.75 to process and mail a prescription. However, these VA mail order costs would not account for the difference in prices between VA and Part D drugs. Specifically, we found that, across the combined 399 brand-name and generic drugs, VA paid an average of $0.50 per unit, while Medicare Part D paid an average price of $1.08 per unit. If 1-unit is prescribed per day, and it is a 30-day prescription, this “average drug” would cost $15.00 in VA and $32.40 in the Part D program. The average mail order cost of $3.75 paid by VA for a prescription makes up only a part of the $17.40 difference. The mail order cost would represent a larger portion of the cost difference for lower priced drugs (including generic drugs) or drugs with fewer than 30 units per prescription (such as short-term prescriptions taken for a few days or weeks), but a smaller portion of the cost difference for higher priced drugs (including many brand drugs) or those with more than 30 units per prescription.
We provided a draft of this product to HHS and VA for comment. Both agencies provided technical comments, which we incorporated as appropriate. As agreed with your offices, unless you publicly announce the contents of this report earlier, we plan no further distribution until 30 days from the report date. At that time, we will send copies of this report to relevant congressional committees and other interested members. The report also will be available at no charge on the GAO Web site at http://www.gao.gov.
Agency Comments

Page 14 GAO-21-111 Prescription Drugs
If you or your staff have any questions regarding this report, please contact me at (202) 512-7114 or [email protected]. Contact points for our Offices of Congressional Relations and Public Affairs may be found on the last page of this report. GAO staff members who made key contributions to this report are listed in appendix II.
Sincerely yours, John E. Dicken Director, Health Care
Appendix I: Objectives, Scope, and Methodology
Page 15 GAO-21-111 Prescription Drugs
To compare prices paid for prescription drugs in Medicare Part D and the Department of Veterans Affairs (VA), we selected a group of drugs—referred to hereafter as a “basket” —and then calculated unit prices paid by each of the two programs. To select the drugs in the basket, we calculated the brand-name and generic drugs with the highest expenditures, highest utilization, and highest expenditure per utilization in the Part D program in 2017 using Medicare prescription drug event data.1 We used Medicare data to select our drugs since the Part D program represents the vast majority of annual drug spending compared to VA.
Throughout our analysis, we refer to drugs based on unique combinations of active ingredient, strength, dosage form, and route of administration, which we identified using Truven Health Analytics’ Red Book.2 We also used Red Book to identify brand-name or generic status and therapeutic classes for each of these drugs.
First, for each drug, we calculated gross expenditures using the Medicare prescription drug event data based on a drug’s ingredient cost, dispensing fees, sales tax, and applicable vaccine administration fees, as well as overall utilization. We then used this information to identify the top 100 brand-name and 100 generic drugs in Medicare Part D with the highest expenditures in 2017; the 100 brand-name and 100 generic drugs with the highest utilization in 2017; and the 100 brand-name and 100 generic drugs with the highest expenditures per unit. We excluded any drugs that had fewer than 50 associated claims in 2017 in order to prevent small-volume drugs from impacting our estimates.
1The Medicare prescription drug event data include records of individual drug transactions that Part D plan sponsors submit to the CMS each time a beneficiary obtains a prescription drug. The data include transactions from both stand-alone Part D plans and Medicare Advantage (Part C) plans. We excluded claims billed under programs that are exempted from certain Part D requirements, including Programs of All-Inclusive Care for the Elderly plan contracts, employer-sponsored plans, and demonstration or special needs plans. We also excluded compounded drugs, which are tailor-made by a pharmacy for a beneficiary and over-the-counter drugs as they are generally not covered by Medicare Part D, as well as drugs that are physician-administered reimbursed under Medicare Part B. Finally, we excluded drugs with payments made by third parties outside of Medicare.
2The dosage form is the physical form in which a drug is produced and dispensed, such as a tablet or capsule; route of administration is the way of administering a drug to a patient, such as taking a drug orally. We used Red Book to determine a drug’s therapeutic class, dose, and route of administration. Generic drugs may have more than one manufacturer, and we grouped these drugs together regardless of whether they were produced by more than one manufacturer.
Appendix I: Objectives, Scope, and Methodology

Appendix I: Objectives, Scope, and Methodology
Page 16 GAO-21-111 Prescription Drugs
Next, for those drugs identified as “top 100” in Medicare Part D in each of the three categories (as described above), we analyzed 2017 expenditures and utilization in VA using VA purchasing data, which include information on all drugs purchased for patients in VA’s medical centers, consolidated mail outpatient pharmacy, and in the Community Care setting. After grouping drugs by active ingredient, strength, dose form, and route of administration in VA using Red Book, we matched up the Medicare “top 100” list to the VA data and excluded any drugs which had fewer than 50 units dispensed in VA in 2017.3 This yielded a final version of our basket with 399 non-duplicate drugs (203 generic and 196 brand-name). These 399 drugs accounted for approximately 43 percent of total Medicare Part D expenditures in 2017.
Next, we incorporated any applicable rebates or price concessions in order to determine net expenditures. VA purchasing data reflect prices following all negotiations, so no further calculations were needed. For Medicare Part D, we used 2017 direct and indirect remuneration data from Centers for Medicare & Medicaid Services (CMS)—which reflect any rebates and other price concessions obtained by Part D plan sponsors and pharmacy benefit managers (PBM) after a beneficiary receives a drug—and subtracted those amounts from gross expenditures for each drug, which yielded net expenditures.
To compare net prices paid for the basket of drugs, we calculated weighted average prices based on utilization across the two programs. Specifically, for each drug, we created a weight by combining the quantities of that drug in Part D and VA and dividing this combined total by the total quantities for all drugs in the study basket dispensed by both Part D and VA. Because the weights are based on utilization, it allows us to compare per-unit prices regardless of the underlying quantities of drugs utilized in each program. For example, Medicare may have dispensed a given drug in the study basket 10 times more than VA, but then the average per-unit price calculations still only weight each program’s unit price by 1 percent. We then weighted each of the net unit prices for each drug by its corresponding weight above to calculate the average per-unit price for each program. Additionally, for each subgroup of the overall
3We excluded 15 brand-name drugs and 12 generic drugs for having fewer than 50 units dispensed in VA in 2017.

Appendix I: Objectives, Scope, and Methodology
Page 17 GAO-21-111 Prescription Drugs
basket (e.g. brand-name vs. generic drugs), we calculated separate average per-unit prices (e.g. all brand-name drugs, all generic drugs).
Lastly, we compared—for VA and Medicare Part D—the per-unit prices of drugs that were in a protected class with those that were not protected.4 First, we reviewed and confirmed the therapeutic categories applied by Red Book for each drug, using the National Library of Medicine drug portal and drugs.com as reference resources. Next, we determined if the drug should be in one of the six protected classes. Lastly, as we did in our other price analyses, we weighted the per-unit prices based on utilization.
For all data used in this analysis, we took steps to assess their reliability, including interviewing knowledgeable officials, conducting data checks for outliers and anomalies, and comparing to published information when available. After taking these steps, we determined that the data were sufficiently reliable for the purposes of our reporting objectives.
To describe factors potentially contributing to price differences across the two programs, we reviewed documents related to the programs’ structures, interviewed agency officials from both CMS and VA, and reviewed government reports, academic literature, and past GAO work.
We conducted this performance audit from January 2019 to December 2020 in accordance with generally accepted government auditing standards. Those standards require that we plan and perform the audit to obtain sufficient, appropriate evidence to provide a reasonable basis for our findings and conclusions based on our audit objectives. We believe that the evidence obtained provides a reasonable basis for our findings based on our audit objectives.
4The protected classes are: (1) anticonvulsants, (2) antidepressants, (3) antineoplastics, (4) antipsychotics, (5) antiretrovirals, and (6) immunosuppressants for the treatment of transplant. Sponsors are required to include all covered Part D drugs in these statutorily specified categories, unless an exception applies, until such time as the Secretary identifies categories of clinical concern through notice and comment rulemaking. 42 U.S.C. § 1395w-104(b)(3)(G). The Secretary has not promulgated final regulations establishing categories and classes of clinical concern, so the protected classes remain those categories and classes that are listed in statute. See 42 C.F.R. § 423.120(b)(2)(v) (2019).

Appendix II: GAO Contact and Staff Acknowledgments
Page 18 GAO-21-111 Prescription Drugs
John E. Dicken, (202) 512-7114, [email protected]
In addition to the contact named above, Robert Copeland, Assistant Director; Kristeen McLain, Analyst-in-Charge; Matthew Green; and Zhi Boon made key contributions to this report. Also contributing were Sam Amrhein; George Bogart; Yesook Merrill; Reed Meyer; Diona Martyn, Ashley Nurhussein; Ethiene Salgado-Rodriguez; and Eric Wedum.
Appendix II: GAO Contact and Staff Acknowledgments
GAO Contact Staff Acknowledgements
(103272)

The Government Accountability Office, the audit, evaluation, and investigative arm of Congress, exists to support Congress in meeting its constitutional responsibilities and to help improve the performance and accountability of the federal government for the American people. GAO examines the use of public funds; evaluates federal programs and policies; and provides analyses, recommendations, and other assistance to help Congress make informed oversight, policy, and funding decisions. GAO’s commitment to good government is reflected in its core values of accountability, integrity, and reliability.
The fastest and easiest way to obtain copies of GAO documents at no cost is through our website. Each weekday afternoon, GAO posts on its website newly released reports, testimony, and correspondence. You can also subscribe to GAO’s email updates to receive notification of newly posted products.
The price of each GAO publication reflects GAO’s actual cost of production and distribution and depends on the number of pages in the publication and whether the publication is printed in color or black and white. Pricing and ordering information is posted on GAO’s website, https://www.gao.gov/ordering.htm.
Place orders by calling (202) 512-6000, toll free (866) 801-7077, or TDD (202) 512-2537.
Orders may be paid for using American Express, Discover Card, MasterCard, Visa, check, or money order. Call for additional information.
Connect with GAO on Facebook, Flickr, Twitter, and YouTube. Subscribe to our RSS Feeds or Email Updates. Listen to our Podcasts. Visit GAO on the web at https://www.gao.gov.
Contact FraudNet:
Website: https://www.gao.gov/fraudnet/fraudnet.htm
Automated answering system: (800) 424-5454 or (202) 512-7700
Orice Williams Brown, Managing Director, [email protected], (202) 512-4400, U.S. Government Accountability Office, 441 G Street NW, Room 7125, Washington, DC 20548
Chuck Young, Managing Director, [email protected], (202) 512-4800 U.S. Government Accountability Office, 441 G Street NW, Room 7149 Washington, DC 20548
Stephen J. Sanford, Acting Managing Director, [email protected], (202) 512-4707 U.S. Government Accountability Office, 441 G Street NW, Room 7814, Washington, DC 20548
GAO’s Mission
Obtaining Copies of GAO Reports and Testimony Order by Phone
Connect with GAO
To Report Fraud, Waste, and Abuse in Federal Programs
Congressional Relations
Public Affairs
Strategic Planning and External Liaison
Please Print on Recycled Paper.