GAO-17-23, West Coast Ports: Better Supply Chain ...
93
WEST COAST PORTS Better Supply Chain Information Could Improve DOT’s Freight Efforts Report to Congressional Requesters October 2016 GAO-17-23 United States Government Accountability Office
Transcript of GAO-17-23, West Coast Ports: Better Supply Chain ...

WEST COAST PORTS
Better Supply Chain Information Could Improve DOT’s Freight Efforts
Report to Congressional Requesters
October 2016
GAO-17-23
United States Government Accountability Office

United States Government Accountability Office
Highlights of GAO-17-23, a report to congressional requesters
October 2016
WEST COAST PORTS
Better Supply Chain Information Could Improve DOT’s Freight Efforts
What GAO Found Some infrastructure and operations at major West Coast ports are strained in the face of recent changes in global shipping, but port stakeholders are attempting to address these constraints. For example, as the shipping industry deploys larger vessels capable of delivering more cargo, some port terminals lack big enough cranes, or other infrastructure, needed to handle these vessels. All major West Coast ports have planned or completed port-related infrastructure projects and implemented operational changes. For example, in Long Beach, California, the Gerald Desmond Bridge is being heightened to enable larger vessels to pass underneath. Port stakeholders also noted that efforts to address constraints at ports can be hampered by competing priorities and limited data. For example, most state and local government officials said that having information on ports’ performance and industry supply chains—the end-to-end process of producing and distributing a product or commodity from raw materials to the final customer—would be helpful to target efforts to address constraints at ports.
Selected shippers were impacted by and responded to one recent port disruption in various ways. In July 2014, the labor agreement that covers most West Coast port workers expired and was not renewed until February 2015. During this period, as widely reported, ports remained open, but vessels backed up in harbors, and loading and unloading of cargo were delayed. In response to this disruption, 13 of 21 selected industry groups representing shippers of some of the top commodities moving through West Coast ports said at least some of their members modified their supply chains by, for example, diverting shipments to ports outside the West Coast or to alternate modes of transportation. All 13 said shippers’ costs increased or revenues declined. Six industry groups said some members had difficulty altering shipping plans because of commodity attributes, such as perishability or prohibitive costs.
The Department of Transportation’s (DOT) freight-related activities are increasingly multi-modal and inclusive of ports, but gaps exist in the information available to DOT and state and local governments about important aspects of supply chains. For example, a 2015 DOT report notes that movements of international trade between ports and domestic origin for exports and domestic destinations for imports are not measured. This report further states that this information could help DOT to assess international trade flows within the United States and strengthen the role of freight transportation in U.S. economic competitiveness. Federal guidance and leading practices in capital planning emphasize that good information is essential to sound decision making and achieving agency objectives. A few current DOT initiatives may help address some information gaps, but they are in the early stages. DOT has also articulated the need for supply chain information in its draft National Freight Strategic Plan, but does not outline how DOT will obtain this information or how it will be used. Based on a 2014 GAO recommendation, DOT is in the early stages of developing a written freight data strategy to improve the availability of national data on freight trends, among other things. Broadening its freight data strategy to include supply chain information could help DOT to think more strategically about the specific supply chain information needed to support its freight efforts and advance national freight policy goals.
View GAO-17-23. For more information, contact Susan Fleming at (202) 512-2834 or [email protected]
Why GAO Did This Study U.S. West Coast ports are critical to the national transportation freight network and global supply chains. Changes in global shipping and disruptions at ports can create congestion and economic hardship for shippers with resulting effects throughout supply chains. The 2015 Fixing America’s Surface Transportation Act provides freight policy goals, including increasing U.S. economic competitiveness; reducing freight congestion; and improving the safety, reliability, and efficiency of the freight network. The act also established new DOT freight funding programs.
This report addresses: (1) how major U.S. West Coast ports have responded to recent changes in global shipping; (2) how selected shippers have been impacted by and responded to a recent port disruption, and (3) how DOT’s efforts support port cargo movement and whether they can be improved. GAO conducted case studies of the three major port regions on the West Coast; interviewed key stakeholders—such as port authorities and state and local transportation agencies—for each region and 21 industry representatives, and evaluated DOT’s freight efforts relative to criteria on using quality information to support decision-making.
What GAO Recommends In developing a freight data strategy, DOT should identify: what supply chain information is needed, potential sources of that information, data gaps, and how it intends to use this information to inform freight efforts. DOT concurred with the recommendation.

Page i GAO-17-23 West Coast Ports
Letter 1
Background 6 West Coast Ports and Their Stakeholders Have Taken Actions to
Address Constraints on Cargo Movement Created by Global Shipping Changes; However, Challenges Remain 14
Selected Shippers Were Impacted to Varying Degrees by Port Disruptions, Especially in 2014 and 2015, and Responded by Modifying Their Supply Chains 27
DOT Has Made Progress Including Ports in Freight Efforts, but DOT’s Data Strategy Could Be Improved by Including Supply-Chain Information 38
Conclusions 50 Recommendation 51 Agency Comments 52
Appendix I Objectives, Scope, and Methodology 53
Appendix II Key Entities Involved in Cargo Movement to and from Ports and Their Role in the Supply Chain 60
Appendix III Examples of Key Landside and Terminal Infrastructure Projects at Major West Coast Ports Addressing Challenges Related to Changes in Global Shipping 61
Appendix IV Empirical Analysis of Trade Flows during Late 2014 and Early 2015 63
Appendix V Comments from the U.S. Department of Transportation 84
Appendix VI GAO Contact and Staff Acknowledgments 85
Contents
Page ii GAO-17-23 West Coast Ports
Related GAO Products 86
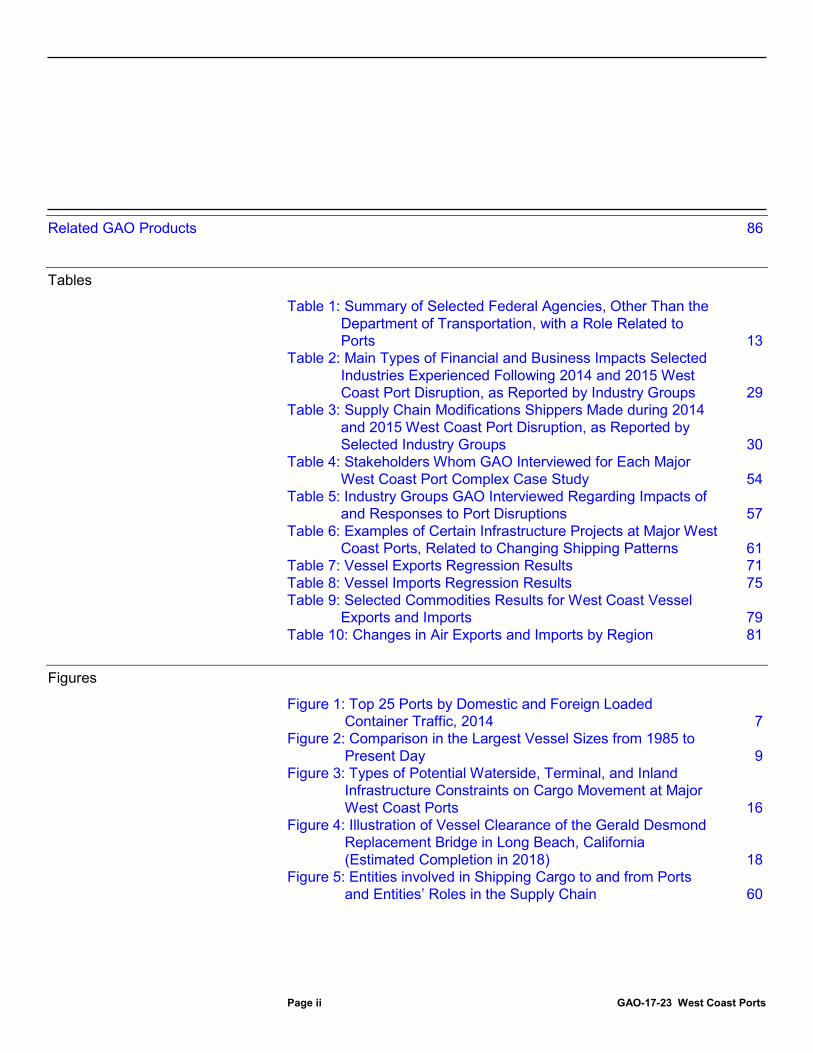
Tables
Table 1: Summary of Selected Federal Agencies, Other Than the Department of Transportation, with a Role Related to Ports 13
Table 2: Main Types of Financial and Business Impacts Selected Industries Experienced Following 2014 and 2015 West Coast Port Disruption, as Reported by Industry Groups 29
Table 3: Supply Chain Modifications Shippers Made during 2014 and 2015 West Coast Port Disruption, as Reported by Selected Industry Groups 30
Table 4: Stakeholders Whom GAO Interviewed for Each Major West Coast Port Complex Case Study 54
Table 5: Industry Groups GAO Interviewed Regarding Impacts of and Responses to Port Disruptions 57
Table 6: Examples of Certain Infrastructure Projects at Major West Coast Ports, Related to Changing Shipping Patterns 61
Table 7: Vessel Exports Regression Results 71 Table 8: Vessel Imports Regression Results 75 Table 9: Selected Commodities Results for West Coast Vessel
Exports and Imports 79 Table 10: Changes in Air Exports and Imports by Region 81
Figures
Figure 1: Top 25 Ports by Domestic and Foreign Loaded Container Traffic, 2014 7
Figure 2: Comparison in the Largest Vessel Sizes from 1985 to Present Day 9
Figure 3: Types of Potential Waterside, Terminal, and Inland Infrastructure Constraints on Cargo Movement at Major West Coast Ports 16
Figure 4: Illustration of Vessel Clearance of the Gerald Desmond Replacement Bridge in Long Beach, California (Estimated Completion in 2018) 18
Figure 5: Entities involved in Shipping Cargo to and from Ports and Entities’ Roles in the Supply Chain 60
Page iii GAO-17-23 West Coast Ports
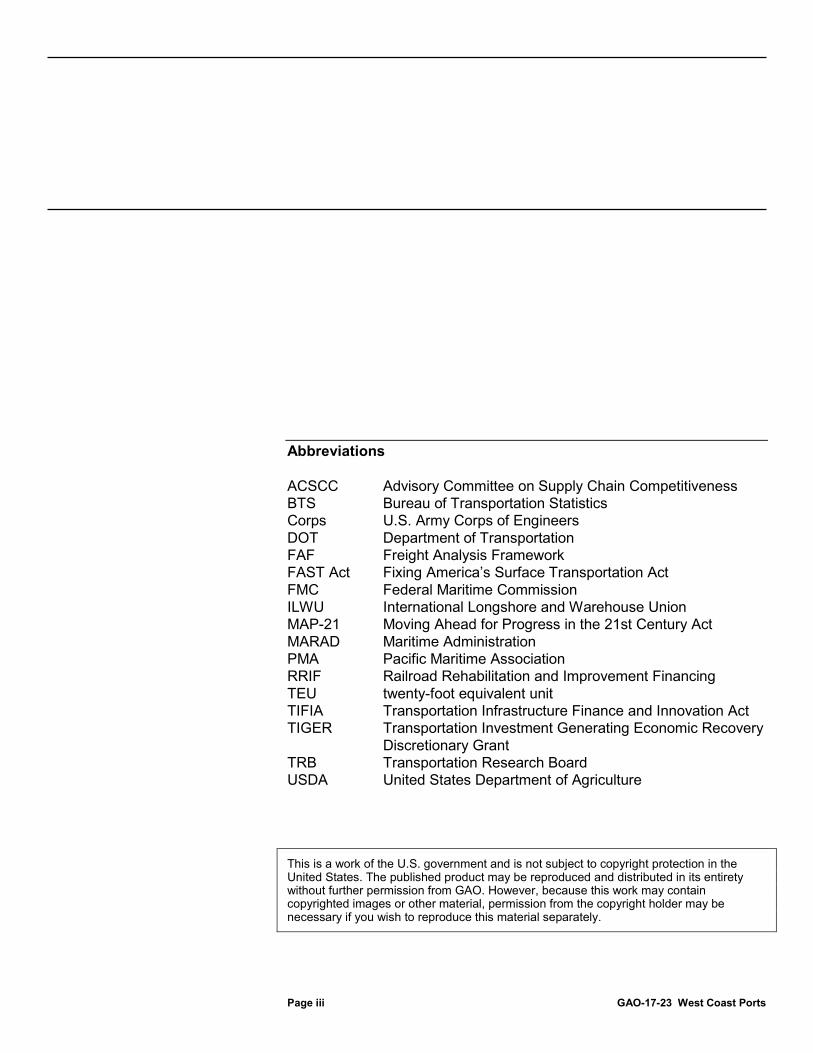
Abbreviations ACSCC Advisory Committee on Supply Chain Competitiveness BTS Bureau of Transportation Statistics Corps U.S. Army Corps of Engineers DOT Department of Transportation FAF Freight Analysis Framework FAST Act Fixing America’s Surface Transportation Act FMC Federal Maritime Commission ILWU International Longshore and Warehouse Union MAP-21 Moving Ahead for Progress in the 21st Century Act MARAD Maritime Administration PMA Pacific Maritime Association RRIF Railroad Rehabilitation and Improvement Financing TEU twenty-foot equivalent unit TIFIA Transportation Infrastructure Finance and Innovation Act TIGER Transportation Investment Generating Economic Recovery Discretionary Grant TRB Transportation Research Board USDA United States Department of Agriculture
This is a work of the U.S. government and is not subject to copyright protection in the United States. The published product may be reproduced and distributed in its entirety without further permission from GAO. However, because this work may contain copyrighted images or other material, permission from the copyright holder may be necessary if you wish to reproduce this material separately.

Page 1 GAO-17-23 West Coast Ports
441 G St. N.W. Washington, DC 20548
October 31, 2016
The Honorable Bill Shuster Chairman Committee on Transportation and Infrastructure House of Representatives
The Honorable Deb Fischer Chairman Subcommittee on Surface Transportation and Merchant Marine Infrastructure, Safety, and Security Committee on Commerce, Science, and Transportation United States Senate
The Honorable Duncan Hunter Chairman Subcommittee on Coast Guard and Maritime Transportation Committee on Transportation and Infrastructure House of Representatives
Ports on the U.S. West Coast are a critical component of the freight transportation network that supports billions of dollars in annual trade activity, especially with Asia. This trade is an integral part of supply chains for retail and manufacturing as well as for agricultural goods.1 In 2015, West Coast ports handled almost 35 percent of the more than $1.56 dollars of the total international waterborne trade that moved through domestic ports.2 The majority of ocean-borne cargo moves through a relatively small number of ports. On the West Coast, the three major port regions—the Ports of Los Angeles and Long Beach in Southern California; of Oakland in the San Francisco Bay Area; and of Seattle and
1A supply chain refers to the comprehensive, end-to-end sequence of processes and network of companies involved in the production and distribution of a product or commodity, including all of the actors and actions required to source, produce, transport, and distribute a product or commodity from raw materials to final customer. 2We calculated these figures based on U.S. Census international trade statistics covering all ports on the West Coast, including containerized and non-containerized (e.g., bulk oil shipments) trade.
Letter

Page 2 GAO-17-23 West Coast Ports
Tacoma in the Northwest—handled 88 percent of total West Coast port volumes in 2015.3 The global shipping industry has been evolving rapidly, necessitating changes in both operations and infrastructure at ports. For example, ocean carriers built larger vessels in an effort to reduce costs and to lower the unit cost of moving a container. Accordingly, some ports now need, for example, deeper harbors, taller cranes, improved operational efficiency, and additional truck and rail capacity to accommodate larger vessels and the increased amount of cargo offloaded from a single ship. Amid these changes, shippers and port stakeholders have raised questions about the impact of increasing congestion at ports.4 Addressing these issues is of paramount importance to the continued vitality of local, regional, and national economic activity that relies on the efficient movement of cargo through ports.
The efficient movement of cargo through ports requires the coordination of public and private entities and is vulnerable to a variety of sources of congestion and disruption. Any event that impedes this flow of cargo can disrupt global supply chains, trade, and commerce. On the West Coast, port authorities are generally landlords, with terminal operators leasing land and dock infrastructure from the port and owning equipment, such as terminal cranes, that are needed to load and unload vessels. Private firms are typically responsible for the movement of containers to and from vessels and in and out of West Coast port terminals. Operations can become congested due to equipment shortages, deteriorating infrastructure, and labor shortages, among other causes. Unexpected events, such as severe weather or labor disputes, can also disrupt the flow of cargo through ports. In particular, due to the complexity of modern supply chains—which require close coordination to move goods across varied infrastructure—even a small delay (e.g., changes in vessel schedules or dock operations) can have rippling effects throughout supply
3Our calculations include all containerized and non-containerized import and export trade on the West Coast. Containers are large steel boxes that can be transferred from the ship to various transportation modes such as railcars and trucks. Non-containerized cargo includes bulk shipments such as oil and some agricultural products. Ports may handle one or both types of cargo. 4For in-depth discussion of the diverse sources of congestion, see Federal Maritime Commission, Bureau of Trade Analysis, U.S. Container Port Congestion & Related International Supply Chain Issues: Causes, Consequences & Challenges (Washington, D.C.: July 2015).

Page 3 GAO-17-23 West Coast Ports
chains, potentially resulting in economic losses for businesses and ultimately the broader economy.
At ports on the West Coast, much of the labor is provided by longshore workers, organized by the International Longshore and Warehouse Union (ILWU), working under contract with the Pacific Maritime Association (PMA), which represents the owners and operators of port terminals. In July 2014, the contract between ILWU and PMA expired and port work continued without a contract until a new contract was signed in February 2015. At the same time, as widely reported, West Coast port congestion worsened from already congested levels, with vessels backed up in harbors and delays in cargo loading and unloading.5 Observers disputed whether the congestion was caused more by labor and management actions or operational and infrastructure challenges stemming from changes in global shipping, or a combination of factors. Whatever the cause, some U.S. shippers experienced adverse economic consequences as their supply chains were disrupted.
With the passage of the Moving Ahead for Progress in the 21st Century Act (MAP-21) in 2012, the federal government articulated its first national freight policy, giving new focus to intermodal freight, such as cargo moving through ports.6 The policy goals include improving the efficiency and resiliency of freight transportation and enhancing the global economic competitiveness of the United States. Much of the responsibility for meeting these goals falls on the Department of Transportation (DOT) as the agency works to finalize a National Freight Strategic Plan and establish new freight programs authorized by the Fixing America’s Surface Transportation Act (FAST Act), enacted in December 2015.7
5For purposes of this report, port congestion is defined as conditions during which cargo movement through one or more ports is delayed or halted for a period of time due to any condition inside or outside the port. For the purposes of this report, disruptive events are defined as an interruption to the regular flow or sequence of freight movement at ports. 6Pub. L.No. 112-141, 126 Stat. 405 (2012). Freight refers to any cargo transported by water-borne vessel, truck, train, or aircraft. 7Pub. L. No. 114-94, 129 Stat.1312 (2015). The FAST Act required that DOT finalize the National Freight Strategic Plan by December 2017.

Page 4 GAO-17-23 West Coast Ports
You asked us to review a range of issues related to West Coast ports. This report addresses: (1) how recent changes in global shipping have impacted the movement of cargo at major U.S. West Coast ports, and how these ports and their stakeholders have responded to these changes; (2) how selected shippers have been impacted by and responded to disruptions at West Coast ports during 2014 and 2015 as well as to other recent or potential disruptions; and (3) how DOT’s current freight-related efforts support cargo movement through ports and whether these efforts can be improved.
To understand how changes in global shipping have affected major West Coast ports and how these ports and their stakeholders (e.g., marine terminal operators, truck and rail firms, and other entities involved in moving cargo through ports) have responded, we conducted three in-depth case studies in the West Coast regions with the largest port complexes—Los Angeles-Long Beach, Oakland, and Seattle-Tacoma. These case studies included site visits and interviews with stakeholders for each port complex that represented port authorities, marine terminal operators, longshoreman, truckers, and state and local transportation agencies. As part of each case study, we reviewed relevant documents, such as state and regional freight plans and project-specific funding applications. To supplement our case studies, we interviewed one national trade association, one state port trade association, and the port authorities of two smaller West Coast ports (San Diego, California, and Portland, Oregon), and two major East and Gulf coast ports (Port Authority of New York and New Jersey, and Port of Houston) to learn about how changes in global shipping have impacted other ports and actions these ports attempted to address these impacts. We selected these other ports based on their relatively large sizes, in terms of the dollar value and twenty-foot equivalent unit volume (TEU).8 Finally, we reviewed literature on global shipping changes and our prior work related to freight mobility, intermodalism, and marine transportation finance.
To assess how selected shippers have been impacted by and responded to recent port disruptions and associated port congestion and delays, we conducted semi-structured interviews with 21 industry trade groups that
8TEU is a standard industry measure of container size. The dimensions of one TEU are equal to that of a standard 20-foot shipping container (20-feet long, 8-feet tall). Shipping containers are commonly 40-feet long, or two TEUs.

Page 5 GAO-17-23 West Coast Ports
represent shippers. We selected these groups because the shippers these groups represent handle some of the top commodities imported and exported through major West Coast ports, as shown by U.S. international trade data. We selected specific associations such that we had representation of manufacturers, retailers, and agricultural firms and representation from all parts of the country. Additionally, to understand the logistical impacts of disruptions, we interviewed a selection of Customs Broker and Freight Forwarder regional associations, that represent logistics handlers. We selected these interviewees after interviewing the national-level association and selecting 9 regional associations representing a variety of West Coast, East Coast, and Gulf Coast port regions from the 28 total regional associations nationwide. These interviewees represent a non-generalizable sample of different industries along different parts of the supply chain. To complement our qualitative analysis, we conducted statistical analysis of U.S. international trade data maintained by the U.S. Census Bureau (Census), covering all imports and exports from January 2005 to March 2016.
To identify and evaluate any ways that DOT could better support cargo movement through ports, we gathered information on an array of topics related to cargo moving though ports and relevant federal efforts, with a focus on DOT. We reviewed DOT’s draft National Freight Strategic Plan and programmatic activities of the Maritime Administration (MARAD) as well as other DOT administrations. We also reviewed literature on shipping, logistics, and freight topics to identify areas others have noted need attention. We conducted interviews with DOT, Department of Commerce, and Federal Maritime Commission officials. We also interviewed selected transportation experts, and, during the interviews conducted for the other objectives, also asked about areas in which DOT could improve. To identify possible ways to improve DOT’s current efforts, we evaluated DOT’s progress against criteria on leading practices in capital decision making that were used in a prior GAO freight report and related Standards for Internal Control in the Federal Government.9 We focused our attention on whether DOT had good information on supply
9GAO. Executive Guide: Leading Practices in Capital Decision-Making, GAO/AIMD-99-32 (Washington, D.C.; December 1998); GAO, Standards for Internal Control in the Federal Government, GAO-14-704G (Washington, D.C.: September 2014); and GAO, Freight Transportation: Developing National Strategy Would Benefit from Added Focus on Community Congestion Impacts, GAO-14-740 (Washington, D.C.; Sept. 19, 2014).
Page 6 GAO-17-23 West Coast Ports
chains available for decision making as the department establishes and expands policies and programs related to ports. See appendix I for more detailed information on our scope and methodology, including listings of the stakeholders and organizations we interviewed.
We conducted this performance audit from July 2015 to October 2016 in accordance with generally accepted government auditing standards. Those standards require that we plan and perform the audit to obtain sufficient, appropriate evidence to provide a reasonable basis for our findings and conclusions based on our audit objectives. We believe that the evidence obtained provides a reasonable basis for our findings and conclusions based on our audit objectives.
Ports are critical components of the freight transportation network and serve as gateways for the movement of international (imports and exports) and domestic goods between navigable waterways and landside transportation systems, such as the Interstate highway system or the national rail network. For the purposes of this report, we define a port as the area “inside the gate” and under the control of the local port authority or marine terminal operator, where cargo is loaded and unloaded to and from ships. We refer to a “port complex” as encompassing one to two ports and the nearby roadways, rail, bridges, and intermodal facilities (i.e., connectors) on which cargo arrives or departs the port.
Major West Coast ports—Los Angeles, Long Beach, Oakland, Tacoma, and Seattle—have historically handled about half of the nation’s containerized cargo (see figure 1) and all of these ports have projected increasing volumes. For example, the regional government for Southern California, where the nation’s largest port complex is based, has forecasted that the Los Angeles and Long Beach ports will handle approximately 40 million TEUs by 2035, more than two times the cargo handled today. Though cargo volumes at West Coast ports are expected to increase, the share of total cargo handled by West Coast ports has declined slightly in recent years as Gulf and East Coast ports gained market share.
Background
Ports and Port Stakeholders

Page 7 GAO-17-23 West Coast Ports
Figure 1: Top 25 Ports by Domestic and Foreign Loaded Container Traffic, 2014
Note: these figures do not include empty containers.
Cargo moving through ports is inherently intermodal. Efficient freight movement depends upon the condition of intermodal connections. Port connectors include transportation infrastructure such as roads, railways, and marine highways that connect the port to major trade corridors and allow freight to transfer from one transportation mode to another (e.g., from a ship to a truck). The movement of cargo through ports involves multiple entities, public and private, which compete with one another (ports against other ports, terminals against other terminals, etc.) and

Page 8 GAO-17-23 West Coast Ports
coordinate with one another (terminals with truckers and rail carriers, etc.) for shipping business and to make key infrastructure investment and operations decisions. See appendix II for a description of the key entities’ roles and how they fit in the end-to-end sequence of processes and network of companies involved in the production and distribution of goods that make up supply chains.
At 29 West Coast ports—including the ports of Los Angeles, Long Beach, Oakland, Seattle, and Tacoma—the employment requirements and responsibilities between terminal operators and labor are outlined in one contract negotiated between the PMA—which represents marine terminal operators and ocean carriers—and the ILWU—which represents approximately 14,000 registered workers and another 7,000 non-registered workers eligible for employment at marine terminals. The most recent contract was finalized in February 2015 after protracted negotiations that began in May 2014 on a contract that was set to expire on July 1st of that same year. Historically, U.S. terminal-labor contract negotiations can be contentious and lengthy. In some cases, contract negotiating difficulties can effectively shut down port operations.10
Global shipping has changed over the past decade in several fundamental ways as ocean carriers have attempted to reduce their costs. These global shipping changes can impact how cargo is moved through a port.11
• Increased ship size: Over the past decades, many ocean carriers decided to order larger container vessels to meet demand spurred by growing Asian economies, to capture economies of scale made possible by advances in fuel efficient engine technology, and to maintain market share and presence. The largest vessel to call on West Coast ports in 2016 could carry nearly 18,000 TEUs whereas in 2005, the largest vessel was roughly half as large. These larger
10For example, on September 27, 2002, PMA closed all 29 West Coast ports during a contract dispute with the ILWU, resulting in an 11-day lockout and work stoppage. Work resumed after the President invoked the Taft-Hartley Act and obtained a court order to open the ports. Exec. Order No. 13275, 67 Fed. Reg. 62,869 (Oct. 9, 2002) and United States v. Pac Mar. Ass’n, 229 F.Supp. 2d. 1008 (2002). 11Federal Maritime Commission, 2015.
Global Shipping Changes

Page 9 GAO-17-23 West Coast Ports
vessels are longer, wider, and taller.12 Port terminal infrastructure—crane heights and reach, berth depth, and other considerations, such as the availability of truck chassis—the truck trailers that are used to carry shipping containers—must be adequate to receive these larger vessels.13 See figure 2 for an illustration of the growth in vessel size since circa 1985 with a Boeing 747 included for scale.
Figure 2: Comparison in the Largest Vessel Sizes from 1985 to Present Day
a”Post New Panamax” refers to vessels that are too large to transit through the expanded Panama Canal completed in June 2016. “Panamax” refers to the largest vessels that could transit through the Panama Canal in 1985, which were also the largest container vessels available at the time, bTEU, or twenty-foot equivalent units, is a standard industry measure of container size. The dimensions of one TEU are equal to that of a standard 20-foot shipping container (20-feet long, 8-feet tall). Shipping containers are commonly 40-feet long, or two TEUs.
• Formation of shipping alliances: Ocean carriers have formed alliances as a strategy to contain costs and offer more competitive services.14 These alliances allow for cargo booked with one carrier to be transported by another alliance carrier’s ship. Shifts in these alliances can result in vessels calling on different ports and terminals,
12There is general consensus that the shipping industry built excess capacity, which has driven falling shipping rates. 13International Transport Forum, Organization for Economic Development and Cooperation, The Impact of Mega-Ships (Paris, France: 2015). 14Alliances are vessel-sharing agreements under which ocean carriers integrate their liner shipping services. There are different types of agreements, which range from “rate” discussion to space charter agreements to alliances. These agreements between carriers are distinct from agreements that may exist between terminal operators or ports.
Page 10 GAO-17-23 West Coast Ports
depending on obligations under alliance agreements. There are currently four broad alliances which transport about 80 percent of the U.S. containerized cargo.15
• Changing ownership structures: Historically, ocean carriers owned not only the vessels, but also the cargo containers and the truck chassis that transport containers to and from the vessels. Previously, chassis would be stored, maintained, and repaired (by labor) within the terminal gates. Before leaving the terminal, labor would also conduct a chassis safety, or “roadability” inspection. In an effort to keep their costs low in response to the global recession in 2007-2009 and to follow models of chassis provision in other countries, carriers have divested themselves from chassis ownership and shifted these responsibilities to third-party leasing companies.16
Supply chains are the end-to-end process of producing and distributing a product or commodity from raw materials to the final customer. Supply chains can be fairly localized, global, or anywhere in between. Management of the supply chain involves shippers adapting supply chain decisions to changing market conditions and to gain efficiencies.17 For example, a furniture importer’s supply chain could include materials and finished goods from Southeast Asia that are then transported to a West Coast port and distributed across the United States. The freight transportation network, including ports, is a critical component of how end-to-end supply chains function. Lowering production or transportation costs can be key to achieving efficiencies in the supply chain. Industry supply chains have evolved in recent years with advances in
15Non-containerized freight—such as iron ore, petroleum, and many bulk agricultural goods—are not moved by the alliances. 16Historically, organized labor, such as the ILWU, had jurisdiction to inspect and repair all chassis before a truck could leave a terminal with the chassis carrying a container. However, as carriers divested chassis ownership to third-party leasing companies, there is no contractual relationship or requirement that provides ILWU jurisdiction over all chassis repairs. Outside the United States, chassis assets are typically owned and managed by motor carriers and logistic companies. 17We refer to importers and exporters as “shippers” in this report, which are generally the firms that procure goods and sell them to end customers or produce goods at the point of manufacture.
Supply Chains

Page 11 GAO-17-23 West Coast Ports
communications and computing technology, reductions in trade barriers and production costs, and the opening of new markets globally.
Over the past several decades, firms have become increasingly reliant on timely shipping. “Just-in-time” business models enable firms to save inventory costs by planning their supply chains carefully to have inputs and goods delivered within very specific time frames. While these strategies are highly efficient, any disruption in the supply chain can have a greater impact than would be the case if larger inventories were held, buffering any breakdown in planned deliveries. Further, many shippers face seasonal demand, where goods must be delivered to the customer during a narrow window of time, such as goods for the holiday season or agricultural goods.
In addition to private entities and state, regional, and local governments, multiple federal agencies have roles in various aspects of port and near-port freight infrastructure and in facilitating international trade. Although historically DOT’s freight policy and funding have been targeted towards highways and transit, some DOT programs have funded port-related projects such as the Transportation Investment Generating Economic Recovery Discretionary Grant (TIGER) program; the Transportation Infrastructure Finance and Innovation Act (TIFIA) program; and Railroad Rehabilitation and Improvement Financing (RRIF). These programs’ broad eligibility has allowed states and local governments to fund multi-modal, multi-jurisdictional projects.18 In 2012, MAP-21 expanded DOT’s authorities to address multimodal freight, and DOT has subsequently assumed more of a leadership role in federal freight activity. MAP-21
18The TIGER program was first authorized and appropriated funds by Congress in the American Recovery and Reinvestment Act of 2009 Pub. L. No. 111-5, 123, Stat. 115, 203 (2009). The TIGER program is a national surface transportation infrastructure discretionary grant program. The TIFIA program was created in 1998 as part of the Transportation Equity Act for the 21st Century (TEA-21). Pub. L. No. 105-178, 112 Stat. 107 (1998) codified at 23 U.S.C. ch.6 and provides federal credit assistance in the form of direct loans, loan guarantees, and lines of credit to finance surface transportation projects including highway, transit, rail, port access, and intermodal projects. The program is designed to fill market gaps and leverage substantial private and other nonfederal investment to help advance projects of regional and national significance. The RRIF program which provides direct federal loans and loan guarantees to finance the development of railroad infrastructure was established in 1998 by TEA-21, Pub. L. No. 105 -178 § 7203, 112 Stat.107, 471 - 477 codified at 45 U.S.C. §§ 821 – 23.
Federal Freight Policy and Role with Ports

Page 12 GAO-17-23 West Coast Ports
established a national freight policy focused on highways and directed DOT to develop a national freight strategic plan.19 The goals of this policy include increasing the economic competitiveness of the United States, reducing freight congestion, and improving the safety, reliability, and efficiency of the freight network, among other goals. In October 2015, DOT issued a draft National Freight Strategic Plan for public comment and plans to finalize the plan by December 4, 2017, in accordance with the statutory deadline mandated by the FAST Act. In December 2015, the FAST Act expanded DOT’s freight role again. The FAST Act created a new freight formula program, authorized at $6.2 billion over 5 years, to fund improvements on the National Highway Freight Network. Up to 10 percent of the funds may be used for freight rail and intermodal projects, including projects at ports. The FAST Act also created a new discretionary grant program, commonly referred to as the FASTLANE program, to fund major transportation projects, such as highway bridge projects, as well as freight projects. Up to $500 million of the $4.5 billion authorized for the program over 5 years may be used for freight rail, intermodal, or port projects. The Act also directed DOT to designate a multimodal freight network and undertake a port performance data effort.20
Other federal agencies with specific roles related to ports include the Departments of Commerce, Homeland Security, and Agriculture as well as the U.S. Army Corps of Engineers (Corps) and the Federal Maritime Commission (FMC) (see table 1). For example, the Corps is tasked with maintaining navigable waterways and, consequently, is the lead federal agency for harbor dredging projects at ports. Other agencies have a specific role related to a step in the flow of goods and share information with other agencies to support their purposes. For example, Customs and Border Protection, within Homeland Security, inspects and clears cargo as part of its overall mission of protecting the homeland. After gathering required customs information, it provides data on import trade to the U.S.
19Pub. L. No. 112-141, §1115. 126 Stat. 405, 468-472 codified at 23 U.S.C. § 167. 20The FAST Act created the Nationally Significant Freight and Highway Projects program, which DOT implemented as the FASTLANE program, to award grants to various freight projects on a competitive basis. 23 U.S.C. § 117. The Act also created the National Highway Freight Program, which provides formula-based funding to states. 23 U.S.C. 167(i). Finally, the Act created the Port Performance Freight Statistics Program for DOT to develop and report uniform statistics about the nation’s largest ports. 23 U.S.C. § 6314.

Page 13 GAO-17-23 West Coast Ports
Census, within Commerce, which it maintains and makes available for analysis. Environmental regulation and protection of port complexes, channels, and waterways, may involve multiple federal agencies including the Corps, the Environmental Protection Agency, and DOT.
Table 1: Summary of Selected Federal Agencies, Other Than the Department of Transportation, with a Role Related to Ports
Federal Agency Relevant Broad Mission Role Related to Ports Department of Agriculture Food safety and promotion of U.S. agricultural
goods on international markets Inspectors provide screening and isolation of specified agricultural commodities that are imported and exported through ports.
Department of Commerce Promotes fair trade and investment on behalf of U.S. industry (International Trade Administration) and maintains U.S. trade statistics (Census Bureau), and other activities that support policies that improve the competitiveness and efficiency of U.S. supply chains, under the Department’s mission to strengthen U.S. industry competitiveness, promote trade and investment, foster economic growth, and support American jobs.
International Trade Administration coordinates with other federal government and local agencies as well as with industry representatives about supply chain issues, including port issues. Census provides data and statistics on imports and exports.
U.S. Army Corps of Engineers Supports the movement of cargo along many of the nation’s waterways, including ports.
Civil works include waterside engineering and construction of port channels, harbor and berth dredging (and associated environmental review), and other activities to support navigable waterways.
Federal Maritime Commission (FMC)
An independent enforcement agency responsible for administrating U.S. shipping statutes and regulating the U.S. international ocean transportation system for the benefit of U.S. exporters, importers, and the U.S. consumer. The FMC’s mission is to ensure a fair, efficient and reliable ocean transportation system in U.S. trades, and protect the shipping public from unfair and deceptive practices.
Analyzes U.S. liner trades and their changing markets, reviews and monitors ocean carrier and marine terminal operator agreements to ensure a fair, efficient and secure maritime transportation system. Provides a forum for industry stakeholders to seek relief from unfair shipping practices, and can convene members of supply chain to identify and resolve common problems.
Department of Homeland Security Enforces U.S. trade laws, collects shipment data, and conducts security screening at ports (Customs and Border Protection) and assures port and waterway security (Coast Guard).
Cargo at ports is screened and inspected by Customs inspectors. Customs maintains the systems used to report imports and exports. Coast Guard vessels patrol ports and provide response forces for law enforcement, counter-terrorism, and safety.
Source: GAO summary of agency information. | GAO-17-23
Page 14 GAO-17-23 West Coast Ports
Some port infrastructure is outdated and not well suited to address the recent changes of global shipping. Literature we reviewed and stakeholders we interviewed as part of our case studies described how existing capacity at each of our case study ports could not adequately accommodate larger ships, specifically, and increased volumes, generally. For example, acreage for storing containers within some terminals (i.e. a terminal container yard) was identified as inadequate for handling increased container volumes, though a port may have sufficient acreage across its multiple terminals.21 Marine terminal operators increase terminal capacity by stacking containers higher, which are then more time-consuming and costly to sort through when a trucker arrives for pick up.22
Other infrastructure may be coming to the end of its useful life and need to be replaced or retrofitted to more capably handle larger ships and increased volumes. For example, according to the port authority of
21Decades ago, marine terminal operators typically offloaded containers immediately onto a truck chassis, reducing the storage capacity of the yard, but speeding container pick up by trucks. 22Containers are regularly stacked in terminal container yards, and other containers must often be moved out of the way for truckers to retrieve and load their designated containers. This practice often results in delays and congestion in the port. Computerized container management technology can modernize container stacking and retrieval processes.
West Coast Ports and Their Stakeholders Have Taken Actions to Address Constraints on Cargo Movement Created by Global Shipping Changes; However, Challenges Remain
Outdated Infrastructure Can Cause Constraints on Cargo Movement, but a Variety of Terminal and Inland Projects Are Under Way

Page 15 GAO-17-23 West Coast Ports
Seattle, installing new cranes that can reach across larger vessels would also require sections of one pier to be reinforced to handle the cranes’ heavier weight. Outside ports, aging roadways can also impede cargo movement to and from the port particularly where freight rail, trucks, and other road users converge at congested crossings and intersections. At each of our three case-study port complexes, stakeholders have identified numerous grade crossings, nearby and in the broader metropolitan region, that are problematic for the transport of growing cargo volumes. A number of terminal and inland infrastructure constraints created or exacerbated by global shipping changes are illustrated in figure 3.

Page 16 GAO-17-23 West Coast Ports
Figure 3: Types of Potential Waterside, Terminal, and Inland Infrastructure Constraints on Cargo Movement at Major West Coast Ports

Page 17 GAO-17-23 West Coast Ports
In response to global shipping changes, infrastructure projects have been completed or are planned at all major West Coast ports, though some projects have been deferred indefinitely. See appendix II for examples of these landside (terminal and inland) infrastructure projects. According to port authorities and other stakeholders we interviewed, infrastructure projects are of vital importance for maintaining the capability of serving current cargo volumes, as well as enhancing the long-term competitiveness of their ports and shippers’ products.23 For example, according to the Port of Oakland, the redevelopment of the former Oakland Army Base adjacent to the port into facilities serving port cargo will accommodate anticipated growth and provide shippers with transportation cost savings.24 The first phase of the project consists of several types of infrastructure development, including roads, an expanded railyard, and other facilities for the movement of goods. By increasing rail access, the port anticipates reducing truck traffic to and from the port and reducing the typical cost of transporting a container by an estimated $300.25 At full capacity, according to the Port and City of Oakland, the equivalent of 375,000 truckloads of cargo can be transported directly into the port by rail rather than by trucks, yielding over $112 million in annual savings for the nation’s exporters.
Infrastructure is funded through a combination of public investments and private sector partnerships, typically requiring significant resources and potentially decades to plan and complete. State and local governments, as well as port authorities of the three major West Coast port complexes look to both the federal government and the private sector to secure funding for infrastructure projects. For example, according to Port of Long
23Some stakeholders also noted that zero-emission technology at ports is being implemented, in part, to reduce both greenhouse gas emissions and pollutants like diesel particulate matter in order to achieve federal, state, and local air emission requirements, such as California’s Global Warming Solutions Act, CAL Health and Safety Code § 38501 (2007) which requires the reduction of greenhouse gases to 1990 levels, and the recently issued California Sustainable Freight Action Plan, available at http://www.casustainablefreight.org/files/managed/Document/289/CSFAP_FINAL_07272016.pdf. 24The project entails building new rail yards, warehouses, and intermodal facilities. The first phase of the project was estimated to cost $438 million in 2011. Phase 1 is expected to be completed in 2017. 25The estimate is based on the distance from the nearest alternate rail hub to the port and included in a market analysis of trucking costs cited by the port.
Page 18 GAO-17-23 West Coast Ports
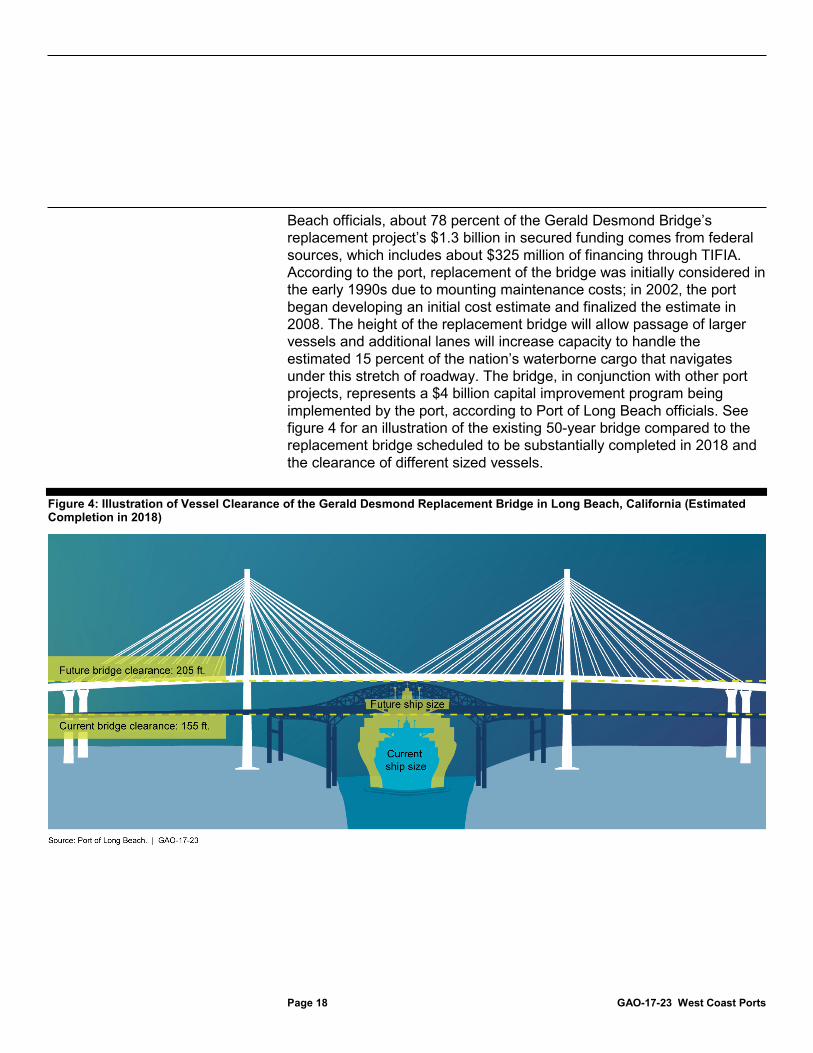
Beach officials, about 78 percent of the Gerald Desmond Bridge’s replacement project’s $1.3 billion in secured funding comes from federal sources, which includes about $325 million of financing through TIFIA. According to the port, replacement of the bridge was initially considered in the early 1990s due to mounting maintenance costs; in 2002, the port began developing an initial cost estimate and finalized the estimate in 2008. The height of the replacement bridge will allow passage of larger vessels and additional lanes will increase capacity to handle the estimated 15 percent of the nation’s waterborne cargo that navigates under this stretch of roadway. The bridge, in conjunction with other port projects, represents a $4 billion capital improvement program being implemented by the port, according to Port of Long Beach officials. See figure 4 for an illustration of the existing 50-year bridge compared to the replacement bridge scheduled to be substantially completed in 2018 and the clearance of different sized vessels.
Figure 4: Illustration of Vessel Clearance of the Gerald Desmond Replacement Bridge in Long Beach, California (Estimated Completion in 2018)

Page 19 GAO-17-23 West Coast Ports
Private partnership is also key for successful project implementation. For example, private entities were responsible for operating and maintaining some buildings and rail facilities, and the marine terminal, among other portions of the first phase of the Port of Oakland’s Army base redevelopment project.26 Though the first phase, specifically the rail yard, had received $15 million in TIGER funding, construction of the second phase of the redevelopment project, involving a new intermodal rail terminal, additional warehouse and logistics space, and a new grade separation have not yet commenced with various aspects of the project’s development still under negotiation. According to a Port of Oakland official, aspects of the project that mostly benefit the public, such as a new grade separation project, will likely require public investment, unless there is strong growth in rail activity through Oakland to motivate private investment.27 Similarly, the Port of Los Angeles’ modernization of a 185-acre terminal, which included automation and more than $500 million to develop, relied on a public-private partnership for funding and subsequent operations.28 According to Port authority officials, the port contributed $460 million, the state of California another $60 million in grants, and the marine terminal operator invested more than $200 million in specialized automated equipment. The marine terminal operator has a 30-year lease to operate the terminal. According to the Port of Los Angeles’ 2014 master port plan, this and other expansion projects are needed to ensure that projected future cargo volumes can be handled.
Although infrastructure projects were generally considered important by port stakeholders to address constraints in cargo movement, some questioned the effectiveness or the efficiency of some infrastructure investments. For example, one terminal operator we spoke with said that investments (which included federal funds) made at a competing terminal at the Port of Seattle were unnecessary because expected volumes could
26The private developers and their subsequent tenants would be under lease and covenant obligations to maintain their properties and improvements pursuant to lease or sales terms. 27Alameda County Transportation Commission included portions of Oakland’s Army Base phase II redevelopment project, its 2016 FASTLANE grant application. DOT did not award any funds to this project. 28According to officials from the Port of Los Angeles, improvements to this terminal included upgrades to the electrical grid and embedded magnets installed into the concrete pier, which allowed equipment such as automated guided vehicles to operate.

Page 20 GAO-17-23 West Coast Ports
be accommodated at lower costs by consolidating two terminals. Similarly, labor representatives also questioned the impact of pursuing infrastructure projects that automate terminal operations rather than other options that may as effectively improve a terminal’s efficiency, such as investing in longshoremen’s training and extending gate hours. Representatives from a trucking association also questioned infrastructure investments, such as some projects involving terminal automation, to enhance the efficiency of trucks picking up cargo without commensurate investments to improve inland roadways that are used to access the port.
Global shipping changes have affected how key equipment, specifically chassis, are made available, as well as strained traditional port and terminal gate hours, according to some literature and stakeholders included in our review.
• Difficulties with truck chassis availability and condition: In recent years, it has become increasingly difficult and time-consuming for truckers to obtain and pass road safety inspections, complete repairs, and reposition chassis, according to some literature and port stakeholders we interviewed. For example, according to a 2015 Federal Maritime Commission report, performing inspections just prior to exiting the terminal (instead of inspecting chassis beforehand and then loading only those that are roadworthy) can cause delays.29 If needed repairs are identified, the driver must wait for maintenance and repair crews at the port, who can be in short supply. Additionally, if an inspection finds damage on a chassis that is owned by a driver or a trucking company (rather than a third-party leasing company), the driver may elect to have repairs conducted off-site. However, the loaded containers would be required to be returned to the terminal, further delaying the movement of cargo. Other reported chassis issues stem from provisions in some contracts between a third-party leasing company and an ocean carrier, which specify the brand of chassis to be used or where the chassis must be repositioned after use. According to representatives from one trucking association we interviewed, such provisions limit chassis options for truckers and
29Federal Maritime Commission, 2015.
Global Shipping Changes Have Strained Operations, but Ports and Their Stakeholders have Attempted to Mitigate These Effects on Cargo Movement
Page 21 GAO-17-23 West Coast Ports
require them to make extra trips retrieving and repositioning approved chassis rather than hauling containers.
• Changes in cargo loads and schedule delays due to alliances: Broader shipping alliances have complicated vessel unloading and loading, as cargo booked with multiple ocean carriers may be onboard the same vessel but bound for different terminals within a port or different destination ports. According to some stakeholders, containers typically are not loaded at origin ports in Asia by “block stowage,” where containers bound for a particular terminal are grouped together onboard to facilitate more efficient unloading. The mixture of containers from multiple alliance partners on a vessel increases the time it takes to unload and sort containers. This in turn can lead to a cascading effect, potentially delaying the arrival of other vessels at an occupied terminal.
• Adequacy of terminal gate hours: The standard daytime gate hours of marine terminals (7 or 8 am to 4 or 5 pm) may be inadequate, particularly given the complexity and time required to load and unload containers. Some port stakeholders, specifically, trucking and labor representatives, indicated that additional gate hours could improve congestion. Most stakeholders we interviewed agreed that marine terminal operators do not hire labor for extra shifts unless there is a specific demand (i.e., request or requirement) for it by cargo owners, because the additional costs associated with these shifts would not be offset by the amount carriers or cargo owners generally pay.30 Some stakeholders acknowledged that there may not be sufficient demand from shippers to pick up cargo in the off-peak hours if, for example, distribution warehouses are not open to receive these containers. Where night gate hours have been instituted, such as the ports of Los Angeles and Long Beach, several stakeholders said it contributed to congestion at certain times because drivers and shippers, wanting to avoid the traffic mitigation fees charged for daytime pickup, line up prior to off-peak hours.31 A senior official from PierPass, the organization that manages the collection of daytime fees and marine
30Work shifts, such as start and end times, duration of shifts, overtime pay, are provisions covered under labor contract between the ILWU and the PMA. 31The primary goal of instituting night hours was to remove freight traffic from Southern California freeways during peak congestion hours for the benefit of the general motoring public. Fees collected are used to offset, in part, the additional costs incurred by marine terminal operators for extra labor shifts.

Page 22 GAO-17-23 West Coast Ports
terminal operators’ participation, suggested that port authorities provide a staging area for those truckers waiting to pick up cargo during the off-peak shift that could provide a place for them to rest, eat, and access restroom facilities.
Stakeholders at all major West Coast ports have taken a number of actions to address impacts from larger ships, alliances, and the provision and condition of chassis, according to the stakeholders we interviewed. Some efforts have been undertaken in a collaborative manner, while others have been pursued individually by stakeholders. These efforts seek to maximize competitive advantages for a port complex or a private entity to maintain or secure shipping business. Illustrative examples include the following:
• In May 2015, the Ports of Los Angeles and Long Beach created the Supply Chain Optimization Steering Committee to organize supply-chain stakeholder working groups.32 One working group facilitated a chassis pool that allows any chassis in the combined fleet to be utilized by any authorized user and expands the number of pick-up and drop-off locations. Other working groups are addressing container terminal optimization, key performance indicators, information flow and data solutions, off-dock solutions, drayage (the movement of containers in and out of ports by truck), and intermodal rail.
• In February 2016, the Port of Oakland allocated $1.5 million to reimburse marine terminal operators up to 50 percent of their costs for operating night gates over a 12-week period. In June 2016, the port allocated another $1.7 million for these extended night gate operations. According to an Oakland port official, the subsidy was instituted in response to increased cargo flows at several of its marine terminals following the cessation of operations of its second-largest terminal operator due to bankruptcy in early 2016. According to this official, the largest terminal operator reported about 600 container transactions every night and 1,200 on Saturdays, easing daytime,
32This working agreement (Los Angeles and Long Beach Port Infrastructure and Environmental Programs Cooperative Working Agreement, FMC Agreement No. 201219-001) was required to be filed with the FMC in accordance with its statutory and regulatory authority to oversee port authorities. 46 U.S.C. § 40302 and 46 C.F.R. Part 535. The agreement allows, among other things, the ports to discuss and agree on projects and programs that address transportation infrastructure needs and reduce pollution caused by port-related activities.

Page 23 GAO-17-23 West Coast Ports
peak gate hours. This terminal operator has begun assessing a flat fee of $30 on all loaded import and export containers to continue night gate operations.
• In August 2015, the Ports of Seattle and Tacoma formed the Northwest Seaport Alliance as a way of staying regionally competitive against other North American ports.33 Each port maintains its own board of commissioners. By combining resources and jointly managing terminal assets, the alliance hopes to undertake specific facility improvement projects that might have been infeasible as separate port entities. For example, in April 2016, the two boards voted to approve $141 million for infrastructure improvements at one terminal at the Port of Tacoma, as well as to extend the marine terminal operator’s lease at this terminal for an additional 20 years. The alliance plans a similar terminal modernization project in Seattle. Through the alliance, the two ports jointly advocate for regional projects to the Washington state legislature, according to port officials. The alliance has also developed a unified marketing program to communicate its combined competitiveness to shippers, ocean carriers, and the public.
• Terminal operators have also sought to address container yard acreage and gate hour constraints. For example, some terminal operators, such as those at the Ports of Oakland, Los Angles, and Long Beach, have instituted trucker appointment systems that allot a window of time for truckers to arrive at the terminal. This allows operators to approximate when a container is expected to leave the terminal and enhances their ability to effectively stage a container for efficient pick-up. However, appointment systems can be costly to set up and traffic outside the port and other factors can force appointment windows to be missed, according to some stakeholders. One terminal operator we interviewed is using a 100-acre off-dock depot for container storage in Southern California, which is located some distance away from the port, where shippers can pick up and send containers. According to this terminal operator, such facilities allow truckers to move containers more efficiently because they can avoid congested roads near the ports.
33This business arrangement (Port of Seattle/Port of Tacoma Alliance Agreement, FMC Agreement No. 201228) was also required to be filed and reviewed by the FMC.

Page 24 GAO-17-23 West Coast Ports
Port stakeholders interviewed as part of our case studies highlighted some key challenges to mitigating infrastructure and operational constraints stemming from global shipping changes. Port stakeholders, in particular state and local governmental agencies, said that aligning public and private competing priorities or interests to fund or construct port infrastructure projects was difficult. We have previously found that freight projects may not compete well with other types of transportation projects for limited available public funds because their benefits are not always obvious to the public.34 State and local government officials we interviewed noted that this tension may be particularly acute for ports located in large metropolitan areas, such as the major West Coast ports. These areas are experiencing significant population growth with demand for housing, transit, and environmental protections.35 For example, plans for a near-dock railyard at the Los Angeles-Long Beach port complex could falter because of local lawsuits over its potential environmental impact. Funding port or freight infrastructure for large volumes of “discretionary” cargo (that is, cargo not destined for the local or regional markets, but bound for the national market) can also be perceived as heightening overall congestion or producing negative effects in local communities.36 Moreover, as we have previously found, federal programs that can be used to address certain freight-related issues do not always align with local priorities, and state and local transportation funds are often limited and prioritized for operating and maintaining existing highway infrastructure.37 According to port authorities we spoke with, local and state DOTs are beginning to recognize the importance of freight mobility, but the voting public may be less supportive of freight projects
34GAO, Freight Transportation: Strategies Needed to Address Planning and Financing Limitation, GAO-04-165 (Washington, D.C.: Dec. 19, 2003) and GAO, Freight Transportation: National Policy and Strategies Can Help Improve Freight Mobility, GAO-08-287 (Washington, D.C.: Jan. 7, 2008). 35Similarly, officials from the port authorities for New York and New Jersey, as well as Houston also agreed that being located in large and growing metropolitan areas created challenges for delivering port projects in the face of other demands. 36For example, we have previously reported that the movement of certain energy commodities raised public concerns because there was no perceived direct economic benefit to the states these commodities transited through, while local communities experienced congestion-related and other negative impacts. GAO-14-740. 37GAO-14-740.
Port Stakeholders’ Efforts to Address Infrastructure and Operational Constraints Are Hampered by Competing Priorities and Limited Data
Page 25 GAO-17-23 West Coast Ports
and as a consequence, transportation funding is often focused on commuters.
Private sector interests, such as shifts in shipping alliances, may also conflict with planning efforts to facilitate cargo movement. It can be difficult for port authorities to target their investments in infrastructure projects that will yield sustained improvements in cargo movement because of evolving industry alliances. For example, new shipping alliance agreements may require all vessels within the alliance to call on specified port terminals, quickly changing the flow of cargo through a port. These changes may conflict with what importers, exporters, or port authorities may believe to be the best-suited terminal for their respective needs (i.e., does the appropriate terminal or inland have capacity such as on-dock rail to handle additional volumes?). For example, at the Port of Seattle in 2013, after a shift in an alliance, a major ocean carrier directed its vessels to call on a different terminal, moving from a larger terminal to a smaller one, and increasing congestion within that terminal. Additionally, marine terminal operators may abruptly end operations at a port, even when they have a long-term contract, if the operators are not able to attract sufficient cargo volumes to sustain profitability. This situation happened in Oakland in 2016, when a terminal operator filed for bankruptcy 6 years into a 50-year lease—publicly citing that it was choosing to concentrate its resources at its other terminals, including those at the port complexes of Los Angeles-Long Beach and Seattle-Tacoma.
Some state and local government officials from our case studies of port complexes said that information on port performance and supply chains would be helpful to help target operational and infrastructure efforts.38 For example, local officials in Seattle indicated they have some information on
38The U.S. Department of Transportation is required under MAP-21 to establish freight mobility performance measures to assess freight movement on the Interstate highway system. Pub. L. No. 112-141 § 1203, 126 Stat. 405, 524-525 codified at 23 U.S.C. § 150. The Department of Transportation has proposed measures for highway freight congestion, but, according to DOT officials, this measure does not include information on the impact different levels of performance might have on different cargo based on attributes like perishability, degradation of value, or, for essential cargo, on-hand supplies. MAP-21 also requires states and metropolitan planning organizations to set performance targets in relation to these measures as part of their planning processes. We have ongoing work examining these issues.

Page 26 GAO-17-23 West Coast Ports
truck counts, but lacked information about cargo loads (e.g., number of empty trucks versus trucks carrying heavy hauls) and their interim and final destinations. Officials explained that having that information would help them design and prioritize street improvements, such as signal timing, turning radius, and pavement conditions on certain streets. Similarly, officials from the Southern California Association of Governments said that while they were able to conduct roadside truck counts to tally the number of trucks coming and leaving the port, they did not have information into the origins and destinations of these trucks. Moreover, these limited counts can become quickly outdated for planning purposes and agency officials stated they lack the resources to continually gather new data. Without these data, local and regional planners may be less likely to use a performance-based approach and less able to justify transportation projects, such as port-related projects relative to other modes or priorities. Similarly, limited information on supply chain practices can lead to public investments underperforming. For example, use of the Alameda Corridor—a 20-mile freight rail expressway linking the ports of Long Beach and Los Angeles to the nation’s transcontinental rail network—was lower than expected because it was anticipated that 50 percent of port cargo that left southern California by rail would do so using the corridor. However, after operations began in April of 2002, only about 30 percent of the ports’ containerized cargo was using the rail corridor. A 2004 study revealed that a new cargo handling practice called transloading was occurring in the transportation logistics industry. This practice entails moving containerized imports by truck from ports to local and regional distribution centers. The cargo then is transferred from 40-foot ocean containers to longer domestic containers before being shipped by rail from loading points that bypass the corridor. Transloading practices are used by shippers to more efficiently control inventory by postponing domestic destination and volume decisions until after cargo arrives in the United States. According to officials from the Alameda Corridor Transportation

Page 27 GAO-17-23 West Coast Ports
Authority, transloading partly explains the lower than expected use of the Alameda Corridor.39
Ports that are already strained and experiencing congestion may be particularly vulnerable to events such as natural disasters or disruptions that can further impede the movement of cargo through ports and, in turn, impact shippers’ supply chains. When we asked representatives from selected industry groups about recent disruptive events to shippers’ supply chains, almost all of them told us that at least some shippers experienced impacts to their supply chains from recent port disruptions.40 Most industry groups brought up the 2014 and 2015 West Coast labor negotiation as the most disruptive event in the last 5 years; some also mentioned other disruptive events. Of our 21 selected industry groups, over half, or 13 industry groups, told us some shippers took actions in response to the 2014 and 2015 disruption, such as modifying their supply chains. However, about one-third, or 6 industry groups, said some shippers had difficulty making such modifications due to specific firm or commodity attributes or prohibitively high costs. Other industry groups said shippers made no supply chain modifications because they were able to weather the disruption. Our analysis, using U.S. Census international trade data from the first quarter of 2005 through the first quarter of 2016, found some significant changes in trade flows, especially decreased exports, during the disruption period, suggesting the disruption may have had an impact on exports from West Coast ports.
39The Alameda Corridor was a $2.4 billion project funded primarily with revenue bonds and a federal loan and some grant funding. Its debt is paid from fees collected from the two user railroads, the Union Pacific Railroad and the Burlington Northern Santa Fe Railway, through a public/private partnership. Because the Corridor was built to accommodate future port growth, the debt service was structured to increase gradually over time. The share of port volume on which a Corridor fee is collected has stabilized at about 35 percent and debt service has been restructured accordingly over the past decade, according to the Alameda Transportation Corridor Authority. 40We interviewed 20 industry groups, or trade associations, representing shippers in various industries, and 1 representative of an industry where an industry group was not readily able to interview concerning the particular commodity. For the purposes of this report, we refer to these 21 interviewees as industry groups. When we discuss impacts on shippers, we are referring to impacts felt at the firm level for those shippers within a particular industry group. For more information, see table 5 in appendix I.
Selected Shippers Were Impacted to Varying Degrees by Port Disruptions, Especially in 2014 and 2015, and Responded by Modifying Their Supply Chains

Page 28 GAO-17-23 West Coast Ports
Almost all of our 21 selected industry groups said that shippers in their respective industries using major West Coast ports were affected by recent port disruptions. Specifically, representatives from 18 such groups told us that at least some shippers experienced some impacts to their supply chains from recent disruptive events such as the 2014 and 2015 port disruption, while about half (11 out of 21) said that all or a majority of shippers who ship out of West Coast ports were affected by that disruption.41 Interviewees said the disruption in 2014 and 2015 mainly affected containerized shipments.
Some industry groups also told us that other events such as severe weather events have also caused port disruptions in the last 5 years. For example, winter weather conditions have closed the Snoqualmie Pass on Interstate 90 in Washington State—a critical transportation corridor linking the port of Seattle to the agricultural industries of Eastern Washington—with little advanced warning, making it difficult at times to arrange reliable transportation to and from the port, an industry group said. In addition, a severe winter in 2013-2014 in the Plains resulted in rail backups to West Coast ports for Midwest corn growers and exporters, industry representatives told us. Representatives from one industry group said it is difficult to make contingency plans for unpredictable events like these, particularly since shippers make shipment decisions months in advance.
Most industry group representatives we spoke with said the main types of short- and long-term financial and business impacts they experienced as a result of the 2014 and 2015 port disruption included increased costs, decreased revenue, and shipment delays (see table 2). For example, almost all of the industry groups (17 out of 21) told us they experienced some form of increased costs, and several industry groups experienced multiple types of increased costs. Specifically, 13 of those 17 industry groups noted shippers experienced increased transportation or storage costs, and 6 noted shippers also experienced late fees imposed for late shipments. Some of the impacts were short-term—such as increased costs or shipment delays—while other impacts were of longer-term duration, such as the loss of sales, customers, or market share.
41Some industry groups we spoke with represented a wider range of shippers, not just shippers who shipped out of the West Coast ports.
Impacts on Selected Shippers from Port Disruptions and Shippers’ Responses Varied

Page 29 GAO-17-23 West Coast Ports
Table 2: Main Types of Financial and Business Impacts Selected Industries Experienced Following 2014 and 2015 West Coast Port Disruption, as Reported by Industry Groups
Type of impact Number of industry groups (out of 21) Example Increased costs 17 out of 21 industry groups Transportation or storage costs 13 out of these 17 industry groups mentioned
increased transportation or storage costs, as a result of diverting goods to alternative ports or via alternate modes of transportation, for example.
A furniture importer said steamship lines were charging $6,000 for container space on a vessel—three times the normal rate—due to port congestion, which increased transportation costs.
Late fees 6 out of these 17 industry groups mentioned paying late fees, which can be charged by the ocean carrier, the port terminal operator, or by other businesses in the supply chain.
A soybean exporter said it paid about $200,000 in late fees in 2014 and 2015, more than 50 percent of what the business might net in a year.
Other costs 2 of these 17 industry groups mentioned other costs as a result of the disruption.
Auto industry representatives said many firms had to expend additional manpower resources to find solutions or provide workarounds to the disruption.
Decreased revenue 14 out of 21 industry groups Lost sales or lower prices 9 out these 14 industry groups mentioned lost
sales or discounted product prices, which happened, for example, after delays caused products to arrive after their intended season.
An apparel industry representative told us most apparel products are imported for the back-to-school season in June and for the winter holiday season in September. Products that arrived past their intended season were discounted right away or sold to discount retailers who specialize in last season apparel.
Lost customers/market share 8 out of these 14 industry groups mentioned lost customers or market share to foreign competitors as an impact.
A hay shipper said his company lost a $5 million contract in the Middle East because the U.S. shipper was unable to provide reliable shipments.
Other impacts of delays 11 out of 21 industry groups Delays impacted supply chains, customer relations
11 industry groups mentioned delays either impacted supply chains if parts or inventory were running low, or resulted in customer relations problems.
A meat export industry representative said customer relations problems arose after foreign importers received multiple shipments of meat products at one time, when they had anticipated a steadier stream of deliveries.
No significant impacts 3 out of 21 industry groups No significant impacts 3 industry groups reported experiencing no
impacts because specific firm or commodity attributes enabled them to either weather the disruption or mitigate any impacts.
Some of the imports used by home builders do not rely heavily on West Coast ports. Also, because the industry is decentralized with many small entities spread across the country, home builders are often not well positioned to know whether port disruptions have an impact on the supply of materials they purchase.
Source: GAO analysis of stakeholder interviews. ׀ GAO-17-23
Note: Some industry representatives listed multiple impacts.

Page 30 GAO-17-23 West Coast Ports
In order to mitigate some of the impacts of the disruption, over half of the selected industry groups (13 out of 21) told us at least some shippers responded to the 2014 and 2015 port disruption by temporarily modifying their supply chains. Modifications included diverting shipments to other ports or alternate modes of transportation—mostly air freight—or diverting shipments intended for the export market to the domestic market. According to these industry groups, all of these supply chain modifications increased costs or decreased revenues. About one-third, or 6 industry groups, said some shippers had difficulty modifying their supply chains or making alternative shipping arrangements due to specific firm or commodity attributes or simply due to the prohibitive increased costs of doing so. Other industry groups said shippers in their industry did not deem it necessary to make such arrangements because, for example, their shipments were not perishable or time sensitive (see table 3). Following the end of the recent port disruption, industry groups said shippers in their industry maintained and permanently implemented some of the supply chain modifications they made, such as shipping some commodities through East or Gulf Coast ports instead of West Coast ports, in order to diversify their shipping routes and minimize their risk exposure to West Coast ports in the case of future disruptions there.
Table 3: Supply Chain Modifications Shippers Made during 2014 and 2015 West Coast Port Disruption, as Reported by Selected Industry Groups
Supply chain modification Number of industry groups (out of 21) Example(s) Diversions to other route, mode, or destination
13 industry groups
Through other ports 11 out of these 13 industry groups mentioned diverting cargo to alternate sea ports, including East Coast, Gulf Coast, and Canadian ports.
Some California wine exporters used Gulf Coast ports instead of West Coast ports to get their product to Japan. Furniture importers rerouted some product through East Coast ports instead of West Coast ports.
To alternate modes 5 out of these 13 industry groups said they diverted cargo to alternative modes of transportation, mainly air freight and some rail freight to Mexico or Canada, during the disruption.
Some toy importers switched from waterborne cargo to air freight, which costs about 10 times more. For example, to ship a container of toys by water it costs $6,000 and by air it is $60,000. Some scrap exporters sent scrap by rail and truck to Mexico.
To domestic market 1 out of these 13 industry groups mentioned selling goods originally bound for export on the domestic U.S. market during the disruption.
Meat exporters diverted some product to the U.S. domestic market and sold it at lower prices—due to oversupply domestically—than they would have received in the originally-intended market of East Asia.
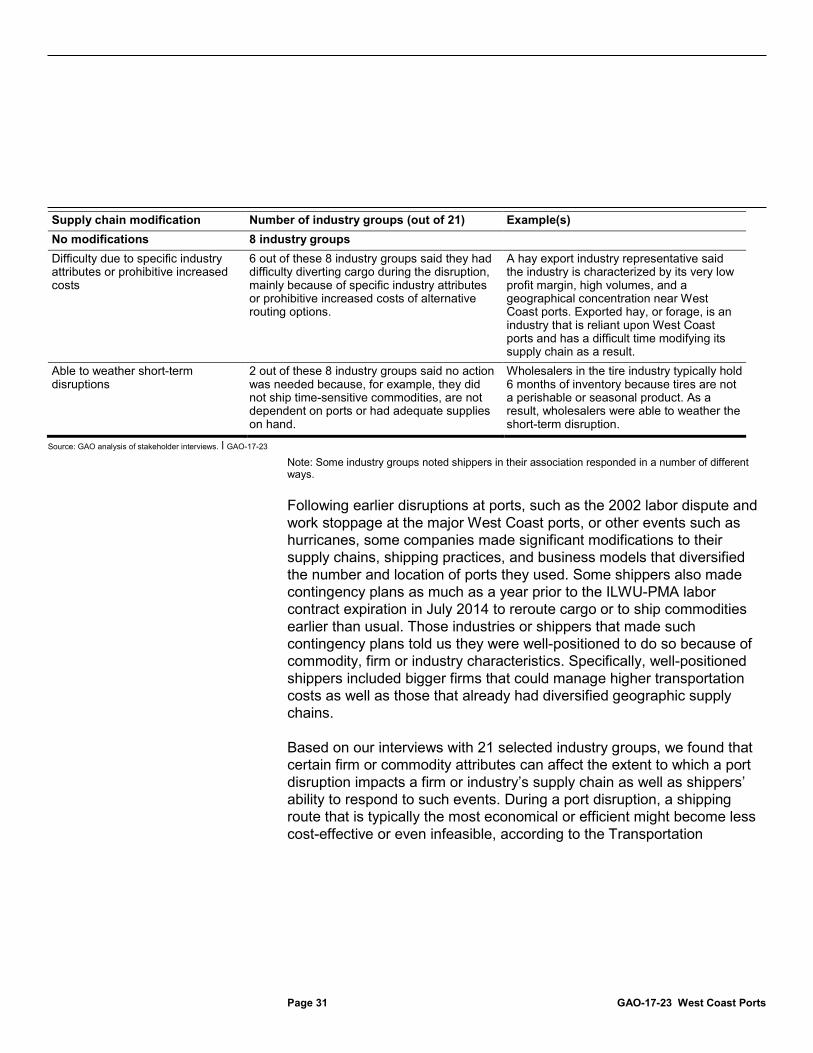
Page 31 GAO-17-23 West Coast Ports
Supply chain modification Number of industry groups (out of 21) Example(s) No modifications 8 industry groups Difficulty due to specific industry attributes or prohibitive increased costs
6 out of these 8 industry groups said they had difficulty diverting cargo during the disruption, mainly because of specific industry attributes or prohibitive increased costs of alternative routing options.
A hay export industry representative said the industry is characterized by its very low profit margin, high volumes, and a geographical concentration near West Coast ports. Exported hay, or forage, is an industry that is reliant upon West Coast ports and has a difficult time modifying its supply chain as a result.
Able to weather short-term disruptions
2 out of these 8 industry groups said no action was needed because, for example, they did not ship time-sensitive commodities, are not dependent on ports or had adequate supplies on hand.
Wholesalers in the tire industry typically hold 6 months of inventory because tires are not a perishable or seasonal product. As a result, wholesalers were able to weather the short-term disruption.
Source: GAO analysis of stakeholder interviews. ׀ GAO-17-23
Note: Some industry groups noted shippers in their association responded in a number of different ways. Following earlier disruptions at ports, such as the 2002 labor dispute and work stoppage at the major West Coast ports, or other events such as hurricanes, some companies made significant modifications to their supply chains, shipping practices, and business models that diversified the number and location of ports they used. Some shippers also made contingency plans as much as a year prior to the ILWU-PMA labor contract expiration in July 2014 to reroute cargo or to ship commodities earlier than usual. Those industries or shippers that made such contingency plans told us they were well-positioned to do so because of commodity, firm or industry characteristics. Specifically, well-positioned shippers included bigger firms that could manage higher transportation costs as well as those that already had diversified geographic supply chains.
Based on our interviews with 21 selected industry groups, we found that certain firm or commodity attributes can affect the extent to which a port disruption impacts a firm or industry’s supply chain as well as shippers’ ability to respond to such events. During a port disruption, a shipping route that is typically the most economical or efficient might become less cost-effective or even infeasible, according to the Transportation
Page 32 GAO-17-23 West Coast Ports
Research Board.42 As a result, shippers may strive to make alternative plans to minimize any additional costs and time. After speaking with the 21 selected industry groups, we found several commodity attributes, as discussed below, that were frequently important in influencing the ability of shippers to respond to a disruption. Some industries or commodities might possess several of these attributes simultaneously, which may complicate their shipping options further.
• Geography of a shipper’s supply chain: Fourteen industry groups said the location of many shippers and their individual supply chains—namely, where the product is produced (or in the case of agricultural commodities, grown) and sold—affects the magnitude of impacts on and responses by shippers in an industry to a port disruption. Geographic factors influence supply chain decisions, as shippers search for routing and shipping options with low costs. For example, the entire U.S. commercial supply of almonds is grown in California, near the Port of Oakland. As a result, shipping almonds from other ports can be too costly, according to an industry group. A disruption at the Port of Oakland might impact these exporters to a greater degree than those exporters whose products are grown or manufactured in multiple locations and, therefore, near multiple ports that can be reached at low transportation costs.
• Time-sensitivity: Six industry groups told us their products or shipments are time-sensitive because they are seasonal, perishable, or rely on a “just-in-time” business model. For example, apple industry representatives told us shipments of apples follow regular and predictable growing and harvesting seasons. Some shipments are also time-sensitive if they are meant to reach the market in time for a particular shopping seasons driven by consumer demand—such as the back-to-school or winter holiday seasons. For example, about 60 percent of total toy sales occur in advance of the winter holiday season, according to an industry group we spoke with. Consequently, the peak shipping season for toys is from late August to November. Perishable agricultural products are time-sensitive because they have a limited shelf-life. For example, exports of chilled meat to East Asia are time-sensitive because transit across the Pacific Ocean takes
42Transportation Research Board, National Cooperative Highway Research Program, Methodologies to Estimate the Economic Impacts of Disruptions to the Goods Movement System (Washington, D.C.: 2012).

Page 33 GAO-17-23 West Coast Ports
several weeks from the West Coast and the chilled meat has a limited shelf-life, according to an industry group we spoke with. In addition, several industry groups told us they rely on a “just-in-time” business model, making their shipments time-sensitive as well.
• Profit margins: Six industry groups told us that shippers with low profit margins may be more affected by disruptions at ports they use because alternative routes may not be cost-effective. For example, soybean shippers told us profit margins in their industry can be as low as 1 to 2 percent, and any additional costs, such as late fees assessed by a trade arbitration organization when shipments are delayed, potentially result in firms losing money. In addition, apparel products have low gross profit margins, which preclude them from switching from ocean freight to more expensive air freight, according to an industry representative.
• Dependence on imports/exports: Ten industry groups told us their industries were highly reliant on imports or exports. For example, some retail industry groups said nearly all of what they sell in the United States is imported, while other manufacturers said they are highly reliant on imported components. Specifically, 98 percent of apparel sold in the United States is imported, mostly from Asia, according to an industry representative we spoke with. In addition, about 90 percent of wood furniture sold in the United States is imported, according to industry representatives we interviewed. Other industries may have highly trade-dependent niche products. For example, the vast majority of the nation’s hay crop is used domestically, but some types of hay are almost exclusively exported, industry representatives told us. If importers or exporters in an industry are almost entirely reliant on ports for market access, then any disruption at those ports would likely have large impacts on those firms.
• Storage or inspection requirements: Six industry groups told us that their industry has specific storage or inspection requirements relevant to importing or exporting their cargo and that these requirements affect their ability to modify their supply chain in response to port disruptions. The requirements cannot be met by all ports because some ports, or port regions, lack the necessary facilities. For example, according to an industry expert, petroleum coke, a byproduct of the oil refining process used for energy in some other countries, has specific storage requirements due to environmental concerns. Likewise, as part of the United States Department of Agriculture’s (USDA) port-of-entry inspections, some agricultural imports must be treated (e.g., with chemicals, heat, or irradiation) prior to their release in the U.S. market

Page 34 GAO-17-23 West Coast Ports
because of concerns with plant pests not known to occur in the United States but prevalent in the country of origin. For example, imports of Chilean grapes must be fumigated with methyl bromide prior to release in the United States. As a result, disruptions at a port with the specialized facilities might have more of an impact on those industries since fewer ports can handle rerouted cargo, industry groups told us.
Our analysis of U.S. Census international trade data from January 2005 to March 2016 finds some significant changes in the dollar value of trade flows at certain ports coinciding with the 2014 and 2015 West Coast port disruption. Specifically, our statistical analysis showed total exports at major West Coast ports were significantly lower in this time frame than during other quarters included in the analysis, given other established trends in the economy and other factors we were able to control for. Trade flows can be affected by many factors, so it is difficult to know the extent to which the 2014 and 2015 port disruption contributed to variations in trade flows without considering the impact of other factors that can affect trade.43 Therefore, we developed a statistical method to examine trade flows at large U.S. ports during the West Coast port disruption. The model helped identify whether the level of trade at West Coast ports was significantly different compared to other quarters included in our analysis, after controlling for factors that might influence trade over time. Specifically, the model controlled for some variables that might influence the level of trade over time, such as trends in trade volumes over time, seasonality, and the influence of the recession of late 2007 to 2009. It also controlled for a set of variables to capture the influence of specific characteristics of each port, each commodity
43For example, factors that can affect trade include long-term trends in trade volumes over time, specific economic events such as the recession of late 2007 to 2009, exchange rates, seasonality, weather events, and unknown economic or political events worldwide or in specific regions, among other factors.
2014 and 2015 Port Disruption May Have Contributed to Changes in Trade Flows
Page 35 GAO-17-23 West Coast Ports
category, and each trading partner country.44 Our analysis examined: (1) whether the dollar value of all imports and exports at West Coast ports (and ports at other coasts) on average, across ports, commodities and trading partners during the port disruption period was significantly different compared to other quarters included in our analysis, and (2) whether the dollar value for our 13 selected import commodities in aggregate and our 14 selected export commodities in aggregate appeared to be different during the relevant timeframe than during other quarters, and (3) whether trade flows to and from U.S. airports along the three coasts were different during the disruption timeframe compared to other quarters. Appendix IV provides more detailed information on our statistical model.
For all vessel exports as well as for some of our selected export commodities, we found significant changes in export levels at West Coast ports during the first quarter of 2015. By contrast, import levels for all imports as well as for all of our selected import commodities at West Coast ports during the relevant time frame were not statistically different than during other quarters, given established trends and our other control variables.
• Exports: For vessel exports, it appears that the port disruption of 2014 and 2015 coincided with reduced exports from large West Coast ports.45 First, we found that the extent to which total exports were lower during this time frame than in past quarters was not constant over the three quarters examined. Specifically, during the third quarter of 2014, exports from West Coast ports were not statistically lower
44Specifically, these port, country, and commodity factors are “time invariant’ dummy variables, meaning that they do not vary with time or have not changed during our study period. These variables capture influences on trade due to characteristics of ports (such as the physical characteristics of a port and its management), characteristics of commodities (such as underlying demand characteristics for the commodity) and characteristics of our trading partner countries (such as the location of the country and the nature of its trade agreements with the United States). When we also controlled for exchange rates between the United States and each trading country, we found the key results were not affected. The model was unable to control for other possible influences on trade that either we did not know of or could not be controlled for, such as changes during our study period related to political, economic, or climactic events in other countries that could impact trade. 45Vessel exports are defined as those shipments that leave from U.S. seaports.

Page 36 GAO-17-23 West Coast Ports
than other quarters, while in the fourth quarter of 2014, our findings suggest, with only weak statistical significance, that exports were likely somewhat lower than past quarters. By the first quarter of 2015, we find that, on average across our port, commodity, and trading partner observations, exports appear to have been about 50 percent lower than past levels based on what we could control for in the model.46 These findings suggest that the reduction in the value of exports may have been in the billions of dollars. However, it is important to note that there could be other elements at play that also had an influence on trade flows.47 Second, we ran a separate regression to examine trade flows for 14 specific West Coast export commodities. We found that those exports on average were not different than past levels in either of the last two quarters in 2014, but were lower than past levels in the first quarter of 2015. In addition, those exports remained lower than past levels after the port disruption was resolved, possibly indicating lingering effects from the disruption (e.g., resulting from lost customers or market share, or permanent diversions of cargo to other ports), some other factor not accounted for in the model, or, a combination of both. These results could be consistent with information we gathered during our interviews. Namely, some exporters experienced revenue losses, including lost customers or market share, and exports in their industry are not back to pre-disruption levels.
• Imports: We did not find that West Coast port vessel imports were statistically different during any of the three quarters that correspond with the 2014 and 2015 port disruption when compared to imports during other quarters included in our analysis.48 We also found that
46There was a fairly large standard error around this estimate, meaning that the specific value was fairly uncertain. Moreover, because this estimate reflects an average extent of changes in exports across the port, commodity, and trading partner country observations in the model, it is possible that certain observations reflected very large reductions in trade while others did not. Nevertheless, our findings do suggest that it is likely that there was a substantial reduction in exports during the first quarter of 2015, relative to the level of trade during other quarters included in the analysis, after accounting for seasonality, trends, and a variety of fixed effects. 47For example, we found that exports were lower than past quarters at Gulf Coast ports during late 2014 and then again in late 2015, well after the disruption was over. As such, it may be that unknown factors were contributing to reduced exports at Gulf Coast ports or that the same unknown factors were affecting exports from both coasts—during the relevant timeframe. 48Vessel imports are defined as those shipments that arrive at U.S. seaports.

Page 37 GAO-17-23 West Coast Ports
there were no differences in total imports at East Coast ports during this time frame compared to other quarters included in the analysis. However, our model did find that the dollar value of imports at Gulf Coast ports was substantially higher during the three quarters of the port disruption than other quarters included in the model, and those imports continued to be higher than past levels in every subsequent quarter at Gulf Coast ports, up to and including the first quarter of 2016. These findings may suggest that some factor or factors other than those considered in our analysis are related to rising imports in the Gulf region in recent years. It is also possible that diversion from West Coast ports may have played some role in these increases during the port disruption but because we found no statistical evidence that imports were lower at West Coast ports, it would appear that diversion likely played a small role, if at all.49 Second, we ran a separate regression to examine whether trade flows for 13 specific West Coast imported commodities were statistically different during the disruption period compared to other periods after controlling for the various factors mentioned above. For these 13 imported commodities, consistent with our findings for all commodities imported from West Coast ports, we found that trade was not different from past levels in any of the time frames examined.
Our analysis also indicates that, for imports, there may have been some shifts to air freight during the disruption period. We used our model to examine whether trade flows at large U.S. airports exhibited any unusual changes during the same quarters of the 2014 and 2015 disruption. We found that imports were statistically higher during the last two quarters of 2014 but not during the first quarter of 2015, compared to past levels at
49We did not find any statistical indication that imports were different at West Coast ports than expected during the port disruption, despite hearing during our interviews about specific impacts that some West Coast port importers experienced during this time frame. Notably, we were told that some imports bound for West Coast ports were delayed and that importers engaged in some diversion of goods to other U.S. ports as well as to ports in Canada and Mexico, and that some importers suffered additional costs for transportation and/or suffered revenue losses. It is useful to note that our empirical analysis solely examined overall trade levels, but could not detect certain other possible impacts of the port disruption. For example, if a shipment of imports was delayed but still arrived in the originally scheduled quarter—which is the time frame of our data—such delays would not show up in our analysis. Additionally, our analysis cannot determine whether additional costs were incurred to expedite transportation due to a possible delay at ports. And finally, imports that were somewhat late might miss critical time frames, which can lead to increased costs such as late fees or revenue losses for importers. These financial impacts would not be identifiable in the data we examined.
Page 38 GAO-17-23 West Coast Ports
the West Coast airports. However, we found no changes in air imports at East or Gulf Coast airports during any of the time frame examined in our analysis. While our findings may suggest that some imports that might have typically been shipped by sea to West Coast ports were diverted to West Coast airports—which we also heard during some of our interviews with trade groups—it is possible that other factors influenced the trends we found at West Coast airports.50
DOT’s freight-related activities have grown increasingly multi-modal and inclusive of ports since 2012. In the draft National Freight Strategic Plan, issued in October 2015, DOT signaled the importance of ports to the freight system and, through the inclusion of ports in two new funding programs, DOT is better positioned to support ports than in previous years. However, there are substantive gaps in the supply chain information DOT (and state and local governments) have available to them to support freight efforts. Disruptions at ports can have ramifications throughout industry supply chains. Based on leading practices in capital decision making, we previously recommended that DOT develop a freight-data improvement strategy to address gaps related to, among other things, local impacts of freight congestion.51 These practices emphasize that quality information gives organizations the ability to support strategic as well as operational decisions.52
Since the passage of MAP-21 in 2012 and the FAST Act in 2015, DOT’s freight-related activities have increased, with more focus on multimodal freight infrastructure, including ports. For example, DOT’s draft National Freight Strategic Plan, issued in October 2015, acknowledges the importance of ports and includes several port strategies to advance freight goals.53 The draft plan discusses the need to upgrade water and
50Additionally, we found no evidence that air exports were different than other quarters at airports at any of the three coasts during any of the time frame examined. 51GAO-14-740. 52GAO, Executive Guide: Leading Practices in Capital Decision-Making, GAO/AIMD-99-32 (Washington, D.C.: December 1998). 53DOT, Draft for Public Comment, National Freight Strategic Plan (2015).
DOT Has Made Progress Including Ports in Freight Efforts, but DOT’s Data Strategy Could Be Improved by Including Supply-Chain Information
DOT’s Recent Freight Strategy and Programs Have Become More Inclusive of Ports

Page 39 GAO-17-23 West Coast Ports
landside port facilities and acknowledges that ports face many challenges as they adapt to larger vessels and other global shipping changes. The draft plan also includes some strategies that could help cargo move through ports more smoothly, including facilitating intermodal connectivity and supporting efforts, such as chassis pooling, to address port congestion. The draft strategic plan was released for public comment and DOT officials anticipate finalizing the strategic plan by the end of 2017, in accordance with the statutory requirement of the FAST Act.54 Officials noted that many of the strategies identified in the draft will be updated in light of new programs and authorities, such as new funding programs, provided by the FAST Act. DOT officials stated that the department was working to address multimodal infrastructure and pushing for a more comprehensive approach to freight prior to these acts, but the new authorities enable DOT to take a less highway-focused approach. As a result, at this time, the precise nature and scope of the strategies of the department related to ports are a work in progress.
DOT is also pursuing an increasingly multimodal perspective in its efforts to identify and define the national multimodal freight network, or map, which includes ports and intermodal connectors that meet certain criteria.55 Previously, MAP-21 directed DOT to identify a national freight network of highways, of which the Primary Freight Network was the core.56 The FAST Act required DOT to develop, and release for public comment, an Interim National Multimodal Freight Network by June 2016 and a final National Multimodal Freight Network by December 2016. The act required that freight facilities with certain characteristics—for example, public ports with total foreign and domestic trades of at least 2 million
54DOT has until December 4, 2017, to issue a final National Freight Strategic Plan. After the strategic plan is finalized, DOT will be statutorily required to update the plan every 5 years. 49 U.S.C. §§ 70101 and 70102(c). 55Pub. L. No. 114-94, title VIII, subtitle IX, § 8001, 129 Stat. 1312, 1604-1606 . States and metropolitan planning organizations will also be able to designate parts of the national freight network through, respectively, Critical Rural Freight Corridor and Critical Urban Freight Corridor designations. 23 U.S.C. § 167(e) and (f). 56Pub. L. No. 112-141, § 1115, 26 Stat. 405, 469 (2012) codified at 23 U.S.C. § 167(d). In 2013 DOT published the draft Primary Freight Network, which included 27,000 miles of highways, and finalized it in 2015. According to DOT, this network did not include critical elements of the freight system, such as non-truck freight routes (e.g., ports, rail, waterways, and pipelines).

Page 40 GAO-17-23 West Coast Ports
tons—be included in the Interim National Multimodal Freight Network. DOT released the interim network on time and the public comment period closed on September 6, 2016. DOT plans to issue a final National Multimodal Freight Network by December 4, 2016, according to officials. DOT officials indicated that the final network is likely to include port and port-related facilities due to their importance to freight.57 Some state and regional government officials we interviewed acknowledged that DOT is making progress toward developing a more complete multimodal network that accurately identifies freight facilities. However, most raised concerns that the interim network has errors, omissions, and disconnected segments of roads. For example, freight staff in Washington State’s Department of Transportation indicated that some important road connections to the Port of Tacoma were missing in the interim network. DOT officials emphasized to us that anyone may submit comments addressing any aspect of the network, including any errors, omissions, or disconnected network segments that they feel should be addressed in the final network.
DOT is also positioned, through two new freight funding programs established by the FAST Act to potentially fund more port, freight rail, and intermodal projects than in previous years.58 In the National Highway Freight Program (NHFP), formula funds are allocated to states based on similar formula factors used in federal highway programs. Up to 10 percent of the funds may be used for freight rail and intermodal projects, including projects at ports. Thus, funding is spread across the country, and states will decide whether to prioritize port projects or to focus on other freight transportation projects. DOT officials noted that many states have established freight advisory committees that have a role in
5749 U.S.C. § 70103(b)(2). According to DOT officials, under new requirements in the FAST Act for port tonnage thresholds, 116 ports are included in the interim network. The number of ports included in the final network may change, according to DOT officials.
58Both FAST Act programs have constraints on how much funding can go to multimodal projects, limiting how much direct support ports can potentially get. These programs can be used to supplement other DOT funds that ports and other modes can access for infrastructure projects, such as TIGER grants, which DOT awards on a competitive basis for a variety of different types of transportation infrastructure projects, and funding through the Water Resources Reform and Development Act of 2014 (WRRDA) , Pub. L. No. 113-121, § 2102, 128 Stat. 1193, 1273-1278 , which authorized funding for U.S. Army Corps of Engineers dredging projects.
Page 41 GAO-17-23 West Coast Ports
prioritizing freight projects. Given states’ historical focus on highway infrastructure, states may prioritize those project types over port projects.59 Out of about $1.1 billion total of formula funds, DOT estimated that California and Washington State—where the largest West Coast ports are located—will be allocated approximately $126 million in fiscal year 2016. State officials we interviewed from these two states indicated that port or near-port projects (e.g., road or rail projects in close proximity to a port and likely to benefit port cargo) are among the projects they expect to consider for these funds.
For the new FASTLANE program,60 DOT solicited project proposals from a broad group of constituencies (highway, rail, ports, etc.) in which nearly $800 million was available for competitively awarded grants in fiscal year 2016. Over the 5-year term of the FAST Act, up to $500 million of the $4.5 billion authorized, may be used for freight rail, intermodal and port projects. DOT officials stated they received 212 applications that requested $9.8 billion total, 35 of which were for projects at or near ports. In September 2016, DOT awarded 18 grants, including 5 port project grants. Though none of these 5 awards went to major West Coast Ports, 2 of the other 13 projects are in the Seattle area—one road and one rail—and are expected to facilitate port cargo movement. According to program officials, in the first round of FASTLANE grants, the department did not target specific types of projects or synergies between projects but rather, selected applications based on their individual merits and the program’s statutory requirements. According to DOT freight officials, the agency is trying to maximize public benefits and balance national priorities with local project selection.
In part to facilitate ports’ access to funding sources such as these, MARAD has established the StrongPortsSM program, which provides a range of technical support to ports upon request, according to program
59Up to 10 percent of National Highway Freight Program funds can be used for intermodal projects. 23 U.S.C. § 167 (i)(5)(B). We have previously reported that freight projects can find it difficult to compete for general transportation funds because freight projects can extend across multiple jurisdictions and developing support for a project can be difficult. See GAO-04-165, GAO-08-287, and GAO-14-740. 60The FASTLANE program funds small and large freight projects, based on project size, that meet statutory requirements. Pub. L. No. 114-94.§ 1105,129 Stat. 1312 (2015) codified at 23 U.S.C. § 117.

Page 42 GAO-17-23 West Coast Ports
officials.61 For example, the StrongPortsSM program team educated the ports of Los Angeles and Long Beach about available federal assistance for intermodal projects. Some port stakeholders told us these new funding programs could be important in addressing challenges facing ports, but it remains to be seen how well port projects will compete for funds against highway or other freight projects.
DOT is also taking steps to develop port performance measures. As required by the FAST Act, DOT’s Bureau of Transportation Statistics (BTS) recently convened a group of port stakeholders to form a Port Performance Freight Statistics Working Group and instituted a port performance freight statistics program.62 This effort is focused on developing standard freight measures that DOT could publicly report. According to industry groups we interviewed, port performance measures—such as truck waiting times to pick up cargo and terminal throughput activity—could be used by shippers to assess ports or port operations and adapt supply chains accordingly. According to DOT officials, the group will focus on port operations, with specific priorities to be determined by members, and the department does not have specific goals for the group, beyond those outlined in statute.63 The working group met for the first time in July 2016, with the goal of recommending port performance measures by December 4, 2016, as required by the FAST Act. Most port stakeholders we interviewed, including participants in the working group, such as a port authority, noted that developing uniform metrics of port performance will be challenging because of differences
61According to MARAD officials, the StrongPortsSM program is intended to help improve infrastructure at domestic ports by addressing planning, stakeholder engagement, operational and capital financing, and project management. According to program officials, the StrongPortsSM team has provided assistance to each of the major ports on the West Coast, including our case study ports. DOT officials also indicated that the department recently established the Build America Bureau to facilitate multimodal infrastructure development. 62Pub. L. No. 114-94, § 6018, 129 Stat. 1312, 1576 codified at 49 U.S.C § 6314. The Working Group is a Federal Advisory Committee. 63According to DOT, the scope of the Committee’s effort is “to provide recommendations to the BTS Director on matters related to port performance measures; to identify a standard for port data; to specify standards for consistent port performance measures; to recommend statistics for measuring port capacity and throughput; and to develop a process to collect timely and consistent data.” http://www.rita.dot.gov/bts/port_performance.

Page 43 GAO-17-23 West Coast Ports
among ports, the proprietary nature of some data, and other hurdles. However, some generally support efforts to better understand port performance. The FAST Act requires DOT to issue its first annual report on nationally consistent measures of port performance in January 2017. BTS officials explained that this time frame is short given the complexity of the topic and limited staff available in BTS for the program. As a result, they told us that they have begun to draft the report based on the limited data that are readily available and that it will be difficult to incorporate any of the working group’s recommendations in the first report, although they will be considered for future annual reports.
Better information and analytical tools to assess supply chains may improve DOT’s freight efforts. Although DOT has information on freight movements, less is known about supply chains and how they affect the freight transportation network. DOT’s Transportation Statistics Annual Report 2015 states, for example, that while data on tonnage and the value of region-to-region commodity flows exist, data on the relationships between industry supply chains and region-to-region commodity flows have major gaps.64 Filling those data gaps could help, for example, guide investments in transportation facilities, assess international trade flows within the United States, and identify and address freight bottlenecks that are barriers to economic development and competitiveness, according to the report. For example, public sector decision makers do not typically have the data and analytic models to understand and incorporate into infrastructure decisions how freight moves to and from shippers’ warehouses, a critical component of a supply chain. The report also notes that while the movement of goods between ports and foreign countries is tracked continuously, the movement of international trade between ports and domestic origin for exports and domestic destinations for imports is not measured. Understanding how shippers are adapting their supply chains in light of global shipping changes could give DOT a more informed basis to assess current and future demands on the freight network and make sound infrastructure investment decisions. DOT’s Freight Analysis Framework (FAF)—which DOT officials said is the agency’s most comprehensive source of freight data—is not able to
64U.S. Department of Transportation, Bureau of Transportation Statistics, Transportation Statistics Annual Report 2015 (Washington, DC: 2016).
Inclusion of Supply Chain Information in DOT’s Development of a Freight Data Strategy Could Benefit Freight Efforts

Page 44 GAO-17-23 West Coast Ports
support supply chain analyses because it lacks key information on industries, cargo destinations, and other facets of supply chains.65 DOT officials, regional and state freight planners, and transportation economists we interviewed at the Brookings Institution agreed that FAF data are too aggregated for analyzing commodity flows at metropolitan levels, making it difficult to use FAF data to accurately analyze supply chains. Most public freight planners in all the major West Coast port regions that we spoke with similarly noted they have access to some data related to port cargo movement—such as the number of trucks on roads near ports, the overall value and weight of cargo, and the major commodities shipped in their area—but have much less data about that tracks end-to-end cargo movements from origin to destination and across modes.
Recent work by the Transportation Research Board (TRB), has called for developing and using better information on supply chains for public sector infrastructure decision making. For example, a 2013 TRB report noted the differences between public and private sector decision making related to good movement and infrastructure. The report recommended freight data and modeling improvements to integrate real-world supply chain management practices with public sector decision making and the development of analytic tools to predict freight activity from the perspective of shippers, carriers, and others in the supply chain.66 Another TRB report called for more comprehensive and realistic information on freight movement and logistics, following freight through intermodal interchanges and identifying the locations of resources such as manufacturing and distribution facilities. 67 In 2014, the National Freight Advisory Committee also, highlighted the importance of addressing ports and supply chains in DOT’s freight efforts, and
65The FAF, which integrates data from sources such as DOT’s Commodity Flow Survey and U.S. international trade data from the Census Bureau, depicts freight movement among states and major metropolitan areas by all modes of transportation. It includes estimates for tonnage and value by regions of origin and destination, commodity type, and mode (highways, rail, waterways, and ports). 66Transportation Research Board, Freight Demand Modeling and Data Improvement Strategic Plan, (Washington, D.C.: 2013). 67Transportation Research Board, Transportation Research Circular Number E-C169, Measuring the Transportation System from a Supply Chain Perspective, (Washington, D.C.: October 2012).

Page 45 GAO-17-23 West Coast Ports
specifically, in developing the National Freight Strategic Plan.68 For example, it recommended that DOT address the inadequacy of multimodal freight flow (origin-destination) data and support research on better metropolitan and regional freight models, including supply chain based modeling approaches.
Federal guidance and practices highlight the need for quality information for planning and effective decision making and achieving agency objectives. For example, leading practices in capital planning emphasize the importance of good information for sound capital planning and effective decision making. According to these practices, information provided by well-planned information systems gives organizations the ability to perform analyses that can be used to support strategic as well as operational budgeting decisions.69 We previously found that making available good information on highway freight trends to states and the federal government could help establish relevant goals and prioritize mitigation efforts for freight-related traffic congestion.70 Furthermore, Federal Internal Control Standards states that quality information is vital to achieving agency objectives. These standards further define quality information as being appropriate, current, complete, accurate, and accessible.71 Management should use quality information to make informed decisions and evaluate performance in achieving key objectives.
DOT officials we spoke with acknowledged that better information on supply chains would help DOT’s freight efforts, and part of DOT’s approach is to encourage state partners to gather and use this
68In its June 2014 report, the National Freight Advisory Committee made 81 recommendations to DOT, including a number of recommendations related to supply chain information. The Committee included port and supply chain stakeholders as well as the Department of Commerce as an ex-officio member. 69GAO/AIMD-99-32. This executive guide is based on extensive research to identify leading practices in capital decision-making used by state and local governments and private sector organizations and identifies organizational attributes that are important to the capital decision-making process as a whole, as well as capital decision-making principles and practices used by outstanding state and local governments and private sector organizations. 70GAO-14-740. 71GAO, Standards for Internal Control in the Federal Government, GAO-14-704G (Washington, D.C.: September 2014).
Page 46 GAO-17-23 West Coast Ports
information. For example, in 2012, DOT issued interim guidance for the development of state freight plans.72 DOT advised states that they include a discussion of the role that freight transportation plays in the state’s overall economy; identify those industries that are most important to the state; and identify what supply chains (including the transportation modes that support them) are critical to the state’s industries and exports from the state.73 Some of the state transportation agencies we talked to have taken some steps to better understand supply chains within their state as part of developing state freight plans. For example, the Washington State Department of Transportation has identified corridors with freight intensive land uses, intermodal facilities, and agricultural processing facilities (e.g., apple packers, dairy plants) that are part of important supply chains within the state. The FAST Act requires that states have a freight plan by December 4, 2017, to obligate National Highway Freight Program funds.74 DOT officials indicated however, that it was too soon to know how, if at all, the plans states develop can help inform DOT’s freight efforts or what information on supply chains the plans will provide.75
However, some supply chain information can be difficult for local, state, and federal entities to obtain because it may be proprietary, expensive, become dated quickly, or be difficult to aggregate. For example, shippers may be reluctant to share information with local and state DOTs due to proprietary and competitive interests. According to most port authorities we spoke with, terminal operators are not contractually obligated to disclose, for example, information about terminal productivity or capacity as part of their lease agreements with the ports. Public agencies using private third-party data also may be subject to non-disclosure agreements
72Interim Guidance on State Freight Plans and State Freight Advisory Committees, 77 Fed. Reg. 62,596 (proposed October 15, 2012). 73The interim guidance also recommends that states include as part of their freight improvement strategy, which is part of their state freight plans, an analysis of how proposed improvements will affect specific supply chains and industries that have been identified in the plan. 7423 U.S.C. § 167(i)(4). 23 U.S.C. § 70202(a) and (e). 75DOT is currently working on guidance regarding state freight plans and state freight advisory committees to reflect the passage of the FAST Act and to provide information to states on the required elements of state freight plans. DOT officials expect to release this guidance during the fall of 2016. Pub. L. No 114-94, § 8001, 129 Stat, 1312, 1610 codified at 49 U.S.C. § 70202(e).

Page 47 GAO-17-23 West Coast Ports
governing the access to or sharing of data with other agencies, strictures that, in turn, limits the ability of state and local planning agencies to use these data. In addition, some state and regional government officials we interviewed explained that buying data can be too costly for cash-strapped agencies. For example, officials from a regional government noted that purchasing private real estate data on warehouse inventories could cost hundreds of thousands of dollars. Without this data, the officials told us they have difficulties modeling and targeting local infrastructure investments or making land use decisions to support freight movement.
Some of DOT’s freight-related ongoing efforts could help provide information on supply chains; however, because these efforts are still in the early stages, it is not clear how, if at all, DOT plans to use that information. For example, the I-95 Corridor Coalition, which includes DOT as a member, convened a broader range of supply chain stakeholders to identify and study freight needs and selected supply chains, across all modes of transportation, along the I-95 corridor between Florida and Maine. A related effort lead by FHWA focuses on “freight fluidity.” The effort focuses primarily on truck probe data (i.e., GPS data on trucks location and movement) and will be supplemented by multimodal data—which might include ports—as the project progresses, according to DOT program officials. According to officials that effort plans to hold workshops in 2017 with the goal of developing white papers on applications that could support metropolitan, regional, and state transportation multi-modal freight planning.76 Likewise, MARAD program officials explained to us that understanding supply-chain issues—such as how the opening of the expanded Panama Canal may impact trade—is one of the expectations of Gateway directors in each port region, but efforts to capture and
76In March 2016, the Coalition published a white paper demonstrating the feasibility of measuring supply chain performance across multistate jurisdictions. See Cambridge Systematics and Parson Brinckerhoff for the I-95 Corridor Coalition, Freight Performance Measurement: Measuring the Performance of Supply Chains across Multistate Jurisdictions (Boston and Cambridge, MA: March 2016).

Page 48 GAO-17-23 West Coast Ports
disseminate this expertise across DOT are a work in progress and early, according to MARAD officials.77
DOT has also taken steps to gather supply chain information from other federal agencies, but it is unclear how the department will use this information to inform its freight efforts. For example, DOT officials said that they have been working with the Department of Commerce, which coordinates with industry representatives about supply chain issues, to better understand supply chains. Specifically, officials said they have attended the Department of Commerce’s roundtable discussions with supply chain industry members on port efficiency and competitiveness issues, at which industry members have offered and shared best practices for port-user coordination, collaboration, and information sharing.78 Commerce officials indicated they plan to publish a report on this initiative’s results in December 2016. Additionally, DOT officials stated that FHWA’s Freight Fluidity initiative involves close interaction with Commerce, and DOT is represented on the Department of Commerce’s Advisory Committee on Supply Chain Competitiveness (ACSCC) as an ex-officio member.79 DOT has not explained in the draft strategic freight plan, or elsewhere, how other agencies and sources of information fit into the department’s freight goals and objectives. DOT officials acknowledged that although they have made strides, they have
77Other efforts include the Maritime Transportation System National Advisory Committee (MTSNAC), which is a federal advisory committee that advises DOT on a range of marine transportation system issues, including port development challenges, funding, and the development of a National Maritime Strategy. Pub. L. No. 110-140, title XI, subtitle C, § 1121, 121 Stat. 1761, (2007) codified at 46 U.S.C. § 55603. It is comprised of representatives from commercial transportation firms, shippers, port stakeholders, labor, and state and local public entities. 7821st Century U.S. Port Competitiveness Initiative: Request for Public Comment, 81 Fed. Reg. 33,657 (May 27, 2016). According to Commerce officials, representatives of other Federal, state, local, and independent agencies are invited to participate in these discussions as well. 79FHWA’s Freight Fluidity Initiative seeks to advance corridor and mega-regional approaches to multi-modal freight system measurement. In 2014, DOT convened experts at workshops and developed a research path forward for the initiative.

Page 49 GAO-17-23 West Coast Ports
yet to determine how supply chain information gathered from federal partners should be used in DOT’s freight efforts.80
DOT has articulated broad strategies to improve freight data and analytic tools in the draft National Freight Strategic Plan. For example, DOT officials told us they incorporated the National Freight Advisory Committee’s recommendations in drafting the plan: (1) to address the inadequacy of multimodal freight data; (2) to support research on better metropolitan and regional freight models, including supply-chain-based modeling; and (3) to evaluate freight movement from an end-to-end supply chain perspective.81 DOT officials emphasized to us that the draft strategy includes an extensive discussion of data issues, including the need for supply chain information, as one of the key issues facing the department that the strategies are meant to address. However, the draft National Freight Strategic Plan does not specifically outline how DOT plans to leverage the various ongoing initiatives, or begin new ones, to identify information sources, improve supply chain data, and advance analytic tools related to ports and supply chains. For example, the draft National Freight Strategic Plan does not explain how the department will use the supply chain information that could come from existing efforts to inform freight planning and programming or lay out a specific path for how the limitations of existing sources, such as the FAF, will be overcome.
DOT may be able to address supply chain information needs through its effort to develop a freight data strategy. In our 2014 report on freight-related traffic congestion, we found a number of data limitations that, if resolved, could assist DOT in prioritizing projects to mitigate freight-
80Other federal agencies with a role related to ports may also provide opportunities for DOT to obtain information on supply chains. For example, the Federal Maritime Commission (FMC), which among other things can convene supply chain stakeholders (e.g., shippers and transportation firms), could also provide DOT with additional insight into supply chain dynamics. According to Federal Maritime Commission officials, in response to port congestion problems that arose in 2014 and early 2015, they undertook a series of actions to analyze the issues involved and started the Supply Chain Innovation Team initiative, which is composed of leaders from private logistics companies (e.g., trucking, railroads, port labor, etc.). 81This recommendation is included under the strategies: “Improve coordination between public and private sectors (B.3)” and “Ensure availability of better data and freight transportation models (B.4).” DOT’s discussion of these strategies includes a discussion of data issues including limitations in available data and methodology constraints in freight planning.
Page 50 GAO-17-23 West Coast Ports
related community impacts.82 Furthermore, we also found and discuss in that report, based on leading practices in capital planning, without a written strategy defining clear missions and desired outcomes related to improving data on freight-related traffic congestion, DOT may miss the opportunity to advance its data-improvement efforts and clarify its national role in supporting the freight infrastructure critical to supply chains. DOT officials told us that they plan to develop the recommended freight data strategy in conjunction with the finalization of the National Freight Strategic Plan at the end of 2017, either as part of the strategic plan or as a standalone document. Including supply chain information in the development of this data strategy, may provide an opportunity for DOT to think more comprehensively and strategically about current and planned freight data efforts. Doing so could help ensure the agency obtains the supply chain information needed to support its port-related efforts and advance national freight policy goals such as enhancing resiliency to freight disruptions.
The United States is part of a global economy, and industry supply chains are the backbone of international trade and commerce. Ports, an important segment of the U.S. freight network, are critical to the efficient movement of freight that countless supply chains depend upon. Ports face an array of challenges, including increasing congestion, and are adapting operations and infrastructure to remain competitive amid significant global shipping changes, such as the increasing size of vessels and changing shipping alliances between ocean carriers that are exacerbating existing conditions. These changes affect ports and the cargo moving through them in sometimes unexpected ways, further challenging efforts to effectively anticipate and plan for the changes. A disruption at a port can ripple throughout a supply chain and have business and economic impacts. Shippers, and their supply chains, have varying degrees of dependence on specific ports based on their industry, traded commodities, and other attributes. When the ports that shippers
82GAO-14-740. In order to clarify the federal role related to freight-related local traffic congestion, we recommended that the Secretary of Transportation to (1) provide guidance on state freight plans that helps states define and prioritize local impacts of national freight movements and establish what data could be consistently collected and analyzed and (2) articulate the federal role in freight-related local congestion impacts and a written strategy for improving the availability of national data needed to quantify, assess, and establish measures on freight trends. DOT agreed with our recommendation.
Conclusions

Page 51 GAO-17-23 West Coast Ports
use are not functioning as expected, because of disruptions or simply endemic congestion, shippers face higher costs, decreased revenues, and delays.
Including information on supply chains as part of DOT’s existing effort to develop a written freight data strategy provides an opportunity for the agency to think more comprehensively about the information needed to support its freight efforts including further refining the objectives and goals in its National Freight Strategic Plan. Our review of the disruption in 2014—2015 at West Coast Ports and the resulting impacts on the supply chain highlights DOT’s need for additional supply chain information. Federal guidance and leading practices in capital planning emphasize the importance of the use of good information to achieve agency objectives. Including information on supply chains in DOT’s freight data efforts could be beneficial. As we previously recommended and DOT agreed, a freight data strategy that addressed freight trends and freight-related congestion impacts would help to better define the agency’s role in this area. If DOT develops the freight data strategy in a way that includes information about supply chains, then it may be even more effective in providing direction to the various efforts under way, helping to close existing gaps or identifying new efforts that could be undertaken to further DOT’s freight goals. As shipping and supply chains change, if DOT and other public officials who make decisions about port and near-port infrastructure do not anticipate how demand for that infrastructure will change, then new investments might not provide the full benefits expected or operate as well as hoped. Likewise, as DOT continues to develop its freight efforts, better supply chain information could help the department’s decision making such as by prioritizing freight infrastructure needs and achieving its freight policy goals.
To inform DOT’s development of its national freight strategy and associated freight efforts, such as states’ development of freight plans, newly established freight funding programs, and advancing DOT’s efforts to implement national freight policies, we recommend that in the development of the freight data strategy the Secretary of Transportation include a specific plan to identify:
• appropriate freight data sources, information, and analytic tools for transportation modes involved in the freight network and supply chains;
Recommendation
Page 52 GAO-17-23 West Coast Ports
• data gaps that could help both the agency and states and local governments in the development of their freight plans, and an approach for addressing obstacles to developing high-quality, reliable supply chain information;
• current and planned efforts that can provide insights into supply chains and their impacts on freight networks; and
• how DOT plans to use the supply chain information and analytical tools to inform freight planning and programming.
We provided a draft of this report to DOT, DOC, FMC, and USDA for review and comment. DOT provided a letter stating it concurred with our recommendation (see app. V). DOT as well as DOC and FMC provided technical comments, which we have incorporated into the report where appropriate. USDA did not have any comments on the draft report.
We are sending copies of this report to the Secretary of the Department of Transportation, Department of Commerce, Federal Maritime Commission, Department of Agriculture, and interested congressional requesters. In addition, the report will be available at no charge on the GAO website at http://www.gao.gov.
If you or your staff have any questions about this report, please contact me at (202) 512-2834 or [email protected]. Contact points for our Offices of Congressional Relations and Public Affairs may be found on the last page of this report. GAO staff who made major contributions to this report are listed in appendix VI.
Susan A. Fleming Director, Physical Infrastructure Issues
Agency Comments

Appendix I: Objectives, Scope, and Methodology
Page 53 GAO-17-23 West Coast Ports
This report addresses the following objectives: (1) how recent changes in global shipping have impacted the movement of cargo at major U.S. West Coast ports and how these ports and their stakeholders have responded; (2) how selected shippers have been impacted by and responded to disruptions at West Coast ports during 2014-2015 as well as other recent or potential disruptions; and (3) how the Department of Transportation’s (DOT) current freight-related efforts support cargo movement through ports and whether these effort can be improved.
To understand how global shipping changes have affected ports, we conducted three in-depth case studies of the largest port complexes on the West Coast ports—Los Angeles-Long Beach, Oakland, and Seattle-Tacoma, which were selected based on their total trade value (imports and exports). In 2015, the Ports of Los Angeles, Long Beach, Oakland, Seattle, and Tacoma handled 88 percent of total West Coast port volume. For the purposes of this report, we define a port as the area “inside the gate” and under the control of the local port authority or marine terminal operator, where cargo is loaded and unloaded to and from ships. We refer to a “port complex” as encompassing one to two ports and the nearby roadways, rail, bridges, and intermodal facilities (i.e., connectors) on which cargo arrives or departs the port. The results of these case studies are not generalizable, but do provide insights regarding port, state, local, and private-sector roles and experiences in cargo movement constraints from global shipping changes and efforts to address these constraints.
These case studies included site visits of facilities inside the gate (such as container yards and on-dock rail) and outside the gate (such as adjacent local streets and neighborhoods). We interviewed stakeholders and reviewed relevant documents on planning and projects, including the California and Washington freight mobility plans and similar plans issued by the metropolitan planning organizations for each of the port complexes. Based on these interviews and documents, we identified the infrastructure projects and operational actions undertaken by stakeholders to address impacts from global shipping. We then confirmed with the port authorities that these projects were significant and the information presented about each project or action. Table 4 describes
Appendix I: Objectives, Scope, and Methodology

Appendix I: Objectives, Scope, and Methodology
Page 54 GAO-17-23 West Coast Ports
each of the stakeholders we interviewed as part of each case study’s site visit.1
Table 4: Stakeholders Whom GAO Interviewed for Each Major West Coast Port Complex Case Study
Port complex Stakeholder Los Angeles – Long Beach • Port of Los Angeles
• Port of Long Beach • Pacific Harbor Line • Harbor Trucking Association • Alameda Corridor Transportation Authority • Southern California Association of Governments • International Longshoreman and Warehouse
Union (Local 13 and 63) • PierPass • TraPac (Private marine terminal operator)
Oakland • Port of Oakland • Metropolitan Transportation Commission • California Trucking Association • California Department of Transportation
Seattle / Tacoma • Northwest Seaport Alliance • City of Seattle – Department of Transportation • Puget Sound Regional Council • Washington Department of Transportation • International Longshore and Warehouse Union
(Local 19 and 23) • SSA (Private marine terminal operator) • Pacific Merchant Shipping Alliance (Member-
based organization of ocean carriers)
Source: GAO. | GAO-17-23
Additionally, we interviewed representatives from American Association of Port Authorities, Pacific Maritime Association, International Longshore and Warehouse Union, the California Association of Port Authorities, and the port authorities of two smaller West Coast ports (San Diego and
1Some interviews were coordinated with assistance from the U.S. Department of Transportation’s Maritime Administration Gateway Offices. We also reached out to additional stakeholders beyond those listed in table 4, but did not receive a response to our inquiry for an interview.
Appendix I: Objectives, Scope, and Methodology
Page 55 GAO-17-23 West Coast Ports
Portland), one East Coast port (New York / New Jersey) and one Gulf Coast port (Houston). These sets of interviews provided additional context for the constraints on cargo movement at West Coast ports created by global shipping changes, as well as, impacts on the national freight network and supply chains. We selected the smaller West Coast ports because of their relatively larger size (in terms of twenty-foot equivalent units, a measure of volume) and for geographic diversity, among other reasons. Similarly we selected the ports of New York/New Jersey and Houston, because these ports are the largest on their respective coasts, handling the most trade (in terms of TEUs) in 2013.
We also reviewed a selection of governmental reports, non-governmental research, and academic literature on global shipping changes and their impact on cargo movement published since 2005, including reports recently issued by the Federal Maritime Commission and the Transportation Research Board. We identified these articles and reports through our interviews and by conducting a literature search. Search terms included ones pertaining to our West Coast port complexes, and related subjects, such as “ocean carriers and alliances,” “intermodal supply chain and logistics shifts, growth, trends,” and “chassis supply, shortages.” Various databases were used, including ProQuest and Transport Research International Documentation. We determined the literature cited in our report were sufficiently reliable for our research objective describing the impacts on cargo movement from global shipping changes and actions taken by major West Coast ports. Our work is also informed by prior GAO reports on freight mobility, intermodalism, and marine transportation finance.
To assess how shippers have been impacted by and responded to port disruptions, we conducted semi-structured interviews with one or more representatives of 21 industry trade groups representing shippers. In order to select the industry trade groups we interviewed, we first identified the top 30 commodities imported and exported through major West Coast ports by analyzing U.S. international trade data. We identified the top imported and exported commodities by dollar value and by weight (in kilograms) from each of the three major West Coast port regions: Los Angeles/Long Beach, Oakland, and Seattle/Tacoma, as well as at all three port regions combined. As a result of the many different top commodities at the three port regions and due to limited resources for interviewing relevant industry association groups, we chose a nongeneralizable sample of about 27 commodities that represented diversity, in terms of geography at the three port regions, perishability, mode of transportation, high or low dollar value commodities, high or low

Appendix I: Objectives, Scope, and Methodology
Page 56 GAO-17-23 West Coast Ports
weight commodities, as well as commodities that represented different agricultural, retail, or manufacturing sectors. The 27 commodities consisted of 13 imported commodities and 14 exported commodities.2 We identified via Internet searches and then interviewed appropriate and relevant industry groups that represented those 27 commodities with either an emphasis on trade or a regional West Coast emphasis.3 We shared our list of potential industry groups with the U.S. Department of Agriculture, as well as the Department of Commerce, to see whether agency officials believed our list of industry groups adequately represented the relevant commodities and then incorporated their suggestions in order to pare down the initial list to 21 industry groups (see table 5). Additionally, to understand the logistical impacts of disruptions, we interviewed a selection of customs broker and freight forwarder regional associations, which represent logistics handlers. We chose a nongeneralizable sample of 9 regional associations from the 28 affiliated associations of the National Customs Brokers and Forwarders Association of America. Of the 9 affiliated associations, we chose associations that represented four West Coast port regions, three East Coast port regions, and two Gulf Coast port regions in order to provide insight into the potentially different impacts that port disruptions have on logistics handlers around the country.4
2The 13 selected imported commodities included: motor cars; computers; car parts; furniture; footwear; sweaters; tires; toys; insulated wire; taps, cocks, valves; coffee; meat of bovine animals, frozen; and wine. The 14 exported commodities included: cotton; ferrous waste and scrap; waste and scrap paper; motor cars; car parts; nuts; soybeans; petroleum coke; raw hides and skins of bovine animals; corn; apples; rutabagas, hay, clover; meat of bovine animals, frozen; and wine. Four commodities were represented on both of the top imported and exported commodity lists: meat of bovine animals, frozen; motor cars; car parts; and wine, which left us with 23 unique selected commodities. 3Some industry associations were able to speak about several commodities as their members shipped more than one unique commodity. 4The nine affiliated associations we spoke with included: the Customs Brokers & International Freight Forwarders Association of Washington State, the Columbia River Customs Brokers and Forwarders Association, the Customs Brokers & Forwarders Association of Northern California, the Los Angeles Customs Brokers & Freight Forwarders Association, Inc., the Houston Customhouse Brokers & Freight Forwarders Association, the International Freight Forwarders and Customs Brokers Association of New Orleans, the Independent Freight Forwarders & Custom Brokers Association of Savannah, the New York/New Jersey Foreign Freight Forwarders & Brokers Association, Inc., and the Philadelphia Customs Brokers & Forwarders Association.

Appendix I: Objectives, Scope, and Methodology
Page 57 GAO-17-23 West Coast Ports
Table 5: Industry Groups GAO Interviewed Regarding Impacts of and Responses to Port Disruptions
Industry Associations Interviewed Industry(ies) Represented U.S. Hide, Skin and Leather Association Raw hides and skins of bovine or equine animals Meat Import Council of America Meat of bovine animals, frozen National Corn Growers Association Corn (maize) Washington Apple Commission Apples, pears and quinces, fresh Institute of Scrap Recycling Industries (1) Ferrous waste and scrap
(2) Waste and scrap paper National Cotton Council Cotton National Hay Association (U.S. Forage Export Council) Rutabagas, hay, clover & other forage products American Home Furnishings Alliance Furniture American Apparel and Footwear Association (1) Footwear
(2) Sweaters Tire Industry Association New pneumatic tires, rubber U.S. Meat Export Federation Meat of bovine animals, frozen Almond Board of California Almonds U.S. Soybean Export Council Soybeans Petroleum coke industry representative Petroleum coke Auto Care Association Motor cars Motor and Equipment Manufacturers Association Parts & access for motor vehicles Consumer Technology Association Automatic data processing machines Toy Industry Association Toys National Association of Home Builders Home-building materials California Wine Export Program Wine Green Coffee Association Coffee
Source: GAO. ׀ GAO-17-23
To complement our qualitative analysis, we conducted statistical analyses of U.S. international trade data maintained by the Census Bureau. The data we collected covered all imports and exports from January 2005 through March 2016. We used Census trade data for the port, month, country of origin, or destination, and six-digit product code level. We aggregated that data to port, quarter, country, and two-digit product code. We estimated a statistical model designed to examine whether exports and/or imports at West Coast ports during the three quarters of the disruption were different than other quarters included in the analysis, controlling for linear trends, seasonality, and time invariant port, country, and product characteristics. We also controlled for exchange rates in some specifications. For more information and results, see appendix II.
Appendix I: Objectives, Scope, and Methodology
Page 58 GAO-17-23 West Coast Ports
To identify and evaluate ways DOT’s current freight-related efforts support cargo movement through ports and whether these efforts could be improved, we gathered information on an array of topics related to cargo moving through ports and relevant federal efforts to support this movement. We focused on DOT initiatives and programs, but also efforts of the Department of Commerce, Department of Agriculture (USDA), and Federal Maritime Commission (FMC),5 and reviewed surface transportation legislation. DOT programs and initiatives we reviewed included the activities of the Maritime Administration within the DOT, the Office of Freight in the Federal Highway Administration, and the Bureau of Transportation Statistics and freight policy activities within DOT’s Office of the Secretary. We also looked into activities within Commerce’s International Trade Administration, especially the Advisory Committee on Supply Chain Competitiveness; the USDA’s role in agricultural inspections at ports and promoting agricultural exports; and the FMC’s efforts to address port efficiency, especially the Supply Chain Innovation Initiative. We did not evaluate activities outside of DOT. After compiling a list of relevant efforts, we interviewed program officials and reviewed program documentation to understand the nature and scope of these efforts. We reviewed selected literature to identify areas others have noted as needing attention. We reviewed literature and reports from the National Freight Advisory Committee, the American Association of State and Highway Transportation Officials, the I-95 Corridor Coalition, the Transportation Research Board, and others. We also interviewed federal officials responsible for relevant aspects of federal transportation and trade policies and programs and industry associations to gain an understanding of areas that could be improved. We interviewed selected transportation and logistics experts, such as economists with the Brookings Institute and Global Insight, who had conducted relevant work or were known experts in the issues raised in our work. Additionally, during the interviews we conducted for the other engagement objectives, we asked about areas in need of federal attention and how well current efforts were working. Through these activities, we identified the need for supply chain information (e.g., freight data for quantitative analysis of trends as well as qualitative information on market trends or dynamics)
5Due to the expansive nature of federal activities that have some bearing on transportation and trade, we limited our review to these agencies. We did not review activities of the Department of Homeland Security or the U.S. Army Corps of Engineers, for example, though each of those agencies has an important role in this area.
Appendix I: Objectives, Scope, and Methodology
Page 59 GAO-17-23 West Coast Ports
that is broadly recognized as an area in need of improvement and that DOT is in a position to change. To find ways for these efforts to be improved, we reviewed various criteria that had been used in prior GAO reports on freight or related issues.6 We focused our attention on whether DOT had good information available for decision making, an important factor in leading practices in capital planning as articulated in GAO’s Executive Guide on Capital Decision-Making and its Federal Internal Control Standards.7 These practices emphasize the importance of good information and information systems, among other practices, to support sound decision-making. We reviewed the draft National Freight Strategic Plan and other DOT’s efforts to determine if DOT had a defined, written strategy for supply chain information because stakeholders we interviewed during our work identified this as an area in need of improvement.
We conducted this performance audit from July 2015 to October 2016 in accordance with generally accepted government auditing standards. Those standards require that we plan and perform the audit to obtain sufficient, appropriate evidence to provide a reasonable basis for our findings and conclusions based on our audit objectives. We believe that the evidence obtained provides a reasonable basis for our findings and conclusions based on our audit objectives.
6For example, GAO, Freight Transportation: Developing National Strategy Would Benefit from Added Focus on Community Congestion Impacts, GAO-14-740. (Washington, D.C.; September 19, 2014). Additional relevant GAO products are listed in an appendix to this report. 7GAO, Executive Guide: Leading Practices in Capital Decision-Making, GAO/AIMD-99-32 (Washington, D.C.; December 1998) and GAO, Standards for Internal Control in the Federal Government, GAO-14-704G (Washington, D.C.: September 2014).

Appendix II: Key Entities Involved in Cargo Movement to and from Ports and Their Role in the Supply Chain
Page 60 GAO-17-23 West Coast Ports
Figure 5: Entities involved in Shipping Cargo to and from Ports and Entities’ Roles in the Supply Chain
aThe ports of Los Angeles, Long Beach, Oakland, Seattle, and Tacoma are “landlord” ports, in that they lease their property and infrastructure to marine terminal operators. Port authorities may also operate port facilities, whereby they act as the marine terminal operator. For example, the port authorities of San Diego and Houston own and operate marine terminals. bSome ports and their associated terminals are privately owned (i.e., they do not have a public agency) and operated, though this is not the case at any of the West Coast port complexes.
Appendix II: Key Entities Involved in Cargo Movement to and from Ports and Their Role in the Supply Chain

Appendix III: Examples of Key Landside and Terminal Infrastructure Projects at Major West Coast Ports Addressing Challenges Related to Changes in Global Shipping
Page 61 GAO-17-23 West Coast Ports
Table 6: Examples of Certain Infrastructure Projects at Major West Coast Ports, Related to Changing Shipping Patterns
Port Project description Total estimated project costa
Status and duration
Los Angeles
Marine terminal upgrades—Berths 136-147 (TraPac Container Terminal) redevelopment of 185 acre terminal consisting of 10 post-Panamax cranes and on-dock rail.
$510M Completed—10 years. Environmental impact statement was approved in 2007 and construction completed in 2016.
Long Beach
Marine terminal upgrades—Berths D, E, F (Middle Harbor) project combining two aging terminals into one with upgraded wharfs, water access, container yards, and expanded on-dock rail yard. Expected to double the capacity of the two terminals it replaces; optimizes cargo handling capacity through infrastructure and technology.
$1.3B Underway—The project was first proposed in 2001; the environmental impact statement was approved in 2009; and construction began in 2011. Expected completion in 2019.
Long Beach
Gerald Desmond Bridge—New bridge will be built with vertical clearance of 205’, high enough to accommodate the passage of larger vessels. The new bridge also provides safety improvements for vehicular travel.
$1.5B+b,c Underway—replacement of the bridge was initially considered in the early 1990s after significant increases in maintenance needs and costs; in 2002, the Port began developing an initial estimate on the project’s cost; construction began in 2013; expected substantial completion in 2018.
Los Angeles
Southern California International Gateway—Burlington Northern Santa Fe’s near dock 153-acre railyard on approximately 96 acres of Los Angeles Harbor Department (LAHD) Property and approximately 57 acres of adjacent non-LAHD property.
TBD Deferred—initially proposed in 2005.d
Oakland Oakland Army Base—Phase 1: Roads, utility infrastructure installation (storm drains, telecommunications, electrical), an expanded railyard, a bulk-cargo marine facility, truck parking and ancillary maritime support facilities, and freight/logistics facilities for the trans loading and movement of goods.
$438Me Underway— the Port has sought to develop the property since 1999 when the base was closed. Planning began in 2011, construction started in 2013, and expected completion in 2017.
Oakland Oakland Army Base—Phase 2: New intermodal rail terminal, additional warehouse and logistics space, and a new grade separation.
TBD Deferred—Phase 2 has not yet commenced as negotiations are still underway for various aspects of this phase of the project.
Seattle Marine Terminal upgrades—T5 at Port of Seattle includes dock upgrade to handle weight of larger cranes and berth deepening up to 55’.
$275M Deferred—The port is in the design stages and searching for a marine terminal operator to lease the facility.
Seattle South Lander Street Overpass—The project will construct a bridge over the railroad tracks aimed at providing a roadway unimpeded by rail operations; improving safety; and relieving congestion to, from, and around the port of Seattle.
$140Mf Underway—Design started in 2003 and continued until the project was placed on hold in March 2008 due to funding limitations. In 2015, the project was reactivated and construction is expected to begin in 2018 and be completed in 2020.
Appendix III: Examples of Key Landside and Terminal Infrastructure Projects at Major West Coast Ports Addressing Challenges Related to Changes in Global Shipping
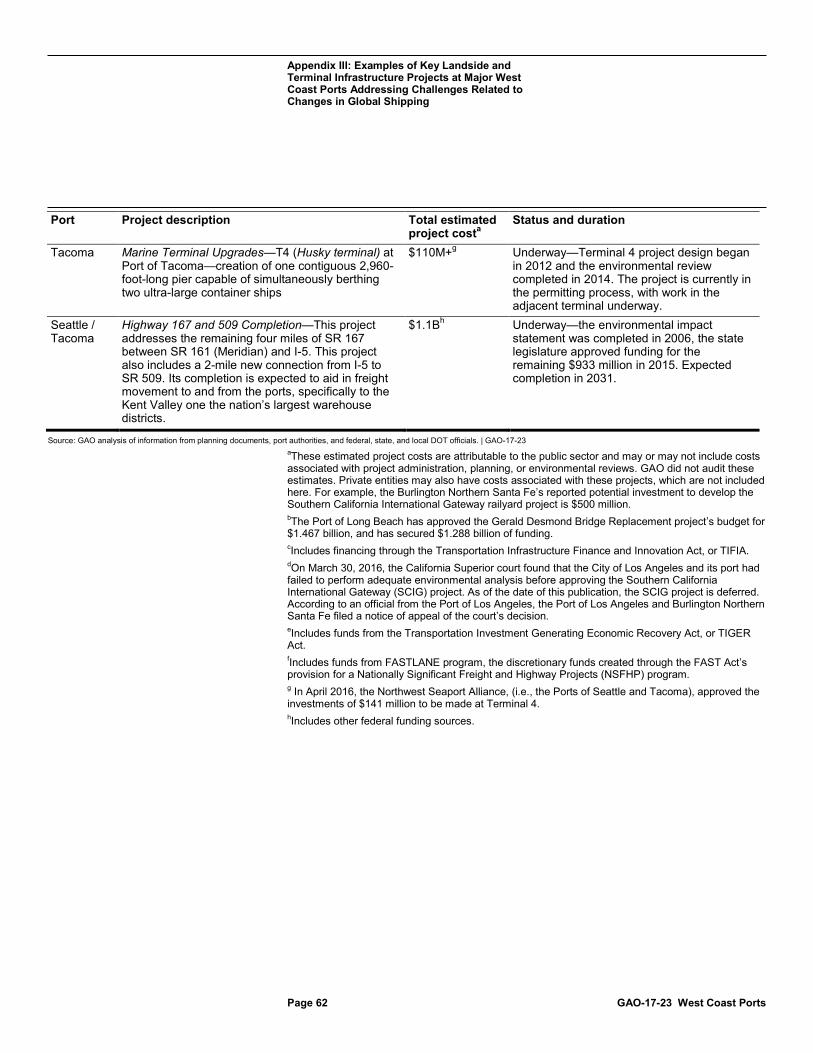
Appendix III: Examples of Key Landside and Terminal Infrastructure Projects at Major West Coast Ports Addressing Challenges Related to Changes in Global Shipping
Page 62 GAO-17-23 West Coast Ports
Port Project description Total estimated project costa
Status and duration
Tacoma Marine Terminal Upgrades—T4 (Husky terminal) at Port of Tacoma—creation of one contiguous 2,960-foot-long pier capable of simultaneously berthing two ultra-large container ships
$110M+g Underway—Terminal 4 project design began in 2012 and the environmental review completed in 2014. The project is currently in the permitting process, with work in the adjacent terminal underway.
Seattle / Tacoma
Highway 167 and 509 Completion—This project addresses the remaining four miles of SR 167 between SR 161 (Meridian) and I-5. This project also includes a 2-mile new connection from I-5 to SR 509. Its completion is expected to aid in freight movement to and from the ports, specifically to the Kent Valley one the nation’s largest warehouse districts.
$1.1Bh Underway—the environmental impact statement was completed in 2006, the state legislature approved funding for the remaining $933 million in 2015. Expected completion in 2031.
Source: GAO analysis of information from planning documents, port authorities, and federal, state, and local DOT officials. | GAO-17-23 aThese estimated project costs are attributable to the public sector and may or may not include costs associated with project administration, planning, or environmental reviews. GAO did not audit these estimates. Private entities may also have costs associated with these projects, which are not included here. For example, the Burlington Northern Santa Fe’s reported potential investment to develop the Southern California International Gateway railyard project is $500 million. bThe Port of Long Beach has approved the Gerald Desmond Bridge Replacement project’s budget for $1.467 billion, and has secured $1.288 billion of funding. cIncludes financing through the Transportation Infrastructure Finance and Innovation Act, or TIFIA. dOn March 30, 2016, the California Superior court found that the City of Los Angeles and its port had failed to perform adequate environmental analysis before approving the Southern California International Gateway (SCIG) project. As of the date of this publication, the SCIG project is deferred. According to an official from the Port of Los Angeles, the Port of Los Angeles and Burlington Northern Santa Fe filed a notice of appeal of the court’s decision. eIncludes funds from the Transportation Investment Generating Economic Recovery Act, or TIGER Act. fIncludes funds from FASTLANE program, the discretionary funds created through the FAST Act’s provision for a Nationally Significant Freight and Highway Projects (NSFHP) program. g In April 2016, the Northwest Seaport Alliance, (i.e., the Ports of Seattle and Tacoma), approved the investments of $141 million to be made at Terminal 4. hIncludes other federal funding sources.

Appendix IV: Empirical Analysis of Trade Flows during Late 2014 and Early 2015
Page 63 GAO-17-23 West Coast Ports
This appendix describes the analyses we conducted to assess whether trade flows through West Coast ports during the port disruption that occurred in late 2014 and early 2015 appeared to be discernably different than other quarters included in our analysis. West Coast ports account for a large share of U.S. trade. For example in 2015 West Coast ports handled almost 23.2 percent of U.S. vessel exports ($118.7 out of a total of $512.6 billion in vessel exports) and 40.5 percent of vessel imports ($425.76 out of a total of $1.1 trillion in vessel imports); that is, in 2015, the West Coast ports handled almost 35 percent of more than $1.6 trillion dollars in total trade. Moreover, large West Coast ports—Los Angeles, Long Beach, Oakland, Seattle, and Tacoma—handled 81.4 percent of vessel exports ($96.7 out of $118.7 billion) and 89.8 percent of vessel imports ($382.2 out of $425.7 billion); that is, large West Coast ports handled 88.0 percent of total West Coast port volume in 2015. As we have noted in this report, our audit work indicated that although this disruption occurred during a timeframe when labor contracts with port workers at West Coast ports had lapsed, other factors also likely contributed to difficulties for importers and exporters at this time. Our work was designed to assess whether there were discernable trade flow anomalies during this time frame, but not to identify the specific cause of any such anomalies. This appendix discusses: (1) the conceptual framework of the analysis, (2) data sources for international trade data and independent factors controlled included in the model, and (3) model results for all trade, and for the 23 unique selected products.
During the later months of 2014 and into early 2015 many ports in the United States, but particularly on the West Coast, became highly congested according to trade associations we spoke with. Our analysis was designed to assess the extent that trade flows during this period were substantially different than other quarters included in our analysis after controlling for various factors. Specifically, our model examined quarterly data over an 11-year period and is designed to examine whether there was any discontinuity in trade patterns during the third and fourth quarters of 2014 or the first quarter of 2015, holding other independent factors constant including economic trends, seasonal factors, and well as fixed effects for ports, country of origin/destination, and product classification.1 The time frame for our analysis was motivated
1We also control for exchange rates in certain specifications.
Appendix IV: Empirical Analysis of Trade Flows during Late 2014 and Early 2015
Conceptual Framework of Analysis
Appendix IV: Empirical Analysis of Trade Flows during Late 2014 and Early 2015
Page 64 GAO-17-23 West Coast Ports
by our discussion with stakeholders; for instance, a trade association indicated that the port difficulties became significant in Fall 2014 and did not diminish until after the second quarter of 2015. We examined whether aggregate exports and imports had any discontinuous pattern in that timeframe not only at the large West Coast ports as a group, but also at the large Gulf and large East Coast Ports. Also, for 23 unique selected products that accounted for substantial shares of either exports or imports at West Coast Ports, we also examine whether the aggregate trade in each direction for those products indicated any discontinuity in the relevant time period.
The primary data source for trade information was the U.S. Census Bureau international trade statistics. The U.S. Census Bureau collects import and export data primarily through electronic transmission and some forms that exporters and importers file with the U.S. Customs and Border Protection and, in some instances, directly with the Census Bureau.2 The trade data provides both the dollar value and weight of trade flows. We used dollar value as the primary focus of our analysis, but alternatively used weight as a robustness check on our findings. The data available are fairly disaggregated and can be pulled from Census in variety of ways. We used data that centered on activity at ports, and made various other decisions about how to assemble that data for the analysis:
1. Port: We accessed data that are available at the port level, meaning that information on trade flows are recorded based on the port of entry or exit. We made certain decisions as to what ports to use in the analysis and the extent of aggregation across ports. First, we determined that, in addition to analyzing trade flows at West Coast
2 The United States and Canada agreed to exchange trade data. According to Census officials, because import data has more scrutiny paid to it, each country uses the other's import data as their export data. U.S. reported exports to Canada are actually based on Canadian data on imports from the United States. Canadian reported exports to the United States are actually based on U.S data on imports from Canada.
Data Sources and Basic Model Structure
Data Development

Appendix IV: Empirical Analysis of Trade Flows during Late 2014 and Early 2015
Page 65 GAO-17-23 West Coast Ports
ports, we would also run the same analysis for ports on other U.S. coasts as a frame of comparison. As such, we used data on ports that were located on the West, East, or Gulf coasts, and then used aggregated port traffic according to these three coastal groupings. In addition, since larger ports account for the vast majority of traffic, we only include ports in our analysis that accounted for at least 5 percent of 2012 directional trade on the relevant coast. That is, a port on the East Coast had to account for at least 5 percent of, for example, exports from East Coast ports in 2012, to be included in the export analysis of East Coast ports. This reduced the number of ports in the analysis considerably. For example, for the West Coast there were 40 ports in total for imports and 41 for exports, but after applying the 5 percent screen we found that only 5 West Coast Ports exceeded the screen for both directions of trade. In the West Coast these selected ports accounted for 86.4 percent of exports and 92.6 of imports in the region. Additionally, we focused solely on the ports with containerized vessel trade during our study period along each of the three coasts. We also separately conducted an analysis of trade through airports located on each of these coasts, for which a similar screening criterion was applied.
2. Direction of trade: We conducted separate analyses for imports and exports. Therefore, each record in the data set we developed was classified according to the directional trade flow it represented and included in the model accordingly.
3. Trading partners: The data available from the Census Bureau includes information for trade between the United States and all countries for which there is any reported trade. However, we found that the majority of countries have little trade with the United States. For example, in 2015, Census officials explained that 50 countries made up 79 percent of imported volume into the United States. Because each country’s observation would weigh equally in the model, we determined that it would be appropriate to focus the analysis on the larger trading partners—that is, those countries that account for the majority of trade with each coastal region of the United States. Therefore, after reducing the number of ports based on the port screen described above, we imposed an additional screen for countries. Specifically we only included a country in our analysis if its trade with the United States constituted at least 0.1 percent of either imports or exports of U.S. trade for the large ports on each coast. For example, for a country to be included in the export analysis from West Coast ports, at least 0.1 percent of exports through large West Coast ports needed to be destined to that country. Applying this screen reduced the number of countries included in the analysis

Appendix IV: Empirical Analysis of Trade Flows during Late 2014 and Early 2015
Page 66 GAO-17-23 West Coast Ports
considerably. In total, there were 239 countries in the full export dataset that had some trade with the United States and 237 in the full import dataset. After applying the screen in the export analysis we reduced the number of countries to 44 for the West Coast region, 79 for the East Coast region and 85 for the Gulf Coast. In 2012, at the West Coast these selected countries accounted for 97.4 percent of exports through the large ports, for the East Coast they accounted for 97.5 percent and for the Gulf Coast they accounted for 97.6 percent. In the import analysis we reduced the number of countries to 32 for the West Coast, 64 for the East Coast, and 71 for the Gulf Coast. In 2012, at the West Coast these selected countries accounted for 98.2 percent of imports through the large ports, in the East Coast they accounted for 98.3 percent and for the Gulf Coast they accounted for 98.9 percent.
4. Level of Commodity Classification: Commodity information can be classified at various levels of aggregation. The six-digit commodity classification was the most disaggregated classification of commodities available in the Census Bureau’s files we accessed. For example, a six-digit classification for “apples, fresh”, is a component of the more aggregated 2-digit “edible fruit and nuts; citrus fruit or melon peel” commodity group.3 Our primary analysis uses the 2-digit commodity classification—of which there are 98 groups.
5. Time Frame: Census data was available by month. However, we aggregated data to the quarterly level for the analysis. We collected data beginning with the first quarter of 2005 and ending with first quarter of 2016, which were the most recent data available when we conducted the analysis.
Based on the data collected and the elements of aggregation described above, our data set was organized as follows:
Import data: A file in which each record contains information for the dollar value of imports of a particular commodity at the 2-digit level, coming into a particular U.S. port, during a particular quarter, which originated in a particular country: for example: the vessel dollar value of apparel and accessories, knit and crochet, imported through the port of San Francisco, during the third quarter of 2010 that originated in Korea.
3There is also an intermediate classification at the 4-digit level (at the 4-digit classification apples would fall under the Apples, Pears and Quinces, Fresh, commodity group).

Appendix IV: Empirical Analysis of Trade Flows during Late 2014 and Early 2015
Page 67 GAO-17-23 West Coast Ports
Export data: A file in which each record contains information for the dollar value of exports of a particular commodity at the 2-digit level, embarking from a particular U.S. port, during a particular quarter, destined for a particular country. Example: the vessel dollar value of edible fruits and nuts exported through the Port of Seattle, during the 2nd quarter of 2013 and destined for Japan.
Our model attempts to examine whether there were any significant shifts in trade patterns during the 2014q3-2015q1 period, after controlling the various factors that may also influence trade volume. That is, our model will estimate any break in the levels of trade during the 2014q3-2015q1 period given (1) existing historic trends in trade growth over time—expressed in the model as a linear time trend, (2) seasonal impacts, (3) time invariant port, country, and product characteristics, and, in some specifications, (4) exchange rates.4
The basic estimation equation for the main analysis is expressed as:
ln (y + 1)𝑖𝑖𝑖𝑖𝑡𝑡𝑡𝑡 =∝ +𝛽𝛽1𝑝𝑝𝑝𝑝𝑝𝑝𝑝𝑝 𝑑𝑑𝑑𝑑𝑑𝑑𝑝𝑝𝑑𝑑𝑝𝑝𝑝𝑝𝑑𝑑𝑝𝑝𝑑𝑑𝑡𝑡 + 𝛽𝛽2 𝑝𝑝𝑝𝑝𝑡𝑡𝑑𝑑𝑑𝑑𝑡𝑡 + 𝛽𝛽3 𝑅𝑅𝑡𝑡𝑅𝑅𝑡𝑡𝑑𝑑𝑑𝑑𝑑𝑑𝑝𝑝𝑑𝑑𝑡𝑡 +𝛽𝛽4 𝐸𝐸𝑅𝑅𝑡𝑡𝑡𝑡+∝𝑖𝑖+∝𝑖𝑖 +∝𝑞𝑞+∝𝑡𝑡+ 𝜀𝜀𝑖𝑖𝑖𝑖𝑡𝑡𝑡𝑡,
Where:
i denotes port, p denotes product category at the two-digit Harmonized System (HS) code level, t denotes quarter c denotes country of origin or destination
Thus,
• ln (y + 1)iptc, the dependent variable, is the natural log of the dollar value of either exports or imports plus one, in order to account for zeroes in the data, passing through port i (which will be identified as
4We obtained data on monthly exchange rates from the International Monetary Fund (IMF), which we also aggregated at the quarterly level for each country.
Model Structure

Appendix IV: Empirical Analysis of Trade Flows during Late 2014 and Early 2015
Page 68 GAO-17-23 West Coast Ports
being on one of the three coasts), for product category p, during quarter t, and coming from or destined for country c
• port disruption is a dummy variable designed to capture whether there was any shift in the volume of trade during the entire time frame of the port disruption—2014q3-2015q1—or, alternatively, for each of those three quarters separately as well as the quarters following the port disruption, up to and including 2016q1
• trendt is a linear time trend that controls for trends in trade overtime, the pattern of which is likely related to trends in overall economic activity and other factors that may influence the underlying pattern of trade growth.
• Recessiont is an indicator equal to one during the quarters that correspond to the great recession, 2007q4-2009q2, to account for any changes in trade during that period related to the economic downturn
• ∝q, are quarter of the year indicators to control for seasonality
• ERct is the exchange rate for country c in time t (included in only some specifications of the model)
• ∝i are port fixed effects, which control for time invariant port characteristics. Such characteristics might include factors such as the products that are produced near the port that would drive elements of the trade it handles, management characteristics of the particular port, or other similar port-specific related factors.
• ∝p are product category fixed effects, which control for time invariant product characteristics, such as the underlying demand characteristics of the product in the U.S. or in other countries.
• ∝c are country fixed effects, which control for time invariant country characteristics, such as location of the country and its bilateral trade agreements with the United States.
• 𝜀𝜀𝑖𝑖𝑖𝑖𝑡𝑡𝑡𝑡 is the error term.
The parameter of interest, 𝛽𝛽1, measures any break in the level of trade compared to other quarters during our study period after controlling for the independent factors included in the model. We estimated the equation above separately for exports and imports across ports with containerized cargo trade on each of the three coasts. For example, one estimation analyzed vessel exports from the West Coast ports, while another was vessel imports into East Coast ports. As such, there are 6 different estimations to examine trade at ports with containerized cargo and an additional 6 estimations to examine trade at ports with air cargo in the
Appendix IV: Empirical Analysis of Trade Flows during Late 2014 and Early 2015
Page 69 GAO-17-23 West Coast Ports
three coast regions. The standard errors are clustered at the port level in order to account for serial correlation in trade for a given port over time.
Table 7 displays the model’s results for exports from ports with containerized cargo along each of the 3 coasts. We provide results for two model specifications. In the first, we test whether exports for the entire port disruption period—including the last two quarters of 2014 as well as the first quarter of 2015—appear to be significantly different along each of the coasts. The second examines the same issue, but rather than collapsing the time frame all together, we model each of the three quarters separately as well as the subsequent quarters post-disruption to assess whether there were any abnormal trade patterns even after the port situation had abated. In table 7, we provide the coefficients directly from the regressions for the port disruption time frames in the odd-numbered columns of results for each coast, but in the even columns we provide the percentage change in exports our model would suggest if each of the variables in the model were increased by one.5
These results indicate that for the 3 quarters of the port disruption in aggregate, there appears to be a decline in the value of exports from West Coast ports relative to the level of exports in other non-disruption quarters after controlling for the various factors in the model. In particular, from the regression results for the entire port disruption period we find that exports appear to have been 23.5 percent lower during this period. This finding is significant at the 5 percent level. We find no statistically significant changes in exports from the other coasts for the entire 3-quarter period.
5Given that the dependent variable of the model is given in logs, the effect of a one unit change in the dependent variable on the independent variable, while holding the other variables constant, is given by 𝑡𝑡𝛽𝛽-1:
ln 𝑦1 − ln 𝑦0 = ln �
𝑦1𝑦0� = 𝛽𝛽1 ==>
𝑦1𝑦0
= 𝑡𝑡𝛽𝛽1 ==>𝑦1 − 𝑦0𝑦0
= 𝑡𝑡𝛽𝛽1 − 1
Model Results
Exports for All Goods

Appendix IV: Empirical Analysis of Trade Flows during Late 2014 and Early 2015
Page 70 GAO-17-23 West Coast Ports
When looking at the three quarters separately our model suggests that the extent by which exports in each quarter of the disruption period were different than past quarters varied across the disruption period. Notably, we find no statistical changes in exports from the West Coast ports during the third quarter of 2014, and a weakly significant finding of reduced exports during the last quarter of 2014 from those ports. However, during the first quarter of 2015 we find that exports from West Coast ports appear, on average across the port, commodity, and trading partner observations, to have been substantially lower than past quarters by roughly 50 percent. This finding is statistically significant at the 1 percent level.
In addition, while we do not find any unusual changes in exports from East Coast ports during this time frame, it does appear that exports were lower than during late 2014 at Gulf Coast ports, and again at these ports in the later part of 2015 and early 2016, compared to other quarters included in the analysis. Finally, results for the control variables are generally as expected—exports have tended to rise over time, and each group of fixed effects for port, country, and product, are jointly statistically significant.

Appendix IV: Empirical Analysis of Trade Flows during Late 2014 and Early 2015
Page 71 GAO-17-23 West Coast Ports
Table 7: Vessel Exports Regression Results
ln (Exports+1) West East Gulf (1) (2) (3) (4) (5) (6) (7) (8) (9) (10) (11) (12) Point
Estimate percentage change (95
percent confidence interval of
percentage change)
Point Estimate
percentage change (95
percent confidence interval of
percentage change)
Point Estimate
percentage change (95
percent confidence interval of
percentage change)
Point Estimate
percentage change (95
percent confidence interval of
percentage change)
Point Estimate
percentage change (95
percent confidence interval of
percentage change)
Point Estimate
percentage change (95
percent confidence interval of
percentage change)
2014q3-2015q1
-0.267** -23.5 0.0677 7.0 -0.0273 -2.7
(0.086) (-39.7, -2.9)
(0.119) (-23.2, 49.0)
(0.047) (-13.7, 9.7)
2014q3 -0.142 -13.2 -0.00368 -0.4 -0.164** -15.1 (0.250) (-56.7, 73.8) (0.166) (-37.2,
58) (0.047) (-24.9,
-4.1) 2014q4 -0.375* -31.3 -0.0759 -7.3 -0.213* -19.1 (0.173) (-57.5, 11.2) (0.183) (-44.3,
54.2) (0.092) (-36.2,
2.4) 2015q1 -0.734*** -52.0 -0.0563 -5.5 -0.168 -15.5 (0.151) (-68.4,
-27.1) (0.240) (-51.4,
84) (0.161) (-44.2,
28.0) 2015q2 -0.396 -32.7 -0.178 -16.3 -0.238 -21.1 (0.203) (-61.7, 18.3) (0.236) (-56.5,
61.1) (0.188) (-51.4,
28) 2015q3 -0.377 -31.4 -0.283 -24.6 -0.394 -32.5 (0.225) (-63.2, 28.0) (0.271) (-64.5,
59.9) (0.205) (-60.2,
14.2)
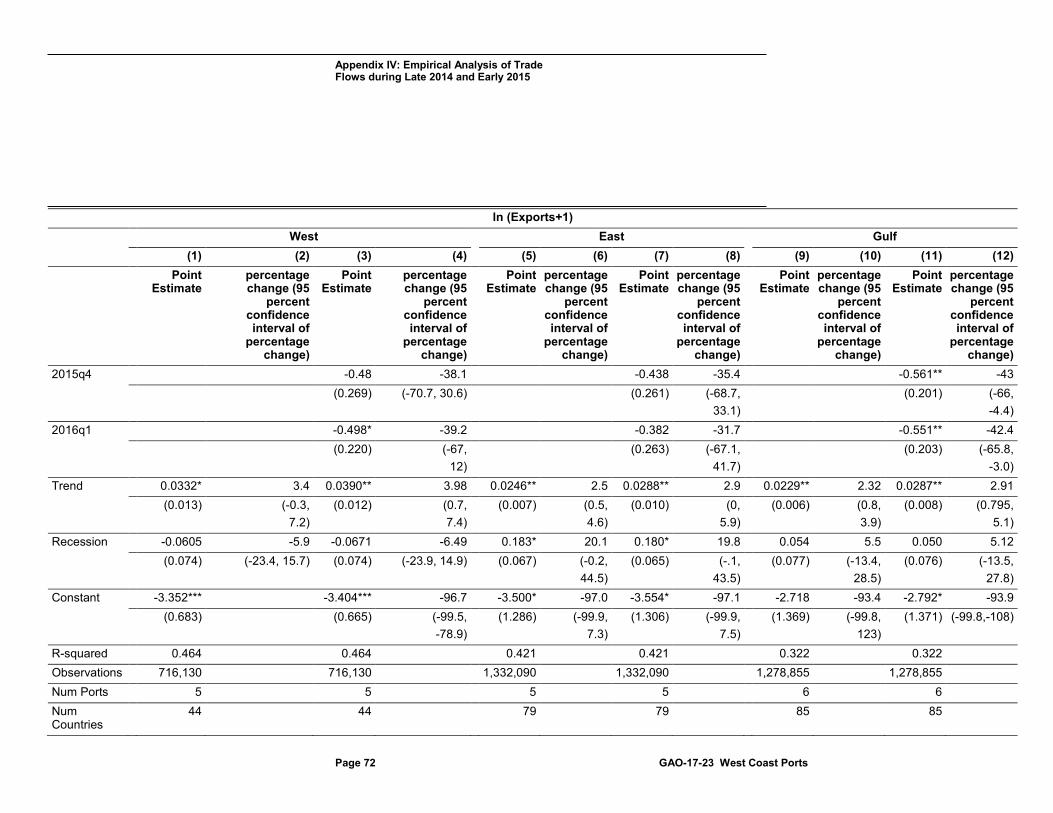
Appendix IV: Empirical Analysis of Trade Flows during Late 2014 and Early 2015
Page 72 GAO-17-23 West Coast Ports
ln (Exports+1) West East Gulf (1) (2) (3) (4) (5) (6) (7) (8) (9) (10) (11) (12) Point
Estimate percentage change (95
percent confidence interval of
percentage change)
Point Estimate
percentage change (95
percent confidence interval of
percentage change)
Point Estimate
percentage change (95
percent confidence interval of
percentage change)
Point Estimate
percentage change (95
percent confidence interval of
percentage change)
Point Estimate
percentage change (95
percent confidence interval of
percentage change)
Point Estimate
percentage change (95
percent confidence interval of
percentage change)
2015q4 -0.48 -38.1 -0.438 -35.4 -0.561** -43 (0.269) (-70.7, 30.6) (0.261) (-68.7,
33.1) (0.201) (-66,
-4.4) 2016q1 -0.498* -39.2 -0.382 -31.7 -0.551** -42.4 (0.220) (-67,
12) (0.263) (-67.1,
41.7) (0.203) (-65.8,
-3.0) Trend 0.0332* 3.4 0.0390** 3.98 0.0246** 2.5 0.0288** 2.9 0.0229** 2.32 0.0287** 2.91 (0.013) (-0.3,
7.2) (0.012) (0.7,
7.4) (0.007) (0.5,
4.6) (0.010) (0,
5.9) (0.006) (0.8,
3.9) (0.008) (0.795,
5.1) Recession -0.0605 -5.9 -0.0671 -6.49 0.183* 20.1 0.180* 19.8 0.054 5.5 0.050 5.12 (0.074) (-23.4, 15.7) (0.074) (-23.9, 14.9) (0.067) (-0.2,
44.5) (0.065) (-.1,
43.5) (0.077) (-13.4,
28.5) (0.076) (-13.5,
27.8) Constant -3.352*** -3.404*** -96.7 -3.500* -97.0 -3.554* -97.1 -2.718 -93.4 -2.792* -93.9 (0.683) (0.665) (-99.5,
-78.9) (1.286) (-99.9,
7.3) (1.306) (-99.9,
7.5) (1.369) (-99.8,
123) (1.371) (-99.8,-108)
R-squared 0.464 0.464 0.421 0.421 0.322 0.322 Observations 716,130 716,130 1,332,090 1,332,090 1,278,855 1,278,855 Num Ports 5 5 5 5 6 6 Num Countries
44 44 79 79 85 85

Appendix IV: Empirical Analysis of Trade Flows during Late 2014 and Early 2015
Page 73 GAO-17-23 West Coast Ports
ln (Exports+1) West East Gulf (1) (2) (3) (4) (5) (6) (7) (8) (9) (10) (11) (12) Point
Estimate percentage change (95
percent confidence interval of
percentage change)
Point Estimate
percentage change (95
percent confidence interval of
percentage change)
Point Estimate
percentage change (95
percent confidence interval of
percentage change)
Point Estimate
percentage change (95
percent confidence interval of
percentage change)
Point Estimate
percentage change (95
percent confidence interval of
percentage change)
Point Estimate
percentage change (95
percent confidence interval of
percentage change)
Num 2-dig Prods
96 96 96 96 96 96
Source: GAO analysis of U.S. International Trade data. | GAO-17-23
Notes: The dependent variable is ln(exp+1). The associated percentage change on exports associated with a one unit change in each of the independent variables, given by 100 ∗ (𝑡𝑡𝛽𝛽� − 1), is reported in the even numbered columns. Includes data for the 2005q1-2016q1 period. Excludes oil exports. For each region, excludes ports that account for less than 5 percent of exports as well as countries that account for less than 0.1 percent of exports for these large ports. All regressions control for quarter of the year, port, country and two-digit product fixed effects. *significantly different from zero at 90 percent confidence level, **significantly different from zero at the 95 percent confidence level, *** significantly different from zero at the 99 percent confidence level. Standard errors clustered at the port level are in parentheses.

Appendix IV: Empirical Analysis of Trade Flows during Late 2014 and Early 2015
Page 74 GAO-17-23 West Coast Ports
Table 8 displays the model results for imports from ports with containerized cargo along each of the 3 coasts. As above, we provide results for two model specifications—the first examines imports for the entire port disruption period and the second assesses imports for each of the three quarters separately as well as the quarters post-disruption.
As shown on table 8, we did not find any indication that imports into West Coast ports during the port disruption were statistically different than import levels in the other quarters, after controlling for the various factors in the model. In addition, we found no evidence of unusual changes in trade flows at East Coast ports during this time frame. However, we did find that imports at Gulf Coast ports were higher during the West Coast port disruption time frame, as well as for every quarter we examined thereafter, compared to other quarters included in the analysis. This may suggest that some factor not accounted for in the model was leading to increased imports in the Gulf region during and after the disruption period.
Imports for All Goods

Appendix IV: Empirical Analysis of Trade Flows during Late 2014 and Early 2015
Page 75 GAO-17-23 West Coast Ports
Table 8: Vessel Imports Regression Results
ln (Imports+1) West East Gulf (1) (2) (3) (4) (5) (6) (7) (8) (9) (10) (11) (12) Point
Estimate
percentage change (95
percent confidence interval of
percentage change)
Point Estimate
percentage change (95
percent confidence interval of
percentage change)
Point Estimate
percentage change (95
percent confidence interval of
percentage change)
Point Estimate
percentage change (95
percent confidence interval of
percentage change)
Point Estimate
percentage change (95
percent confidence interval of
percentage change)
Point Estimate
percentage change (95
percent confidence interval of
percentage change)
2014q3-2015q1 0.103 10.8 -0.013 -1.3 0.236* 26.7 (0.125) (-21.6, 56.7) (0.115) (-25.5, 30.8) (0.108) (-4.1,
67.3)
2014q3 0.149 16.0 0.00815 0.819 0.378** 46 (0.256) (-43.1,
136.5) (0.165) (-32.7,
51) (0.145) (0.6,
111.8) 2014q4 0.303 35.4 -0.0461 -4.51 0.333** 39.6 (0.261) (-34.4,
179.6) (0.190) (-40,
51.9) (0.109) (5.52,
84.6) 2015q1 0.222 24.9 0.125 13.3 0.465** 59.1 (0.232) (-34.5,
138) (0.174) (-26.1,
73.6) (0.137) (11.9,
126.3) 2015q2 0.357 42.9 0.175 19.1 0.489** 63 (0.316) (-40.5,
243.2) (0.157) (-18.9,
74.9) (0.152) (10.4,
140.7) 2015q3 0.355 42.6 0.109 11.6 0.495*** 64.1 (0.354) (-46.7,
281.4) (0.171) (-26.5,
69.3) (0.107) (24.8,
115.8)

Appendix IV: Empirical Analysis of Trade Flows during Late 2014 and Early 2015
Page 76 GAO-17-23 West Coast Ports
ln (Imports+1) West East Gulf (1) (2) (3) (4) (5) (6) (7) (8) (9) (10) (11) (12) Point
Estimate
percentage change (95
percent confidence interval of
percentage change)
Point Estimate
percentage change (95
percent confidence interval of
percentage change)
Point Estimate
percentage change (95
percent confidence interval of
percentage change)
Point Estimate
percentage change (95
percent confidence interval of
percentage change)
Point Estimate
percentage change (95
percent confidence interval of
percentage change)
Point Estimate
percentage change (95
percent confidence interval of
percentage change)
2015q4 0.407 50.2 0.0981 10.3 0.428*** 53.4 (0.376) (-47.1,
326.6) (0.192) (-31,
76.4) (0.103) (17.9,
99.7) 2016q1 0.329 38.9 0.135 14.5 0.450** 56.9 (0.314) (-41.8,
231.8) (0.197) (-29.4,
85.6) (0.125) (13.7,
116.3) Trend 0.009 .9 0.004 0.393 0.012 1.2 0.010 1.04 0.015 1.5 0.009 0.912 (0.010) (-1.8,
3.6) (0.010) (-2.37,
3.24) (0.007) (-0.5,
3.0) (0.008) (-0.818,
2.93) (0.008) (-.6,
3.7) (0.009) (-1.41,
3.28) Recession -0.124* -11.7 -0.120* -11.3 0.169 18.4 0.170 18.5 -0.145** -13.5 -0.142** -13.2 (0.051) (-23.3,
1.7) (0.051) (-22.9,
2.05) (0.099) (-7.2,
50.9) (0.099) (-6.97,
50.9) (0.050) (-24,
-1.5) (0.050) (-23.7,
-1.34) Constant -3.469 -96.9 -3.399 -96.7 -3.651* -97.4 -3.635* -97.4 -5.267** -99.5 -5.184** -99.4 (1.829) (-100,
400) (1.826) (-100, 431) (1.509) (-99.9,
4.3) (1.523) (-99.9,
9.55) (1.582) (-100,
-69.9) (1.568) (-100,
-68.5) R-squared 0.438 0.438 0.296 0.296 0.257 0.257 Observations 514,035 514,035 1,038,465 1,038,465 913,680 913,680 Num Ports 5 5 7 7 6 6 Num Countries 32 32 64 64 71 71
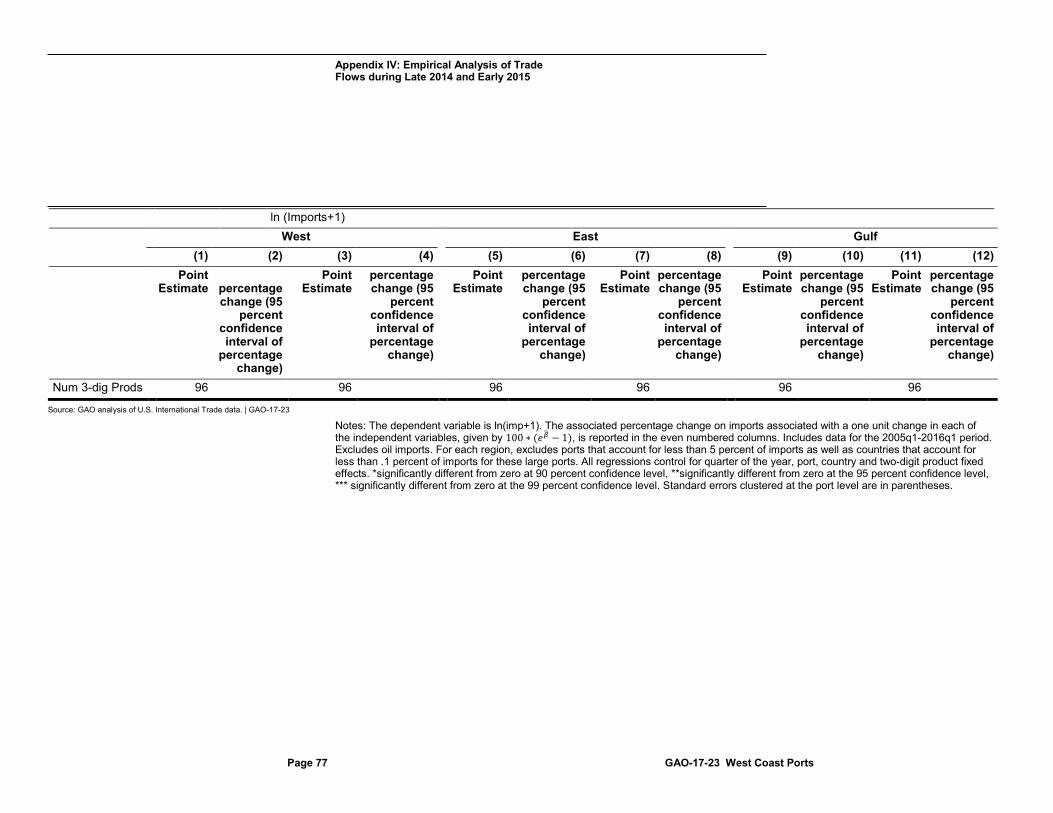
Appendix IV: Empirical Analysis of Trade Flows during Late 2014 and Early 2015
Page 77 GAO-17-23 West Coast Ports
ln (Imports+1) West East Gulf (1) (2) (3) (4) (5) (6) (7) (8) (9) (10) (11) (12) Point
Estimate
percentage change (95
percent confidence interval of
percentage change)
Point Estimate
percentage change (95
percent confidence interval of
percentage change)
Point Estimate
percentage change (95
percent confidence interval of
percentage change)
Point Estimate
percentage change (95
percent confidence interval of
percentage change)
Point Estimate
percentage change (95
percent confidence interval of
percentage change)
Point Estimate
percentage change (95
percent confidence interval of
percentage change)
Num 3-dig Prods 96 96 96 96 96 96
Source: GAO analysis of U.S. International Trade data. | GAO-17-23
Notes: The dependent variable is ln(imp+1). The associated percentage change on imports associated with a one unit change in each of the independent variables, given by 100 ∗ (𝑡𝑡𝛽𝛽� − 1), is reported in the even numbered columns. Includes data for the 2005q1-2016q1 period. Excludes oil imports. For each region, excludes ports that account for less than 5 percent of imports as well as countries that account for less than .1 percent of imports for these large ports. All regressions control for quarter of the year, port, country and two-digit product fixed effects. *significantly different from zero at 90 percent confidence level, **significantly different from zero at the 95 percent confidence level, *** significantly different from zero at the 99 percent confidence level. Standard errors clustered at the port level are in parentheses.

Appendix IV: Empirical Analysis of Trade Flows during Late 2014 and Early 2015
Page 78 GAO-17-23 West Coast Ports
Table 9 provides results for our regression analysis for the 2 distinct sets of selected interview commodities—13 commodities that are major imported goods at West Coast ports, and 14 commodities that are major exported goods from West Coast ports. For each direction of trade, in turn, we aggregated the dollar value of trade flows at the four-digit commodity level for the specific products that fell under these categories and ran the model on this subset of the trade data. Our findings for these commodities align with our findings for total trade flows discussed above. Notably, we found that during the entire time frame of the port disruption, there appears to have been a statistically significant reduction in exports, but that reduction was not experienced equally across the 3 quarters. In the case of the 14 export commodities combined, we found no statistical reduction in trade in the last two quarters of 2014, but by the first quarter of 2015 the dollar value of these exports, on average across the port, commodity, and trading partner observations, appears to be about half of the levels in other quarters in the analysis after controlling for the various factors in the model. Additionally, for these commodities we found that exports remain below past levels in the second quarter of 2015, which would align with stakeholders views expressed to us that the port difficulties took some time to ameliorate in the winter of 2015 and trade was affected into the second quarter. We find no evidence that imports at West Coast ports showed any unusual change during any of the time period of the port disruption.
Exports and Imports for Selected Interview Commodities at West Coast Ports

Appendix IV: Empirical Analysis of Trade Flows during Late 2014 and Early 2015
Page 79 GAO-17-23 West Coast Ports
Table 9: Selected Commodities Results for West Coast Vessel Exports and Imports
ln(Exports+1) ln(Imports+1) (1) (2) (3) (4) (5) (6) (7) (8) Point
Estimate percentage change (95
percent confidence interval of
percentage change)
Point Estimate
percentage change (95
percent confidence interval of
percentage change)
Point Estimate
percentage change (95
percent confidence interval of
percentage change)
Point Estimate
percentage change (95
percent confidence interval of
percentage change)
2014q3-2015q1 -0.225** -20.2 0.18 19.7 (0.067) (-33.8,-3.74) (0.171) (-25.5,92.3) 2014q3 -0.179 -16.4 0.243 27.5 (0.208) (-53.1,49.2) (0.359) (-52.9,245.5) 2014q4 -0.433 -35.2 0.479 61.5 (0.208) (-63.6,15.5) (0.332) (-35.7,305.8) 2015q1 -0.728*** -51.7 0.316 37.2 (0.116) (-65,-33.4) (0.217) (-24.9,150.6) 2015q2 -0.524** -40.8 0.413 51.1 (0.155) (-61.5,-8.85) (0.288) (-32.1,236.4) 2015q3 -0.574* -43.6 0.526 69.2 (0.233) (-70.5,7.63) (0.360) (-37.8,360.1) 2015q4 -0.773* -53.8 0.407 50.2 (0.334) (-81.7,16.7) (0.398) (-50.3,353.8) 2016q1 -0.703** -50.5 0.603 82.7 (0.187) (-70.5,-16.8) (0.287) (-17.7,305.4) Trend 0.0310** 3.2 0.0395*** 4.0 0.001 0.1 -0.006 -0.6 (0.009) (0.7,5.6) (0.007) (2.05,6.04) (0.009) (-2.38,2.58) (0.008) (-2.68,1.6) Recession 0.111 11.7 0.103 10.8 -0.155** -14.4 -0.151** -14.0

Appendix IV: Empirical Analysis of Trade Flows during Late 2014 and Early 2015
Page 80 GAO-17-23 West Coast Ports
ln(Exports+1) ln(Imports+1) (1) (2) (3) (4) (5) (6) (7) (8) Point
Estimate percentage change (95
percent confidence interval of
percentage change)
Point Estimate
percentage change (95
percent confidence interval of
percentage change)
Point Estimate
percentage change (95
percent confidence interval of
percentage change)
Point Estimate
percentage change (95
percent confidence interval of
percentage change)
(0.070) (-8.0,35.6) (0.071) (-8.9,34.8) (0.050) (-25.4,-1.74) (0.049) (-24.9,-1.62) Constant 1.674* 433.2 1.581* 386 6.827* 92,100 6.911* 100,200 (0.703) (-24.3,3,659) (0.713) (-32.9,3,418) (2.804) (-
61.6,221,600,000) (2.783) (-
55.8,227,700,000) R-squared 0.297 0.297 0.36 0.36 Observations 91,890 91,890 67,950 67,950 Num Ports 5 5 5 5 Num Countries 44 44 32 32 Num 4-dig Prods 14 14 13 13
Source: GAO Analysis of U.S. International Trade data. | GAO-17-23
Notes: The associated percentage change on either exports or imports associated with a one unit change in each of the independent variables, given by 100 ∗ (𝑡𝑡𝛽𝛽� − 1), is reported in the even numbered columns. Includes data for the 2005q1-2016q1 period. For each region, excludes ports that account for less than 5 percent of total exports/imports as well as countries that account for less than 0.1 percent of total exports/imports for these large ports. All regressions control for quarter of the year, port, country and four-digit product fixed effects. * significantly different from zero at 90 percent confidence level, **significantly different from zero at the 95 percent confidence level, * **significantly different from zero at the 99 percent confidence level. Standard errors clustered at the port level are in parentheses.

Appendix IV: Empirical Analysis of Trade Flows during Late 2014 and Early 2015
Page 81 GAO-17-23 West Coast Ports
Table 10 displays the model results for air exports and imports for each of the three coasts. Panel A shows the percentage change in exports and panel B shows the percentage change in imports for each region for the three quarters combined, column (1), as well as for each of the quarters separately, columns (2)-(8).
As shown on table 10, we did not find any indication that exports during the disruption were statistically different than past export levels at airports on any of the three coasts. However, we did find that imports were significantly higher during each of the quarters of the disruption period for the West coast but not for the other regions. As the results show, air imports to the West coast remained higher than past levels even after the disruption time frame, suggesting that the increase might have been part of a more general change in trend.
Table 10: Changes in Air Exports and Imports by Region
Panel A: Air Exports (1) (2) (3) (4) (5) (6) (7) (8) 2014q3-2015q1
percentage change 2014q3
percentage change
2014q4 percentage
change
2015q1 percentage
change
2015q2 percentage
change
2015q3 percentage
change
2015q4 percentage
change
2016q1 percentage
change West 3.6 2.9 -5.0 -1.9 -4.5 -7.6 -18.2 -19.6 East 4.4 7.1 -1.5 -4.9 -7.6 -5.5 -11.9 -19.0 Gulf -0.2 -9.0 -11.6 -18.0 -23.0 -28.8 -36.9** -39.7** Panel B: Air Imports West 31.7 48.8** 50.9*** 83.5 70.3** 72.8** 81.3** 90.4** East 6.8 14.5 13.5 14.5 7.2 19.8 28.2 27.1 Gulf 11.3 15.6 12.8 12.3 0.4 5.7 10.0 5.9
Source: GAO Analysis of U.S. International Trade data. | GAO-17-23
Notes: The dependent variable is ln(exp+1) in panel A and ln(imp+1) in panel B. The associated percentage change on exports/imports associated with each of the time periods, given by 100 ∗ (𝑡𝑡𝛽𝛽� −1), is reported. Includes data for the 2005q1-2016q1 period. Excludes oil exports/imports. For each region, excludes ports that account for less than 5 percent of air exports/imports as well as countries that account for less than 0.1 percent of air exports/imports for these large ports. All regressions control for quarter of the year, port, country and two-digit product fixed effects. * significantly different from zero at 90 percent confidence level, **significantly different from zero at the 95 percent confidence level, *** significantly different from zero at the 99 percent confidence level. Standard errors have been clustered at the port level.
We conducted a variety of analyses to assess the robustness of our model results. In particular:
• Timing: In alternative specifications we conducted falsification tests under which we ran a separate regression with an indicator for each of the quarters between 2010q1 and 2014q3, along with our baseline
Exports and Imports by Air
Robustness Analysis
Appendix IV: Empirical Analysis of Trade Flows during Late 2014 and Early 2015
Page 82 GAO-17-23 West Coast Ports
controls, to test whether there was a change in trade patterns in any of those quarters. We did not find any significant changes in any of the quarters after 2010q1 and before the disruption.
• Cargo weight: The base case analysis used the dollar value of shipments as the measurement of the extent of trade. We alternatively used cargo weight to gauge extent of trade. Results were stable in this alternative analysis.
• Non-agricultural products: We ran the analysis on the West Coast ports using only non-agricultural products and the results were similar to the model when both agricultural and non-agricultural products were included. Thus it does not seem that the results were driven by shocks to the agricultural sector, such as weather shocks.
• Alternative trend analysis: Two of the independent variables included in the models are designed to capture elements of how macroeconomic conditions may influence trade flows over time. The first of these variables is the linear time trend, and the second is the dummy variable for the quarters associated with the recession that began in late 2007 and ended in mid-2009. In an alternative specification of the model, we excluded these two variables and instead included a measure of U.S. quarterly GDP to reflect the health of the economy over time. This specification resulted in the same general outcomes for our variable of interest. That is, we found exports from West Coast ports to be significantly lower than other quarters during the port disruption but found no such results for imports into those ports.
• Alternative specification for port level trends: In the original analysis the time trend was assumed to be the same for all ports. In an alternative specification we allowed this linear time trend in trade to vary by port—that is, the time trend could be different across ports through the time frame of our data. This alteration did not have any effect on the core findings of the model.
• Inclusion of exchange rates: The base-case analysis did not control for exchange rates between the U.S. and each of the trading countries. In an alternative specification we included these data.1 Model results were not affected by the inclusion of exchange rates.
• Exclusion of observations with zero value: In our main analysis the dependent variable was log(y+1), where y was either exports or imports, in order to include observations with zero value in the
1Quarterly/country level data on exchange rates come from the IMF.

Appendix IV: Empirical Analysis of Trade Flows during Late 2014 and Early 2015
Page 83 GAO-17-23 West Coast Ports
analysis. In an alternative sample any port/commodity/country observation that had zero vessel value at any point during our study period was excluded, and thus we ended up with a balanced panel with only non-zero values. The dependent variable in this analysis was log(y) since all observations were non-zero. This modification did not affect the main findings.
As we have noted above, the results are not meant to disentangle the cause of any changes in trade patterns during the 2014q3-2015q1 period. It is meant to establish whether there were any changes in trade patterns during this time period after accounting for linear time trends, seasonality patterns as well as port, product and country fixed effects. There could be other factors that we are not accounting for, such as economic shocks to trading partners, industry level shocks, among others, that could have impacted trade through the various regions during the disruption period.
Limitations

Appendix V: Comments from the U.S. Department of Transportation
Page 84 GAO-17-23 West Coast Ports
Appendix V: Comments from the U.S. Department of Transportation
Appendix VI: GAO Contact and Staff Acknowledgments
Page 85 GAO-17-23 West Coast Ports
Susan A. Fleming, (202) 512-2834 or [email protected]
In addition to the individual named above, Sharon Silas (Assistant Director), John Stambaugh (Analyst in Charge), Amy Abramowitz, Lilia Chaidez, Ming Chen, Leia Dickerson, Delwen Jones, Jessica Lewis, Maureen Luna-Long, SaraAnn Moessbauer, Josh Ormond, Cheryl Peterson, and Friendly Vang-Johnson made key contributions to this report.
Appendix VI: GAO Contact and Staff Acknowledgments
GAO Contact
Staff Acknowledgments

Related GAO Products
Page 86 GAO-17-23 West Coast Ports
The following are GAO products pertinent to the issues discussed in this report. Other products may be found at GAO’s Web site at www.gao.gov.
U.S. Border Communities: Ongoing DOT Efforts Could Help Address Impacts of International Freight Rail. GAO-16-274. Washington, D.C.: January 28, 2016.
Hurricane Sandy: An Investment Strategy Could Help the Federal Government Enhance National Resilience for Future Disasters. GAO-15-515. Washington, D.C.: July 30, 2015.
Surface Transportation: DOT Is Progressing toward a Performance-Based Approach, but State and Grantees Report Potential Implementation Challenges. GAO-15-217. Washington, D.C.: January 16, 2015.
Freight Transportation: Developing National Strategy Would Benefit from Added Focus on Community Congestion Impacts. GAO-14-740. Washington, D.C.; September 19, 2014.
Maritime Infrastructure: Opportunities Exist to Improve the Effectiveness of Federal Efforts to Support the Marine Transportation System. GAO-13-80. Washington, D.C.: November 13, 2012.
Intercity Passenger and Freight Rail: Better Data and Communication of Uncertainties Can Help Decision Makers Understand Benefits and Trade-offs of Program and Policies. GAO-11-290. Washington, D.C.: February 24, 2011.
Surface Freight Transportation: A Comparison of the Costs of Road, Rail, and Waterways Freight Shipments That Are Not Passed on to Consumers. GAO-11-134. Washington, D.C.: January 26, 2011.
Statewide Transportation Planning: Opportunities Existing to Transition to Performance-Based Planning and Federal Oversight. GAO-11-77. Washington, D.C.: December 15, 2010.
Freight Transportation: National Policy and Strategies Can Help Improve Freight Mobility. GAO-08-287. Washington, D.C.: January 7, 2008.
Surface Transportation: Restructured Federal Approach Needed for More Focused, Performance-Based, and Sustainable Programs. GAO-08-400. Washington, D.C.: March 6, 2008.
Related GAO Products

Related GAO Products
Page 87 GAO-17-23 West Coast Ports
Freight Transportation: Strategies Needed to Address Planning and Financing Limitations. GAO-04-165. Washington, D.C.: December 19, 2003
Marine Transportation: Federal Financing and a Framework for Infrastructure Investments. GAO-02-1033. Washington, D.C.: September 9, 2002.
(100240)

The Government Accountability Office, the audit, evaluation, and investigative arm of Congress, exists to support Congress in meeting its constitutional responsibilities and to help improve the performance and accountability of the federal government for the American people. GAO examines the use of public funds; evaluates federal programs and policies; and provides analyses, recommendations, and other assistance to help Congress make informed oversight, policy, and funding decisions. GAO’s commitment to good government is reflected in its core values of accountability, integrity, and reliability.
The fastest and easiest way to obtain copies of GAO documents at no cost is through GAO’s website (http://www.gao.gov). Each weekday afternoon, GAO posts on its website newly released reports, testimony, and correspondence. To have GAO e-mail you a list of newly posted products, go to http://www.gao.gov and select “E-mail Updates.”
The price of each GAO publication reflects GAO’s actual cost of production and distribution and depends on the number of pages in the publication and whether the publication is printed in color or black and white. Pricing and ordering information is posted on GAO’s website, http://www.gao.gov/ordering.htm.
Place orders by calling (202) 512-6000, toll free (866) 801-7077, or TDD (202) 512-2537.
Orders may be paid for using American Express, Discover Card, MasterCard, Visa, check, or money order. Call for additional information.
Connect with GAO on Facebook, Flickr, Twitter, and YouTube. Subscribe to our RSS Feeds or E-mail Updates. Listen to our Podcasts. Visit GAO on the web at www.gao.gov.
Contact:
Website: http://www.gao.gov/fraudnet/fraudnet.htm E-mail: [email protected] Automated answering system: (800) 424-5454 or (202) 512-7470
Katherine Siggerud, Managing Director, [email protected], (202) 512-4400, U.S. Government Accountability Office, 441 G Street NW, Room 7125, Washington, DC 20548
Chuck Young, Managing Director, [email protected], (202) 512-4800 U.S. Government Accountability Office, 441 G Street NW, Room 7149 Washington, DC 20548
James-Christian Blockwood, Managing Director, [email protected], (202) 512-4707 U.S. Government Accountability Office, 441 G Street NW, Room 7814, Washington, DC 20548
GAO’s Mission
Obtaining Copies of GAO Reports and Testimony Order by Phone
Connect with GAO
To Report Fraud, Waste, and Abuse in Federal Programs
Congressional Relations
Public Affairs
Strategic Planning and External Liaison
Please Print on Recycled Paper.