GAO-16-210 Accessible Version, AVIATION FORECASTING: …Risk-Management Practices in Forecasting...
66
Accessible Version AVIATION FORECASTING FAA Should Implement Additional Risk-Management Practices in Forecasting Aviation Activity Report to Congressional Committees March 2016 GAO-16-210 United States Government Accountability Office
Transcript of GAO-16-210 Accessible Version, AVIATION FORECASTING: …Risk-Management Practices in Forecasting...
Accessible Version
AVIATION FORECASTING
FAA Should Implement Additional Risk-Management Practices in Forecasting Aviation Activity
Report to Congressional Committees
March 2016
GAO-16-210
United States Government Accountability Office
United States Government Accountability Office
Highlights of GAO-16-210, a report to congressional committees
March 2016
AVIATION FORECASTING FAA Should Implement Additional Risk-Management Practices in Forecasting Aviation Activity
Why GAO Did This Study The FAA annually prepares forecasts of future aviation activity and uses these forecasts to help manage most of its $15 billion in annual spending. While forecasting is inherently uncertain, managing that uncertainty is essential to informed decisions.
GAO was asked to examine the accuracy of and FAA’s use of two annual forecasts of aviation activity. This report discusses the accuracy of FAA’s forecasts from 2004 through 2014 and strengths and limitations of FAA’s consideration of risks in developing its forecasts. This report focuses on the use of the Aerospace and TAF forecasts to inform key operational and investment decisions. GAO compared these two forecasts to actual activity from 2004 through 2014 for the Aerospace forecasts and from 2010 through 2014 for the TAF forecasts and identified factors affecting that accuracy. GAO compared FAA’s treatment of risk in developing forecasts to selected risk- management practices recommended by the Office of Management and Budget, GAO, and others.
What GAO Recommends GAO recommends that the Secretary of the Department of Transportation (DOT) require the FAA to: (1) report on uncertainty and set error response thresholds for both forecasts and (2) document FAA’s methods and assumptions for the forecasting models. The DOT partially concurs with the first recommendation and fully concurs with the second. DOT agrees to report on uncertainty but not to set thresholds. GAO believes that thresholds ensure systematic review of forecast accuracy.
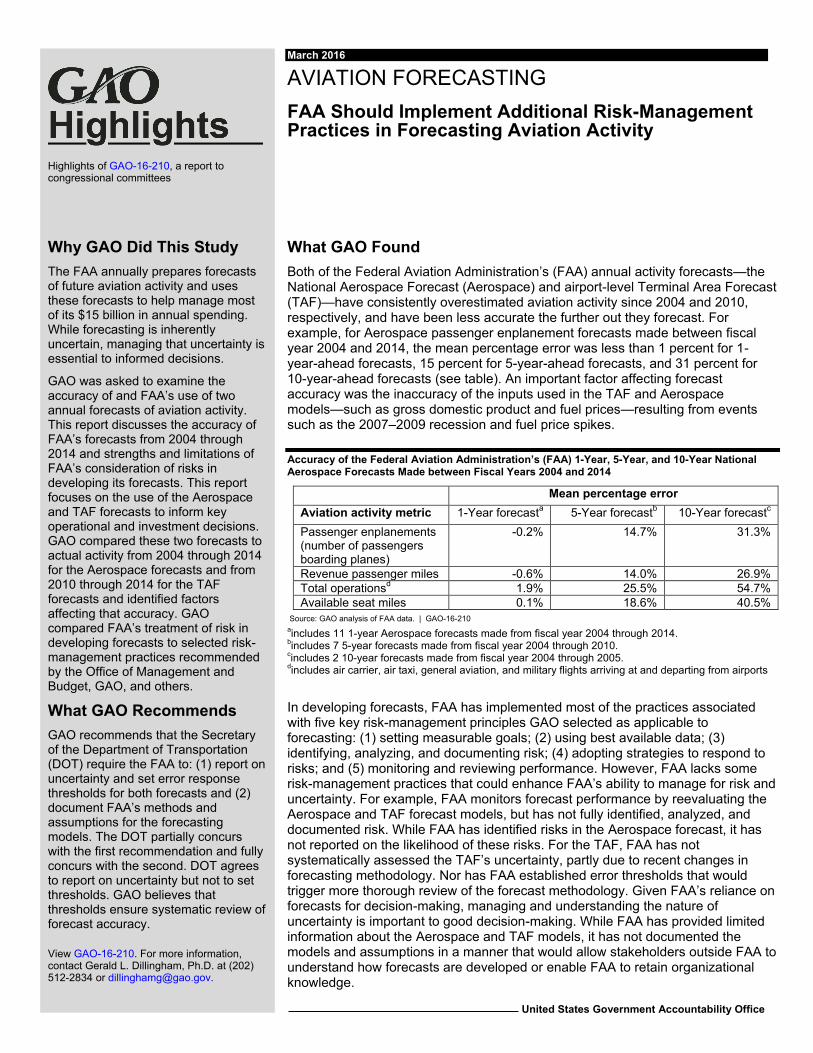
What GAO Found Both of the Federal Aviation Administration’s (FAA) annual activity forecasts—the National Aerospace Forecast (Aerospace) and airport-level Terminal Area Forecast (TAF)—have consistently overestimated aviation activity since 2004 and 2010, respectively, and have been less accurate the further out they forecast. For example, for Aerospace passenger enplanement forecasts made between fiscal year 2004 and 2014, the mean percentage error was less than 1 percent for 1-year-ahead forecasts, 15 percent for 5-year-ahead forecasts, and 31 percent for 10-year-ahead forecasts (see table). An important factor affecting forecast accuracy was the inaccuracy of the inputs used in the TAF and Aerospace models—such as gross domestic product and fuel prices—resulting from events such as the 2007–2009 recession and fuel price spikes.
Accuracy of the Federal Aviation Administration’s (FAA) 1-Year, 5-Year, and 10-Year National Aerospace Forecasts Made between Fiscal Years 2004 and 2014
Mean percentage error Aviation activity metric 1-Year forecasta 5-Year forecastb 10-Year forecastc
Passenger enplanements (number of passengers boarding planes)
-0.2% 14.7% 31.3%
Revenue passenger miles -0.6% 14.0% 26.9% Total operationsd 1.9% 25.5% 54.7% Available seat miles 0.1% 18.6% 40.5%
Source: GAO analysis of FAA data. | GAO-16-210 aincludes 11 1-year Aerospace forecasts made from fiscal year 2004 through 2014. bincludes 7 5-year forecasts made from fiscal year 2004 through 2010. cincludes 2 10-year forecasts made from fiscal year 2004 through 2005. dincludes air carrier, air taxi, general aviation, and military flights arriving at and departing from airports
In developing forecasts, FAA has implemented most of the practices associated with five key risk-management principles GAO selected as applicable to forecasting: (1) setting measurable goals; (2) using best available data; (3) identifying, analyzing, and documenting risk; (4) adopting strategies to respond to risks; and (5) monitoring and reviewing performance. However, FAA lacks some risk-management practices that could enhance FAA’s ability to manage for risk and uncertainty. For example, FAA monitors forecast performance by reevaluating the Aerospace and TAF forecast models, but has not fully identified, analyzed, and documented risk. While FAA has identified risks in the Aerospace forecast, it has not reported on the likelihood of these risks. For the TAF, FAA has not systematically assessed the TAF’s uncertainty, partly due to recent changes in forecasting methodology. Nor has FAA established error thresholds that would trigger more thorough review of the forecast methodology. Given FAA’s reliance on forecasts for decision-making, managing and understanding the nature of uncertainty is important to good decision-making. While FAA has provided limited information about the Aerospace and TAF models, it has not documented the models and assumptions in a manner that would allow stakeholders outside FAA to understand how forecasts are developed or enable FAA to retain organizational knowledge.
View GAO-16-210. For more information, contact Gerald L. Dillingham, Ph.D. at (202) 512-2834 or [email protected].
Letter 1
Page i GAO-16-210
Background 4 FAA Aviation Activity Forecasts Have Consistently Overestimated
Aviation Activity, Mostly due to Economic Factors 10 FAA Uses Activity Forecasts to Help Inform Air Traffic Controller
Staffing Needs and Make NextGen and Airport Investment Decisions 17
FAA Forecasts Follow Some Risk-Management Practices, but Could Implement Additional Practices to Better Support FAA Decision-Making 25
Conclusions 34 Recommendations 34 Agency Comments and Our Evaluation 35
Appendix I: Objectives, Scope, and Methodology 37
Appendix II: Review of FAA’s Risk-Management Practices for Forecasts 42
Appendix III: Comments from the Department of Transportation 54
Appendix IV: GAO Contact and Staff Acknowledgments 56
GAO Contact 56 Staff Acknowledgments 56
Appendix V: Accessible Data 57
Agency Comment Letter 57 Data Tables 59
Tables
Table 1: Accuracy of the Federal Aviation Administration’s (FAA) 1-Year, 5-Year, and 10-Year National Aerospace Forecasts Made between Fiscal Years 2004 and 2014, as Measured in Mean Percentage Error 11
Table 2: Accuracy of the Federal Aviation Administration’s (FAA) 1-Year, 3-Year, and 5-Year Terminal Area Forecasts Made between 2010 and 2014, as Measured in Mean Percentage Error 14
Table 3: Description of Selected NextGen Technologies and the Benefits Identified by the Federal Aviation Administration (FAA) 20
Table 4: Selected Key Risk-Management Principles 26
Contents

Table 5: Selected Aviation Stakeholders Interviewed 38 Table 6: Selected Risk-Management Principles and Practices 39 Data Table for Figure 1: Federal Aviation Administration’s (FAA)
Aerospace Forecasts, Commercial Operations (2004 to 2015) 59
Figures
Page ii GAO-16-210
Figure 1: Federal Aviation Administration’s (FAA) Aerospace Forecasts, Commercial Operations (2004 to 2015) 13
Figure 2: GAO Analysis of the Federal Aviation Administration’s (FAA) Application of Selected Risk-Management Principles and Practices in the Development of National Aerospace Forecasts and Terminal Area Forecasts 28
Figure 3: Principle 1—Set Measurable Goals 42 Figure 4: Principle 2—Use the Best Available Data 44 Figure 5: Principle 3—Identify, Analyze, and Document Risks 46 Figure 6: Example of a Technique Used to Rate Risks from Low to High
in terms of Likelihood and Impact 47 Figure 7: Principle 4—Adopt Response Strategies 50 Figure 8: Principle 5—Monitor and Review Performance Variances 52

Page iii GAO-16-210
Abbreviations
AATF Airport and Airway Trust Fund ACIP Airports Capital Improvement Program ACRP Airport Cooperative Research Program ADS-B Automatic Dependent Surveillance-Broadcast AIP Airport Improvement Program APO Office of Aviation Policy and Plans ATO Air Traffic Organization BCA benefits cost analysis DOT Department of Transportation FAA Federal Aviation Administration GDP gross domestic product JRC Joint Resources Council LOI Letter of Intent NATCA National Air Traffic Controllers Association NextGen Next Generation Air Transportation System NPIAS National Plan of Integrated Airport Systems OMB Office of Management and Budget TAF Terminal Area Forecast TAF-M Terminal Area Forecast Modernization TBFM Time Based Flow Management TRACON Terminal Radar Approach Control TRB Transportation Research Board
This is a work of the U.S. government and is not subject to copyright protection in the United States. The published product may be reproduced and distributed in its entirety without further permission from GAO. However, because this work may contain copyrighted images or other material, permission from the copyright holder may be necessary if you wish to reproduce this material separately.

Page 1 GAO-16-210 Aviation Forecasting
441 G St. N.W. Washington, DC 20548
March 8, 2016
The Honorable Bill Shuster Chairman The Honorable Peter A. DeFazio Ranking Member Committee on Transportation and Infrastructure House of Representatives
The Honorable Frank A. LoBiondo Chairman The Honorable Rick Larsen Ranking Member Subcommittee on Aviation Committee on Transportation and Infrastructure House of Representatives
The Federal Aviation Administration (FAA) annually prepares forecasts of future aviation activity, including projections of the number of flights and passengers, 20 years or more into the future. FAA uses historic activity data and outside estimates of key variables, such as economic growth and fuel prices, to create the forecasts. These forecasts are used by FAA to develop major areas of FAA’s operational plans and an annual budget of more than $15 billion and by external users, such as airlines and airports, for their planning and investment. The two main forecasts that FAA publishes are the National Aerospace (Aerospace) Forecast, which forecasts aviation activity at the national level, and the Terminal Area Forecast (TAF), which forecasts aviation activity at the individual airport level. In 2012, we examined FAA’s revenue forecasting for the Airport and Airway Trust Fund (AATF). The revenues deposited in the AATF are the primary source of funding for FAA’s investments and operations. We found that based on data through 2010, FAA tended to overestimate aviation activity. This led to a decline in the uncommitted portion of the trust fund balances.1 Since 2011, the U.S. Treasury has been responsible for revenue forecasting while FAA continues to develop activity forecasts.
1GAO, Airport and Airway Trust Fund: Factors Affecting Revenue Forecast Accuracy and Realizing Future FAA Expenditures, GAO-12-222 (Washington, D.C.: Jan. 23, 2012). AATF revenue comes largely from taxes on airline tickets and aviation fuel.
Letter
FAA is expected to face many budgetary and investment challenges in the coming years, in particular implementation of FAA’s modernization of the air traffic control system, called the Next Generation Air Transportation System (NextGen), on which FAA spends approximately $1 billion annually, and operation of its air traffic control function which accounts for nearly half of FAA’s annual budget of more than $15 billion. Improving FAA forecasts and managing the risks of their uncertainty will be essential for FAA to make informed decisions to meet these challenges and for Congress as it considers FAA authorization legislation, which expires in March 2016.
Page 2 GAO-16-210 Aviation Forecasting
2 While we and others have issued reports and studies addressing some aspects of FAA’s forecasts, these studies have not looked specifically at the integration of FAA’s forecasts into FAA resource and planning processes.3
Because of its importance to and use in decision-making, you asked us to examine the accuracy and FAA’s use of two aviation activity forecasts. This report discusses:
· the accuracy of the Aerospace and TAF forecasts from 2004 through 2014 and the key factors affecting the accuracy of these forecasts,
· how FAA uses these two aviation activity forecasts to inform key operational and investment decisions, and
· the strengths and limitations of FAA’s consideration of risks in developing these two aviation-activity forecasts.
To assess the accuracy of past aviation activity forecasts and identify the key factors affecting forecast accuracy, we collected the results for the National Aerospace Forecasts issued from 2004 through 2014 and the TAFs issued from 2010 through 2014. We then compared these forecasts to FAA data on actual aviation activity during the same time period covered by each forecast. We assessed the accuracy of the forecasts by calculating the mean percentage error, a common measure of forecast accuracy.4 We selected forecasts that encompassed different time periods
2Pub. L. No. 114-55, 129 Stat. 522 (2015). 3GAO-12-222. 4The methodology for compiling the TAF forecast changed in 2013. The new forecast is referred to as TAF-M. We were only able to assess the accuracy of the TAF-M for 2014 because data for actual aviation activity for 2015 was not available during the time of our review.

because the forecast results for these periods were readily available. We also interviewed FAA officials to learn about the development of aviation activity forecasts. We assessed the reliability of these forecasting data by reviewing documentation of the data FAA uses, prior GAO reliability assessments of FAA’s data, and interviewing FAA officials to determine any changes in data systems or processes that would negatively affect reliability. We found that the data were sufficiently reliable for the purposes of meeting the report’s objectives. To identify those factors that may affect forecast accuracy, we reviewed studies on FAA’s forecasting, and interviewed FAA officials and a judgmentally-selected set of stakeholders and experts from the fields of aviation forecasting, forecasting in general, and the aviation industry. To describe how FAA officials use aviation activity forecasts to inform key operations and investment decisions, we judgmentally selected for our review three FAA programs that use the two FAA forecasts as inputs into their decision-making: air-traffic controller staffing, NextGen investment and placement, and airport investment decisions. These three program areas comprise over two thirds, or about $11 billion, of FAA’s annual budget of more than $15 billion. We then reviewed FAA documents and interviewed FAA officials to learn how the Aerospace and TAF forecasts contributed to decisions in these three areas. To identify the strengths and limitations of FAA’s consideration of risks in its development of these two aviation activity forecasts, we first reviewed the Office of Management and Budget’s (OMB), FAA’s, GAO’s, and the Airport Cooperative Research Program’s (ACRP) documents and reports to select key risk-management principles that were relevant to the development of these two forecasts.
Page 3 GAO-16-210 Aviation Forecasting
5 We then reviewed FAA forecast documents and interviewed FAA officials to assess the strengths and limitations of the FAA’s Office of Aviation Policy and Plans’ consideration of risk when developing these two forecasts, based on these selected risk-management principles. See appendix I for a more detailed description of our research methods.
We conducted this performance audit from October 2014 through March 2016 in accordance with generally accepted government auditing
5Office of Management and Budget, Circular, A-123: Management’s Responsibility for Internal Control, (Washington, D.C.: Dec. 21, 2004); Federal Aviation Administration, Guide to Conducting Business Case Risk Assessments (Washington, D.C.: Oct. 2014); GAO, Standards for Internal Control in the Federal Government,” GAO-14-704G, (Washington, D.C.: Sept. 2014); Transportation Research Board, Airport Cooperative Research Program, Report 76: Addressing Uncertainty about Future Airport Activity Levels in Airport Decision Making (Washington, D.C.: 2012).

standards. Those standards require that we plan and perform the audit to obtain sufficient, appropriate evidence to provide a reasonable basis for our findings and conclusions based on our audit objectives. We believe that the evidence obtained provides a reasonable basis for our findings and conclusions based on our audit objectives.
FAA’s Forecast and Performance Analysis Division, Office of Aviation Policy and Plans develops and publishes aviation demand and activity forecasts annually, with the two main forecasts being the Aerospace Forecast and the TAF. The Aerospace Forecast projects aviation demand and activity 20 years into the future and includes individual yearly forecasts for various measures, such as:
· passenger enplanements (the number of people boarding planes); · operations (the number of flight arrivals and departures from an
airport); · available seat miles (the number of seats per plane multiplied by the
number of miles flown); · revenue passenger miles (the number of revenue paying passengers
per plane multiplied by the number of miles flown); · load factors (the percentage of aircraft passenger capacity that is
filled); and · commercial fleets (the number and type of aircraft).
The Aerospace forecast projects passenger enplanements on U.S. airlines for both domestic and international markets. The 2015 Aerospace Forecast covers all 516 FAA and contract tower airports, 163 Terminal Radar Approach Control (TRACON) facilities, and 24 En Route facilities.
Page 4 GAO-16-210 Aviation Forecasting
6 The Aerospace forecast projects aviation activity for all of these airports and facilities.7
The TAF forecasts 20 years or more into the future and provides a yearly forecast of future aviation activity for individual airports within the National
6Contract towered airports are ones for which FAA has contracted out air traffic control services. TRACON facilities are FAA air traffic control facilities that provide radar separation services to aircraft arriving, departing, or transiting the airspace controlled by the facility. En Route facilities are air traffic control facilities that provide radar separation services to aircraft at altitude. 7Passenger enplanements are the number of people that board airplanes
Background

Plan of Integrated Airport Systems (NPIAS) which comprises all commercial service airports, all reliever airports, and selected general aviation airports in the United States.
Page 5 GAO-16-210 Aviation Forecasting
8 Unlike the Aerospace Forecast, the TAF forecasts project demand and activity at each airport and facility, as well as subsets of these airports and facilities, grouped by hub size.9 Compared to the Aerospace Forecast, the TAF includes fewer measures—only passenger enplanements (for U.S. airports only) operations, and based aircraft are forecasted.10 The sum of aviation activity for the individual forecasts in the TAF does not equal the aviation activity projected in the Aerospace Forecast due to differences in the timeframes used for each forecast, the exclusion of enplanements at international airports from the TAF, and other factors.
According to FAA documents and interviews with FAA officials, FAA uses various methods to produce the Aerospace Forecast for nationwide commercial and general aviation demand and activity levels in the short, medium, and long-term timeframes. To develop the short-term (one year out) forecast, FAA uses published airline schedules to estimate the seat capacity that airlines are planning to commit to various routes. This information, along with forecasts of economic variables—such as gross domestic product (GDP) from IHS Global Insight—and other key assumptions, enables FAA to generate forecasts for key aviation-activity
8The NPIAS is a plan for developing public use airports in the United States. 49 U.S.C. § 47103. “Commercial service” airports are publicly owned airports that receive scheduled passenger service and have at least 2,500 passenger boardings each calendar year. 49 U.S.C. § 47102(7). Reliever Airports are airports designated by the FAA to relieve congestion at Commercial service airports and to provide more general aviation access to the overall community. 49 U.S.C. § 47102(23). These may be publicly or privately-owned. General Aviation Airports, which comprise approximately 76 percent of the NPIAS, are public-use airports that do not have scheduled service or have less than 2,500 annual passenger boardings. 49 U.S.C. § 47102. 9“Large hub” airports are those airports that enplane 1 percent or more of all U.S. enplanements. “Medium hubs” enplane between .25 and .99 percent of all U.S. enplanements. “Small hubs” enplane at least .05 percent but less than .25 percent of all U.S. enplanements. “Non hubs” enplane more than 10,000 passengers but less than .05 percent of all U.S. enplanements. 49 U.S.C. § 47102(14). “Primary nonhub” airports enplane more than 10,000 passengers but less than .05 percent of all U.S. enplanements, while” non-primary nonhub” airports enplane at least 2,500 and no more than 10,000 passengers. 49 U.S.C. § 47102(16). 10“Based aircraft” are aircraft that permanently based at an airport.
National Aerospace Forecast Methodology

measures such as enplanements and revenue passenger miles.
Page 6 GAO-16-210 Aviation Forecasting
11 For its medium to long-term (up to 20 years) forecasts FAA uses a demand-based econometric model. Use of this model means that FAA uses mathematical equations based on historical data and certain assumptions to forecast future aviation demand and activity.12 This forecast is unconstrained in the sense that it assumes that the projected demand will not be impeded due to any insufficiencies in airport capacity.
According to FAA documents and officials whom we interviewed, FAA begins working on the Aerospace Forecast in October of the year before it is published and releases it about 5 months later. For the 2015 forecast, FAA began the process in October 2014. Between October and December the preliminary forecast is developed. In January, the preliminary forecast is provided to the program offices for review and comment. The forecast is finalized in February and publicly released in March. FAA released the 2015 Aerospace Forecast on March 16, 2015 to cover the period 2015 through 2035.13
According to FAA documents and interviews with FAA officials, the TAF is a forecast for future aviation demand at individual airports based upon local and national economic conditions as well as conditions within the aviation industry. The TAF is calculated using several types of forecasted and historical data, such as:
· aviation activity (such as enplanements, operations, and the number of aircraft based at an airport);
· U.S. socioeconomic indicators (such as income, population, and employment);
· the cost of flying (such as the price paid by customers per mile flown and fares); and
11IHS Global Insight is a private company that provides forecasting data and other services to clients in industry, finance, and government. 12Econometric models estimate mathematical relationships between factors such as passenger demand (enplanements) and airfare and national income (e.g., GDP) using historical data. Such relationships can then be used to forecast future values for one factor, such as demand, given forecasted values for the other factors. 13FAA, FAA Aerospace Forecast: Fiscal Year 2015-2035, (Washington, D.C.: March 2015).
Terminal Area Forecast Methodology

· operational metrics (such as seats per aircraft, load factors, and the number of aircraft that are typically based at an airport).
FAA uses a unique mathematical formula to develop the TAF for each individual airport. Prior to 2013, the TAF forecast was grouped into four categories: the Core 30, which are the 30 busiest airports based primarily on passenger activity and that account for approximately 70 percent of all passengers; Second Tier, which are the next tier of airports based on activity levels; other FAA and Contract towers; and non-FAA facilities.
Page 7 GAO-16-210 Aviation Forecasting
14
According to FAA officials whom we interviewed, in 2013, FAA introduced a new model called the Terminal Area Forecast Modernization (TAF-M) for forecasting activity at the largest airports. While the original TAF is still used to forecast aviation activity at most airports, FAA initially used the TAF-M in 2013 and again in 2014 to forecast aviation activity for 141 of the largest airports. In 2015, FAA expanded TAF-M coverage to project activity at those airports with more than 100,000 enplanements in 2014. This included a total of 223 airports. Unlike the TAF calculation that uses a separate model with different coefficients to develop a forecast for each individual airport, the TAF-M applies a single model across all of the selected airports that yields estimates for each airport. Using this approach, called a network approach, is more dynamic in considering changes in inputs or assumptions, according to FAA officials that we interviewed.
As with the Aerospace forecast, the TAF is unconstrained, meaning that the forecast does not take into account an airport’s ability to meet demand. However, if the airport historically functions under constrained conditions—as is the case for LaGuardia airport in New York City and Washington Reagan airport in the Washington, D.C. area where capacity is capped—the TAF may reflect those constraints since it is partially based on historical data.15
14Core airports are those with 1 percent or more of total enplanements or airports with 0.75 percent or more of total non-military itinerant operations. 15Capacity-controlled airports are discussed at GAO, Slot Controlled Airports: FAA’s Rules Could Be Improved to Enhance Competition and Use of Available Capacity, GAO-12-902, (Washington, D.C., Sept. 13, 2012). Airports may be constrained in different ways, including those inherent to the airport, such as gate or runway limitations, and those imposed by regulation through schedule limits. 14 C.F.R. Part 93.

According to FAA documents and officials whom we interviewed, the preparation of the TAF is a year-long process that starts in January of the year in which it is published; for example, the 2014 TAF process started in January 2014 and ended in December 2014. FAA sends out the preliminary TAF for the TAF-M airports and other FAA facilities to the nine FAA Regional offices for review and comment. The TAF is then adjusted, updated, and finalized before it is publicly released in December. Data in the TAF are presented on a federal government fiscal year basis.
FAA uses Aerospace and TAF forecast results throughout the organization, but in particular in three key functional areas:
· The Air Traffic Organization (ATO) uses TAF-forecasted operations in conjunction with other information to help assess future air traffic controller staffing needs. The operational costs of air traffic control, with approximately 14,000 air traffic controllers as of September 2014, comprises nearly half of FAA’s annual budget—approximately $7 billion annually.
· FAA’s program offices use forecast results as an input in business case analyses for proposed infrastructure and equipment investments, such as for NextGen, and as part of the regulatory rulemaking process.
Page 8 GAO-16-210 Aviation Forecasting
16 Business case analyses are used to estimate the benefits and costs associated with these NextGen investments, such as the development of ADS-B or Data Comm.17 FAA spends approximately $1 billion annually on NextGen acquisitions.
· The Office of Airports uses forecast results as one of several criteria to help evaluate discretionary grants for capacity projects under the Airport Improvement Program (AIP), which is the primary federal funding mechanism for public use airports’ improvements. These grants are available to more than 3,300 existing and proposed airports
16While FAA uses forecasts for investment decision-making beyond NextGen, this report focuses on the use of forecasts for NextGen investments. 17ADS-B is an on-board technology that enables aircraft to continually broadcast flight data—such as position, air speed, and altitude—among other types of information, to air traffic controllers and other aircraft. Data Comm is a hardware and software-based technology designed to supplement existing voice communications between pilots and air traffic controllers.

within the United States. In fiscal year 2015, the AIP program provided about $3.4 billion in grants.
Page 9 GAO-16-210 Aviation Forecasting
18
Outside stakeholders—such as aircraft manufacturers, airports, and transportation and urban planners—also use FAA forecast data. Aircraft manufacturers use FAA’s aviation activity forecasts in conjunction with their own forecasts to determine the quantity, size, and type of aircraft to produce to meet future needs, according to an aircraft manufacturer that we interviewed. Airports use forecasts to determine the number of flights, type of aircraft, and number of passengers they will need to accommodate in future years and to decide if they need additional capacity to handle the demand, according to FAA airport office officials. Likewise, transportation and urban planners use forecasts to determine if existing transportation infrastructure at and around airports will be sufficient to meet future demand.19 These stakeholders may also produce their own forecast estimates to meet their needs, such as requiring information that is not included in FAA’s forecasts.
18Within the airport area, FAA also uses forecasts for Letter of Intent (LOI) airport grant commitments and as part of the Contract Tower decision process. We did not evaluate how forecasts are used within these programs. 19GAO, National Airspace System: Regional Airport Planning Could Help Address Congestion If Plans Were Integrated with FAA and Airport Decision Making, GAO-10-120, (Washington, D.C.: Dec. 23, 2009).
According to the forecasting studies we reviewed, the accepted way to assess the accuracy of any forecast is to compare actual activity that occurred in a given year to an earlier forecast. For example, to determine the 5-year accuracy of the 2010 Aerospace and TAF operations forecasts, we compared actual operations in 2014 with the operations forecast for 2014 that was developed in 2010. Forecast accuracy can be measured in different ways. For both the Aerospace and TAF forecasts, we chose to measure the forecasts’ accuracy by calculating the mean percentage error, which is an indication of how close the forecast was to actual values, as well as its direction, or bias, over the designated period of time.
Page 10 GAO-16-210 Aviation Forecasting
20
According to our assessment of selected aviation activity metrics, the longer-term Aerospace Forecasts are less accurate than the short-term forecast and have overestimated aviation activity since 2004. We found, as is true with most forecasts, the accuracy of the Aerospace Forecast decreases the longer into the future it projects. To measure the accuracy of the Aerospace Forecast, we calculated the mean percentage error for passenger enplanements, revenue passenger miles, total operations21, and available seats miles for forecasts made from 2004 through 2014 (see table
20The mean percentage error is the mean of the percent differences between the forecasted values and the actual values. For example, the 5-year mean percentage error for the period of 2012 through 2014 is based on forecasts prepared in 2008 through 2010. The 5-year mean percentage error for this time period would be the average of three values: 1) the percent difference of the 2012 actual value from the 2008 forecast, 2) the percent difference of the 2013 actual value from the 2009 forecast, and 3) the percent difference of the 2014 actual value from the 2010 forecast. There is no single measure for forecast accuracy for a given year because the mean percentage error varies for each metric that is forecasted, such as operations or passenger enplanements. 21Total operations refers to all air carrier, air taxi, general aviation, and military operations.
FAA Aviation Activity Forecasts Have Consistently Overestimated Aviation Activity, Mostly due to Economic Factors
FAA’s Longer-Term Aviation Forecasts Have Consistently Overestimated Activity since 2004
National Aerospace Forecast
1).
Page 11 GAO-16-210 Aviation Forecasting
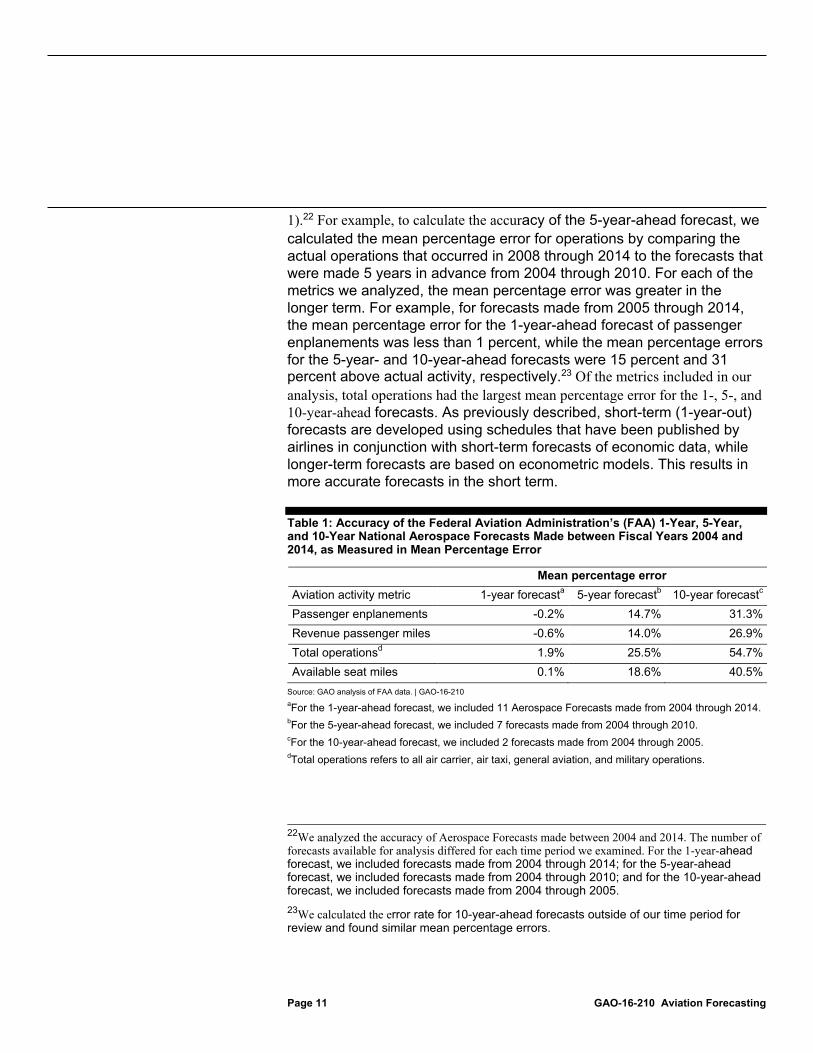
22 For example, to calculate the accuracy of the 5-year-ahead forecast, we calculated the mean percentage error for operations by comparing the actual operations that occurred in 2008 through 2014 to the forecasts that were made 5 years in advance from 2004 through 2010. For each of the metrics we analyzed, the mean percentage error was greater in the longer term. For example, for forecasts made from 2005 through 2014, the mean percentage error for the 1-year-ahead forecast of passenger enplanements was less than 1 percent, while the mean percentage errors for the 5-year- and 10-year-ahead forecasts were 15 percent and 31 percent above actual activity, respectively.23 Of the metrics included in our analysis, total operations had the largest mean percentage error for the 1-, 5-, and 10-year-ahead forecasts. As previously described, short-term (1-year-out) forecasts are developed using schedules that have been published by airlines in conjunction with short-term forecasts of economic data, while longer-term forecasts are based on econometric models. This results in more accurate forecasts in the short term.
Table 1: Accuracy of the Federal Aviation Administration’s (FAA) 1-Year, 5-Year, and 10-Year National Aerospace Forecasts Made between Fiscal Years 2004 and 2014, as Measured in Mean Percentage Error
Mean percentage error Aviation activity metric 1-year forecasta 5-year forecastb 10-year forecastc Passenger enplanements -0.2% 14.7% 31.3% Revenue passenger miles -0.6% 14.0% 26.9% Total operationsd 1.9% 25.5% 54.7% Available seat miles 0.1% 18.6% 40.5%
Source: GAO analysis of FAA data. | GAO-16-210 aFor the 1-year-ahead forecast, we included 11 Aerospace Forecasts made from 2004 through 2014. bFor the 5-year-ahead forecast, we included 7 forecasts made from 2004 through 2010. cFor the 10-year-ahead forecast, we included 2 forecasts made from 2004 through 2005. dTotal operations refers to all air carrier, air taxi, general aviation, and military operations.
22We analyzed the accuracy of Aerospace Forecasts made between 2004 and 2014. The number of forecasts available for analysis differed for each time period we examined. For the 1-year-ahead forecast, we included forecasts made from 2004 through 2014; for the 5-year-ahead forecast, we included forecasts made from 2004 through 2010; and for the 10-year-ahead forecast, we included forecasts made from 2004 through 2005. 23We calculated the error rate for 10-year-ahead forecasts outside of our time period for review and found similar mean percentage errors.

We found that the Aerospace Forecast has also consistently overestimated aviation activity for longer-range forecasts since 2004. As shown in table 1, the mean percentage error was positive for all metrics for the 5-year and 10-year forecast, indicating that the forecast was on average greater than the actual values.
According to an analysis of FAA’s Aerospace Forecasts conducted by GRA Incorporated, an aviation industry consultant,
Page 12 GAO-16-210 Aviation Forecasting
24 the Aerospace Forecasts have continued to project an increase in commercial operations while actual activity to date has generally declined or remained flat. As shown in figure 1 below, FAA’s long-term Aerospace Forecasts for commercial operations—as indicated by the upward-sloping lines for each year—made from 2004 through 2015 have projected future growth in these operations, when in fact actual operations—as indicated by the blue line—have generally declined over this time period.25 The extent to which future operations might differ from the forecasts, however, is uncertain.
24GRA, Incorporated, is a firm that provides consulting services on aviation issues for FAA and other aviation industry stakeholders. 25We will discuss factors that influence forecast accuracy later in this report.

Figure 1: Federal Aviation Administration’s (FAA) Aerospace Forecasts,
Page 13 GAO-16-210 Aviation Forecasting
Commercial Operations (2004 to 2015)
According to our assessment, the TAF is also less accurate in the long term and, aside from the 5-year-ahead forecast for passenger enplanements that only includes one data point, has also consistently overestimated aviation activity for longer term forecasts since 2010.26 As shown in table 2, we found the mean percentage error for FAA-towered airports for the two TAF metrics that we included in our analysis—passenger enplanements and operations—increases over the long term. For example, for forecasts made for the time period from 2010 through 2014, the mean percentage error for operations was 2.2 percent for the 1-
26We analyzed a shorter time frame for the TAF than the Aerospace Forecasts because data were not available for 2005–2009. We included large, medium, small, and non-hub airports and excluded FAA contract towers in our analysis.
Terminal Area Forecast
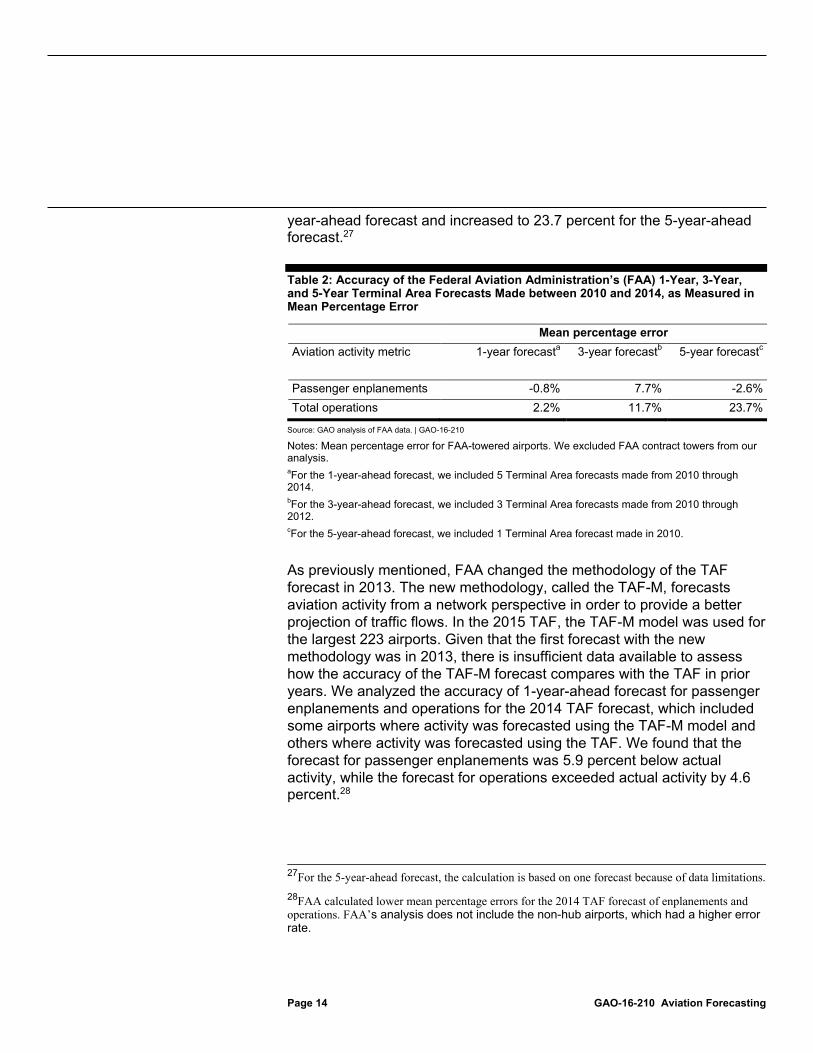
year-ahead forecast and increased to 23.7 percent for the 5-year-ahead forecast.
Page 14 GAO-16-210 Aviation Forecasting
27
Table 2: Accuracy of the Federal Aviation Administration’s (FAA) 1-Year, 3-Year, and 5-Year Terminal Area Forecasts Made between 2010 and 2014, as Measured in Mean Percentage Error
Mean percentage error Aviation activity metric 1-year forecasta 3-year forecastb
5-year forecastc
Passenger enplanements -0.8% 7.7% -2.6% Total operations 2.2% 11.7% 23.7%
Source: GAO analysis of FAA data. | GAO-16-210
Notes: Mean percentage error for FAA-towered airports. We excluded FAA contract towers from our analysis. aFor the 1-year-ahead forecast, we included 5 Terminal Area forecasts made from 2010 through 2014. bFor the 3-year-ahead forecast, we included 3 Terminal Area forecasts made from 2010 through 2012. cFor the 5-year-ahead forecast, we included 1 Terminal Area forecast made in 2010.
As previously mentioned, FAA changed the methodology of the TAF forecast in 2013. The new methodology, called the TAF-M, forecasts aviation activity from a network perspective in order to provide a better projection of traffic flows. In the 2015 TAF, the TAF-M model was used for the largest 223 airports. Given that the first forecast with the new methodology was in 2013, there is insufficient data available to assess how the accuracy of the TAF-M forecast compares with the TAF in prior years. We analyzed the accuracy of 1-year-ahead forecast for passenger enplanements and operations for the 2014 TAF forecast, which included some airports where activity was forecasted using the TAF-M model and others where activity was forecasted using the TAF. We found that the forecast for passenger enplanements was 5.9 percent below actual activity, while the forecast for operations exceeded actual activity by 4.6 percent.28
27For the 5-year-ahead forecast, the calculation is based on one forecast because of data limitations. 28FAA calculated lower mean percentage errors for the 2014 TAF forecast of enplanements and operations. FAA’s analysis does not include the non-hub airports, which had a higher error rate.
We found that an important factor affecting the accuracy of FAA’s forecasts are inaccurate forecasts of key macroeconomic inputs included in the Aerospace and TAF models. According to FAA officials, FAA’s forecasts rely heavily on data from macroeconomic forecasts, such as GDP and fuel prices, that they currently obtain from IHS Global Insight. Growth in GDP is a major driver of the demand for aviation services, while fuel costs are one of airlines’ largest costs, and changes in these factors can lead to changes in capacity and fares which in turn may affect consumer demand. For example, GAO has reported that airlines may attempt to recoup the higher costs associated with higher fuel prices by increasing revenues, which can be either through fare increases or increases in fees.
Page 15 GAO-16-210 Aviation Forecasting
29 Fare increases may lead to fewer enplanements. However, it is very difficult to anticipate economic disruptions, such as the great recession of 2007–2009 and other geopolitical events. For example, a 2002 study of GDP forecasts for countries around the world found that very few recessions were predicted more than a year in advance. 30 And yet, such disruptions can have a substantial impact on aviation demand through their influence on GDP and fuel prices. The IHS Global Insight’s macroeconomic forecasts that FAA uses are widely used in government and the private sector and include high and low scenarios to provide ranges of potential changes in economic conditions that are inherently difficult to foresee.
In 2013, FAA performed an analysis called “backcasting” to determine the extent to which forecast error for the 2007 Aerospace Forecasts for passenger enplanements and revenue passenger miles was the result of inputs to the model as opposed to a flaw in the model itself. To perform the analysis, FAA took actual values for the macroeconomic variables for 2006 through 2013 and plugged them into the 2007 Aerospace Forecast model to see how much the accuracy of the forecasts depended on the accuracy of the macroeconomic forecasts. The FAA found that approximately 60 to 64 percent of the system-wide error in passenger enplanements and that 75 to 95 percent of the system-wide error in revenue passenger miles was due to errors in macroeconomic forecasts for inputs, such as GDP and fuel prices. FAA has not done a similar
29GAO, Aviation: Impact of Fuel Price Increases on the Aviation Industry, GAO-14-331, (Washington, D.C.: Sept. 25, 2014). 30Grace Juhn and Prakash Loungani, Further Cross-Country Evidence of the Accuracy of the Private Sector’s Output Forecasts (International Monetary Fund: 2002).
Unanticipated Economic Disruptions and Other Factors Have Influenced Forecast Accuracy

analysis for the TAF, which relies on some of the same economic inputs as the Aerospace Forecast.
According to FAA’s descriptions of its Aerospace Forecasts, some of the remaining error for the Aerospace Forecast is attributable to FAA’s forecasting practices and assumptions. For example, in the Aerospace Forecast for the last 5 years, FAA said that assumptions about maximum load factor (the percentage of seats occupied on an aircraft) led to over forecasting available seat miles and operations in recent years.
Aviation industry stakeholders and forecasting experts with whom we spoke also confirmed that that these key factors influence the accuracy of FAA’s aviation activity forecasts. They highlighted three key points about these factors. First, forecasts are typically less accurate over the long term because of the difficulty associated with projecting economic activity over longer periods. Second, economic shocks that have occurred in the last decade, such as the great recession and spikes in fuel prices, had a substantial bearing on the accuracy of the forecasts—particularly for forecasts of passenger enplanements and revenue passenger miles. As mentioned previously, these events were unpredictable, and therefore, FAA and others did not account for them when making forecasts. Third, some aviation industry experts that we talked to also noted that the accuracy of FAA’s forecasts, in particular the operations forecasts, have been influenced by decisions made by airlines regarding capacity. Specifically, both the Aerospace Forecast and TAF models have consistently underestimated load factors, which also led to overestimating operations. This means that FAA has underestimated how many passengers will be flying on each plane, which has resulted in overestimating the number of flights it would take to accommodate those passengers.
Page 16 GAO-16-210 Aviation Forecasting

Page 17 GAO-16-210 Aviation Forecasting
According to FAA documents and interviews with FAA officials, the TAF forecasts are a key input to help FAA determine staffing needs for air traffic controllers (FAA refers to this determination as the Staffing Standard). The calculation of the Staffing Standard is the first step in FAA’s annual process to determine air controller staffing levels at the 315 FAA air traffic control facilities across the United States.31 FAA’s objective is to align staffing levels to expected activity levels to ensure safe and efficient air navigation services. According to FAA documents and interviews with FAA officials, the first step in determining the Staffing Standard is to determine how many controllers are needed at each facility based on historical operations and industrial engineering models.32 FAA then combines the results of this needs analysis with forecasted operations from the TAF to estimate activity levels up to 3 years into the future, because it can take up to 3 years for a newly hired controller to be fully trained. Finally, FAA makes adjustments based on controller work schedules and unique features, such as the use of multiple towers at a facility, to arrive at the Staffing Standard. Once the Staffing Standard is determined for each facility, FAA considers other factors, such as the number of controllers on board and expected attrition, to determine how many controllers need to
31FAA’s air traffic control facilities include FAA operated control towers, TRACON facilities, and en route centers. 32We did not evaluate the validity of FAA’s controller staffing model. The National Air Traffic Controllers Association (NATCA) has raised concerns about FAA’s controller staffing model. FAA and NATCA formed a working group that is currently examining the methods used to determine controller staffing levels. In addition, TRB published a study in 2014 that assessed the methods FAA uses to determine air traffic controller staffing levels, see TRB, Special Report 314: The Federal Aviation Administration’s Approach for Determining Future Air Traffic Controller Staffing Needs (Washington, D.C.: 2014).
FAA Uses Activity Forecasts to Help Inform Air Traffic Controller Staffing Needs and Make NextGen and Airport Investment Decisions
Forecasts Are a Key Input for Air Traffic Controller Staffing

be hired. FAA publishes staffing ranges for air traffic controllers in the annual Workforce Plan based on its determination on the number of staff needed to cover operations.
Page 18 GAO-16-210 Aviation Forecasting
33
If the level of activity does not occur at a facility, as projected by the TAF, it could result in a Staffing Standard that is too high and, if not adjusted, result in too many staff on board and inefficient operations, while if actual level of activity exceeds the Staffing Standard, staffing may be too low and, if not adjusted, a facility could be understaffed resulting in overtime or reduced capacity. Our analysis of staffing levels found that for all facilities combined, the total number of controllers on board, excluding developmental controllers,34 was within the staffing range plans published in FAA’s annual Workforce Plan for fiscal years 2008 through 2015. According to the Workforce Plan, FAA generally strives to keep the number of controllers near the middle of the range identified in the Workforce Plan. However, staffing levels at individual facilities may be more or less than the staffing ranges. When we looked at staffing levels for the Core 30 airports, we found that the number of controllers on board exceeded the range included in the 2015 Workforce Plan for 19 of the Core 30 airports, and was within the range for the other 11 airports.35 According to officials in FAA’s Office of Labor Analysis, the number of controllers on board at each facility may be more or less than the final staffing ranges published in the Workforce Plan because of factors such as projected retirements,
33We found that for the time period of 2007 through 2015, the TAF-based Staffing Standard in aggregate was within 2 percent of the levels set out in the annual Workforce Plans, suggesting that the TAF plays a large role in determining staffing levels. In addition, we found that the Staffing Standard and the Workforce Plans at the facility level were within one to six percent of final Controller Workforce Plan staff levels. 34There are three designations of controllers: Certified Professional Controllers, Certified Professional Controllers in Training, and Development Controllers. Certified Professional Controllers have completed all air traffic controller training requirements. Certified Professional Controllers in Training and Developmental Controllers are in training. Developmental Controllers have not met all requirements to be considered Certified Professional Controllers in Training. As of September 2014, the total number of controllers in these three designations was approximately 14,000. 35The Department of Transportation Inspector General recently reported that FAA’s controller staffing levels at its critical facilities are generally consistent with FAA’s Workforce Plan, but identified issues about how the plan is developed, see Department of Transportation Office of Inspector General, FAA Continues to Face Challenges in Ensuring Enough Fully Trained Controllers At Critical Facilities, AV-2016-014, (Washington, D.C.: Jan. 11, 2016).

the number of developmental staff, outstanding union agreements, or unique factors at a particular facility.
According to FAA officials whom we interviewed, FAA uses both the Aerospace Forecast and the TAF to help develop the business case analyses for NextGen investments, which are used to analyze and select investment options. In developing the business case analyses, FAA uses the Aerospace and TAF activity forecasts, among other inputs, to estimate potential benefits associated with NextGen investments. According to FAA documents and interviews with FAA officials, FAA’s Office of Investment Planning and Analysis reviews business case analyses to validate, among other things, that benefits are estimated in a consistent manner across the different NextGen investments.
According to FAA documents and interviews with FAA officials, FAA relies on these business case analyses throughout the NextGen investment analysis process which is part of FAA’s lifecycle acquisition management process. Once FAA issues an investment analysis readiness decision, the investment analysis phase–which includes an initial investment analysis and final investment analysis process—begins. During the initial investment analysis process, the investment analysis team prepares a draft business case that includes benefits that are based, in part, on forecasted operations from the TAF. The initial investment analysis concludes when the Joint Resources Council (JRC) determines the best solution and, if one is identified, issues the initial investment decision. The next step is final investment analysis, where the team prepares the final business case and FAA’s Office of Planning and Investment Analysis validates the analysis, among other activities. The process concludes when the JRC issues the Final Investment Decision, which signals that the investment is ready to move to implementation. The investment analysis process can take several years to complete, and as a result, FAA may need to change to the base year used to estimate benefits. If this change occurs, a new forecast is used to estimate benefits in the updated business-case analysis. According to FAA officials we interviewed, there are no set rules for when a forecast must be updated during this process; however, the officials may decide to use an updated forecast if it significantly changes the benefits calculation in either a positive or negative way.
Page 19 GAO-16-210 Aviation Forecasting
FAA Uses Aviation Forecasts to Help Assess NextGen Investments

The type of benefits estimated by FAA varies by investment. We examined three NextGen investments in more detail—Time Based Flow Management (TBFM), Data Communications (Data Comm), and Automatic Dependent Surveillance-Broadcast (ADS-B)—to identify how FAA uses forecasts to estimate benefits (see table 3 for description of the technologies and estimated benefits).
Page 20 GAO-16-210 Aviation Forecasting
36 We judgmentally selected these three investment areas based on discussions with FAA officials and their use of forecasts to estimate benefits.
Table 3: Description of Selected NextGen Technologies and the Benefits Identified by the Federal Aviation Administration (FAA)
NextGen technology Purpose Benefits estimates Time Based Flow Management (TBFM)
TBFM is a hardware and software based technology that is designed to optimize the flow of aircraft as they arrive in or depart from congested airspace and airports, particularly in situations when demand approaches or exceeds available capacity. For arrivals approaching a congested airport, TBFM determines how flights can be sequenced and scheduled to maximize the runway and airport capacity and minimize delay. For departures, TBFM schedules departure times that blend the flights into the traffic flow to maximize the capacity of available airspace.
Benefits identified for TBFM include reduced flight delay, reduced flight time, reduced fuel burn, and increased safety. Benefits from reduced delay are measured in cost savings from decreased airline operating costs resulting from reduced delays and fuel savings, as well as cost savings from reduced emissions and the value to passengers of reduced delay. These benefits are all based on models of future activity levels tied to the TAF and Aerospace Forecasts.
36We have reported on these technologies in prior reports, see GAO, Next Generation Air Transportation System: FAA Faces Implementation Challenges, GAO-12-1011T, (Washington, D.C.: Sept. 12, 2012) and GAO, Next Generation Air Transportation System: FAA Has Made Some Progress in Implementation, but Delays Threaten to Impact Costs and Benefits, GAO-12-141T, (Washington, D.C.: Oct. 5, 2011),

Page 21 GAO-16-210 Aviation Forecasting
NextGen technology Purpose Benefits estimates Data Communications (Data Comm)
Data Comm is a hardware and software based technology designed to supplement existing voice communications between pilots and air traffic controllers. For example, pre-scripted text messages would replace routine voice communications between air traffic controllers and pilots. Data Comm would also enable ground systems to communicate directly with aircraft flight-management systems. This communication is to also enable complex route instructions and procedures to be quickly loaded upon acceptance by the pilot, resulting in a more direct exchange of information.
Benefits identified for Data Comm include improved efficiency, safety, and system capacity resulting from improved traffic flow and reduced air traffic control communications workload based on forecast activity levels. Specifically, Data Comm benefits include reduced ground delay due to increased controller efficiency, greater airspace throughput and reduced delay due to En Route controller efficiency, and increased safety due to fewer communications errors. To estimate benefits derived from improvements in traffic efficiency, FAA used the TAF to project operations levels. For example, for the first phase, FAA used the 2010 TAF forecast to project operations in 2017, 2022, and 2025
Automatic Dependent Surveillance-Broadcast (ADS-B)
ADS-B is an on board technology that enables aircraft to continually broadcast flight data—such as position, air speed, and altitude—among other types of information, to air traffic controllers and other aircraft.
FAA identified safety and efficiency as the two key benefits from implementing ADS-B. Safety benefits are measured in avoided accidents and estimated based on the reduction in accidents and potential savings from avoided loss of life, injuries, and aircraft damages. Efficiency benefits are measured in flight hours saved from reduced delays and fuel savings. The value of these benefits was quantified in terms of the cost of operating aircraft and the passenger value of time. To estimate benefits, FAA used historical traffic density data to create the safety and efficiency baselines and then projected air traffic based on the TAF. For the 2012 Final Investment Decision, FAA updated the baseline analyses from its 2007 Final Investment Decision to account for changes in traffic projections, equipage projections, and new economic values.
Source: GAO analysis of FAA documents. | GAO-16-210
Over or under forecasting future aviation activity may affect the accuracy of the benefits estimates for individual NextGen investments. If not adjusted for, it could lead to misallocation or mispriortization of FAA investment resources. If a forecast of activity is too high, then the benefits may be overstated and FAA could make an investment before it is needed, displacing another investment opportunity. To compensate for these risks, FAA’s Office of Investment Planning and Analysis follows its own guidance37 to risk-adjust all benefits calculations to help ensure uniformity
37FAA, Office of Investment Analysis and Planning, Guide to Conducting Business Case Risk Assessments, (October 2014).
in benefits analysis and to derive more conservative estimates of traffic growth than is generated by the TAF.
Similar to NextGen investment decisions, FAA’s officials from the Office of Airports also rely on benefits cost analyses (BCA) to inform their investment decisions for AIP discretionary grant awards for airport capacity projects. AIP discretionary grants are awarded to public-use airports that are included in the NPIAS on the basis of pre-established award criteria.
Page 22 GAO-16-210 Aviation Forecasting
38 The Airports Capital Improvement Program (ACIP) is FAA’s primary planning tool for identifying and prioritizing airport development and associated airport grant requests and serves as the basis for the distribution of AIP discretionary grants. FAA scores discretionary grant requests under its ACIP formula. For example, when considering runways projects, the highest priority is safety related improvements, followed by general rehabilitation projects and then capacity related construction.39 FAA requires that all discretionary grant requests for capacity projects over $10 million include a BCA prepared by the airport.40 FAA also requires that BCAs be conducted for all Letter of Intent (LOI) commitments,41 which are large-scale multiyear capacity projects at primary and reliever airports.42 The benefits in both cases are estimated using factors such as forecasts of future activity and, according to FAA officials, generally need to exceed the total cost of the project to be approved.
The benefits estimates in airport grant BCAs are used by FAA and airport sponsors to determine if a proposed project’s benefits justify its costs. From 2009 through 2014, we identified 40 airport projects for which a
38AIP grants are primarily distributed on the basis of apportionment formulas for use on eligible projects. 49 U.S.C. § 47114 and 49 USC 47103. In fiscal year 2014, approximately $1.7 billion was awarded on the basis of apportionment formulas. Remaining AIP funds are distributed to a discretionary fund. 39At least 75 percent of the amount in the discretionary fund and distributed by the Secretary in a fiscal year is to be used for making grants to preserve and enhance capacity, safety, and security at primary and reliever airports; and to carry out airport noise compatibility planning and programs at primary and reliever airports. 49 U.S.C. § 47115(c). 40FAA Order 5100.38D, Airport Improvement Program Handbook (Sept. 30, 2014). 41A Letter of Intent, issued by the Secretary, states an intention to obligate funds for an AIP project from future budget authority. 49 U.S.C. § 47110(e). 42FAA Order 5100.38D, Airport Improvement Program Handbook (Sept. 30, 2014).
FAA Uses Forecasts to Prioritize Airport Grant Decisions

BCA was conducted that received AIP grants. These BCAs covered about $1.3 billion in discretionary AIP grant dollars awarded over this time period. In addition, between 2009 and 2014, FAA committed approximately $1.05 billion for capacity projects funded under LOIs. Project sponsors are required to follow FAA’s Airport Benefit-Cost Analysis Guidance in preparing their BCA.
Page 23 GAO-16-210 Aviation Forecasting
43 This guidance requires that an airport quantify the costs and benefits of the in its entirety before the first grant is issued Once the projects have been adequately justified and approved, further use of the BCA is not necessary to issue subsequent grants. In estimating benefits, airports must identify the types, amounts, and values of benefits the project can be expected to yield. Benefits include reduced delay, use of more efficient aircraft, safer and more secure air travel, and reduced environmental impacts.44 One type of benefit may be the value of time passengers could save as the result of the project. Fewer flights may be diverted under the proposed project compared to current conditions. For example, in 2012, Huntsville International Airport prepared a BCA in conjunction with a $10-million grant application for a runway extension that would enable the airport to accommodate larger jets on a regular basis. The BCA included benefits to operators, such as lower fuel costs, resulting from operators’ being able to use larger and more efficient aircraft, thus reducing the number of flights.45 Airports may use FAA’s TAF operations and enplanements forecasts to calculate these benefits, but FAA encourages them to use their own forecasts and uses the TAF for comparison purposes, as long as the forecasts are FAA-approved.
According to FAA officials whom we interviewed, FAA reviews the BCAs submitted by airports, as part of the grant-making process, to determine if it conforms to FAA guidance and if the project is likely to generate at least as much benefit as the project’s costs. Because the process for awarding AIP grants can take several years and the BCA may have been completed a year or more before grant funds are awarded, FAA checks
43FAA, Airport Benefit Cost Analysis Guidance, (Washington, D.C.: Dec. 15, 1999). 44Costs typically include planning, construction, and operation and maintenance. 45In this example, the TAF was used in the benefits calculation to project operations through 2036.

the forecast used in the BCA as part of the review process.
Page 24 GAO-16-210 Aviation Forecasting
46 If significant changes have been made to the forecast, FAA may ask the airport sponsor to submit an updated BCA. According to FAA airport officials, BCAs typically require discussion between FAA and the airport sponsor and often result in changes to the original BCA.
Using reliable forecasts in conjunction with an assessment of uncertainty may help make better grant decisions because over or under forecasting actual aviation activity can lead to sub-optimal timing of airport investments or a misallocation of FAA resources. Overly optimistic forecasts may lead to overinvestments in airport capacity, and in such cases, scarce AIP funds might be better invested elsewhere. Alternatively, forecasts that fail to anticipate growth may lead to underinvestment in airport capacity that can lead to delays. FAA officials whom we interviewed said that once they have started funding an airport project, they will likely continue even if actual activity does not meet forecasted activity. The officials said that once FAA begins funding a project it is important that federal funding continues until work is completed so that users can still benefit from the investment in the near-term. One notable example is the newest runway that was built at Lambert-St. Louis International Airport. Between fiscal years 1999 and 2010, FAA awarded the airport more than $200 million in AIP grant funds for the construction of a new runway based on forecasted growth in operations. As a result of a decrease in aviation activity following 9/11 and the merger of one of the major airlines that used it as a hub, operations declined significantly. In spite of decreased activity and revised forecasts, the decision was made to continue construction of the new runway on the basis of supporting national capacity. The new runway opened in 2006, resulting in excess capacity at the airport at that time. The FAA officials we interviewed acknowledged that one risk of making decisions based, in part, on forecasts is that the projected activity might not come to fruition in the same way or timeframe that FAA anticipated.
In addition to being used to develop BCAs, FAA also uses the TAF to review airports’ master plans. An airport master plan is a comprehensive study that describes the short-, medium-, and long-term development goals for an airport based on projected aviation activity. Any project that
46The process for awarding AIP grants includes other steps, such as planning and environmental review. FAA also reviews current and forecasted aviation activity during these steps, which occur prior to the submission of the BCA.
receives an AIP grant must be on the FAA-approved Airport Layout Plan, which is typically, but not always, derived from the airport master plan. FAA has oversight responsibility to review and approve aviation forecasts developed in conjunction with airport master plans, and as part of this process, FAA compares individual airport forecasts to the TAF to determine if they are appropriate to use as a baseline for the BCA. Airport forecasts are considered to be consistent with the TAF and therefore approved as part of the master plan if the 5-year-ahead airport forecast differs by less than 10 percent from the TAF and the 10-year-ahead forecast differs by less than 15 percent from the TAF. If the airport’s forecasts do not meet these requirements, then FAA needs to review the airport’s justification for the discrepancy before approving the forecast or working with the airport to reconcile the forecasts.
According to GAO’s Standards for Internal Control, management of risk and uncertainty is a critical component of management control. While implementing risk-management practices will not necessarily improve forecast accuracy, these practices can help FAA better manage for risk and uncertainty. Doing so will aid the aviation-planning process by allowing aviation planners and decision-makers to consider a broad range of risks, help anticipate possible changes, and incorporate relevant mitigation measures into the planning process. To identify leading risk- management practices in aviation forecasting, we relied on OMB and GAO guidance documents that described practices for managing risk and uncertainty, as well as FAA guidance documents for managing risk and uncertainty within the aviation environment, and on a 2012 report by the Airport Cooperative Research Program (ACRP)
Page 25 GAO-16-210 Aviation Forecasting
47 for selected practices that endorsed a systemic approach to managing uncertainty including within the aviation forecasting environment.48 We also drew risk-management principles and practices from other reports addressing risk management, as well
47ACRP is managed by the Transportation Research Board (TRB) of the National Academies of Sciences, Engineering, and Medicine and is sponsored by the Federal Aviation Administration (FAA). The research is conducted by contractors that are selected on the basis of competitive proposals. 48ACRP, A Framework and Methodology for Addressing Uncertainty about Future Airport Activity Levels in Airport Decision Making (Washington, D.C.: 2012). The report was the latest of a series of TRB aviation forecasting reports covering aviation forecasting and uncertainty. The ACRP carries out applied research on problems that are shared by airport operating agencies, FAA is the program’s sponsor, and the report was prepared under the auspices of the Transportation Research Board of the National Academies of Sciences.
FAA Forecasts Follow Some Risk-Management Practices, but Could Implement Additional Practices to Better Support FAA Decision-Making
as the views of selected experts.
Page 26 GAO-16-210 Aviation Forecasting
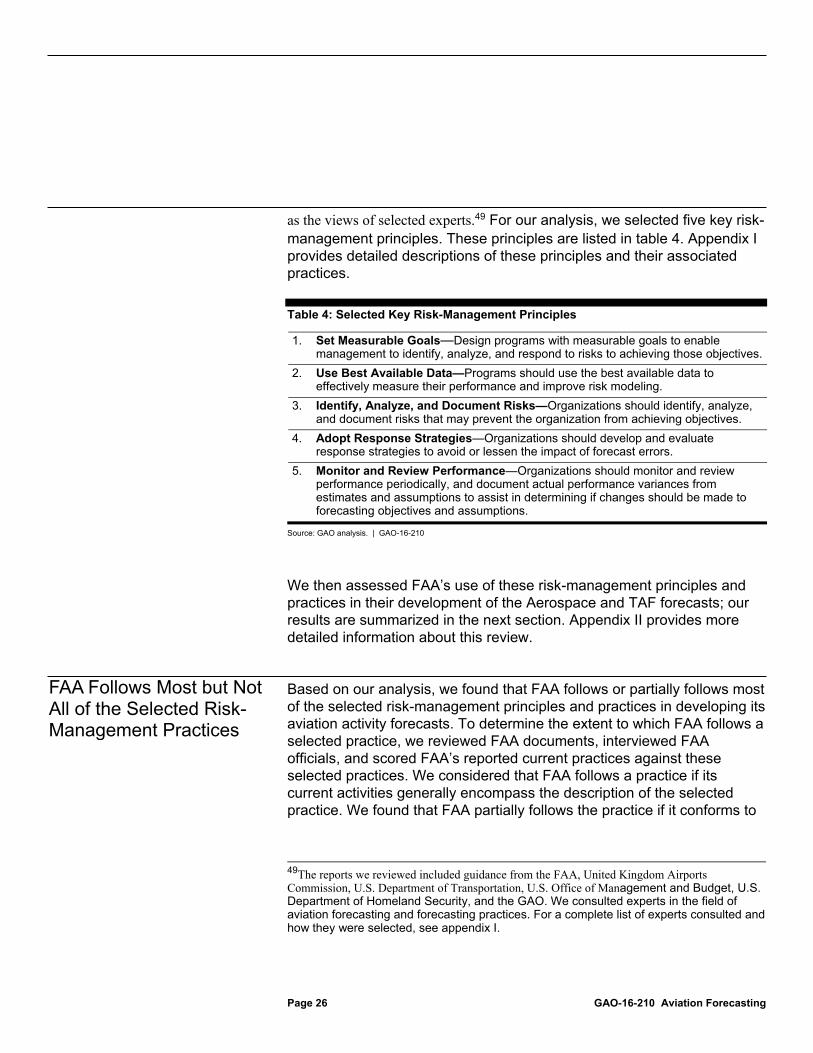
49 For our analysis, we selected five key risk-management principles. These principles are listed in table 4. Appendix I provides detailed descriptions of these principles and their associated practices.
Table 4: Selected Key Risk-Management Principles
1. Set Measurable Goals—Design programs with measurable goals to enable management to identify, analyze, and respond to risks to achieving those objectives.
2. Use Best Available Data—Programs should use the best available data to effectively measure their performance and improve risk modeling.
3. Identify, Analyze, and Document Risks—Organizations should identify, analyze, and document risks that may prevent the organization from achieving objectives.
4. Adopt Response Strategies—Organizations should develop and evaluate response strategies to avoid or lessen the impact of forecast errors.
5. Monitor and Review Performance—Organizations should monitor and review performance periodically, and document actual performance variances from estimates and assumptions to assist in determining if changes should be made to forecasting objectives and assumptions.
Source: GAO analysis. | GAO-16-210
We then assessed FAA’s use of these risk-management principles and practices in their development of the Aerospace and TAF forecasts; our results are summarized in the next section. Appendix II provides more detailed information about this review.
Based on our analysis, we found that FAA follows or partially follows most of the selected risk-management principles and practices in developing its aviation activity forecasts. To determine the extent to which FAA follows a selected practice, we reviewed FAA documents, interviewed FAA officials, and scored FAA’s reported current practices against these selected practices. We considered that FAA follows a practice if its current activities generally encompass the description of the selected practice. We found that FAA partially follows the practice if it conforms to
49The reports we reviewed included guidance from the FAA, United Kingdom Airports Commission, U.S. Department of Transportation, U.S. Office of Management and Budget, U.S. Department of Homeland Security, and the GAO. We consulted experts in the field of aviation forecasting and forecasting practices. For a complete list of experts consulted and how they were selected, see appendix I.
FAA Follows Most but Not All of the Selected Risk-Management Practices
the practice, but there may be limitations associated with the application. FAA does not follow a practice if, upon review of FAA documents and interviews with FAA officials, no evidence supports that FAA follows the practice. Figure 2 below summarizes our scoring regarding whether FAA follows, partially follows, or does not follow the practice and associated principle. The score for each principle is a summary score based on the individual scores of the associated practices.
Page 27 GAO-16-210 Aviation Forecasting
50
50GAO assigned scores to each practice on a three point scale: 2= follows the practice, 1= partially follows, and 0= does not follow. We scored risk-management principles, by summing and averaging the scores for the set of practices within each principle category. We scored the principle as: 2= “follows” the principle, If all the practices’ scores for a principle were “follows;” 1= “partially follows,” If the aggregated practices’ average score was between 0 and 2; and 0= “does not follow” if all the practices for that principle were scored “does not follow “. For a more detailed discussion of methodology we used, see appendix I.

Figure 2: GAO Analysis of the Federal Aviation Administration’s (FAA) Application
Page 28 GAO-16-210 Aviation Forecasting
of Selected Risk-Management Principles and Practices in the Development of National Aerospace Forecasts and Terminal Area Forecasts
As figure 2 shows, FAA currently follows or partially follows most of the selected risk-management practices and follows more risk-management practices for its Aerospace Forecast than it does for its TAF forecasts. However, as previously discussed, FAA program offices tend to use the TAF more extensively for decision-making in the areas of air traffic controller staffing, NextGen investments, and awarding airport grants
because the TAF provides greater detail about aviation activity at an airport facility level.
Based on our analysis, we found that FAA partially follows all principles for the Aerospace forecast by employing several risk-management practices in the development of the Aerospace Forecast. For example, FAA partially follows the principle of setting measurable goals by setting an accuracy goal for enplanement forecasts. FAA partially follows the principle of monitoring and reviewing performance variances by assigning personnel to monitor and document the 1- to 5-year-ahead forecast accuracy of key metrics. FAA also partially follows the principle of using best available data by using a comprehensive and integrated set of assumptions and estimates for the economic data used in its forecasts. FAA partially follows the principle of identifying, analyzing, and documenting risks by identifying key risks, such as GDP and fuel price variations, that have a major impact on aviation activity and thus the accuracy of the forecast. FAA also partially follows the principle of adopting response strategies by establishing a mechanism through a series of meetings to inform internal stakeholders of its preliminary forecasts and obtain their reviews.
We also found that FAA’s risk-management approach to the Aerospace Forecast also has limitations, among them are the following.
· Principle 1: Set Measurable Goals.
· FAA has set goals for only one of the five key forecast metrics, enplanements, where FAA has established a 1.5 percent forecast error goal for the 1-year forecast. FAA has not set goals for the other key metrics, such as operations and available seat miles, or for longer-range forecasts. FAA’s forecasting officials told us that the goal is limited to enplanements because it is most easily understood by external stakeholders and developing more accuracy goals could be confusing. Additionally, enplanements forecasts drive the forecasts of other variables, for example an increase in passenger enplanements would typically increase airport operations if airline load factors remain constant. By setting a goal for accuracy enplanements and working to reduce that forecast error, the forecast error for other variables can be reduced.
· FAA has not established forecast error thresholds which would prompt response strategies, such as additional reviews that are triggered if the forecast error thresholds are exceeded. As
Page 29 GAO-16-210 Aviation Forecasting
Risk-Management Strengths and Limitations of the Aerospace Forecast

discussed previously, from 2005 to 2014, operations have been over forecasted by more than 25 percent for 5-year-ahead forecasts. If a forecast threshold had been set, this step may have triggered additional review of the source of the error. FAA officials indicated that they do periodically review the forecast model but are considering establishing more regular error threshold reviews. Furthermore, FAA officials stated that they are planning to incorporate diagnostic tables into their forecasting process and that this addition would help them set accuracy goals and threshold values. However, timeframes for developing these diagnostic tables are uncertain because of budget limitations, according to FAA officials.
· Principle 2: Use Best Available Data.
· FAA has not fully reassessed key assumptions. For example, FAA consistently noted, in its annual review of Aerospace Forecast accuracy, that available seat miles exhibit larger forecast errors than Revenue Passenger Miles or enplanements. This observation is important because available seat mile forecast errors typically result in larger errors in forecasted operations, and, as previously noted, operations are used by the Air Traffic Control and NextGen organizations in their staffing or investment decisions. FAA officials stated that they were in the process of reassessing the available seat mile issue and had undertaken developing a fleet forecast that would help address the issue, but had not yet completed the process.
· Principle 3: Identify, Analyze, and Document Risks.
· While FAA has identified several risks to the forecast and provided corresponding high and low ranges based on optimistic and pessimistic assumptions, its characterization of risks is limited as it has not provided the likelihood of these assumptions occurring or documented them to better inform decision-makers. FAA officials questioned the need to document risks more formally, given that they informally and qualitatively assess risks. However, without documentation of risks, decision-makers may not be fully informed.
· FAA could more thoroughly document the forecast in a manner that allows for independent outside review and enables continuity of operations should key personnel involved in generating the
Page 30 GAO-16-210 Aviation Forecasting
forecast leave the agency. For example, FAA has not published supporting documentation, such as the Aerospace Forecast equations, as stated in DOT guidance.
Page 31 GAO-16-210 Aviation Forecasting
51 FAA does, however, provide slide presentations on the Aerospace Forecast model and forecast to internal users and aviation industry stakeholders. The presentations include an overview of the methodology, and FAA officials have stated they are working toward greater documentation of the forecast, but resource constraints have limited doing more. Both internal and external users of the forecasts have expressed skepticism of FAA forecasts. For example, ATO and NextGen program managers stated that they made adjustments to FAA’s forecasts for their use, resulting in the use of forecasts for resource planning that may not be consistent across FAA. Internal and external stakeholders stated that transparency and understanding would be helpful in their planning processes.
FAA employs several risk-management practices in the development of the TAF. FAA partially follows the principle of identifying, analyzing, and documenting risks by identifying the sources of airport activity risks, such as closing of hubs, and the industry trend toward the use of larger regional jets, a trend that may negatively impact the number of airport operations. Also, FAA identifies risks by sending preliminary forecasts to internal stakeholders, such as the Air Traffic Organization and the Office of Airports, and external stakeholders, such as airports, for review. Furthermore, FAA requires its regional managers to review forecasts with large and medium hub airport sponsors that are more familiar with local airport conditions. If comments are provided, FAA officials told us that they assess them to determine if a change should be made to the forecast. Additionally, FAA has fully followed the principle of using best available data by reassessing its forecasting model, which resulted in a change in the model for the largest airports to a network approach that is more dynamic in considering changes in inputs or assumptions.
We found that FAA’s risk-management approach for the TAF also has several limitations.
· Principle 1: Set Measurable Goals.
51U.S Department of Transportation, DOT Report for Implementing OMB’s Information Dissemination Quality Guidelines (Washington, D.C.: 2002).
Risk-Management Strengths and Limitations of the TAF

· FAA has not set forecast accuracy goals or error threshold values for any of the airport forecasts included in the TAF even though they do track the passenger enplanements and operations forecast error rates at the 30 largest airports. Without setting such goals and thresholds, especially for longer term forecasts, FAA risks not reviewing and reacting to important changes in individual or aggregate airport activity and thus may not provide a full accounting of the extent and nature of uncertainty in the TAF. FAA officials indicated that no forecast accuracy goals have been set because, with the recent introduction of the TAF-M, there is very little TAF-M based historical data to establish forecast accuracy goals, error thresholds, or conduct data analyses supported by sources we used to identify principles and practices. FAA had a goal to publish high and low scenarios for the TAF forecasts for Core 30 airports by February 2, 2015, but has not yet done so.
Page 32 GAO-16-210 Aviation Forecasting
52
· Principle 3: Identify, Analyze, and Document Risks.
· FAA stated it has not published an analysis of the uncertainty associated with its forecasts, such as a range of low to high forecasts, thus limiting the information that may help inform aviation planners in their decisions about how to allocate scarce resources. FAA officials indicated that doing so presented implementation challenges because of constraints in terms of staff and computing resources. They also said that there may be challenges associated with current policy guidelines, such as the requirement for airport forecasts to be within 10 percent of the 5-year-ahead TAF and 15 percent of the 10-year-ahead TAF. However, FAA officials said that they are considering adding uncertainty analyses for the TAF, such as providing high and low ranges for economic conditions, as more data from the new forecast methodology are collected, and they are discussing the implications of such changes with internal users of the forecast. FAA officials provided a prioritized list of TAF development projects, which included developing scenarios and other risk-management practices. However, no documentation of plans—in terms of timeline, milestones, or resources required—was provided. Furthermore, GAO notes that data for greater data
52According to ACRP, scenario analysis is conducted by developing potential outcomes to assess the impact of different sets of events. For example, FAA uses a number of potential different economic outlooks or growth rates to assess the impact on their aviation forecasts.

analysis and setting forecast error thresholds (Principle 1) have already been assembled, as FAA has provided historical forecast error data on airports that constitute the majority of airport enplanements.
Page 33 GAO-16-210 Aviation Forecasting
53
· While FAA has provided slide presentations at conferences and an overview of its new methodology (TAF-M) and is in the process of further documentation, it has not yet fully documented or published its new methodology in a manner that allows for independent review and retaining the knowledge base should key personnel involved in generating the forecast no longer be available. FAA officials noted that they have made progress in internally documenting the TAF, by (1) specifying computer code, (2) starting to develop preliminary technical documentation for the TAF-M data set should key personnel leave, and (3) adding staff. However documentation is challenging because staff are continually revising the model and the TAF is still a mix of the new and old methodologies, with the TAF-M applied to the larger airports. Department of Transportation’s (DOT) guidelines state that methods used for estimation and projection should be documented and clearly posted with the resulting data.54 DOT policies favor sufficient transparency about methods to allow independent reanalysis by qualified members of the public. Independent peer review, according to these guidelines, helps ensure objectivity. Industry stakeholders have previously expressed an interest in accessing the new TAF-M model, but limited documentation of the models makes replication of FAA’s results by outside parties difficult. Additionally, better documentation would enhance FAA’s ability to retain organizational knowledge. As we noted previously, both internal and external users of the forecasts have expressed skepticism of FAA forecasts, with FAA internal offices making adjustments to APO’s forecasts for their use, resulting in the use of forecasts for resource planning that may not be consistent across FAA. Internal
53During the course of the engagement, FAA provided mean percentage errors and historical standard deviations of forecast errors for the Core 30 airports. These are the nation’s largest airports and constitute a majority of TAF forecast enplanements. 54U.S Department of Transportation, DOT Report for Implementing OMB’s Information Dissemination Quality Guidelines, (Washington, D.C., 2002).
stakeholders told us that greater transparency and understanding would be helpful in their planning processes.
Forecasting aviation activity is by its very nature uncertain. Some of this uncertainty derives from the fact that aviation activity is closely dependent on the broader economy, and some is due to the specific characteristics and circumstances of the airline industry. That uncertainty increases over time as exemplified by the increased mean percentage error for FAA’s longer term TAF and Aerospace Forecasts that we assessed. Adhering to risk-management principles in developing forecasts can help users of the forecasts in FAA and outside the agency better understand the source and nature of that uncertainty. Given FAA’s reliance on aviation forecasts for decision-making in several key areas of the agency’s $15-billion budget, users of this information would benefit from a better understanding of the nature of the forecasts’ uncertainty. In developing the TAF and Aerospace Forecasts, FAA fully or partially follows most of the selected risk-management principles and more than half of the practices we assessed. However, FAA’s development of the TAF did not adhere to the principle of setting measurable goals, and its development of the TAF and Aerospace Forecasts did not follow several key risk-management principles, a gap that may limit FAA’s ability to manage forecast uncertainty. For example, in developing these two forecasts, FAA does not set error thresholds that would trigger a response that would notify users of the data or investigate why the forecasts exceeded the thresholds. Nor does FAA assess the uncertainty associated with its TAF forecasts. Similarly, FAA forecasts have not been adequately documented to ensure the continuity of forecasting within FAA or allow researchers outside FAA to examine how forecasts are developed or could be improved.
To help FAA better manage and understand the uncertainties of its forecasts, we recommend that the Secretary of Transportation direct the FAA to take the following actions:
· FAA should apply risk-management practices to analyze and report on uncertainty:
· for both the Aerospace and TAF forecasts, analyze and report the forecast’s uncertainty, establish forecast error thresholds, and develop an approach that will prompt forecast review when error thresholds are exceeded, and
Page 34 GAO-16-210 Aviation Forecasting
Conclusions
Recommendations

· for TAF forecasts, monitor and publish multi-year historical error performance, as FAA does for the Aerospace Forecast.
· FAA should fully document its methods and assumptions in developing the Aerospace and TAF forecasting models to provide greater transparency to internal users and external stakeholders.
We provided a draft of this product to DOT for comment. In its written comments reproduced in appendix III, DOT partially concurred with our first recommendation and fully concurred with the second recommendation. With regard to the first recommendation to apply risk-management practices to analyze and report on uncertainty, we recognize that FAA has taken some steps to analyze and report on uncertainty of both forecasts. Currently, FAA reports on uncertainty for the Aerospace forecast but not the TAF. DOT agrees to undertake this for the TAF as well. However, DOT did not agree to develop error thresholds or response strategies that FAA would undertake if the thresholds were exceeded. DOT argues that it already evaluates the forecasts annually and in so doing is already responding when needed. However, we found in our review that FAA undertakes these reviews on an ad hoc basis. We think that establishing a more formal and systematic approach for analyzing and reporting on uncertainty will enhance the transparency of the forecast for both stakeholders and forecast users. A systemic approach includes establishing error thresholds and identifying responses, such as further review of the forecast, that will be taken if error thresholds are exceeded,.
In addition, in its letter, DOT raised concerns about technical challenges that would need to be addressed before publicly releasing forecast ranges for the TAF and our use of the mean percentage error to judge accuracy in the 10-year-ahead Aerospace forecast, partially due to the fact that it is based on a limited number of forecasts. We recognize that there may be technical challenges and additional guidance may be needed to publicly releasing forecast ranges for the TAF. However, we think that it is important for FAA to publicly release forecast ranges for the TAF to inform decision-makers about the uncertainty related to the forecast. For the issue related to the use of the mean error to judge the accuracy in the 10-year-ahead Aerospace forecast, we also calculated the mean percentage error for 10-year-ahead forecasts outside of the period of review and found that the mean percentage error was similar for those forecasts. We added language to reflect this in the report. DOT also provided technical comments that we incorporated, as appropriate.
Page 35 GAO-16-210 Aviation Forecasting
Agency Comments and Our Evaluation

As agreed with your offices, unless you publicly announce the contents of this report earlier, we plan no further distribution until 8 days from the report date. At that time, we will send copies to the Secretary of the Department of Transportation and other interested parties. In addition, the report is available at no charge on the GAO website at http://www.gao.gov.
If you or your staff have any questions about this report, please contact me at (202) 512-2834 or [email protected]. Contact points for our Offices of Congressional Relations and Public Affairs may be found on the last page of this report. GAO staff making key contributions to this report are listed in appendix IV.
Gerald L. Dillingham, Ph.D. Director, Physical Infrastructure Issues
Page 36 GAO-16-210 Aviation Forecasting

Appendix I: Objectives, Scope, and Methodology
Our objectives were to examine: (1) the accuracy of the Federal Aviation Administration’s (FAA) aviation activity forecasts and the key factors affecting forecast accuracy, (2) how FAA uses its aviation activity forecasts to inform key operational and investment decisions, and (3) the strengths and limitations of FAA’s consideration of risks in its aviation activity forecasts.
To assess the accuracy of past National Aerospace Forecast (Aerospace) and Terminal Area (TAF) forecasts and identify the key factors affecting forecast accuracy, we analyzed FAA aviation forecast data, reviewed studies on FAA forecasting, interviewed FAA officials, conducted semi-structured interviews with selected stakeholders in the fields of aviation forecasting, forecasting in general, and the aviation industry. Table 5 lists the stakeholder organizations or individuals interviewed. The results of these interviews with knowledgeable stakeholders are not generalizable. We assessed the reliability of these forecasting data by reviewing documentation of the data FAA uses, prior GAO reliability assessments of FAA’s data, and interviewing FAA officials to determine any changes in data systems or processes that would negatively affect reliability. We found that the data were sufficiently reliable for the purposes of meeting the report’s objectives. To analyze FAA forecast performance accuracy, we reviewed FAA’s Aerospace Forecasts issued from fiscal year 2004 through fiscal year 2014 versus actual enplanements and operations. We analyzed the accuracy based on criteria cited in aviation forecasting research, as well as general forecasting research studies, such as average percent errors (mean percentage errors).
Page 37 GAO-16-210 Aviation Forecasting
1 We measured the accuracy of 1, 5, and 10 year-ahead forecasts to the extent data were available. For the TAF forecasts, we analyzed forecasts issued from fiscal year 2010 through 2014, as FAA officials told us that for forecasts prior to 2009, data was categorized differently for the TAF forecasts, and comparisons would be difficult. Additionally, forecasts issued in FY 2013 are not directly comparable with earlier years, as FAA began applying the TAF-M forecasting methodology to 141 of the largest airports.
1The methodology for compiling the TAF forecast changed in 2013. The new forecast is referred to as TAF-M. We were only able to assess the accuracy of the TAF-M for 2014.
Appendix I: Objectives, Scope, and Methodology
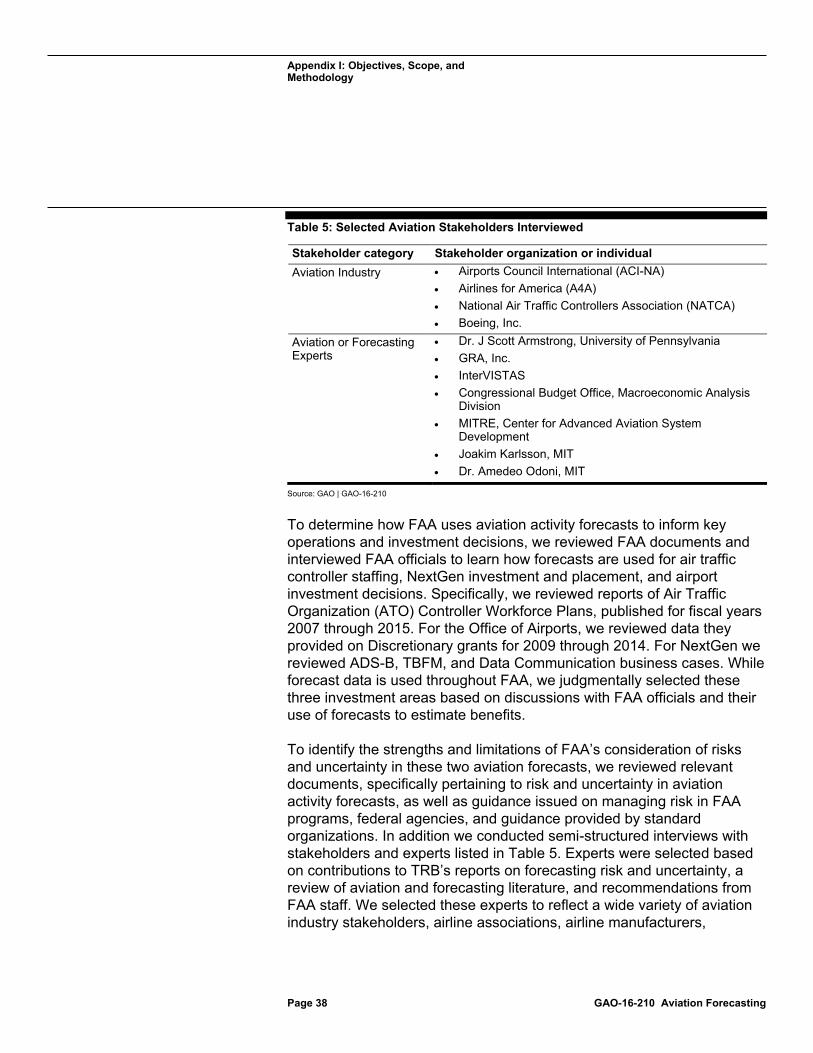
Appendix I: Objectives, Scope, and Methodology
Table 5: Selected Aviation Stakeholders Interviewed
Page 38 GAO-16-210 Aviation Forecasting
Stakeholder category Stakeholder organization or individual Aviation Industry · Airports Council International (ACI-NA)
· Airlines for America (A4A) · National Air Traffic Controllers Association (NATCA) · Boeing, Inc.
Aviation or Forecasting Experts
· Dr. J Scott Armstrong, University of Pennsylvania · GRA, Inc. · InterVISTAS · Congressional Budget Office, Macroeconomic Analysis
Division · MITRE, Center for Advanced Aviation System
Development · Joakim Karlsson, MIT · Dr. Amedeo Odoni, MIT
Source: GAO | GAO-16-210
To determine how FAA uses aviation activity forecasts to inform key operations and investment decisions, we reviewed FAA documents and interviewed FAA officials to learn how forecasts are used for air traffic controller staffing, NextGen investment and placement, and airport investment decisions. Specifically, we reviewed reports of Air Traffic Organization (ATO) Controller Workforce Plans, published for fiscal years 2007 through 2015. For the Office of Airports, we reviewed data they provided on Discretionary grants for 2009 through 2014. For NextGen we reviewed ADS-B, TBFM, and Data Communication business cases. While forecast data is used throughout FAA, we judgmentally selected these three investment areas based on discussions with FAA officials and their use of forecasts to estimate benefits.
To identify the strengths and limitations of FAA’s consideration of risks and uncertainty in these two aviation forecasts, we reviewed relevant documents, specifically pertaining to risk and uncertainty in aviation activity forecasts, as well as guidance issued on managing risk in FAA programs, federal agencies, and guidance provided by standard organizations. In addition we conducted semi-structured interviews with stakeholders and experts listed in Table 5. Experts were selected based on contributions to TRB’s reports on forecasting risk and uncertainty, a review of aviation and forecasting literature, and recommendations from FAA staff. We selected these experts to reflect a wide variety of aviation industry stakeholders, airline associations, airline manufacturers,

Appendix I: Objectives, Scope, and Methodology
academics, and experts that had published or presented at industry conferences in the field of aviation and forecasting.
Based on our review of this risk-management literature and the interviews conducted, we selected five risk-management principles and accompanying practices, listed in Table 6, as most relevant to our review of the development of these two forecasts.
Table 6: Selected Risk-Management Principles and Practices
Page 39 GAO-16-210 Aviation Forecasting
Principle 1: Set Measurable Goals—Design programs with measurable goals to enable management to identify, analyze, and respond to risks to achieving those objectives. Practices · Set forecast accuracy goals. A common forecast accuracy goal is to set the forecast
within a specific percent error of actuals. · Set forecast error thresholds, or risk tolerances for the defined objectives. Risk
tolerance is the acceptable, measurable level of variation in performance relative to the achievement of objectives.
Principle 2: Use Best Available Data—Programs should use the best available data to effectively measure their performance and improve risk modeling. Practices · Use reliable data. · Reassess key assumptions to forecasts to reflect any changed conditions. Principle 3: Identify, Analyze, and Document Risks—Organizations should identify, analyze, and document risks that may prevent the organization from achieving objectives. Practices · Characterize the sources and nature of uncertainty, such as prices of volatile inputs,
and express them in terms of likelihood and impact. These can be measured in simple ways—such as high, medium, or low likelihood and impact—or in more statistical terms.
· Analyze and report uncertainty effects using data analysis techniques,a such as high/low estimates or ranges, sensitivity and scenario analyses probability analysis prediction intervals ,and Monte Carlo simulation.
· Use a combination of data-based approaches, such as the techniques above, and judgment-based approaches, such as Delphi-based methods, to identify and attempt to quantify risks and uncertainties.
· Document models where possible to facilitate independent review. Documentation also provides a means to retain organizational knowledge and mitigate the risk of having that knowledge limited to a few personnel

Appendix I: Objectives, Scope, and Methodology
Page 40 GAO-16-210 Aviation Forecasting
Principle 4: Adopt Response Strategies—Organizations should develop and evaluate response strategies to avoid or lessen the impact of forecast errors. Practices · Incorporate flexibility and develop and evaluate response strategies so risks are
within defined risk tolerances of the defined objective system. · Develop a “risk register,” based on identified and analyzed risks—which lists risks,
likelihood, and impact—and identifies a response strategy to manage or mitigate the risk. Risk registers help identify and track risks, provide a brief description of the risk, and the probability of occurrence and description of and magnitude of impact.
· Develop a mechanism that can be used to inform agency officials and decision makers of potential risks, and evaluate alternative countermeasures to reduce risk being considered.
Principle 5: Monitor and Review Performance Variances—Organizations should monitor and review performance periodically, and document actual performance variances from estimates and assumptions to assist in determining if changes should be made to objectives and assumptions. Practices · Conduct annual reviews and consider whether risk factors have changed in
likelihood or magnitude or whether there are additional risk factors, and if there is a need to revisit traffic scenarios or re-evaluate possible traffic outcomes.
· Track threshold values such as forecast error thresholds and risks over time and flag potential issues, taking action as prescribed in the risk response strategies if potential risks do materialize.
· Assign comparisons of data as a regular duty of personnel. Periodic assessments should be integrated as part of management’s continuous monitoring of internal control, monitoring that should be ingrained in the agency’s operations.
Source: GAO analysis. | GAO-16-210 aFor a more detailed description of these techniques and how they might be applied in aviation forecasting, see ACRP, 2012.
We reviewed FAA documents and interviewed FAA officials to assess the strengths and limitations of the FAA’s Office of Aviation Policy and Plans’ (APO) treatment of risk when developing forecasts, against the selected risk-management principles and practices we identified earlier. Two GAO analysts independently reviewed FAA documents, risk-management principles and practices, and interviews with FAA officials to determine the extent FAA follows these practices. FAA was deemed as generally following a practice if it closely matched the description of the recommended practice. It was deemed partially following the practice if it basically conformed to the practice, but was deficient in a material way, such as identifying risks, and characterizing them in terms of impact, but not likelihood. FAA was evaluated as not following a practice if, upon review of FAA documents and interviews with FAA officials, no evidence supported FAA’s following the practice. Differences in the individual analysts’ determination, if any, were then discussed with and reconciled by a senior member of the engagement team.

Appendix I: Objectives, Scope, and Methodology
We conducted this performance audit from October 2014 through March 2016 in accordance with generally accepted government auditing standards. Those standards require that we plan and perform the audit to obtain sufficient, appropriate evidence to provide a reasonable basis for our findings and conclusions based on our audit objectives. We believe that the evidence obtained provides a reasonable basis for our findings and conclusions based on our audit objectives.
Page 41 GAO-16-210 Aviation Forecasting

Appendix II: Review of FAA’s Risk-Management Practices for Forecasts
The following sections provide more detailed information on the extent to which FAA follows the five selected risk-management principles and their supporting practices, based (1) on our review of cumulative descriptions of FAA’s efforts during the development of the TAF and Aerospace Forecasts and (2) on FAA documents and interviews (as described in app. I).
Figure 3: Principle 1—Set Measurable Goals
Page 42 GAO-16-210 Aviation Forecasting
We found that FAA has only set one accuracy goal out of several key metrics included in the Aerospace Forecast. In its 2015 Business Plan, FAA set an Aerospace Forecast goal of a 1- year-ahead forecast error of 1.5 percent between forecasted and actual passenger enplanements, but did not set accuracy goals for other measures, such as forecast operations. FAA forecasting officials told us that the goal is limited to enplanements because it is most easily understood by external stakeholders and that the development of more accuracy goals could be confusing. Additionally, enplanements forecasts drive the forecasts of other variables. FAA officials stated that by setting an accuracy goal for enplanements and working to reduce the forecast error, the forecast error for other variables is reduced. However, other Aerospace accuracy goals for the key metrics that FAA calculates would be useful to FAA program offices that use the Aerospace Forecasts (ATO, Airports, and NextGen offices). These offices indicated that besides enplanements, they use operations forecasts in their decision-making.
We found that the TAF forecast does not have any short or long-term accuracy goals. FAA officials told us that it would be challenging to set a goal for each individual airport and that errors could be larger for some individual airports due to local conditions. For example, at an airport like
Appendix II: Review of FAA’s Risk-Management Practices for Forecasts
Set Forecast’s Accuracy Goals

Appendix II: Review of FAA’s Risk-Management Practices for Forecasts
Memphis, where Delta Air Lines decided to close its hub of operations there in 2013, FAA officials stated, there may be large differences in actual operations from that which the TAF projected. However, events that cause such large differences are relatively infrequent. For example, the mean percentage error for the TAF Core 30 airports in the 3-year-ahead forecasts for the forecasts generated in the 2009–2012 TAFs, was 4.7 percent for enplanements and 8.1 percent for operations. Excluding Memphis resulted in a mean percentage error of 1.7 percent for enplanements and 7.1 for operations. Thus, setting accuracy goals for airports based on historical data is feasible. FAA officials noted that there is large variation for any individual airport forecast, suggesting explicit forecast-accuracy goals based on historical forecast errors would be challenging because of the variation and the recent change to the TAF-M results in too little data to set forecast goals. Although forecasts can exhibit large variations from actuals, as pointed out by FAA, forecast goals and error thresholds can still point out forecast errors that go beyond standard confidence intervals. Based on data FAA provided, two airports exhibited enplanement forecast errors of approximately 16 percent, and six out of the Core 30 airports exhibited operations forecast errors of approximately 13 percent to 20 percent for 3-year-ahead forecasts, figures that were beyond 95 percent confidence intervals for forecast errors
Page 43 GAO-16-210 Aviation Forecasting
1 We also note, in terms of developing forecast goals, that although the TAF-M was introduced recently, the current TAF forecast still uses the old methodology for a majority of airports, and a majority of operations forecasted.
We found that FAA has not set forecast error thresholds or risk tolerances for either the Aerospace or TAF forecasts. While FAA measures forecast error for the Aerospace Forecast, it has not set forecast error thresholds for four of five key forecast metrics by which FAA would take additional actions, such as response strategies, if those thresholds are exceeded. For the TAF, FAA officials stated their focus is on monitoring the Core 30 airports, which account for a majority of enplanements. However, FAA does not measure forecast errors consistently or comprehensively for its
1Analysis excluded Memphis (n=29) because of non-typical situation of the closing of the Delta airlines hub.
Set Forecast Error Thresholds or Risk Tolerances

Appendix II: Review of FAA’s Risk-Management Practices for Forecasts
more than 500 other FAA-towered or contract-towered airports.
Page 44 GAO-16-210 Aviation Forecasting
2 Without measuring forecast error, it is impossible to prescribe forecast error thresholds or risk tolerances by which FAA would take additional action if the error were exceeded. Accordingly, FAA has not set risk tolerances that would trigger response strategies like those described under Principle 4, such as conducting additional reviews to identify the source of the forecast error, and if warranted taking action to inform stakeholders. FAA officials stated that 1-year forecast error thresholds may not be useful, as internal users use longer term forecasts, such as 3-year-ahead forecasts, and that as noted earlier, because of the recent change to using the TAF-M, there may not be sufficient data to develop longer term thresholds. FAA officials also stated that they are planning to introduce additional tools by the end of fiscal year 2016, such as diagnostic tables, that would alert them to the need for greater review, in a manner similar to forecast error thresholds. Although as FAA notes, there may not be sufficient long term data for the TAF-M, FAA could use historical TAF error data, in the interim.
Figure 4: Principle 2—Use the Best Available Data
2FAA officials stated that they monitor forecasts; however, they indicated that they focus on the Core 30, and the documentation they provided of previously measured TAF forecast error were files dated 2011 or earlier and did not cover all years or were missing some information, such as the percent errors. In response to our early requests for TAF forecast error measurements, FAA officials noted these were resource intensive requests that were not readily available, and subsequently provided us with historical forecasts and actuals, but not a continuous record of forecast errors.
Use Reliable Data
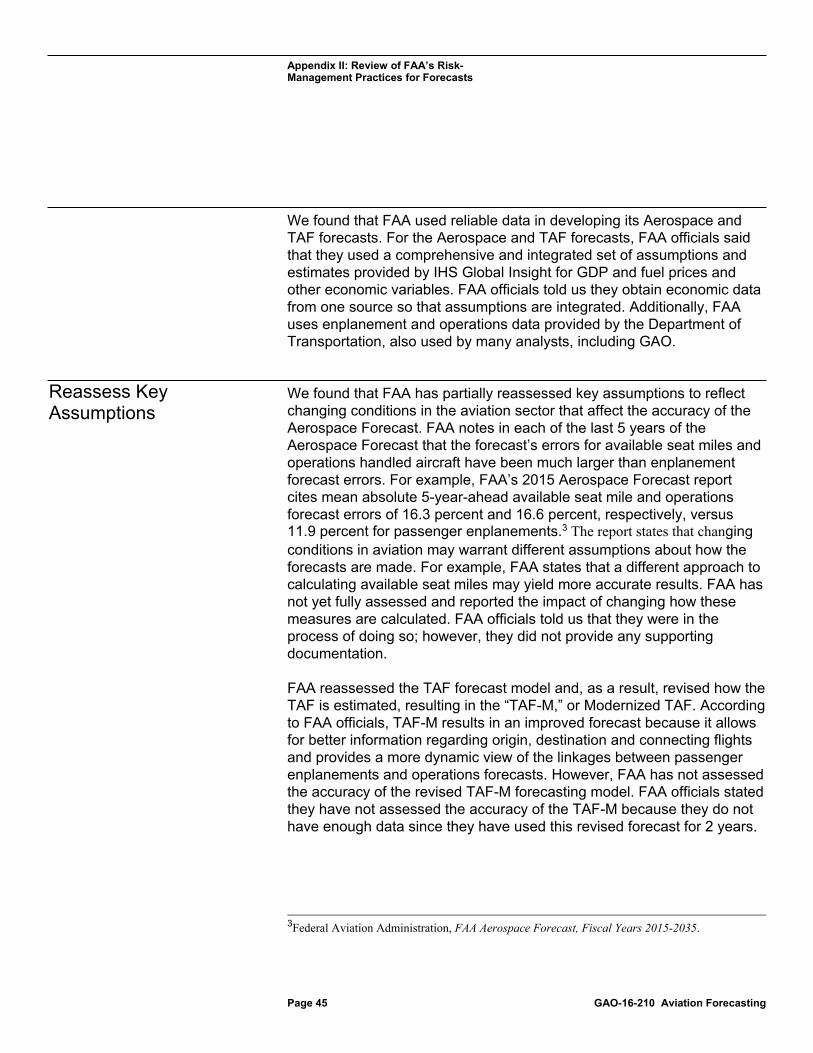
Appendix II: Review of FAA’s Risk-Management Practices for Forecasts
We found that FAA used reliable data in developing its Aerospace and TAF forecasts. For the Aerospace and TAF forecasts, FAA officials said that they used a comprehensive and integrated set of assumptions and estimates provided by IHS Global Insight for GDP and fuel prices and other economic variables. FAA officials told us they obtain economic data from one source so that assumptions are integrated. Additionally, FAA uses enplanement and operations data provided by the Department of Transportation, also used by many analysts, including GAO.
We found that FAA has partially reassessed key assumptions to reflect changing conditions in the aviation sector that affect the accuracy of the Aerospace Forecast. FAA notes in each of the last 5 years of the Aerospace Forecast that the forecast’s errors for available seat miles and operations handled aircraft have been much larger than enplanement forecast errors. For example, FAA’s 2015 Aerospace Forecast report cites mean absolute 5-year-ahead available seat mile and operations forecast errors of 16.3 percent and 16.6 percent, respectively, versus 11.9 percent for passenger enplanements.
Page 45 GAO-16-210 Aviation Forecasting
3 The report states that changing conditions in aviation may warrant different assumptions about how the forecasts are made. For example, FAA states that a different approach to calculating available seat miles may yield more accurate results. FAA has not yet fully assessed and reported the impact of changing how these measures are calculated. FAA officials told us that they were in the process of doing so; however, they did not provide any supporting documentation.
FAA reassessed the TAF forecast model and, as a result, revised how the TAF is estimated, resulting in the “TAF-M,” or Modernized TAF. According to FAA officials, TAF-M results in an improved forecast because it allows for better information regarding origin, destination and connecting flights and provides a more dynamic view of the linkages between passenger enplanements and operations forecasts. However, FAA has not assessed the accuracy of the revised TAF-M forecasting model. FAA officials stated they have not assessed the accuracy of the TAF-M because they do not have enough data since they have used this revised forecast for 2 years.
3Federal Aviation Administration, FAA Aerospace Forecast, Fiscal Years 2015-2035.
Reassess Key Assumptions
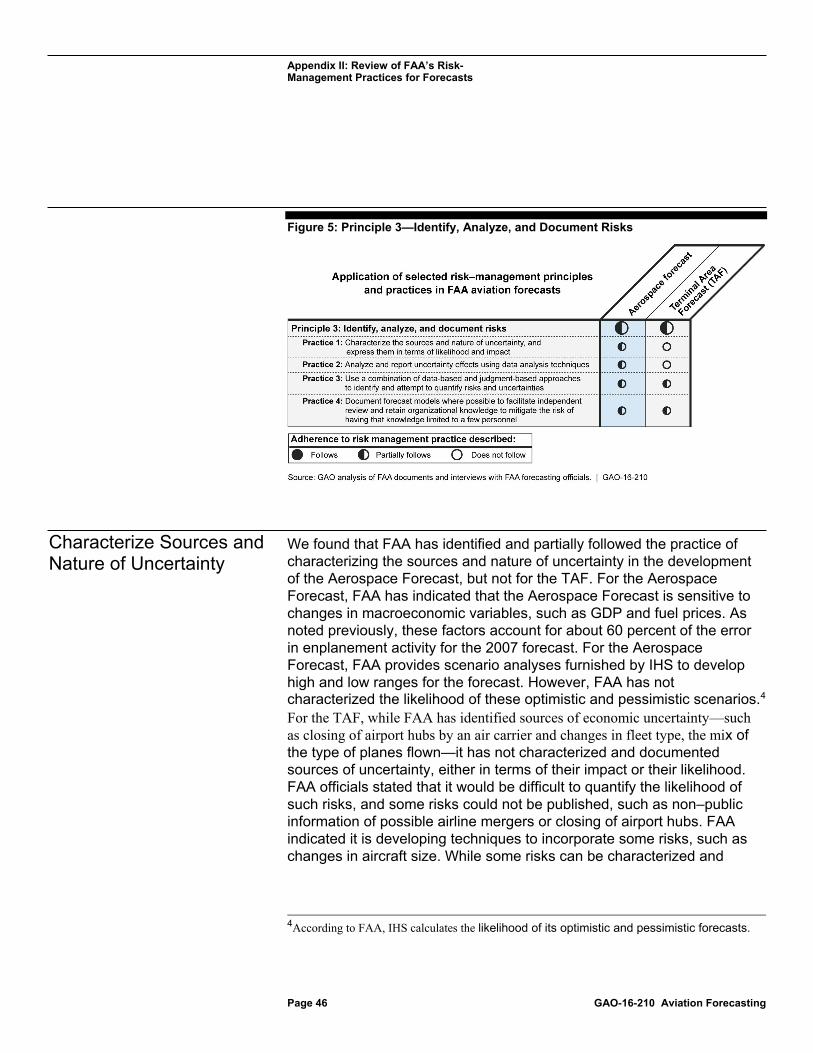
Appendix II: Review of FAA’s Risk-Management Practices for Forecasts
Figure 5: Principle 3—Identify, Analyze, and Document Risks
Page 46 GAO-16-210 Aviation Forecasting
We found that FAA has identified and partially followed the practice of characterizing the sources and nature of uncertainty in the development of the Aerospace Forecast, but not for the TAF. For the Aerospace Forecast, FAA has indicated that the Aerospace Forecast is sensitive to changes in macroeconomic variables, such as GDP and fuel prices. As noted previously, these factors account for about 60 percent of the error in enplanement activity for the 2007 forecast. For the Aerospace Forecast, FAA provides scenario analyses furnished by IHS to develop high and low ranges for the forecast. However, FAA has not characterized the likelihood of these optimistic and pessimistic scenarios.4 For the TAF, while FAA has identified sources of economic uncertainty—such as closing of airport hubs by an air carrier and changes in fleet type, the mix of the type of planes flown—it has not characterized and documented sources of uncertainty, either in terms of their impact or their likelihood. FAA officials stated that it would be difficult to quantify the likelihood of such risks, and some risks could not be published, such as non–public information of possible airline mergers or closing of airport hubs. FAA indicated it is developing techniques to incorporate some risks, such as changes in aircraft size. While some risks can be characterized and
4According to FAA, IHS calculates the likelihood of its optimistic and pessimistic forecasts.
Characterize Sources and Nature of Uncertainty

Appendix II: Review of FAA’s Risk-Management Practices for Forecasts
measured by data analysis techniques cited by TRB, risks can also be characterized using a variety of techniques. For example, FAA uses a matrix in its guide to conducting business case assessments,
Page 47 GAO-16-210 Aviation Forecasting
5 which consists of likelihood and impact axes to characterize risks, whereby high likelihood and high impact risks are plotted in the upper right quadrants, while lower likelihood, lower impact risks are plotted in lower left quadrants (fig. 6). FAA stated that use of such a matrix is impractical with over 3,300 airports. However, FAA has also indicated the majority of enplanements are concentrated in the Core 30 airports, which could be easier to assess.
Figure 6: Example of a Technique Used to Rate Risks from Low to High in terms of Likelihood and Impact
We found that FAA has partially followed the practice of analyzing and reporting on uncertainty using data analysis techniques in its Aerospace Forecast but not for the TAF. As mentioned above, for the Aerospace Forecast, FAA develops high and low ranges, based on IHS Global Insights’ optimistic and pessimistic economic forecasts. FAA reports these results in an appendix of the annual Aerospace Forecast. However, FAA has not conducted any other data analysis approaches, such as any sensitivity analyses, which would provide greater insight as to the
5FAA, Guide To Conducting Business Case Risk Assessments, FAA Office Of Investment Planning And Analysis (Washington, D.C.: 2014).
Analyze and Report Uncertainty Using Data Analysis Techniques

Appendix II: Review of FAA’s Risk-Management Practices for Forecasts
likelihood of these outcomes.
Page 48 GAO-16-210 Aviation Forecasting
6 The ACRP report notes that uncertainty analysis helps decision makers to incorporate relevant mitigation measures into the planning process and to characterize risks in terms of likelihood and impact, a process that can be effective in addressing future risk and uncertainty. For the TAF forecast, FAA stated a goal of developing and publishing scenarios in its 2015 Business Plan. FAA has made progress towards this goal. In December 2015, FAA officials reported that they had internally developed scenarios for the Core 30 airports, but have not yet decided whether or how the scenarios should be used nor has the agency published these scenarios. Furthermore, it has not analyzed risks and uncertainty using any of the other recommended data analysis techniques.7 Officials responsible for FAA’s forecasts noted that the ACRP report focused on practices for individual airport forecasts and told us that analyzing uncertainty and risk using these techniques would be challenging because they have limited staff and computing resources. However, as we noted earlier, FAA officials stated that the majority of enplanement activity occurs at a limited set of airports.
We found that FAA partially follows the recommended practice to use judgment–based approaches to quantify risks for both the Aerospace and TAF forecasts. For the Aerospace Forecast, FAA shares preliminary forecasts with internal stakeholders, such as the Office of Airport Planning and Programming and the ATO, and with external industry associations, such as Airlines for America. For the TAF, FAA provides preliminary TAF
6FAA officials noted that in the past they did conduct such analyses (Monte Carlo based) but confidence bands were too big to be useful, and so FAA changed to scenario analysis. GAO notes (a) that the authors stated the methodology was valuable and (b) that the 20-year-ahead confidence bands were large, shorter term bands, e.g., 3- and 5-year-ahead, were much smaller. 7Data analysis techniques such as these have been recommended by other aviation industry stakeholders. For example, a 2013 Airports Commission report published by the British Government cited several of these methods, including sensitivity, scenario, and probability analyses. Source: Airports Commission, Aviation Demand Forecasting, (London, United Kingdom: February 2013). Similarly, a 2007 TRB paper, authored by two current FAA officials, proposed an approach using statistical models and probabilities to develop aviation traffic estimates based on some of the standard techniques listed above and noted that this approach can add value by addressing demand uncertainties. Dipasis Bhadra and Roger Schaufele, “Probabilistic Forecasts for Aviation Traffic at FAA’s Commercial Terminals,” Transportation Research Record: Journal of the Transportation Research Board, No. 2007, Transportation Research Board of the National Academies (Washington, D.C.: 2007) 37–46.
Use a Combination of Data- and Judgment-Based Approaches to Identify and Quantify Risks

Appendix II: Review of FAA’s Risk-Management Practices for Forecasts
forecasts for review to FAA airport regional managers, who in turn review the forecasts with large, and medium airport hub sponsors, as well as with ATO and other organizations, and then incorporates their comments as appropriate. ACRP notes that one of the most well-established formal techniques for eliciting expect opinion and judgment on forecast outlooks and probabilities is the Delphi method. Based on discussions with internal and external stakeholders, these meetings were more informal and neither FAA nor external groups provided documentation on risks and uncertainties of particular annual Aerospace Forecasts discussed, as ACRP recommends when obtaining inputs on risks and uncertainties from subject matter experts. FAA officials note that these informal discussions have occasionally led to revised forecasts and in the case of this year’s TAF prompted an examination of the underlying demand forecast model and methodology.
We found that FAA partially follows the practice of documenting its forecast methodologies. For both the Aerospace and TAF forecast methodologies, FAA provides some documentation, such as providing an overview of the process and internally providing computer coded specifications to run the model, but has not fully documented and published the models themselves, such as the equations or statistical properties of the models. The Department of Transportation’s (DOT) guidance states that methods used for estimation and projection should be documented and clearly posted with the resulting data.
Page 49 GAO-16-210 Aviation Forecasting
8 At a 2011 FAA-sponsored workshop, industry stakeholders expressed an interest in having access to the new TAF-M model. Limited documentation of the models makes replication of FAA’s results by outside parties difficult. Furthermore, DOT’s guidance favors sufficient transparency about methods, such as assumptions and supporting documentation, to allow independent reanalysis by qualified members of the public. Independent peer review, according to these guidelines helps ensure objectivity. Additionally, better documentation would enhance FAA’s ability to retain organizational knowledge. FAA officials stated that they were in the process of specifying the equations for the TAF-M.
8U.S Department of Transportation, DOT Report for Implementing OMB’s Information Dissemination Quality Guidelines (Washington, D.C.: 2002).
Document Models

Appendix II: Review of FAA’s Risk-Management Practices for Forecasts
Figure 7: Principle 4—Adopt Response Strategies
Page 50 GAO-16-210 Aviation Forecasting
We found that for the Aerospace Forecast, FAA has partially followed the practice of incorporating some flexibility in its Aerospace Forecast by developing ranges based on optimistic and pessimistic views of several economic variables, such as GDP, fuel prices, and disposable income that can help inform internal and external stakeholders. For the TAF forecast, FAA allows for flexibility by revising individual airport forecasts if, for example, significant traffic shifts by a major airline occurs. While the TAF is only published annually, FAA does publish forecast adjustments on its Web page between annual publishing cycles. Additionally, FAA has recently revised the forecast methodology for the TAF-M forecast, which, according to FAA, better considers effects across a network. However, for both the Aerospace and TAF forecasts, FAA has not developed response strategies to reflect these potential risks, such as setting single or multi-year forecast error thresholds that would prompt additional actions, such as expanded reviews or advisories to forecast users that the forecast has exceeded threshold tolerances. FAA has developed historical error performance of FAA airports, which could enable development of these error threshold values. FAA officials stated that they were developing diagnostic tables for the TAF forecast by end of fiscal 2016 that would inform them of anomalies that they might then review further.
We found that FAA does not follow the practice of developing risk registers for either the Aerospace or TAF forecasts that identify and characterizes risks, in terms of likelihood and impact, and that identifies a response strategy to manage those risks. Given the impact that economic activity and fuel prices have on aviation activity, as well as the effect of
Incorporate Flexibility and Adopt Response Strategies
Develop Risk Registers and Response Strategies

Appendix II: Review of FAA’s Risk-Management Practices for Forecasts
other factors, such as terrorist threats and changing airline route networks, developing response strategies and risk registers may improve FAA’s risk management of its forecast. FAA officials question the need for risk registers, indicating that they informally and qualitatively assess risks and that they could not publish risks such as non-public knowledge of airlines’ merger plans or of closing airport hubs. However, FAA guidelines related to investments recommend risk registers. Furthermore, FAA has discussed multiple risks, not just non-public knowledge of merger plans
We found that FAA partially follows the practice of informing users of risks because it indicates the sources of risks in its activity forecasts, but does not fully inform users of the risks by developing forecast-error thresholds or describing the likelihood of the risks. For the Aerospace Forecast, FAA informs agency officials and outside users of potential risks through its reporting of accuracy metrics in its annual Aerospace Forecast report. Additionally, FAA schedules meetings during the forecast development cycle to inform agency officials of preliminary forecasts and discuss potential risks. For the TAF, FAA similarly informs agency officials of preliminary forecasts and potential risks through meetings during the development of the TAF and to external stakeholders through its annual TAF forecast summary, but does not document these risks, which would help inform the development of risk registers. Further, FAA does not publish forecast-error threshold values or airport-forecast accuracy performance for either of the forecasts that trigger informing users when forecast errors reach a certain level. Enhancing the mechanism FAA has set up by providing stakeholders with greater documentation and information—such as greater reporting of uncertainty analysis, forecast error performance, error thresholds—would better inform stakeholders.
Page 51 GAO-16-210 Aviation Forecasting
Develop a Mechanism That Informs Agency Officials and Decision-Makers

Appendix II: Review of FAA’s Risk-Management Practices for Forecasts
Figure 8: Principle 5—Monitor and Review Performance Variances
Page 52 GAO-16-210 Aviation Forecasting
We found that FAA follows the practice of conducting annual reviews for both of its forecasts. For the Aerospace Forecast, FAA conducts annual reviews with both internal and external stakeholders, such as industry associations and airline manufacturers. Furthermore, FAA follows the practice of monitoring and comparing forecast data to actual results on an annual basis for five key forecast metrics, and reports out its performance in its annual Aerospace Forecast report. FAA officials stated that they monitor and review the performance of the TAF forecast, but only for the Core 30 airports, and are planning to incorporate some additional practices, such as diagnostic tables, that would alert officials of the need for greater review.
We found that because FAA does not follow the practice of setting risk threshold levels for either the Aerospace or TAF forecast, it does not have response strategies. Additionally, because it does not consistently monitor or provide TAF forecast error performance, nor set forecast error thresholds, its ability to conduct a timely review may be hampered. Developing a response strategy better enables organizations to mitigate risks to meet objectives. FAA officials indicated that they were considering setting forecast error thresholds, but said there is not enough historical data to set threshold values for the TAF-M because of its recent introduction.
Conduct Annual Reviews, Consider Risks and Need for Reevaluation
Track Threshold Values, Flag Issues, and Implement and Review Response Strategies
Appendix II: Review of FAA’s Risk-Management Practices for Forecasts
Finally, we found that FAA follows the practice of assigning personnel to specific portions of the Aerospace Forecast report, which includes forecast accuracy comparisons, as part of their regular duties. However, for the TAF forecast, while FAA contracted with MITRE to monitor TAF accuracy for the period 2003–2009, it currently does not assign specific personnel to monitor forecast accuracy as part of their regularly assigned duties. FAA officials indicated that resources are limited and that while officials occasionally review historical errors, it is not an assigned duty. However, as we noted earlier, the majority of enplanement activity is limited to a small number of airports (e.g., Core 30), which FAA has provided to us in the past and presumably involves fewer resources to
Page 53 GAO-16-210 Aviation Forecasting
Assign Comparisons of Data as a Regular Duty of Personnel

Appendix III: Comments from the Department of Transportation
Page 54 GAO-16-210 Aviation Forecasting
Appendix III: Comments from the Department of Transportation

Appendix III: Comments from the Department of Transportation
Page 55 GAO-16-210 Aviation Forecasting
Appendix IV: GAO Contact and Staff Acknowledgments
Gerald L. Dillingham, Ph.D., (202) 512-2834 or
In addition to the individual named above, key contributors to this report were Heather Krause (Acting Director); Paul Aussendorf (Assistant Director); Eli Albagli; Carl Barden; Pat Donahue; David Hooper; Tim Guinane; Brandon Kruse; Hannah Laufe; Stephanie Purcell; Malika Rice; and Michelle Weathers.
Page 56 GAO-16-210 Aviation Forecasting
Appendix IV: GAO Contact and Staff Acknowledgments
GAO Contact
Staff Acknowledgments

Appendix V: Accessible Data
Page 57 GAO-16-210 Aviation Forecasting
U.S. Department of Transportation
Office of the Secretary of Transportation
Assistant Secretary for Administration
1200 New Jersey Avenue, SE
Washington. DC 20590
FEB 23 2016
Gerald L. Dillingham
Director, Physical Infrastructure Issues
U .S. Government Accountability Office
441 G Street N W
Washington, DC 20548
The Federal Aviation Administration (FAA) has developed a set of assumptions and forecasts consistent with the emerging trends and structural changes takin g place within the aviation industry. In forecasting aviation activity, the FAA employs many of the recommended best practices GAO identified. For example, we use reliable data, conduct annual reviews of forecast accuracy, and reassess key assumptions to our forecasts to reflect changing conditions. We agree that structured risk management approaches are useful and will work with stakeholders to determine which specific practices will be most useful to them.
The FAA reviewed the draft GAO report and offers the following comments:
· In respect to risk management, GAO cited that FAA has not published an analysis of uncertainty associated with the Terminal Area Forecast (TAF) forecast. FAA prototyping established that high and low forecasts can be generated at the airport level , however there are a
Appendix V: Accessible Data
(540283)
Agency Comment Letter
Text of Appendix III: Comments from the Department of Transportation
Page 1
Appendix V: Accessible Data
number of challenges that we would need to address before publicly releasing forecast ranges to include the technical challenges associated with assigning likelihood to different scenarios, as well as reconciling current FAA guidance on forecast ranges with model driven forecast ranges. Further, forecast users may need to change their existing guidance on forecasts to address the appropriate use of ranges in decision making. For example, invest men t decision s may systematically incorporate risk by using the lower end of the forecast, while environmental assessments may choose to weight risk towards the upper end of the forecast. Before publishing these forecast ranges, FAA would need to ensure that policy choices were thoroughly analyzed, and guidance was updated or developed.
· The FAA disagrees with GAO's use of the percent error in the 10-year forecast to judge forecast accuracy. GAO's I O-year forecast error is based on one or two forecasts which are limited data. Also, the time period included the great recession, an economic disruption not forecasted by economists. The draft report acknowledges that the most important factor in forecast accuracy is the accuracy of the underlying forecast economic variables, which are compiled and published by other entities. Inaccuracies in those forecasts, which are the most reliable economic data available to the Agency, are the primary factors driving the inaccuracy of FAA long-term forecasts of aviation activity. The five year forecast errors cited in the draft report also include the unanticipated recession. To provide context to the 5-year and 10-year forecasts, we suggest GAO add a table showing forecast accuracy for gross domestic product.
We concur, in part, with recommendation l to apply risk management practices to analyze and report on uncertainty. Currently, for the Aerospace forecast, we analyze and report forecast uncertainty, as well as monitor and publish multi-year historical error performance, and we agree to do the same for TAF forecasts. However, we do not agree to establish forecast error thresholds for Aerospace and TAF forecasts because we evaluate and update forecast models as part of our annual forecast cycles. Further, we do not agree to identify response strategies when error thresholds are exceeded since FAA is already responding to changing conditions with the development of TAF Modernization. We concur with recommendation 2 and will provide a detailed response to each recommendation within 60 days of the final report's issuance.
We appreciate the opportunity to respond to the GAO draft report. P lease contact Madeline M. Chulumovich, Director of Audit Relation s and Program Improvement , at (202) 366-6512 with any questions or if you would like to obtain additional details.
Page 58 GAO-16-210 Aviation Forecasting
Page 2
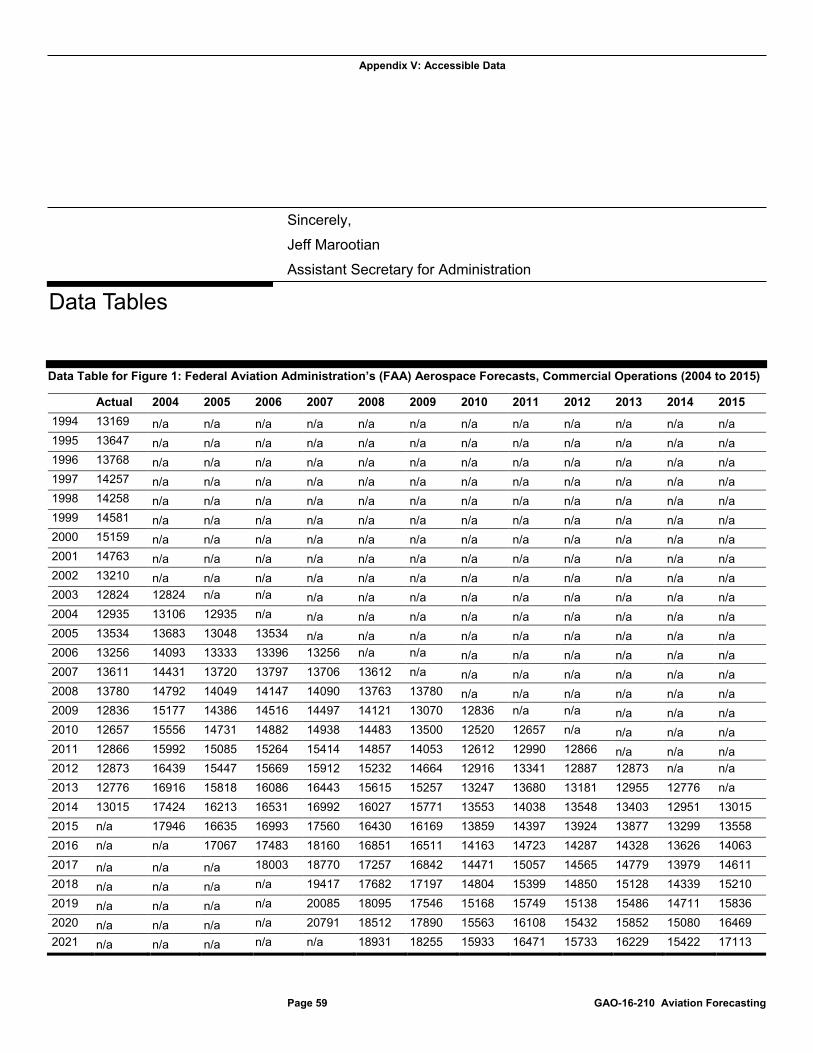
Appendix V: Accessible Data
Sincerely,
Jeff Marootian
Assistant Secretary for Administration
Page 59 GAO-16-210 Aviation Forecasting
Data Table for Figure 1: Federal Aviation Administration’s (FAA) Aerospace Forecasts, Commercial Operations (2004 to 2015)
Actual 2004 2005 2006 2007 2008 2009 2010 2011 2012 2013 2014 2015
1994 13169 n/a n/a n/a n/a n/a n/a n/a n/a n/a n/a n/a n/a 1995 13647 n/a n/a n/a n/a n/a n/a n/a n/a n/a n/a n/a n/a 1996 13768 n/a n/a n/a n/a n/a n/a n/a n/a n/a n/a n/a n/a 1997 14257 n/a n/a n/a n/a n/a n/a n/a n/a n/a n/a n/a n/a 1998 14258 n/a n/a n/a n/a n/a n/a n/a n/a n/a n/a n/a n/a 1999 14581 n/a n/a n/a n/a n/a n/a n/a n/a n/a n/a n/a n/a 2000 15159 n/a n/a n/a n/a n/a n/a n/a n/a n/a n/a n/a n/a 2001 14763 n/a n/a n/a n/a n/a n/a n/a n/a n/a n/a n/a n/a 2002 13210 n/a n/a n/a n/a n/a n/a n/a n/a n/a n/a n/a n/a 2003 12824 12824 n/a n/a n/a n/a n/a n/a n/a n/a n/a n/a n/a 2004 12935 13106 12935 n/a n/a n/a n/a n/a n/a n/a n/a n/a n/a 2005 13534 13683 13048 13534 n/a n/a n/a n/a n/a n/a n/a n/a n/a 2006 13256 14093 13333 13396 13256 n/a n/a n/a n/a n/a n/a n/a n/a 2007 13611 14431 13720 13797 13706 13612 n/a n/a n/a n/a n/a n/a n/a 2008 13780 14792 14049 14147 14090 13763 13780 n/a n/a n/a n/a n/a n/a 2009 12836 15177 14386 14516 14497 14121 13070 12836 n/a n/a n/a n/a n/a 2010 12657 15556 14731 14882 14938 14483 13500 12520 12657 n/a n/a n/a n/a 2011 12866 15992 15085 15264 15414 14857 14053 12612 12990 12866 n/a n/a n/a 2012 12873 16439 15447 15669 15912 15232 14664 12916 13341 12887 12873 n/a n/a 2013 12776 16916 15818 16086 16443 15615 15257 13247 13680 13181 12955 12776 n/a 2014 13015 17424 16213 16531 16992 16027 15771 13553 14038 13548 13403 12951 13015 2015 n/a 17946 16635 16993 17560 16430 16169 13859 14397 13924 13877 13299 13558 2016 n/a n/a 17067 17483 18160 16851 16511 14163 14723 14287 14328 13626 14063 2017 n/a n/a n/a 18003 18770 17257 16842 14471 15057 14565 14779 13979 14611 2018 n/a n/a n/a n/a 19417 17682 17197 14804 15399 14850 15128 14339 15210 2019 n/a n/a n/a n/a 20085 18095 17546 15168 15749 15138 15486 14711 15836 2020 n/a n/a n/a n/a 20791 18512 17890 15563 16108 15432 15852 15080 16469 2021 n/a n/a n/a n/a n/a 18931 18255 15933 16471 15733 16229 15422 17113
Data Tables

Appendix V: Accessible Data
Page 60 GAO-16-210 Aviation Forecasting
Actual 2004 2005 2006 2007 2008 2009 2010 2011 2012 2013 2014 2015
2022 n/a n/a n/a n/a n/a 19352 18616 16304 16843 16037 16615 15808 17837 2023 n/a n/a n/a n/a n/a 19780 18984 16682 17225 16348 17010 16267 18444 2024 n/a n/a n/a n/a n/a 20212 19357 17059 17617 16666 17416 16762 18844 2025 n/a n/a n/a n/a n/a 20655 19746 17458 18020 16991 17831 17313 19180 2026 n/a n/a n/a n/a n/a n/a n/a 17862 18432 17324 18241 17881 19514 2027 n/a n/a n/a n/a n/a n/a n/a 18253 18856 17664 18662 18558 19861 2028 n/a n/a n/a n/a n/a n/a n/a 18659 19290 18012 19093 19283 20217 2029 n/a n/a n/a n/a n/a n/a n/a 19063 19736 18369 19536 19927 20582 2030 n/a n/a n/a n/a n/a n/a n/a 19482 20193 18734 19989 20564 20962 2031 n/a n/a n/a n/a n/a n/a n/a n/a 20662 19107 20451 20996 21341 2032 n/a n/a n/a n/a n/a n/a n/a n/a n/a 19490 20925 21370 21721 2033 n/a n/a n/a n/a n/a n/a n/a n/a n/a n/a 21411 21742 22108 2034 n/a n/a n/a n/a n/a n/a n/a n/a n/a n/a n/a 22110 22496 2035 n/a n/a n/a n/a n/a n/a n/a n/a n/a n/a n/a n/a 22887
Legend: n/a = not applicable

Appendix V: Accessible Data
The Government Accountability Office, the audit, evaluation, and investigative arm of Congress, exists to support Congress in meeting its constitutional responsibilities and to help improve the performance and accountability of the federal government for the American people. GAO examines the use of public funds; evaluates federal programs and policies; and provides analyses, recommendations, and other assistance to help Congress make informed oversight, policy, and funding decisions. GAO’s commitment to good government is reflected in its core values of accountability, integrity, and reliability.
The fastest and easiest way to obtain copies of GAO documents at no cost is through GAO’s website (http://www.gao.gov). Each weekday afternoon, GAO posts on its website newly released reports, testimony, and correspondence. To have GAO e-mail you a list of newly posted products, go to http://www.gao.gov and select “E-mail Updates.”
The price of each GAO publication reflects GAO’s actual cost of production and distribution and depends on the number of pages in the publication and whether the publication is printed in color or black and white. Pricing and ordering information is posted on GAO’s website, http://www.gao.gov/ordering.htm.
Place orders by calling (202) 512-6000, toll free (866) 801-7077, or TDD (202) 512-2537.
Orders may be paid for using American Express, Discover Card, MasterCard, Visa, check, or money order. Call for additional information.
Connect with GAO on Facebook, Flickr, Twitter, and YouTube. Subscribe to our RSS Feeds or E-mail Updates. Listen to our Podcasts and read The Watchblog. Visit GAO on the web at www.gao.gov.
Contact:
Website: http://www.gao.gov/fraudnet/fraudnet.htm E-mail: [email protected] Automated answering system: (800) 424-5454 or (202) 512-7470
Katherine Siggerud, Managing Director, [email protected], (202) 512-4400, U.S. Government Accountability Office, 441 G Street NW, Room 7125, Washington, DC 20548
Chuck Young, Managing Director, [email protected], (202) 512-4800 U.S. Government Accountability Office, 441 G Street NW, Room 7149 Washington, DC 20548
Page 61 GAO-16-210 Aviation Forecasting
GAO’s Mission
Obtaining Copies of GAO Reports and Testimony
Order by Phone
Connect with GAO
To Report Fraud, Waste, and Abuse in Federal Programs
Congressional Relations
Public Affairs
PleasePrintonRecycledPaper.