GAO-11-94 Public Transportation: Transit Agencies' Actions ...
64
United States Government Accountability Office GAO Report to the Committee on Banking, Housing, and Urban Affairs, U.S. Senate PUBLIC TRANSPORTATION Transit Agencies’ Actions to Address Increased Ridership Demand and Options to Help Meet Future Demand November 2010 GAO-11-94
Transcript of GAO-11-94 Public Transportation: Transit Agencies' Actions ...

United States Government Accountability Office
GAO Report to the Committee on Banking, Housing, and Urban Affairs, U.S. Senate
PUBLIC TRANSPORTATION
Transit Agencies’ Actions to Address Increased Ridership Demand and Options to Help Meet Future Demand
November 2010
GAO-11-94

United States Government Accountability Office
Accountability • Integrity • Reliability
Highlights of GAO-11-94, a report to the Committee on Banking, Housing, and Urban Affairs, U.S. Senate
November 2010
PUBLIC TRANSPORTATION Transit Agencies’ Actions to Address Increased Ridership Demand and Options to Help Meet Future Demand
Why GAO Did This Study
Demand for public transportation in the United States reached record highs in 2008 and rose in the decade prior to 2008. Increased demand for public transportation can create opportunities and challenges for communities working to meet demand, improve service, and maintain transit systems, while operating within budgetary constraints. Transit agencies rely on a variety of funding sources, including federal, state, and local entities, and other sources, such as fares. The U.S. Department of Transportation’s (DOT) Federal Transit Administration administers federal grant programs transit agencies can use to help meet ridership demand, such as for purchasing buses and modernizing rail systems.
As requested, this report addresses (1) trends in transit ridership and services from 1998 through 2008, (2) challenges, if any, transit agencies faced during this period to address increased ridership and actions they took in response, and (3) factors that might affect future ridership demand and the ability of transit agencies to meet that demand. GAO analyzed data from the National Transit Database on transit ridership (i.e., passenger miles traveled), service (i.e., vehicle revenue miles), costs, and revenues; conducted interviews with 15 transit agencies operating heavy rail, light rail, and bus; interviewed federal officials and others; and reviewed prior GAO recommendations.
DOT generally agreed with the report and provided technical comments.
What GAO Found
From 1998 through 2008, the most recent year for which complete data are available, transit ridership grew at a faster rate than transit service. Heavy rail experienced the greatest difference between growth in ridership and service compared with light rail or bus—heavy rail ridership outpaced the provision of service by about 18 percentage points during this period. Transit agency costs and revenues also increased overall from 1998 through 2008, but the relative shares of revenue sources changed. The share of federal funding remained steady while increases in state and local funding shares offset declines in the share of funding from other sources, such as passenger fares. In addition, in 1998 the federal government was the largest source of capital investment in transit; by 2008 local government provided the largest share.
From 1998 through 2008, transit agencies faced challenges and took actions to address increased ridership demand. Specifically, agencies faced capacity constraints, including limitations of their vehicles (e.g., too few rail cars and buses) and their system infrastructure (e.g., platforms that were too short to accommodate longer trains). Transit agencies took steps to respond to increased demand, including: adjusting their service by modifying routes, fares, and hours of service; making new system investments, such as expanding fleets and extending platforms; and maintaining and updating existing infrastructure and vehicles. For example, New York City transit officials improved the signaling in their heavy rail system to increase frequency of service. Agencies experienced varying degrees of success in responding to increases in demand—some reported accommodating increases in ridership while others’ success was limited. For example, a light rail agency reported that its service area did not keep pace with real estate development, and a bus agency turned away riders.
Population growth and other factors are likely to increase future ridership demand, but cost increases and fiscal uncertainties could limit transit agencies’ ability to meet this demand. Transit agency officials expressed concern about meeting future increases in ridership due to increased costs of expanding transit systems and maintaining aging infrastructure. Also, transit agencies’ funding has been strained since 2008, as state and local funding has decreased with the economic downturn. This is significant because transit agencies previously relied on increases in state and local funding shares to offset decreases in other sources. Given this environment, along with fiscal difficulties facing the nation, it will be a challenge to effectively focus limited resources to maximize the positive effect on transit agencies’ services. GAO and others have made recommendations to DOT, Congress, and others on options that could more effectively deliver federal surface transportation programs and help transit agencies address growing ridership. These options are under consideration and include: focusing resources on state of good repair, streamlining the delivery of federal grant programs, and incorporating performance accountability measures to maximize the impact of investments.
View GAO-11-94 or key components. For more information, contact David Wise at (202) 512-5731 or [email protected].

Page i GAO-11-94
Contents
Letter 1
Background 3 Transit Ridership Grew at a Faster Rate Than Service and Funding
Sources Changed 7 Agencies Faced Challenges and Responded by Adjusting Service,
Making New System Investments, and Maintaining Their Existing Systems 15
Demographic Changes Point to Future Increases in Ridership Demand, but Cost Increases and Fiscal Uncertainties May Limit Agencies’ Ability to Meet Demand 24
Agency Comments 40
Appendix I Objectives, Scope, and Methodology 41
Appendix II Analyzing the Effect of New York City on National
Transit Trends 46
Appendix III GAO Contact and Staff Acknowledgments 58
Tables
Table 1: Select Federal Transit and Transit-Related Programs 6 Table 2: Examples of Transit Infrastructure-related Challenges,
1998–2008 17 Table 3: Examples of Actions Taken by Transit Agencies to Meet
Demand, 1998–2008 21 Table 4: Site Visit Interviews 43 Table 5: Transit Agency Interviews 44 Table 6: Growth in Service Output and Service Use, 1998–2008:
United States National Trends and New York City 51 Table 7: Growth in Operating Costs by Function and Mode, 1998–
2008: United States National Trends and New York City 51 Table 8: Growth in Capital Costs by Function and Mode, 1998–
2008: United States National Trends and New York City 52 Table 9: United States Percentage of Total Funding for Operating
and Capital Expenditure Combined by Source 52
Public Transportation

Table 10: United States, Except New York City, Percentage of Total Funding for Operating and Capital Expenditure Combined by Source 53
Table 11: New York City, Percentage of Total Funding for Operating and Capital Expenditure Combined by Source 54
Table 12: All United States, Percentage of Total Funding for Operating Expenditure by Source 54
Table 13: All United States, Except New York City, Percentage of Total Funding for Operating Expenditure by Source 55
Table 14: New York City, Percentage of Total Funding for Operating Expenditure by Source 55
Table 15: United States Percentage of Total Funding for Capital Expenditure by Source 56
Table 16: United States Except, New York City, Percentage of Total Funding for Capital Expenditure by Source 56
Table 17: New York City, Percentage of Total Funding for Capital Expenditure by Source 57
Table 18: Unlinked Passenger Trips in 2008: United States Compared with New York City 57
Table 19: Vehicle Revenue Miles in 2008: United States Compared with New York City 57
Figures
Figure 1: Passenger Miles Traveled by Mode, 1998–2008 8 Figure 2: Vehicle Revenue Miles by Mode, 1998–2008 9 Figure 3: Total Transit Funding Sources, 1998 and 2008 12 Figure 4: Transit Funding Sources—Operating, 1998 and 2008 14 Figure 5: Transit Funding Sources—Capital, 1998 and 2008 15
Page ii GAO-11-94 Public Transportation

Abbreviations
CMAQ Congestion Mitigation and Air Quality Improvement Program
DOT Department of Transportation FHWA Federal Highway Administration FTA Federal Transit Administration MTA Metropolitan Transportation Authority NEPA National Environmental Policy Act of 1969 NHTSA National Highway Traffic Safety Administration NTD National Transit Database PMT passenger miles traveled Recovery Act American Recovery and Reinvestment Act of 2009 SAFETEA-LU Safe, Accountable, Flexible, Efficient Transportation
Equity Act: A Legacy for Users UPT unlinked passenger trip VRH vehicle revenue hour VRM vehicle revenue mile
This is a work of the U.S. government and is not subject to copyright protection in the United States. The published product may be reproduced and distributed in its entirety without further permission from GAO. However, because this work may contain copyrighted images or other material, permission from the copyright holder may be necessary if you wish to reproduce this material separately.
Page iii GAO-11-94 Public Transportation
Page 1 GAO-11-94
United States Government Accountability Office
Washington, DC 20548
November 30, 2010
The Honorable Christopher J. Dodd Chairman The Honorable Richard C. Shelby Ranking Member Committee on Banking, Housing, and Urban Affairs United States Senate
Demand for public transportation in the United States reached record highs in 2008 and rose in the decade prior to 2008. From 1998 through 2008, the growth in public transportation ridership exceeded overall population growth and outpaced the growth of vehicle miles traveled on the nation’s highways. While transit ridership has decreased since 2008, in part because of high unemployment and other factors related to the recession, population and demographic trends indicate that demand for public transit will grow in the years to come. Increased demand for public transportation can create opportunities and challenges for communities working to accommodate demand, improve services, and properly maintain their systems within budgetary constraints.
As demand for transit services has grown over time, so has the federal government’s overall investment in public transportation. Transit agencies rely on federal funding to meet a substantial amount of their capital investment and other needs. A variety of other funding sources also support the provision of transit services, including assistance from state and local entities, and sources such as passenger fares. To assist transit agencies, the Federal Transit Administration (FTA) within the Department of Transportation (DOT) administers a variety of federal grant programs that can be used to help meet ridership demand, such as grants for purchasing buses and modernizing rail systems. The funding for these programs is currently authorized by an extension to the Safe, Accountable, Flexible, Efficient Transportation Equity Act: A Legacy for Users (SAFETEA-LU), which expired in September 2009 and is due to be reauthorized.1 In preparation for reauthorization, you asked us to review how transit agencies are responding to increased passenger demand. Accordingly, this report addresses (1) trends in transit ridership and
1Pub. L. No. 109-59, 119 Stat. 1144 (2005).
Public Transportation
services from 1998 through 2008; (2) challenges, if any, that transit agencies faced during this period to address increased ridership and actions they took in response; and (3) factors that might affect future ridership demand and the ability of transit agencies to meet that demand. Unless otherwise noted, for the purposes of this review, we have focused on transit agencies that operate heavy rail, light rail, and bus services.2 These modes represent approximately 92 percent of the overall public transit market.
To describe the trends in the transit industry’s ridership, services, costs, and revenues from 1998 through 2008, we examined data from FTA’s National Transit Database (NTD).3 We examined NTD data for all reporting agencies from 1998 through 2008 and conducted more detailed analyses by mode (for agencies operating heavy rail, light rail, and bus services).4 We used NTD data to determine trends in the transit industridership (measured by passenger miles traveled (PMT)—or the cumulative sum of the distances ridden by each passenger), supply of services (measured by vehicle revenue miles (VRM)—that is, miles a transit vehicle travels while carrying passengers), costs, and revenues. We chose to analyze NTD data from 1998 through 2008 because they prova comprehensive and detailed dataset containing the variables we includedin the analysis. Data from 2008 were the most current available data on these variables when we conducted our review. In reviewing NTD data, we determined that they were reliable for our purposes. Appendix I contmore detailed discussion of our data reliability assessment. To identify
ry’s
ided
ains a
2According to the National Transit Database (NTD), heavy rail service is characterized by high-speed and rapid acceleration passenger rail cars operating singly or in multicar trains on fixed electric rails; separate rights-of-way from which all other traffic is excluded; sophisticated signaling; high platform loading; and a heavy passenger volume. Light rail service is characterized by an electric railway with a lower passenger volume compared to heavy rail, passenger cars operating singly (or in short, two-car trains) on fixed rails in shared or exclusive right-of-way; low or high platform loading, and vehicle power drawn from an overhead electric wire. Bus service operates on fixed routes and schedules over existing roadways.
3Recipients and beneficiaries of grants from FTA under the Urbanized Area Formula Program (49 U.S.C. § 5307) or Other than Urbanized Area (Rural) Formula Program (49 U.S.C. § 5311) are required by statute to submit data to the NTD. 49 U.S.C. § 5335. Over 700 urbanized area transit providers and over 1,300 rural transit providers report to the NTD on a variety of variables, including information on all funds applied to transit, such as federal, state, local, and other funds. FTA estimates that the NTD represents over 95 percent of public transportation in urbanized areas.
4NTD data analyses were adjusted for inflation, where appropriate.
Page 2 GAO-11-94 Public Transportation

challenges transit agencies faced and actions they took to address increased ridership, we conducted semistructured interviews with offfrom 15 selected transit agencies in urbanized areas.
icials
d FTA
. e,
and methodology.
e
e basis for our
findings and conclusions based on our audit objectives.
t,
y
st
5 We based our selection of these transit agencies on the type of transportation servicesprovided (heavy rail, light rail, or bus), growth in passenger trips from 1998 through 2008, geographic dispersion, and size. Of the 15 selected transit agencies, we visited three (one with each type of service—heavy rail, light rail, and bus) to conduct in-person interviews with representatives of the transit agencies, local governments, metropolitanplanning organizations, the business community, advocacy groups, and others. We conducted in-depth telephone interviews with officials of the remaining 12 transit agencies. To identify what factors might affect future ridership demand and the ability of transit agencies to meet that demand,we reviewed relevant literature and interviewed transit agency anofficials, transportation researchers, and industry and advocacy groupsAppendix I contains a more detailed discussion of our objectives, scop
We conducted this performance audit from December 2009 through November 2010 in accordance with generally accepted government auditing standards. Those standards require that we plan and perform thaudit to obtain sufficient, appropriate evidence to provide a reasonable basis for our findings and conclusions based on our audit objectives. Wbelieve that the evidence obtained provides a reasonable
In 2008, Americans took an estimated 10.4 billion trips on public transithe highest ridership in over 50 years. More recently, however, transit ridership has experienced a decline in line with the current economicdownturn. While use of public transit has generally grown over time, driving remains the primary travel mode choice for most Americans. Specifically, in 2008, 86 percent of commute trips to work were made bprivate vehicle and 5 percent were made by public transit.6 Driving, as measured by national vehicle miles traveled, dropped in 2008 for the fir
5
6
Background
Urbanized areas (as defined by the U.S. Census Bureau) are densely settled territories that contain 50,000 or more people.
The remaining trips were made by walking and other means, while some people worked from home.
Page 3 GAO-11-94 Public Transportation
time in 28 years, in part, due to the downturn in the economy and highgasoline pr
ices, before beginning to grow again in 2009.
ertility
ained
compared with only 69 percent in 1970. Increases in the U.S. population, including increases in the population aged 65 and over, can
e use of
ercent by September 2010. This increase in unemployment has been accompanied by a decrease in transit ridership,
• Gasoline prices. The public’s reaction to increases in gasoline prices can also affect the demand for public transit.7 During the last decade, gasoline
A variety of factors can affect the demand for public transit services, including:
• Population and demographics. According to the U.S. Census Bureau, from 2000 through 2009, the U.S. population grew by an estimated 9 percent, reaching more than 300 million. Longer life spans, a stable frate, and immigration are among the contributing factors to this growth. The population aged 65 and over is estimated to have reached 40 million this year and this number is expected to continue growing as “baby boomers” age. During the past decade, the total fertility rate has remstable, while the foreign-born population has increased due to immigration. In addition, in the past century, metropolitan areas, includingcentral cities and suburbs, have experienced significant growth in population, with city suburbs growing more rapidly than central cities. In2009, an estimated 84 percent of the U.S. population lived in metropolitan areas as
increase the need for transportation options, including demand for public transit.
• Employment and the economy. Similarly, employment rates and the statof the economy can affect the travel choices of Americans and theirpublic transit. During the past decade, there were two economic recessions beginning in 2001 and 2007, respectively. The 2007 recession was accompanied by high levels of unemployment and subsequent decreases in transit ridership. For example, according to the U.S. Bureauof Labor Statistics, during the 2007 recession, unemployment rose from 5 percent in January 2008 to 10.1 percent in October 2009, and has only edged down slightly to 9.6 p
with ridership decreasing by about 4 percent in 2009 and about 3 percent in the first quarter of 2010.
ten.
7Public surveys also indicate that a common response to gasoline price increases is to use transit more of
Page 4 GAO-11-94 Public Transportation
prices increased dramatically before falling again.8 After the average price of gasoline peaked at more than $4 per gallon in June and July of 2008, tprice began to rapidly drop. The average price of gasoline for 2009 was $2.35 per gallon as compared with $3.27 for 2008. Following the increagasoline prices in 2008, transi
he
se in t ridership reached record highs, before
eventually declining in 2009.
s,
ate
ing and
ther
ile
Federal, state, and local investment in transit has grown over the yearresulting in the expansion of the nation’s public transit systems. FTA works in partnership with states and local grant recipients, such as transit agencies, to administer federal transit programs, and to provide financial,technical, and other assistance. Transit agencies also rely on a variety of other funding sources to help provide service, including assistance from state and local entities, and other sources such as passenger fares.9 Stand local governments are ultimately responsible for executing most federal transit programs by matching and distributing federal fundby planning, selecting, and supervising infrastructure projects in accordance with federal requirements. In addition, in some cases, financial assistance programs administered by the Federal Highway Administration(FHWA), or jointly administered by FHWA and FTA, can also be used to support transit agencies. For example, the Congestion Mitigation and Air Quality Improvement Program (CMAQ), which is jointly administered by FHWA and FTA, provides assistance to states for eligible transportationprojects or programs that improve air quality and reduce congestion.10 States also have flexibility to transfer a limited amount of funds from ohighway programs to assist transit programs, as in the case of CMAQ funds.11 The funding for these programs is authorized by SAFETEA-LU, which was enacted in August 2005 and expired in September 2009.12 Wh
8From 1998 through 2008, the average price per gallon increased from $1.06 to $3.27 across
ost of providing transit service. For example, in 2008, according to the NTD, approximately 32 percent of transit agencies’ operating expenses
way and Transit Investments: Flexible Funding Supports State and Local Transportation Priorities and Multimodal Planning,
, D.C.: July 26, 2007).
the country.
9While transit agencies rely on revenue from passenger fares to help provide service, passenger fares do not cover the full c
were paid for through fare revenues.
1023 U.S.C. § 149. When CMAQ funds are designated for transit projects, funds are transferred from FHWA to FTA. See GAO, High
GAO-07-772 (Washington
11See 23 U.S.C. § 126(c).
12Pub. L. No. 109-59, 119 Stat. 1144 (2005).
Page 5 GAO-11-94 Public Transportation

it has yet to be reauthorized, SAFETEA-LU has been extended sevetimes and t
ral he most recent extension will expire on December 31, 2010.13
Table 1 summarizes select federal transit and transit-related grant
ederal Tran rograms
programs.
Table 1: Select F sit and Transit-Related P
FTA programs Summary of programs
Urbanized Area Formula rogram
(49 U.S.C. § 5307)
r
ital
ula.
PCapital assistancea and transportation-related planning fourbanized areasb and operating assistancec for use in public transportation if certain eligibility criteria are met, among other things. Eligible uses include capital investments in bus and bus-related activities, and capinvestments in new and existing fixed guidewayd systems. Funds are allocated based on a multitiered form
Fixed Guideway Modernization Program (49 U.S.C. § 5309)
xed
es, and
Capital assistance to modernize or improve existing figuideway systems, including the purchase and rehabilitation of vehicles, maintenance facilitiequipment, and preventive maintenance. Funds are allocated based on a multitiered formula.
Bus and Bus Facility Grant Program (49 U.S.C. §§ 5309, 5318)
Capital assistance for new and replacement buses, related equipment, and facilities. Funding is discretionary.
Capital Investment Grants - “New and Small Starts” (49 U.S.C. § 5309)
fixed guideway Capital assistance for the construction of new fixed guideway systems or extensions to existing systems or corridor-based bus systems. Funds are allocated on a discretionary basis based on recommendations made by FTA.
Metropolitan and Statewide Planning Programs (49 U.S.C. §§
protect g is provided to state
f transportation and then allocated to 5303, 5304, 5305) departments o
Planning assistance, including activities that increase the safety and security of the transportation system and and enhance the environment. Fundin
metropolitan planning organizations.
Source: GAO summary of FTA and FHWA program information. aAccording to the NTD, capital expenses include the following categories: revenue vehicles, guideway, communication and information systems, fare revenue collection equipment, maintenance
ral
facilities, passenger stations, administration buildings, service (nonrevenue) vehicles, and other (including passenger shelters, signs and amenities, and furniture and equipment that are not integparts of buildings and structures). bUrbanized areas are areas encompassing a population of not less than 50,000 people that have been defined and designated in the most recent decennial census as an “urbanized area” by the Secretary of Commerce. 49 U.S.C. § 5302(a)(17). cThe NTD defines operating expenses as those expenses incurred by transit agencies that are associated with operating mass transportation services (i.e., vehicle operations, maintenance, and administration).
Pub. L. No. 111-147, § 411, 124 Stat. 71, 78 (2010). 13
Page 6 GAO-11-94 Public Transportation

dA “fixway o
ed guideway” refers to any public transportation facility using and occupying a separate right-of-r rail for the exclusive use of public transportation and other high-occupancy vehicles; or using a
fixed catenary system (i.e., overhead lines) and a right-of-way usable by other forms of transportation. 9 U.S.C. § 5302(a)(4). The term includes heavy rail, commuter rail, light rail, monorail, trolleybus,
y, inclined plane, cable car, automated guideway transit, ferryboats, that portion of motor bus service operated on exclusive or controlled rights-of-way, and high-occupancy-vehicle
nes.
l,
ip growth for light rail may reflect the increase in the number of light rail systems in operation during the time period. As shown in figure 1, light rail ridership increased by nearly 87 percent (from 1.12 billion to 2.08 billion passenger miles), heavy rail ridership increased by about 37 percent (from 12.3 billion to 16.8 billion passenger miles), and bus ridership increased by about 19 percent (from 17.9 billion to 21.2 billion passenger miles).15
4aerial tramwa
la
ublic Transportation
Transit Ri
From 1998 through 2008, transit ridership for agencies offering heavy railight rail, and bus services grew more than 28 percent. During the sameperiod, transit service grew approximately 20 percent.
Transit ridership increased overall by over 28 percent from 1998 through 2008, as measured by passenger miles traveled (PMT).14 By mode, light rail ridership grew at a faster rate than heavy rail or bus. The high ridersh
dership Grew at a Faster Rate
Changed
han Service from 1998 through 2008
Transit Ridership Increased by Over 28 Percent
Than Service and Funding Sources
Transit Ridership Grew at a Faster Rate T
14The NTD defines PMT as the cumulative sum of the distances ridden by each passenger. As part of our data reliability assessment, we conducted an analysis to determine what effect, if any, New York City’s Metropolitan Transportation Authority (MTA) had on national transit trends, since New York City comprises a large portion of ridership in the United States. We found that PMT as a measure of ridership were not greatly affected by the inclusion or omission of the MTA’s data. See app. II for a detailed description of this analysis.
15Since buses and heavy rail account for the vast majority of PMT, they comprise a larger proportion of the ridership increases for heavy rail, light rail, and bus systems combined.
Page 7 GAO-11-94 P

Figure 1: Passenger Miles Traveled by Mode, 1998–2008
Bus
Heavy rail
Light rail
Passenger miles (in billions)
Source: GAO analysis of FTA NTD data.
Year
0
2
4
6
8
10
12
14
16
18
20
22
24
20082007200620052004200320022001200019991998
Change,1998-2008:+87%
Change,1998-2008:+19%
Change,1998-2008:+37%
12.3
16.8
1.122.08
17.9
21.2
According to officials at the transit agencies we contacted, a number of factors contributed to ridership increases from 1998 through 2008, including population increases, periods of growth in employment, and increases in gasoline and parking prices. In addition, some agency officials reported taking actions they believe attracted new riders, such as expanding and enhancing their systems, adding new service, forming local partnerships, and launching marketing campaigns to increase ridership. For example, the Ann Arbor Transportation Authority, which provides bus service to Ann Arbor, Michigan, and surrounding areas, entered into partnerships with employers, including the University of Michigan, to subsidize students’ and employees’ transit costs. According to officials from the Ann Arbor Transportation Authority, the University of Michigan, and representatives from the business community, these partnerships helped to generate significant ridership growth in the city of Ann Arbor.
Page 8 GAO-11-94 Public Transportation

The availability of transit service also increased steadily for heavy rail, light rail, and bus agencies, with vehicle revenue miles (VRM) increasing by approximately 20 percent from 1998 through 2008.16 Consistent with trends in ridership by mode, the supply of light rail service grew faster than heavy rail or bus services, which may reflect, in part, the increase in the number of light rail systems during the time period. As shown in figure 2, VRMs increased by 104 percent for light rail (from 42 million to 86 million miles), as compared with about 19 percent for heavy rail (from 549 million to 655 million miles) and 18 percent for agencies providing bus services (from 1.652 billion to 1.956 billion miles).
ing bus services (from 1.652 billion to 1.956 billion miles).
Transit Service Increased by About 20 Percent
Figure 2: Vehicle Revenue Miles by Mode, 1998–2008 Figure 2: Vehicle Revenue Miles by Mode, 1998–2008
Bus
Heavy rail
Light rail
Vehicle revenue miles (in millions)
Source: GAO analysis of FTA NTD data.
Year
0
200
400
600
800
1,000
1,200
1,400
1,600
1,800
2,000
20082007200620052004200320022001200019991998
42 86
549655
1,652
1,956
86
Change,1998-2008:+104%
655
Change,1998-2008:+19%
Change,1998-2008:+18%
The relationship between transit ridership and service varied by mode. For example, heavy rail experienced the greatest discrepancy in ridership and supply of services from 1998 through 2008 compared with light rail or bus.
16The NTD defines VRMs as the miles a transit vehicle travels while in revenue service—that is, when the vehicle is available to the public with the expectation of carrying passengers.
Page 9 GAO-11-94 Public Transportation

Ridership outpaced the provision of heavy rail service by about 18 percentage points (specifically, ridership for heavy rail increased by about 37 percent while the provision of heavy rail service increased by about 19 percent). For agencies offering bus services, ridership generally seemed to keep pace with the supply of services during the same period (19 percent as compared with 18 percent growth). Transit agency officials with whom we spoke noted that bus systems can typically respond more quickly to increases in ridership demand, while heavy rail agencies face more challenges due to the capital-intensive nature of their systems and the financial investment required to increase heavy rail service. However, the availability of light rail service actually grew faster than ridership demand, partly due to light rail systems expanding during this time period. Specifically, light rail service grew by over 100 percent while ridership grew by about 87 percent from 1998 through 2008.
For passengers, the disparity between ridership growth and service points to several potential effects. Passengers using transit systems with enough capacity to accommodate increases in ridership may experience a better utilized system. However, they may also experience a system that, while better utilized, has become more crowded. For passengers using transit systems without the capacity to accommodate increases in ridership, they may have experienced an overcrowded system that left passengers on the platform or curb during periods of high demand. According to officials at the transit agencies we contacted, agencies experienced varying degrees of success in responding to ridership growth from 1998 through 2008.
Transit Agencies’ Costs and Revenues Increased from 1998 through 2008, and the Share of Funding Sources Changed
While providing additional service, transit agency costs, including operating and capital expenses, increased from 1998 through 2008, as did transit agency revenues.17 However, while revenues increased overall, the share of funding sources changed; the share of federal funding remained steady while increases in state and local funding shares essentially offset declines in the share of funding from other sources, such as passenger fares.18
17These figures have been adjusted for inflation.
18According to the NTD, sources of funds (operating and capital) include assistance (local, state, and federal) and funds generated by the service providers (fares and contract revenues).
Page 10 GAO-11-94 Public Transportation

Increases in ridership and service from 1998 through 2008 were accompanied by increases in overall costs to provide transit service. Total costs, which include operating and capital expenses, for transit agencies offering heavy rail, light rail, and bus services increased by about 46 percent. While both capital and operating expenses grew, capital expenses grew at a faster rate than operating expenses for agencies during this period. Specifically, capital expenses grew by about 68 percent19 while operating expenses increased by over 36 percent from 1998 to 2008.20 The increase in capital expenses reflects, in part, the financial investment in heavy rail and light rail systems. The increase in operating costs was most noticeable for light rail systems likely due, in part, to increases in light rail service over the time period studied.
Costs and Revenues
Similarly, transit agency revenues21 increased by more than 48 percent from 1998 through 2008.22 Revenue sources include federal, state, local, and other funding sources, such as passenger fares. While overall transit revenues increased, the share of funding sources changed. As shown in figure 3, as a percentage of total revenues, the share of federal funding remained steady at about 17 percent. The shares of state and local funding increased (from about 18 to 22 percent and 32 to 35 percent, respectively), while the share of funds from other sources, such as passenger fares, decreased (from 34 percent to 26 percent). Increases in the share of state and local funding essentially offset declines in the share of funding from other nonfederal funding sources, such as passenger fares, from 1998 through 2008. For example, those transit systems that had to add service to accommodate growing ridership during this period, and finance the associated costs, likely used state and local funding to supplement
19By mode, capital costs grew most rapidly for heavy rail and light rail from 1998 through 2008 (at about 92 percent and 165 percent, respectively), whereas capital costs for buses remained relatively steady over this period.
20By mode, operating costs for light rail grew at a faster rate than either heavy rail or bus from 1998 through 2008. During this period, operating costs grew by about 88 percent for light rail, 28 percent for heavy rail, and 37 percent for bus.
21Our analysis of transit agency revenues consists of funds applied to transit operations and capital investments. From 1998 through 2008, funds applied to transit operations increased by about 43 percent and funds applied to capital investments increased by about 60 percent.
22Complete NTD data on revenues are not available by mode for the time period we studied. Therefore, our analyses of transit revenues represents all transit agencies that report to the NTD, which include heavy rail, light rail, and bus, as well as commuter rail, demand response, and vanpool.
Page 11 GAO-11-94 Public Transportation

decreases in other funding sources, including passenger fares. Since fares collected from passengers typically do not cover the full cost of their transit trips, these agencies essentially experienced a widening gap between passenger fare revenue and costs as ridership increased. This gap can significantly limit the ability of transit agencies to increase transit service in response to rising demand. In almost all cases, expanding transit service would require securing additional funding to bridge this gap.
Figure 3: Total Transit Funding Sources, 1998 and 2008
17%
18%
32%
34%
17%
22%
35%
26%
Federal
State
Local
Other
Federal(no change from 1998)
State(+4 percentage points since 1998)
Local(+3 percentage points since 1998)Other(-8 percentage points since 1998)
Source: GAO analysis of FTA NTD data.
1998 2008
Note: Percentages may not add up to 100 due to rounding and other factors.
Upon closer examination of the components of transit funding sources, the shares of revenue sources for operating23 and capital24 funding differ slightly from the shares for total revenues mentioned previously. For example:
23According to the NTD, sources of operating funds include fare revenues, federal assistance, state assistance, local assistance, and other funds. Other funds can include subsidies from other sectors of operations and directly levied taxes, among other things.
24The NTD defines capital funds as the funds that transit agencies receive from federal, state, local, and directly generated sources and that are applied to capital projects. Directly generated sources include any funds generated or donated directly to the transit agency including passenger fares, advertising revenues, and donations and grants from private entities.
Page 12 GAO-11-94 Public Transportation
• Operating funding. Fare revenues were the largest source of operating funding in 1998 and 2008; however, as shown in figure 4, the share of fare revenues decreased considerably as a percentage of operating funding during this time period (from about 38 percent to 31 percent). At the same time, as a percentage of operating funding, local government contributions for operating expenses remained relatively steady (from about 29 percent to 30 percent), contributions of federal and state funding increased (from 4 to 7 percent and 20 to 26 percent, respectively), and other funding sources, such as subsidies from other sectors of operations, decreased (from 9 percent to 6 percent). According to transit agency officials at a heavy rail agency with whom we spoke, because public transit riders do not pay for the full cost of their rides through passenger fares and revenues have not kept pace with operating costs, increased ridership has strained their transit system’s operating budget.25
25The NTD defines fare revenues as the funds earned through carrying passengers. The farebox recovery ratio is the percentage of operating funds applied (operating expenses) paid through fare revenues. Total farebox revenue growth was considerably less than the growth in total operating costs from 1998 through 2008, about 14 percent compared with about 43 percent. Since farebox revenue grew slower than operating costs, the farebox recovery ratio has fallen during this period.
Page 13 GAO-11-94 Public Transportation

Figure 4: Transit Funding Sources—Operating, 1998 and 2008
20%
4%
29%9%
38%
7%
6%
26%
30%
31%
Federal
Local
State
Other
Fares
Fares(-7 percentage points since 1998)
Federal(+3 percentage points since 1998)
State(+6 percentage points since 1998)
Local(+1 percentage points since 1998)
Other(-3 percentage points since 1998)
Source: GAO analysis of FTA NTD data.
1998 2008
Note: Percentages may not add up to 100 due to rounding and other factors.
• Capital funding. In 1998 the federal government was the largest source of capital investment in transit, but by 2008 this was no longer the case. Instead, local government replaced the federal government as the largest source. As shown in figure 5, from 1998 through 2008, as a percentage of capital funding, the contribution of the federal government fell (from about 50 percent to 40 percent) while the contributions of state governments remained relatively stable (at about 12 percent), and local government funding increased (from 39 percent to 47 percent).
Page 14 GAO-11-94 Public Transportation

Figure 5: Transit Funding Sources—Capital, 1998 and 2008
50%
12%
39% 40%
12%
47%
1%Other(+1 percentage points since 1998)
Federal
State
Local
Federal(-10 percentage points since 1998)
State(no change from 1998)
Local(+8 percentage points since 1998)
Source: GAO analysis of FTA NTD data.
1998 2008
Note: Percentages may not add up to 100 due to rounding and other factors.
Agencies Faced
Challenges and Responded by Adjusting Service, Making New System Investments, and Maintaining Their Existing Systems
Agencies Faced Capacity Constraints and Other Challenges Related to Their Vehicles and Infrastructure
From 1998 through 2008, transit agencies faced challenges when addressing increased ridership demand. More specifically, agencies faced capacity constraints related to limitations of their vehicles (e.g., too few rail cars and buses) and system infrastructure (e.g., platforms that were too short to accommodate longer trains). In particular, several of the heavy rail, light rail, and bus agencies we interviewed experienced
Page 15 GAO-11-94 Public Transportation

capacity constraints within existing vehicles as well as shortages of rail cars and buses. For example, an official with the Ann Arbor Transportation Authority said the agency did not always have the bus capacity to accommodate increased demand, sometimes resulting in overcrowding on buses. In San Francisco, the heavy rail system’s serviceable rail cars were in such high demand that they did not always have enough time to undergo sufficient maintenance, which officials said led to problems with vehicle reliability and a shortage of vehicles. TriMet, which provides light rail services to the metropolitan area of Portland, Oregon, was sometimes unable to meet demand for its services due to vehicle shortages, such as prior to opening a new rail line and new rail cars becoming available. Agency officials said that long lead times for vehicle procurements limited their ability to respond to growing demand in a timely manner, but that they eventually were able to procure additional rail cars to satisfy passenger demand on the new line. Rail car procurements generally take years to complete. We have reported that time frames of 3 to 4 years are considered quick for complete rail car procurements, and many take much longer.26
In addition to vehicle capacity constraints, transit agencies also faced infrastructure-related capacity challenges when addressing increased ridership demand from 1998 through 2008. Most of the agencies that reported infrastructure-related challenges from 1998 through 2008 provided heavy or light rail services.27 Infrastructure constraints, such as those related to stations, tracks, and other facilities, posed challenges to transit agencies. For example, from 1998 through 2008:
• Chicago’s heavy rail system faced challenges related to its platform capacity. Due to the platform limitations of certain heavy rail stations, Chicago Transit Authority officials could only operate six-car trains where eight-car trains would have reduced congestion. These stations’ platforms were not long enough to accommodate passengers loading and unloading from eight-car trains. As a result of capacity constraints at these stations, the agency could not always meet passenger demand or allow all passengers to board.
26GAO, Transit Rail: Potential Rail Car Cost-Saving Strategies Exist, GAO-10-730 (Washington, D.C.: June 30, 2010).
27Heavy rail and light rail agencies typically require large investments in transit infrastructure (e.g., track, signaling and communication systems, complex maintenance facilities, passenger stations, etc.) in comparison to bus systems.
Page 16 GAO-11-94 Public Transportation

• Los Angeles County’s heavy rail system ran out of parking spaces immediately after opening parking lots at the northern end of one of its rail lines. Difficulty securing additional funds for parking structures has limited the agency’s ability to meet parking demand.
• Although Washington, D.C.’s, heavy rail stations were designed to accommodate eight-car trains, associated power systems initially were only equipped to handle four- and six-car trains. Therefore, upgrading the power system components so they could accommodate eight-car trains was a significant challenge that agency officials addressed during the 10-year period in which they worked to expand the system’s overall capacity.
Table 2 summarizes these and other examples of infrastructure-related challenges that heavy rail and light rail agencies faced when addressing increased passenger demand from 1998 through 2008.
Table 2: Examples of Transit Infrastructure-related Challenges, 1998–2008
Station challenges Transit agency examples
Station design Washington, D.C.’s, heavy rail system has reached a level of ridership that has created significant vertical transportation problems at some of the system’s most heavily used stations, such as core downtown stations and major transfer points. Due to a limited number of stairs and escalators within stations, which were not designed to accommodate current ridership levels, maintaining enough working escalators and elevators to transport riders from below-ground platforms to ground level became a problem in 1998-2008.
Terminal design The first and last stations—also known as terminals—on certain lines within New York City’s heavy rail system have less capacity to accommodate trains than other terminals. An example of a low-capacity terminal is the Astoria-Ditmars Boulevard terminal, which can only handle 15 trains per hour because it does not have the track configurations needed to allow approaching trains to enter terminals at full speed. The system’s full-capacity terminals, on the other hand, can accommodate 30 trains or more per hour.
Platform capacity limitations
Due to the platform capacity limitations of certain Chicago Transit Authority stations, the agency could only operate six-car trains where eight-car trains would have alleviated congestion. These stations’ platforms were not long enough to accommodate passengers loading and unloading from eight-car trains. As a result of capacity constraints at these stations, the agency could not always meet passenger demand and sometimes turned away riders.
Page 17 GAO-11-94 Public Transportation

Track challenges Transit agency examples
Track limitations Limitations of the track junctions—locations where tracks merge or diverge—within the New York City heavy rail system reduce train frequencies. For example, the Nostrand Junction, where several rail lines converge, creates a bottleneck for incoming trains due to physical conflicts between train movements. Agency officials would have to completely redesign Nostrand Junction to improve the frequency of train crossings at that junction.
Other challenges Transit agency examples
Insufficient parking Los Angeles County’s heavy rail system ran out of parking spaces immediately after opening park-ride lots at northern end stations of one of its rail lines. Difficulty securing additional funds for parking structures has limited the agency’s ability to meet parking demand.
Shortage of maintenance space
A shortage of workspace in the Bay Area Rapid Transit’s maintenance shops exacerbated maintenance backlogs and contributed to a shortage of vehicles available for service.
Insufficient power Although Washington, D.C.’s, heavy rail stations were designed to accommodate eight-car trains, associated power systems initially were only equipped to handle four- and six-car trains. Therefore, upgrading the power system components so they could accommodate eight-car trains was a significant challenge that agency officials addressed during the 10-year period in which they worked to expand the system’s overall capacity.
Source: GAO analysis of interviews with selected transit agencies.
During this time period, agencies also faced challenges related to maintaining aging infrastructure. Heavy rail agencies in particular have faced challenges related to aging infrastructure because their aging assets have increasingly needed capital reinvestments, even as ridership has grown. For example, officials from the Washington Metropolitan Area Transit Authority said the agency needed to shift its focus from new construction to maintenance during this time period, yet securing funds to maintain existing assets proved more difficult than securing funds for new projects. In addition, balancing scheduled maintenance with expanding hours of service also proved challenging. Light rail officials, such as those at Portland’s TriMet, said they recognize that managing aging infrastructure will take significantly more effort in the future. Currently, the oldest section of TriMet’s system is only 24 years old, which is relatively new in comparison with some of the nation’s oldest systems; however, agency officials have already begun capacity planning in preparation for the challenges to come during the next 20 years.
Many of the transit agencies we interviewed faced budget and funding constraints. In some cases, these constraints limited their ability to
Page 18 GAO-11-94 Public Transportation

increase services to accommodate additional riders. For example, from 1998 through 2008:
• Balancing a constrained operating budget with increased demand for services posed a challenge for Chicago’s heavy rail system. During this time period, the agency’s funding sources—including state capital bonds and general revenues—did not grow enough to fully cover the agency’s maintenance needs and personnel costs, according to transit officials. Because public transit riders typically do not pay for the full cost of their rides, increasing ridership further stressed the Chicago system’s operating budget, according to agency officials. In response, agency officials said they deferred maintenance, which in turn affected the system’s ability to meet demand due to service delays and other maintenance-related problems.
• Merced County Transit, which provides bus services to Merced County in California’s Central Valley, tried to improve service frequencies so that buses could run every 15 minutes instead of every hour. However, agency officials found it very difficult to improve their services and they struggled to retain local transit funds amidst competing funding needs elsewhere in the county. Agency officials ultimately compromised on their goal of increasing service to every 15 minutes and increased service instead to every 30 minutes. Since 2008, available funds have decreased as sales tax revenues and real estate values have plunged, causing transit officials to reduce or eliminate routes and reduce staff positions.
• Dallas Area Rapid Transit, which provides light rail services to the greater Dallas, Texas, area, is funded by a 1-cent local sales tax, which generates revenues annually. From 2001 through 2004, these sales tax revenues declined substantially, according to transit agency officials, requiring the agency to reduce its capital expansion program, use reserve funds to cover budget short falls, and make operational adjustments.
As a result of transit agencies’ challenges meeting ridership demand from 1998 through 2008, some transit agencies faced the added challenge of customer dissatisfaction. For example, as a result of increased crowding on trains, customers developed less favorable opinions of Chicago’s heavy rail system and customer complaints increased, according to transit agency officials. In Ann Arbor, Michigan, transit riders were not always able to board buses during peak ridership periods and ridership studies showed that people continue to want more frequent service on some routes.
Page 19 GAO-11-94 Public Transportation
To meet increased ridership demand from 1998 through 2008, transit agencies took various steps to increase the capacity and efficiency of their existing systems. These actions included making service adjustments and new system investments, in addition to maintaining their existing systems. For example, from 1998 through 2008:
• Service adjustments, such as extending service hours and adjusting routes, helped agencies make better use of available resources and target areas of high demand. For example, the light rail agency in Sacramento, California, extended service hours during a period of high demand in 2008 when an interstate highway in the area was under construction. During this time period, which coincided with an increase in gas prices, there was standing room only on the line that serviced that particular area and some riders could not get onto a train. In response, transit officials ran longer trains and extended service hours, thereby creating additional capacity and accommodating the increase in demand.
Agencies Addressed Increased Ridership Demand by Adjusting Service, Making New System Investments, and Maintaining Their Existing Systems
• New system investments, such as expanding vehicle fleets, extending platforms, building new stations, and adding parking, allowed agencies to accommodate more riders and improve their operations and customer service. For example, in response to challenges posed by limited space at maintenance facilities, San Francisco’s heavy rail agency expanded its maintenance facilities, which allowed the transit agency to increase its maintenance operations and, ultimately, increase the availability of serviceable rail cars.
• Maintaining existing systems, including vehicles and infrastructure, allowed agencies to accommodate more riders, increase the frequency of their service, and come into compliance with laws and regulations, such as the Americans with Disabilities Act of 1990, as amended.28 For example, transit officials at the MTA in New York City, New York, said the agency improved the heavy rail system’s signaling systems in order to sustain current levels of service and also enable the agency to increase frequency of service. Officials explained that the improved signaling system will increase capacity by allowing trains to be spaced more closely.
28The Americans with Disabilities Act of 1990 sets a variety of standards for addressing discrimination against individuals with disabilities. See 42 U.S.C. § 12101.
Page 20 GAO-11-94 Public Transportation

Table 3 summarizes other examples of actions that heavy rail, light rail, and bus agencies took to address growing ridership demand from 1998 through 2008.
Table 3: Examples of Actions Taken by Transit Agencies to Meet Demand, 1998–2008
Service adjustments Transit agency examples
Adjusting services As ridership increased on one of its light rail lines, Dallas Area Rapid Transit increased the frequency of peak hour services.
Adding new services NJ Transit officials initiated light rail service on their recently constructed Hudson-Bergen and River light rail lines to spur and accommodate economic development and any ridership increases associated with these developments
Extending service hours The light rail service provider in Sacramento, California, extended service hours during periods of increased ridership.
Adjusting routes Some agencies, such as Ann Arbor’s municipal bus service provider, adjusted their routes to better meet the needs of their customers. Ann Arbor bus officials improved the directness of certain routes by launching service from the west side of town straight to the University of Michigan campus so that passengers previously riding less-direct routes would not have to change buses.
Adjusting or increasing fares Some agencies altered their fare schedules. For example, Washington, D.C.’s, heavy rail system increased fares during peak hours to better manage peak demand and create incentives for riders to travel during off-peak hours.
Assessing needs Some agencies conducted needs assessments to better align their services with riders’ needs. Merced County Transit, which operates bus services for California’s Merced County, for example, conducted ridership surveys to better understand riders’ needs. From these surveys, transit agency officials gained a better understanding of where, when, and why riders board most frequently. This information helped them understand how to modify service schedules to better meet the needs of their riders.
New system investments Transit agency examples
Expanding fleets Among other cities, Denver, Colorado, expanded its light rail fleet in response to increased ridership. Because the city rapidly expanded its rail system from 4.5 miles of track in 1998 to more than 35 miles of light rail lines by 2008, ridership on the light rail system grew quickly and far exceeded ridership forecasts. The early ridership forecasts underestimated demand for the new service, which led to capacity constraints on the original light rail line. In response to capacity constraints, transit agency officials purchased additional rail cars.
Extending platforms Dallas’s light rail system extended its platforms to accommodate longer trains and more riders.
Increasing maintenance space
The San Francisco Bay Area’s heavy rail system expanded its maintenance facilities, which allowed the system to increase its maintenance operations and, ultimately, increase the availability of serviceable rail cars.
Adding parking Several agencies responded to increased passenger demand by expanding their parking capacity. NJ Transit, Dallas Area Rapid Transit, and the Los Angeles County Metropolitan Transportation Authority were among the transit agencies that increased their parking capacity.
Purchasing new technologies
Several agencies adopted new technologies to improve their operations and customer service. For example, Ann Arbor’s bus agency began offering riders real-time information using an advanced operating system, which included automatic vehicle location, bus diagnostic, and electronic fare box technologies
Adding new stations or extending existing lines
Some agencies added new stations and extended their lines. For example, San Francisco’s heavy rail system added a new station in between two other stations along the Dublin/Pleasanton line and an extension to San Francisco International Airport. NJ Transit extended light rail lines and added new stations on those lines to attract new riders and better service existing riders.
Page 21 GAO-11-94 Public Transportation

Maintaining existing systems
Transit agency examples
Rehabilitating or reconfiguring fleets
Some agencies either rehabilitated or reconfigured their fleets. Reconfiguring cars increased standing space and allowed agencies to accommodate more passengers.
Replacing vehicles Some agencies replaced existing vehicles with new vehicles to better meet passenger demand. For example, Ann Arbor’s bus agency replaced its fleet with low-floor buses, which an agency official said are more comfortable for standing passengers, in part, because there is less swaying when passengers are low to the ground.
Making track improvements Some agencies made track improvements to improve service frequency and reliability. For example, before San Francisco’s heavy rail system officials undertook one track improvement project, trains coming from the system’s center would have to travel to the last station at the end of the line to turn around. Now, trains can turn back sooner, which has allowed the agency to improve its single-tracking functions and operate trains in both directions. As a result, agency officials have been able to make better use of available trains because trains that would otherwise have had to travel to the end of the line can now re-enter the service pattern sooner.
Updating stations Some agencies updated their stations to improve stations’ loading times, comfort, perceived safety, and accessibility to persons with disabilities. For example, Dallas Area Rapid Transit expanded some light rail station platforms to improve loading of passengers with disabilities, strollers, and bicycles. This improved the efficiency of trains throughout the system.
Updating signaling systems Some agencies improved their signaling systems to maintain current levels of service and increase frequency of service. For example, New York City’s heavy rail agency installed a communications-based train control system on the L Canarsie line, which will eventually increase capacity by allowing trains to be spaced more closely.
Source: GAO analysis of interviews with selected transit agencies.
Agencies Experienced Varying Degrees of Success in Meeting Increased Ridership Demand
Transit agencies experienced varying degrees of success in meeting increased ridership demand from 1998 through 2008. Most heavy rail agency officials we spoke with said they generally met growing demand, and one reported partial success in meeting demand. For example, transit agency officials in Washington, D.C., reported that although heavy rail services generally met rising demand, the agency faced challenges accommodating high demand while working to expand its system and maintain its aging assets. Community and business groups added they would like to see the city’s heavy rail capacity increased to help relieve congestion in the system and increase the reliability of service.
Light rail agency officials with whom we spoke were divided about the extent to which their agencies successfully met ridership demand from 1998 through 2008. Several said they were generally successful in meeting growing demand. However, two said they either barely or inadequately met demand. For example, Sacramento’s light rail service provider reported that the agency’s service area did not keep up with the area’s growing population and housing boom from 1998 through 2008. Officials from a local agency and community group said the transit agency met demand within the city of Sacramento fairly well, and the system had
Page 22 GAO-11-94 Public Transportation

enough capacity to meet those riders’ needs. However, they added that as the area developed housing and employment centers outside the downtown area, the agency was not always able to meet the needs of commuters from outlying or newer-growth areas. Nor was the agency always able to meet the needs of potential riders who chose to drive rather than use public transit due to inconvenient transfers or a shortage of transit services, according to the community group official.
All five bus agencies we interviewed had limited success in meeting ridership demand. Some agencies could not add the services needed to accommodate increasing demand. Others had to turn away riders, while others reported that their ability to expand to meet the needs of emerging markets was limited. For example, a transit official from Ann Arbor’s bus agency said the agency was generally successful in meeting demand within the city of Ann Arbor, but was not as successful in surrounding communities due to funding constraints. Representatives of a local community group and intergovernmental agency added that the agency turned away riders during periods of high demand and service on many routes was too infrequent. However, local officials, as well as community and business groups, acknowledged the efforts the agency has made to respond to increased ridership demand amidst funding and resource challenges.
Page 23 GAO-11-94 Public Transportation

Demographic Changes Point to Future Increases in Ridership Demand, but Cost Increases and Fiscal Uncertainties May Limit Agencies’ Ability to Meet Demand
Population Increases and Other Demographic Trends May Increase Future Demand
Estimates for future population growth and other demographic trends point to potential increases in future ridership demand. According to U.S. Census Bureau projections, the U.S. population will increase by 20.4 percent from 2010 to 2030. Demographic changes point to increases in future demand as well.
Trends in growing redevelopment and increased densities in the urban core, as well as continued growth of housing and employment centers near outlying suburban transit hubs, are expected to contribute to future increases in ridership demand. Additionally, increased focus on transit-oriented development around transit stations in both urban and suburban areas may also increase future ridership demand.29 For example, the regional planning agency in the San Francisco Bay Area anticipates a substantial amount of continued growth and redevelopment of San Francisco’s urban core. Transit agency officials also noted that while San Francisco used to be the principal destination for employers, areas outside of the city, such as Walnut Creek, Dublin, Pleasanton, and San Jose, are increasingly attracting employment centers, which has increased traffic on
29Transit-oriented developments are seen as compact, mixed-use, walkable neighborhoods located near transit facilities. See GAO, Affordable Housing in Transit-Oriented Development: Key Practices Could Enhance Recent Collaboration Efforts between DOT-
FTA and HUD, GAO-09-871 (Washington, D.C.: Sept. 9, 2009), and Public Transportation: Federal Role in Value Capture Strategies for Transit Is Limited, but Additional Guidance Could Help Clarify Policies, GAO-10-781 (Washington, D.C.: July 29, 2010).
Page 24 GAO-11-94 Public Transportation

reverse commute routes. Furthermore, the transit agency is collaborating with others to encourage transit-oriented developments near transit stations. Property values have held steady near transit stations as compared with declines in property values in other areas.30 For example, according to transit agency officials, to date, property values in the city of San Francisco were barely impacted by the housing downturn, whereas areas further out with less access to transit were impacted more greatly, indicating that people are starting to see the value of living near public transit.
Increases in the transportation-disadvantaged populations31—those who must rely on public transit for their travel—may also increase future ridership demand. For example, according to the U.S. Census Bureau, in 2030, baby boomers aged 65 and older will comprise nearly 20 percent of all U.S. residents. Transit officials that we spoke with said that individuals may become increasingly transit-dependent as they age. Transit officials in Ithaca, New York, anticipate a peak in their senior population starting around 2020 and expect that as people retire, they may stop driving personal vehicles, which may contribute to increases in transit ridership. Also, according to transit officials in Portland, Oregon, the prominence of the aging demographic will become more noticeable as the baby boomers age “in place” (i.e., remain in the Portland metropolitan area). Over time, officials said that accommodating the aging population on bus and light rail services and providing transit services that are accessible, comfortable, and safe will be challenging but critical. However, officials added that accommodating the expected increase in seniors is an important consideration for transit agencies, especially because
30We have previously reported that plans for transit stations and amenities commonly found in transit-oriented developments generally increase nearby land and housing values. See GAO-09-871.
31For the purposes of this report, transportation-disadvantaged populations can include numerous categories of people without personal vehicles, such as: the elderly and persons with disabilities who have mobility impairments that preclude them from driving or who need medical equipment in order to travel; low-income, homeless, or transient persons who do not have a permanent residence or who do not own or have access to a personal vehicle; children without an adult present during a disaster; tourists and commuters who are frequent users of public transportation; those with limited English proficiency who tend to rely on public transit more than English speakers; or those who, for any other reason, do not own or have access to a personal vehicle.
Page 25 GAO-11-94 Public Transportation

complementary paratransit service,32 the alternative for individuals unable to use fixed-route transit service, is more expensive to provide per rider. We previously reported that it is difficult for transit agencies to balance providing complementary paratransit service with the increased cost of accommodating a growing ridership.33 Additionally, increased densities in urban areas may increase transit-dependent populations, where transit is a mode of necessity for many city residents.34 In Dallas, Texas, and Frederick, Maryland, transit agency officials also noted increases in the low-income population, who rely upon transit to get to their jobs primarily within the service sector, which they anticipate will increase transit ridership demand in these areas.
Transit agency officials and others with whom we spoke also identified an expectation that discretionary riders35 will impact future increases in ridership demand. Specifically, they expect that a younger demographic will migrate into cities and increasingly use transit, consistent with their quality-of-life preferences and environmental concerns. For example, Ann Arbor business community representatives told us that an increasingly younger workforce commutes from nearby communities where housing is cheaper and prefers to take transit. According to transit agency officials in Portland, Oregon, there is a growing younger population with certain lifestyle expectations, including the ability to walk, bike, or take transit to meet most of their transportation needs.
Although transit agency officials anticipate future ridership increases, the extent of this increase is sometimes difficult to determine. We previously reported that some metropolitan planning organizations face challenges in travel demand forecasting, including a lack of technical capacity and data
32Complementary paratransit service generally means providing paratransit services to individuals with disabilities that is comparable to the level of designated public transportation services provided to individuals without disabilities. The Americans with Disabilities Act of 1990 considers it discrimination for a public entity that operates a fixed route system (other than a system which provides solely commuter bus service) to fail to provide this complementary paratransit service. 42 U.S.C. § 12143. See also 49 C.F.R. part 73, subpart F.
33See GAO, Transportation Accessibility: Lack of Data and Limited Enforcement Options Limit Federal Oversight, GAO-07-1126 (Washington, D.C.: Sept. 19, 2007).
34The Brookings Institution, State of Metropolitan America: On the Front Lines of Demographic Transformation (Washington, D.C., 2010).
35Discretionary riders are people who have the option to drive, but choose to take public transit.
Page 26 GAO-11-94 Public Transportation
necessary to conduct complex transportation modeling required to meet their planning needs.36 Some transit agency officials with whom we spoke also noted that a lack of technical expertise and resources needed to accurately forecast future ridership growth is a challenge. According to FTA officials, difficulties transit agencies may have in assessing the demand for existing or new services could affect their ability to meet future demand. Specifically, if future ridership demand is not accurately projected, transit agencies may not make the best investment of their resources.
Agencies’ Increased Costs and Fiscal Uncertainties May Limit Their Ability to Meet Future Increases in Ridership Demand
Transit agency officials expressed concern about their agencies’ abilities to meet future increases in ridership demand for two principal reasons: increased costs and various fiscal uncertainties.
Future costs for transit agencies will increase because agencies must continue to support system expansions and add capacity to accommodate for increases in ridership demand, as well as address additional expenses associated with maintaining a state of good repair for aging infrastructure. According to FTA, aging capital assets drive increasing maintenance costs and limit the ability to expand system capacity at a time of high demand. FTA has also reported that roughly one-third (29 percent) of all transit assets are in poor or marginal condition, implying that these assets are near or have already exceeded their expected useful life and need significant capital reinvestment for rehabilitation or replacement.37 Based on FTA’s most recent estimates, $77.7 billion is needed to bring all the nation’s transit systems into a state of good repair. In addition, an annual average of $14.4 billion would be required to maintain the systems.38
Increased Costs
36Metropolitan planning organizations, representing local governments and working in coordination with state departments of transportation and major providers of transportation services, have responsibility for the regional transportation planning processes in urbanized areas. See GAO, Metropolitan Planning Organizations: Options Exist to Enhance Transportation Planning Capacity and Federal Oversight, GAO-09-868 (Washington, D.C.: Sept. 9, 2010).
37FTA, National State of Good Repair Assessment (Washington, D.C., June 2010).
38FTA, National State of Good Repair Assessment (Washington, D.C., June 2010).
Page 27 GAO-11-94 Public Transportation
Officials from heavy rail and light rail agencies with whom we spoke in particular said they anticipate facing increasingly difficult challenges related to maintaining a state of good repair and operating their systems as they continue to age. For example, in Chicago, increasing ridership on the heavy rail transit system placed a significant amount of stress on the agency’s operating budget. As a result, the agency deferred maintenance, which in turn impacted its ability to meet demand due to service delays and other maintenance-related problems on the aging system. Since 2008, challenges related to the agency’s operating budget have persisted, and, starting in February 2010, the agency had to implement $100 million in service cuts to help balance its budget. Also, officials from the heavy rail agency in Washington, D.C., said the challenge of maintaining and repairing their aging system increased from 1998 through 2008, and they expect this trend to continue. Washington, D.C., transit officials said that before 1998 the agency focused on constructing and expanding a new system. In 1998, the system’s 103 miles of track had not been completely built, but the oldest part of the system was only 22 years old. However, by 2008, the oldest portion of the system was 32 years old and officials said they needed to devote significant resources to maintaining the system.39
As compared with the majority of the large heavy rail systems, the infrastructures of light rail systems are relatively newer. For example, the oldest section of Portland, Oregon’s, light rail system is 24 years old, as compared with the heavy rail systems in Chicago and New York which are over 100 years old. However, although officials at Portland’s transit agency said they have a robust capital maintenance program, they also said that without an influx of American Recovery and Reinvestment Act of 2009 (Recovery Act)40 funding in 2009, which the agency specifically targeted to help reduce a backlog of systems and vehicle maintenance, the transit agency would have fallen further behind in its maintenance needs. For NJ Transit, the light rail extension of the Newark line was financially challenging because of the line’s aging infrastructure. In order to extend the line, the agency had to upgrade the entire track and signaling system, while undergoing other maintenance-related expenses such as the maintenance and rehabilitation of transit stations and vehicles, as well as maintaining a general state of good repair of the system as a whole.
39FTA’s minimum useful life is 12 years for 40-foot buses and 25 years for rail vehicles. Generally, transit agencies assume a longer minimum useful life of their assets. For example, one transit agency assumes 15 years for buses and 35 years for rail vehicles.
40Pub. L. No. 111-5, 123 Stat. 115 (2009).
Page 28 GAO-11-94 Public Transportation
Further, transit agency officials anticipated that increases in the costs associated with providing paratransit services necessitated by projected demographic changes, such as increases in the transit-dependent population, would be a challenge looking ahead.
Due to operating deficits that states and localities currently face, state and local governments may not be able to continue their past level of support which may ultimately limit transit agencies’ ability to meet future increases in ridership demand. Officials from the agencies with whom we spoke said that since 2008, the economic downturn has put a strain on all sources of funding for transit agencies, particularly state and local sources of funding. We have reported that states and localities face near-term budget and long-term fiscal challenges that will grow over time.41 States’ revenue shortfalls have been cushioned by the temporary infusion of Recovery Act funds.42 For example, we found that officials in local governments used Recovery Act funds to maintain services, retain staff positions, or begin infrastructure and public works projects that otherwise would have been delayed or canceled. However, local government officials also reported they experienced revenue declines and budget gaps even after incorporating Recovery Act funds in their budgets. Officials at some localities reported that while these funds have helped to preserve services, they still faced budget deficits for the remainder of fiscal year 2010 and the next fiscal year.43 We also previously reported that state and local governments face increasing fiscal challenges in the next 50 years and these pressures have implications for federal programs. For example, estimates of the costs to repair, replace, or upgrade aging infrastructure so that it can safely, efficiently, and reliably meet current demands, as well as expand capacity to meet increasing demands, top hundreds of billions of dollars. The nation’s transit infrastructure is owned, funded, and operated by all levels of government. In this environment, all levels of government
Fiscal Uncertainties
41GAO, State and Local Governments’ Fiscal Outlook: March 2010 Update, GAO-10-358 (Washington, D.C.: Mar. 2, 2010).
42GAO, State and Local Governments: Fiscal Pressures Could Have Implications for Future Delivery of Intergovernmental Programs, GAO-10-899 (Washington, D.C.: July 30, 2010).
43GAO, Recovery Act: States’ and Localities’ Uses of Funds and Actions Needed to Address Implementation Challenges and Bolster Accountability, GAO-10-604 (Washington, D.C.: May 26, 2010).
Page 29 GAO-11-94 Public Transportation

will compete for resources to meet the demand for infrastructure improvements, which may exceed what the nation can afford.44
As previously discussed, from 1998 through 2008, while overall transit revenues (including operating and capital funding) increased, increases in the share of state and local government funding offset decreases in the share of other nonfederal funding sources, such as passenger fares. In addition, while in 1998 the federal government was the largest source of capital investment in transit, by 2008 this was no longer the case. Instead, local government replaced the federal government as the largest source. However, as state and local governments are currently facing budget shortfalls, transit agency officials raised concerns that fiscal uncertainties may limit their agencies’ ability to meet future increases in ridership demand. For example, the state of California eliminated all state transit development assistance for state fiscal years 2009 and 2010 because of the state’s fiscal situation, and it has only been partially restored for 2011. Officials from Merced County Transit in California said the bus agency’s biggest challenges will be insufficient operating funds due to the elimination of state transit development assistance and a decrease in local sales tax revenue, which will not allow for any bus service expansions. Similarly, light rail officials from Sacramento Regional Transit, which also operates in California, said the agency is struggling to survive the economic downturn given a major cut in state transit assistance (which was approximately $15 million to $16 million each year and nearly 10 percent of its total operating budget), declining local sales tax revenues, and widespread state employee furloughs, which have impacted farebox revenues. Additionally, according to transit agency officials we spoke with, the uncertainty of federal funding levels with the pending surface transportation reauthorization combined with anticipated decreases in state and local funding poses challenges for long-term planning.
Options Exist to More Effectively Deliver Federal Surface Transportation Programs and Help Transit Agencies Meet Increased Ridership Demand
We and others have reported on ways to more effectively deliver federal surface transportation programs that could help transit agencies address growing ridership demand amid fiscal uncertainties. While officials from all 15 transit agencies we spoke with said federal grant programs are critical to maintaining and operating their transit systems, including addressing growing ridership demand, most agency officials also said that additional federal funding would help their agencies accommodate future
44GAO-10-899.
Page 30 GAO-11-94 Public Transportation

increases in ridership. However, the nation faces mounting fiscal difficulties and although demand on transit systems is expected to grow, increased federal financial support is not something transit agencies can count on. Therefore, the challenge is to focus the resources that are available to effectively maximize the impact on transit agencies’ services. We and others have made recommendations to Congress and others about how to restructure federal programs to better assist transit agencies and the federal government in focusing scarce resources and addressing future ridership demand, including:
• focusing resources on maintaining the nation’s rail and bus systems in a state of good repair;
• streamlining the delivery of federal grant programs and projects; and
• incorporating performance accountability into federal programs.45
A critical component of addressing future ridership demand is the need for the federal government and transit agencies to focus on transit systems’ state of good repair.46 When a system is not maintained in a state of good repair and needed maintenance is deferred, it is difficult to address future ridership demand because the system is not operating at optimal levels. This could ultimately lead to a loss of riders due to resulting problems, such as service delays and safety issues.
State of Good Repair
According to FTA, bringing the nation’s transit system to a state of good repair, while at the same time planning for and implementing needed service expansions to accommodate demand, will be a significant challenge. Despite ongoing investment, many of the nation’s vehicles and much of its infrastructure are deteriorating. For transit riders, this deterioration eventually leads to declining service reliability. For transit
45Performance accountability is defined as the mechanisms by which individuals or organizations are held accountable for meeting specified performance-related expectations.
46FTA considers assets to be in a “state of good repair” if their condition is rated to be above the middle of the “marginal” range on the condition rating scale that FTA uses for its economic requirements reports (i.e., 1-2 is considered poor, 2-3 is considered marginal, 3-4 is considered adequate, 4-4.8 is considered good, and 4.8-5 is considered excellent). Assets rated below this condition (i.e., less than 2.5) are considered to have passed their useful life and need to be rebuilt or replaced. A working definition of a system in a state of good repair is that all its operating assets are above this condition threshold.
Page 31 GAO-11-94 Public Transportation

operators, aging capital assets drive increasing maintenance costs and limit the ability to expand system capacity at a time of high demand.47 The President’s fiscal year 2011 budget request included, for FTA, a new State of Good Repair initiative for bus and rail transit agencies to bring infrastructure into a state of good repair. The proposed initiative combines two existing programs, namely the Fixed Guideway Modernization Program (49 U.S.C. § 5309(b)(2)) and the Bus and Bus Facilities Program (49 U.S.C. §§ 5309(b)(3), 5318), and would provide $2.9 billion for fiscal year 2011, an 8 percent increase over the combined programs’ fiscal year 2010 level of funding. The President has submitted his budget request to Congress.48 In addition, the Committee on Transportation and Infrastructure of the U.S. House of Representatives issued A Blueprint for
Investment and Reform (Blueprint) in 2009, which is a summary of a proposal for the pending reauthorization of the surface transportation legislation.49 It focuses the majority of transit funding into four core categories, one of which is to bring urban and rural public transit systems to a state of good repair.50
Officials from the majority of transit agencies with whom we spoke emphasized the importance of maintaining a state of good repair in order to meet future increases in ridership demand. However, agency officials pointed out it is easier to procure additional federal funding to support new transit capital projects than to obtain funding to help maintain their existing vehicles and infrastructure. Transit agency officials explained that their agencies rely on annual federal transit formula funds to address ongoing needs, but additional federal funds available beyond those yearly allocations are focused on new capital investments as opposed to maintaining a state of good repair. Further, when asked how federal grants could be improved to better help transit agencies address ridership demand, agency officials reported that flexibility in how funding could be
47FTA, Transit State of Good Repair: Beginning the Dialogue (Washington, D.C., October 2008).
48U.S. Department of Transportation, Fiscal Year 2011 Budget Highlights (Washington, D.C., Feb. 1, 2010).
49U.S. House of Representatives, Committee on Transportation and Infrastructure, The Surface Transportation Authorization Act of 2009: A Blueprint for Investment and Reform Executive Summary (Washington, D.C., June 18, 2009).
50U.S. House of Representatives, Committee on Transportation and Infrastructure, The Surface Transportation Authorization Act of 2009: A Blueprint for Investment and Reform Executive Summary (Washington, D.C., June 18, 2009).
Page 32 GAO-11-94 Public Transportation

used, either for capital or operating purposes based on an agency’s needs, would be particularly helpful for efforts to maintain a state of good repair and other core capacity issues. Transit agency officials also indicated that if their systems’ state of good repair needs are not met and infrastructure maintenance is deferred, they will not be able to efficiently and effectively address future ridership demand.
Further, the National Surface Transportation Policy and Revenue Study Commission,51 which was required by SAFETEA-LU to study and identify key areas for federal focus for the nation’s surface transportation system, concluded that the area of highest priority—and the foundation for all of the report’s other recommendations52—was to bring the nation’s infrastructure, including transit assets, into a state of good repair. Specifically, the Commission stated that states, local governments, and other entities must develop, fund, and implement a program of asset maintenance and support over the useful life of the asset in order to assure the maximum effectiveness of federal capital support.53 According to FTA, currently only a few transit agencies actively maintain transit asset inventories for capital planning purposes and there is no federal reporting requirement for transit assets except for vehicles. However, FTA officials added that while some data on fixed infrastructure are collected in the NTD, they are limited in scope. FTA also noted that a comprehensive and effective asset management program could help transit agencies establish organizational state of good repair objectives, assess the magnitude of the issue, better coordinate agency planning and decision-making functions, and ultimately help transit agencies prioritize their most critical needs, especially with scarce funds for state of good repair and deferred
51The National Surface Transportation Policy and Revenue Study Commission was established by SAFETEA-LU. Among other things, the Commission was required to conduct a comprehensive study of the current condition and future needs of the surface transportation system, evaluate possible funding alternatives, and develop a conceptual plan, with alternative approaches, to ensure that the surface transportation system will continue to serve the needs of the United States. Pub. L. No. 109-59, § 1909, 119 Stat. 1144, 1471-1477 (2005).
52National Surface Transportation Policy and Revenue Study Commission, Report of the National Surface Transportation Policy and Revenue Study Commission: Transportation for Tomorrow (Washington, D.C., December 2007).
53National Surface Transportation Policy and Revenue Study Commission, Report of the National Surface Transportation Policy and Revenue Study Commission: Transportation for Tomorrow (Washington, D.C., December 2007).
Page 33 GAO-11-94 Public Transportation

maintenance backlogs.54 Additionally, the Senate report accompanying the fiscal year 2010 appropriations bill for the Department of Transportation (DOT), directed FTA to take a leadership role in improving the use of asset management practices among transit agencies.55 According to FTA officials, in response to this congressional direction, FTA is undertaking a new initiative to provide technical assistance and develop new data resources to help transit agencies improve their asset management practices. FTA officials added that this initiative is intended to promote a better understanding of how the industry can achieve state of good repair goals.
We and others have recommended that the current federal grant approval process for large transit capital projects be simplified and streamlined to speed up project delivery and reduce costs. This includes streamlining the delivery of federal transportation grant programs such as the New Starts project planning and development approval process and the required environmental reviews.56 The New Starts program is the primary federal source for major transit capital investments for construction of new fixed guideway systems or extensions to existing systems. Transit agency officials indicated that New Starts funding helped their agencies address increases in ridership demand.57 However, officials from nearly half of the heavy and light rail transit agencies with whom we spoke also said it would be helpful if the federal grant process were more streamlined and efficient. Agency officials explained that the development and approval process for large transit capital projects can be lengthy. Further, the process can become more difficult as agencies are concurrently trying to use the finite resources they have to accommodate growing demand.
Streamlining the Delivery of Federal Grant Programs and Projects
In prior work, we recommended that DOT assess streamlining options, such as combining project phases, for the New Starts program.58 We also
54FTA, Transit State of Good Repair: Beginning the Dialogue (Washington, D.C., October 2008).
55See S. Report 111-69, at 88 (2009).
56GAO, Public Transportation: Better Data Needed to Assess Length of New Starts Process, and Options Exist to Expedite Project Development, GAO-09-784 (Washington, D.C.: Aug. 6, 2009), and Highway Infrastructure: Stakeholders’ Views on Time to Conduct Environmental Reviews of Highway Projects, GAO-03-534 (Washington, D.C.: May 23, 2003).
5749 U.S.C. § 5309.
58GAO-09-784.
Page 34 GAO-11-94 Public Transportation
recommended that DOT seek legislative changes, if necessary, to implement options to expedite the New Starts process. DOT agreed with our recommendations noting that the options identified are consistent with the options that FTA has been discussing with transit stakeholders and congressional staff. However, while each option could help expedite the process, each option has advantages and disadvantages to consider. For example, each option would likely require certain trade-offs, namely, potentially reducing the level of rigor in the evaluation process in exchange for a more streamlined process.59 As we have previously reported, the length of the New Starts process is due, at least in part, to the rigorous and systematic evaluation and rating process required by law.60 The rigor of the program is intended to help FTA hold transit agencies accountable for results, maximize the benefits of each dollar invested, and ensure that the federal obligation to the project is not affected by cost and schedule overruns.61 Our previous work has also identified delays in the New Starts project development process due to FTA’s project management oversight. According to some project sponsors, in some cases, addressing additional oversight requirements has increased the time and resources required by the project sponsor which also increases total project costs. However, finding the right balance between protecting federal investments through project management oversight and advancing large transit capital projects through the project development process is difficult.62 In addition, transit agencies currently work within the statutory and regulatory constraints of the New Starts program, and streamlining can only be done within these confines or through legislative changes.
The Committee on Transportation and Infrastructure of the U.S. House of Representatives’ Blueprint also proposes that the New Starts program be restructured to speed project delivery, ensure all benefits of the proposed
59For more information on GAO’s recommendations on how to streamline the New Starts project development process, see GAO-09-784.
60GAO, Public Transportation: Future Demand Is Likely for New Starts and Small Starts Programs, but Improvements Needed to the Small Starts Application Process, GAO-07-917 (Washington, D.C.: July 27, 2007).
61GAO, Public Transportation: Opportunities Exist to Improve the Communication and Transparency of Changes Made to the New Starts Program, GAO-05-674 (Washington, D.C.: June 28, 2005), and GAO-07-917.
62GAO, Public Transportation: Use of Contractors Is Generally Enhancing Transit Project Oversight, and FTA Is Taking Actions to Address Some Stakeholder Concerns, GAO-10-909 (Washington, D.C.: Sept. 14, 2010).
Page 35 GAO-11-94 Public Transportation

projects are fully evaluated, and provide a level playing field for local decision making. In addition, to reduce unnecessary delays in the delivery of transit projects, it proposes that an office within FTA be created to improve the process by eliminating duplication in documentation and procedures and expediting the development of projects through the environmental review process, design, and construction.63
Furthermore, the National Surface Transportation Policy and Revenue Study Commission notes that overall project delivery times and costs of major transportation projects could be reduced by shortening the time to complete environmental reviews in conjunction with other measures that address conventional strategies for implementing projects once they clear environmental review. Due to the rapid increase in construction costs in recent years, delays in completing projects have become very expensive, according to the Commission. The Commission identified two sources of delay that should be addressed in the short term: redundancies in the National Environmental Policy Act of 1969 (NEPA)64 process and delays associated with obtaining permit approvals.65 We have previously reported on the time taken to conduct environmental reviews of highway projects and found that stakeholders identified various aspects of the environmental review process they believed added more time than was necessary. For example, some stakeholders said that federal agencies
63U.S. House of Representatives, Committee on Transportation and Infrastructure, The Surface Transportation Authorization Act of 2009: A Blueprint for Investment and Reform Executive Summary (Washington, D.C., June 18, 2009).
64The early stages of the New Starts project development process, including alternatives analysis and much of preliminary engineering, are carried out in concert with the metropolitan planning process specified by SAFETEA-LU and the environmental review processes required by NEPA, 42 U.S.C. § 4321 et seq. GAO-09-784. Among other things, NEPA requires agencies to consider and potentially mitigate potential environmental degradation resulting from federally funded infrastructure projects before these projects move forward. Specifically, FTA is to ensure that project sponsors complete the environmental review process, as prescribed in NEPA and its implementing regulations, in order to receive federal funding.
65National Surface Transportation Policy and Revenue Study Commission, Report of the National Surface Transportation Policy and Revenue Study Commission: Transportation for Tomorrow (Washington, D.C., December 2007).
Page 36 GAO-11-94 Public Transportation

lacked sufficient staff to handle their workloads and that meeting certain statutory criteria are too time consuming.66
Another way to focus scarce resources while addressing the challenges of future ridership demand could be to incorporate greater performance and accountability into federal programs to best achieve intended outcomes. Most federal surface transportation programs lack a link between funding and the performance of a transit system or grantee. We have previously reported that federal transit grant programs—as well as highway and safety grant programs—distribute funds through formulas that are typically not linked to performance and, in many cases, have only an indirect relationship to need.67 Furthermore, these programs generally are not linked to the federal objectives they are intended to address, in part due to the wide discretion granted to states and localities in using most federal funds. To address these findings, we recommended that Congress consider re-examining and refocusing surface transportation programs so that they have goals with direct links to an identified federal interest and role, making grantees more accountable through more performance-based links between funding and program outcomes, among other things. In some cases, the federal government and state and local grantees may have different goals, and national priorities may not be considered by grantees even when federal funding is involved. In prior work, we also recommended that the Director of the Office of Management and Budget work with agencies and Congress to encourage the use of performance accountability mechanisms in grant design and implementation and promote knowledge transfer among agencies and grantees.68
Incorporating Performance Accountability Measures
As we have previously reported, performance measures should vary according to program goals and there is no “one-size-fits-all” solution—careful consideration should be taken when implementing these
66See GAO-03-534. Related GAO work includes Transportation Planning: State and Metropolitan Planning Agencies Report Using Varied Methods to Consider Ecosystem Conservation, GAO-04-536 (Washington, D.C.: May 17, 2004), and Highways and Environment: Transportation Agencies Are Acting to Involve Others in Planning and Environmental Decisions, GAO-08-512R (Washington, D.C.: Apr. 25, 2008).
67GAO, Surface Transportation: Restructured Federal Approach Needed for More Focused, Performance-Based, and Sustainable Programs, GAO-08-400 (Washington, D.C.: Mar. 6, 2008).
68GAO, Grants Management: Enhancing Performance Accountability Provisions Could Lead to Better Results, GAO-06-1046 (Washington, D.C.: Sept. 29, 2006).
Page 37 GAO-11-94 Public Transportation

mechanisms.69 Nevertheless, we and other experts have identified key criteria for developing performance measures that could be implemented, for example, in transportation programs, including:70
• Develop a minimum set of performance measures that can be linked to a limited number of high-level national goals and consistently applied across state and local agencies.
• Develop measures that demonstrate progress over time, rather than measures tied to short-term targets.
• Develop measures that emphasize incentives, training, and support, rather than penalties, as a preferred way to advance performance.
However, some surface transportation programs are moving toward using performance measures in distributing grants. For example, the National Highway Traffic Safety Administration (NHTSA) administers the Section 408 grant program that provides funding for states’ traffic safety data systems and improvements, which better allow states to measure transportation performance.71 To measure performance, a state, as part of its required strategic plan, must develop goals, or desired outcomes, by which to determine program success.72
We have recently reported that while some federal transit programs distribute funds based partly on performance, opportunities to improve grant recipients’ performance accountability remain.73 For example, in November 2010 we reported that one of six formula-based FTA transit
69GAO, Federal Transit Programs: Federal Transit Administration Has Opportunities to Improve Performance Accountability, GAO-11-54 (Washington, D.C.: Anticipated Nov. 17, 2010).
70GAO, Executive Guide: Effectively Implementing the Government Performance and Results Act, GAO/GGD-96-118 (Washington, D.C.: June 1996); DOT, International Technology Scanning Program, Linking Transportation Performance and Accountability (Washington, D.C., January 2010; and, Bipartisan Policy Center, National Transportation Policy Project, Performance Driven: A New Vision for U.S. Transportation Policy (Washington, D.C., June 9, 2009).
7123 U.S.C. § 408.
72See GAO, Traffic Safety Data: State Data Quality Varies and Limited Resources and Coordination Can Inhibit Further Progress, GAO-10-454 (Washington, D.C.: Apr. 15, 2010).
73GAO-11-54.
Page 38 GAO-11-94 Public Transportation

grant programs we reviewed—the Urbanized Areas Formula Grant—allocated funding, in part, based on performance—accounting for less than 5 percent of the total funding distributed through the six programs. Assuming, for example, that a federal goal was to reduce the backlog of state of good repair needs nationwide and optimize the performance of existing systems—actions which would help transit agencies meet increased passenger demand—then tracking specific outcomes through performance measures that are clearly linked to program goals could provide a strong foundation for holding grant recipients responsible for achieving federal goals. In addition, implementing links between transit funding and performance through the use of financial performance accountability mechanisms could help create incentives for transit agencies to improve their performance, and provide the means for measuring overall program performance.74 For example, the National Transportation Policy Project, a project of the Bipartisan Policy Center,75 has recommended that Congress create a Performance Bonus Program that would provide additional funds to states and metropolitan regions based on demonstrated progress toward meeting national performance goals. This program would assess how well states and metropolitan regions reduce their backlog of system preservation needs and optimize the performance of existing transit systems based on proposed performance measures. Recipients could then use Performance Bonus Program funds for any transportation purpose with few restrictions. As a corrective measure, poorly performing states and regions would be subject to greater federal scrutiny and review in the planning process for their formula funds.76 We recently recommended that FTA report to Congress on options for adding performance accountability mechanisms to transit grant programs to ensure efficient and effective federal transit grant programs and that FTA further analyze and use transit agency data, when applicable, for evaluating federal transit program performance.77
74GAO-11-54.
75The Bipartisan Policy Center is a nonprofit organization that was established in 2007 by former Senate Majority Leaders Howard Baker, Tom Daschle, Bob Dole, and George Mitchell to develop and implement bipartisan policy solutions. The National Transportation Policy Project, a project of the Bipartisan Policy Center, was launched in February 2008 with the aim of presenting a new vision for federal transportation policy.
76Bipartisan Policy Center, National Transportation Policy Project, Performance Driven: A New Vision for U.S. Transportation Policy (Washington, D.C., June 9, 2009).
77GAO-11-54.
Page 39 GAO-11-94 Public Transportation
We provided DOT with a draft of this report for its review and comment. In commenting on the draft, DOT generally agreed with the information presented and provided technical comments, which we incorporated as appropriate.
Agency Comments
We are sending copies of this report to interested congressional
committees and the Secretary of Transportation. We also will make copies available to others upon request. In addition, this report will be available at no charge on GAO’s Web site at http://www.gao.gov.
If you or your staff has any questions about this report, please contact David Wise at 202-512-5731 or [email protected]. Contact points for our Offices of Congressional Relations and Public Affairs may be found on the last page of this report. GAO staff who made major contributions to this
David Wise
report are listed in appendix III.
Director, Physical Infrastructure Issues
Page 40 GAO-11-94 Public Transportation

Appendix I: Objectives, Scope, and
Methodology
Page 41 GAO-11-94
Appendix I: Objectives, Scope, and Methodology
To address how transit agencies are responding to increased passenger demand, we reviewed (1) trends in transit ridership and services from 1998 through 2008; (2) challenges, if any, that transit agencies faced during this period to address increased ridership and actions they took in response; and (3) factors that might affect future ridership demand and the ability of transit agencies to meet that demand.
To describe trends in the transit industry’s ridership, services, costs, and revenues from 1998 through 2008, we examined data from Federal Transit Administration’s (FTA) National Transit Database (NTD).1 We examined NTD data for all reporting agencies from 1998 through 2008 and conducted more detailed analyses by mode (for agencies operating heavy rail, light rail, and bus services).2 We selected agencies that operate heavy rail, light rail, and bus services because these three modes combined represented approximately 92 percent of all public transit trips made during the last 5 years for which NTD data were available at the time of our analysis of transit modes’ market share. We used NTD data to determine trends in the transit industry’s ridership (measured by passenger miles traveled (PMT)),3 supply of services (measured by vehicle revenue miles (VRM)),4
1Recipients and beneficiaries of grants from the FTA under the Urbanized Area Formula Program (49 U.S.C. § 5307) or Other than Urbanized Area (Rural) Formula Program (49 U.S.C. § 5311) are required by statute to submit data to the NTD. 49 U.S.C. § 5335. Over 700 urbanized area transit providers and over 1,300 rural transit providers report to the NTD on a variety of variables, including information on all funds applied to transit, such as federal, state, local, and other funds. FTA estimates that the NTD represents over 95 percent of public transportation in urbanized areas.
2According to the NTD, heavy rail service is characterized by high-speed and rapid acceleration passenger rail cars operating singly or in multicar trains on fixed electric rails; separate rights-of-way from which all other traffic is excluded; sophisticated signaling; high platform loading; and a heavy passenger volume. Light rail is an electric railway with a lower passenger volume compared to heavy rail. Passenger cars operating singly (or in short, two-car trains) on fixed rails in shared or exclusive right-of-way, low- or high-platform loading, characterize light rail service. The vehicle’s power is drawn from an overhead electric wire. Bus operates on fixed routes and schedules over existing roadways.
3The NTD defines PMT as the cumulative sum of the distances ridden by each passenger.
4The NTD defines VRMs as the miles a transit vehicle travels while in revenue service—that is, when the vehicle is available to the public with the expectation of carrying passengers.
Public Transportation
Appendix I: Objectives, Scope, and
Methodology
costs (including operating and capital expenses),5 and revenues (including operating6 and capital funding.7) We chose to analyze NTD data from 1998 through 2008 because it provided a comprehensive dataset for the variables included in the analysis.8 Data from 2008 were the most current available data on these variables when we conducted our review. To determine whether NTD data would be reliable for our purposes, we interviewed FTA officials who are knowledgeable about the design and uses of NTD data and researchers who regularly use NTD data. We also assessed the accuracy and comprehensiveness of specific data we planned to use and conducted an analysis to determine what effect, if any, New York City’s Metropolitan Transportation Authority (MTA) had on national transit trends, since New York City comprised about one-third of unlinked passenger trips (UPT)9 in 2008. To conduct this analysis, we used NTD data for 1998 through 2008 and examined trends over time for various measures of service use and output, expenses, and revenue sources. We found that with few exceptions, the national trends are not especially distorted by the omission or inclusion of the New York City data. However, we did find that unlinked passenger trips were more greatly affected by the omission or inclusion of the New York City data than the other variables examined. For this reason, we chose to use PMT as a measure of ridership for the purposes of our final analysis. See appendix II
5The NTD defines operating expenses as those expenses incurred by transit agencies that are associated with operating mass transportation services (i.e., vehicle operations, maintenance, and administration). According to the NTD, capital expenses include the following categories: revenue vehicles, guideway, communication and information systems, fare revenue collection equipment, maintenance facilities, passenger stations, administration buildings, service (nonrevenue) vehicles, and other (including passenger shelters, signs and amenities, and furniture and equipment that are not integral parts of buildings and structures). The NTD also defines capital expenses as having a useful life of greater than one year.
6According to the NTD, sources of operating funds include fare revenues, federal assistance, state assistance, local assistance, and other funds. Other funds can include subsidies from other sectors of operations and directly levied taxes, among other things.
7The NTD defines capital funds as the funds that transit agencies receive from federal, state, local, and directly generated sources and that are applied to capital projects. Directly generated sources include any funds generated or donated directly to the transit agency including passenger fares, advertising revenues, and donations and grants from private entities.
8NTD data analyses were adjusted for inflation, where appropriate.
9The NTD defines UPTs as the number of passengers who board public transit vehicles. Passengers are counted each time they board vehicles no matter how many vehicles they use to travel from their origin to their destination.
Page 42 GAO-11-94 Public Transportation

Appendix I: Objectives, Scope, and
Methodology
for a detailed description of this analysis. In reviewing NTD data, we determined they were reliable for our purposes, which were to provide information on national trends in transit ridership, service, costs, and revenues from 1998 through 2008 for transit agencies offering heavy rail, light rail, and bus service.
To identify challenges, transit agencies faced and the actions they took to address increased ridership, we conducted semistructured interviews with officials from 15 selected transit agencies in urbanized areas. We based our selection of these transit agencies on the type of transportation services provided (heavy rail, light rail, or bus), rate of growth in UPTs from 1998 through 2008, geographic dispersion, and size.10 While some of the transit agencies we interviewed may provide other types of transit services, our interviews focused on the type of transit service indicated in tables 4 and 5 (either heavy rail, light rail, or bus). For 3 of the 15 transit agencies, we visited the urbanized areas (one with each type of service—heavy rail, light rail, and bus) in which they were located and conducted in-person interviews with representatives of the transit agencies, local governments, metropolitan planning organizations, the business community, advocacy groups, and others in these three areas. Table 4 provides more detailed information about our site visit interviews.
Table 4: Site Visit Interviews
City Organization Description
Ann Arbor, Mich. Ann Arbor / Ypsilanti Regional Chamber
Business organization
Ann Arbor Downtown Development Authority
Local government
Ann Arbor Transportation Authority (Bus)
Transit agency
getDowntown Intergovernmental agency
Mayor, City of Ann Arbor Local government
Partners for Transit Community group
Transportation Planning Program, City of Ann Arbor
Local government
10To diversify the types of urbanized areas included in our study, the team selected urbanized areas with varying sizes of transit markets (small, medium, and large). We also included in the study at least one urbanized area from each of the four U.S. regions as defined by the U.S. Census Bureau. Urbanized areas (as defined by the U.S. Census Bureau) are densely settled territories that contain 50,000 or more people.
Page 43 GAO-11-94 Public Transportation

Appendix I: Objectives, Scope, and
Methodology
City Organization Description
University of Michigan Large employer in Ann Arbor
Washtenaw Area Transportation Study
Local transportation planning organization
Washington, D.C. District Department of Transportation
Local government
Greater Greater Washington Community group
Greater Washington Board of Trade Business organization
Hotel Association of Washington, D.C.
Business organization
Metropolitan Washington Council of Governments
Metropolitan planning organization
Washington Metropolitan Area Transit Authority (Heavy Rail)a
Transit agency
Sacramento, Calif. Friends of Light Rail & Transit Community group
Sacramento Area Council of Governments
Metropolitan planning organization
Department of Transportation, City of Sacramento
Local government
Sacramento Metro Chamber Business organization
Sacramento Regional Transit District (Light Rail)a
Transit agency
Source: GAO. aTransit agency also provides other types of transit services, but our interview focused on the type of transit service indicated.
We conducted in-depth telephone interviews with officials from the remaining 12 transit agencies, as outlined in table 5.
Table 5: Transit Agency Interviews
Type of servicea
City Transit agency Heavy rail Light rail Bus
Chicago, Ill. Chicago Transit Authority X
Dallas, Tex. Dallas Area Rapid Transit X
Denver, Colo. Regional Transportation District X
Frederick, Md. TransIT Services of Frederick County X
Ithaca, N.Y. Tompkins Consolidated Area Transit X
Los Angeles, Calif. Los Angeles County Metropolitan Transportation Authority X
Merced, Calif. Merced County Transit X
New York, N.Y. Metropolitan Transportation Authority X
Page 44 GAO-11-94 Public Transportation

Appendix I: Objectives, Scope, and
Methodology
Type of servicea
City Transit agency Heavy rail Light rail Bus
Newark, N.J. NJ Transit X
Palm Bay-Melbourne, Fla. Space Coast Area Transit X
Portland, Ore. TriMet X
San Francisco, Calif. Bay Area Rapid Transit X
Source: GAO. aWhile these transit agencies may also provide other types of transit services, our interview focused on the type of transit service indicated.
In addition, we reviewed relevant literature and agency-provided documentation, met with officials from FTA, and interviewed transportation researchers and industry and advocacy groups, including the following:
• America 2050
• American Public Transportation Association
• National Association of City Transportation Officials
• U.S. Chamber of Commerce
We also reviewed prior GAO, Congressional Research Service, and Congressional Budget Office reports, as appropriate.
To identify what factors might affect future ridership demand and the ability of transit agencies to meet that demand, we reviewed relevant literature, interviewed FTA officials, and spoke with the transit agency officials and stakeholders identified above. We also reviewed relevant documentation provided by these sources and prior GAO reports.
We conducted this performance audit from December 2009 through November 2010 in accordance with generally accepted government auditing standards. Those standards require that we plan and perform the audit to obtain sufficient, appropriate evidence to provide a reasonable basis for our findings and conclusions based on our audit objectives. We believe that the evidence obtained provides a reasonable basis for our findings and conclusions based on our audit objectives.
Page 45 GAO-11-94 Public Transportation

Appendix II: A
City on
nalyzing the Effect of New York
National Transit Trends
Page 46 GAO-11-94
Appendix II: Analyzing the Effect of New York City on National Transit Trends
We conducted an analysis to determine whether the heavy rail and bus system in New York City, New York, is distorting national transit trends because it comprised about one-third of unlinked passenger trips (UPT)1 in the United States in 2008. We examined the size of various measures oservice use and output, expenses, and revenue sources. We found that, with a few exceptions, the omission or inclusion of the New York City data does not distort the national trends.
f
We used the National Transit Database (NTD)2 data for 1998 through 2008, which contain information on service use and output, expenses, and revenue sources. In order to identify New York City’s transit agencies, we used the criteria used by the American Public Transportation Association; namely, the services provided by the Metropolitan Transportation Authority (MTA) in New York City. We examined:
Methodology
• United States national values
• United States national values omitting the MTA New York City transit agency
• MTA New York City transit agency values
1UPTs are the number of passengers who board public transportation vehicles. Passengers are counted each time they board vehicles no matter how many vehicles they use to travel from their origin to their destination.
2Recipients and beneficiaries of grants from FTA under the Urbanized Area Formula Program (49 U.S.C. § 5307) or Other than Urbanized Area (Rural) Formula Program (49 U.S.C. § 5311) are required by statute to submit data to the NTD. 49 U.S.C. § 5335. Over 700 urbanized area transit providers and over 1,300 rural transit providers report to the NTD on a variety of variables, including information on all funds applied to transit, such as federal, state, local, and other funds. FTA estimates that the NTD represents over 95 percent of public transportation in urbanized areas.
Public Transportation

Appendix II: Analyzing the Effect of New York
City on National Transit Trends
Results of Analysis
Growth in Service Output and Service Use
• Whereas in 2008, New York City comprised over one-third of the nation’s UPTs, results differ for its heavy rail and bus services.
General Comments
• New York City’s heavy rail system accounted for about 69 percent of the nation’s heavy rail UPTs in 2008.
• In contrast, New York City’s buses accounted for about 17 percent of the nation’s bus UPTs in 2008.
• Given the difference in relative share of these modes nationally, it is unsurprising that including New York City makes a bigger difference to calculations of service use or output for heavy rail than for buses.
• Growth in service output as measured by vehicle revenue miles (VRM)3 and vehicle revenue hours (VRH)4 was similar when we compared total values for the United States with total values for the United States excluding New York City.
Results—Heavy Rail and Bus Combined (New York City has no light rail service)
• Total VRM grew by about 20 percent nationwide; it grew by about 22 percent for the United States excluding New York City.
• Total VRH grew by about 23 percent nationwide; it grew by about 25 percent for the United States excluding New York City.
• Growth in service use as measured by passenger miles traveled (PMT)5 was similar when we compared total values for the United States with total values for the United States excluding New York City. Total PMT grew by about 28 percent nationwide and by about 25 percent for the United States excluding New York City.
3The NTD defines VRMs as the miles a transit vehicle travels while in revenue service—that is, when the vehicle is available to the public with the expectation of carrying passengers.
4The NTD defines VRHs as the hours that vehicles are scheduled to or actually travel while in revenue service.
5The NTD defines PMT as the cumulative sum of the distances ridden by each passenger.
Page 47 GAO-11-94 Public Transportation
Appendix II: Analyzing the Effect of New York
City on National Transit Trends
• Growth in service use as measured by UPTs was somewhat different when we compared total values for the United States with total values for the United States excluding New York City. Total UPTs grew by about 27 percent nationwide, but only by about 18 percent for the United States excluding New York City.6
• Service output—analyzing the data at the mode level (heavy rail and bus) there were some differences between the United States and the United States excluding New York City.
Results—Heavy Rail and Bus Separated
• For heavy rail, both VRMs and VRHs grew much more slowly in New York City as compared with the national trend. Because New York City heavy rail comprised more than half the nation’s VRMs in 2008, this disparity also showed up in the difference between heavy rail VRMs nationwide. VRMs grew by about 19 percent nationwide, whereas heavy rail in the United States excluding New York City grew by about 26 percent.
• For heavy rail, VRHs exhibited a similar and even wider difference in growth rates; nationwide, VRHs grew by about 21 percent. In the United States excluding New York City, VRHs grew by about 31 percent.
• For buses, the growth rate nationwide was similar to that of the United States excluding New York City. For VRMs, the growth rates were about 18 and 19 percent respectively; and for VRHs, the growth rates were both about 22 percent.
• Service use—analyzing the data at the mode level (heavy rail and bus) there were some differences between the United States and the United States excluding New York City, especially for UPTs.
• For heavy rail, growth measured by PMT was similar when we compared total values for the United States with total values for the United States excluding New York City. Total PMT grew by about 37 percent nationwide and by about 39 percent for the United States excluding New York City.
6According to officials with FTA, due to a change in MTA’s methodology for counting UPTs, this measure experienced a marked increase in 2006. According to FTA, it is estimated that in 2005 and prior report years, heavy rail ridership for MTA was underestimated by about 20 percent.
Page 48 GAO-11-94 Public Transportation

Appendix II: Analyzing the Effect of New York
City on National Transit Trends
• For heavy rail, growth measured by UPTs was quite different when we compared total values for the United States with total values for the United States excluding New York City. Heavy rail UPTs grew by about 48 percent nationwide and by about 31 percent for the United States excluding New York City.
• For buses, the growth rates of service were quite similar nationwide as compared with the United States excluding New York City. For PMT, total PMT grew by about 19 percent nationwide and by about 17 percent for the United States excluding New York City. However, for UPTs, total UPTs grew by about 15 percent nationwide and by about 12 percent for the United States excluding New York City.
• In general, excluding New York City from our calculations made little
difference to growth rates of operating costs either in terms of mode or function.
Growth in Operating Costs
• Total growth rates were close for the United States as compared with the United States excluding New York. In the case of heavy rail, these rates were about 28 percent as compared with 26 percent, respectively, and in the case of bus these rates were about 37 percent and 35 percent, respectively.
• There were some differences in the vehicle maintenance category,7 which made a difference for bus, and in the general administration category,8 which made a difference for heavy rail.
7Vehicle maintenance is defined as all activities associated with revenue and non-revenue (service) vehicle maintenance, including administration, inspection and maintenance, servicing (e.g., cleaning, fueling, etc.) vehicles, in addition to repairs due to vandalism and accident repairs of revenue vehicles.
8General administration is defined as all activities associated with the general administration of the transit agency, including transit service development, injuries and damages, safety, personnel administration, legal services, insurance, data processing, finance and accounting, purchasing and stores, engineering, real estate management, office management and services, customer services, promotion, market research, and planning.
Page 49 GAO-11-94 Public Transportation

Appendix II: Analyzing the Effect of New York
City on National Transit Trends
• Capital costs may behave cyclically; for example, if rolling stock is of a common age and needs to be replaced at the same time. As a result, if New York City’s transit capital is at a different phase of its cycle (different age or amount of use) as compared with the national average, one would expect differences in trends.
Growth in Capital Costs
• Total capital cost growth for all modes combined were not too different nationwide as compared with the United States excluding New York City; about 68 percent as compared with 71 percent, respectively.
• For heavy rail, whereas there were some differences in the growth of capital cost components, the totals were generally similar for the United States as compared with the United States excluding New York City; about 92 percent and 101 percent, respectively.
• For buses there were differences in capital costs for the United States as compared with the United States excluding New York City; about 5 percent and 13 percent, respectively. The primary driving factor of this difference was the approximate 58 percent reduction in capital spending for New York City.
In general, there was little impact on our calculation of funding source shares nationwide as compared with the United States excluding New York City.
Funding Sources
Tables 6 through 19 provide the data from which we derived our observations about the impact New York City has on national transit trends.
Data Tables
Page 50 GAO-11-94 Public Transportation

Appendix II: Analyzing the Effect of New York
City on National Transit Trends
Table 6: Growth in Service Output and Service Use, 1998–2008: United States National Trends and New York City
United StatesUnited States except
New York City New York City
Unlinked passenger trips Heavy rail 48.2% 30.6% 58.1%
Light rail 65.4 65.4 Not applicable
Bus 14.6 11.8 31.0
Total 27.3 17.7 49.7
Vehicle revenue miles Heavy rail 19.3 26.5 13.6
Light rail 104.1 104.1 Not applicable
Bus 18.4 18.7 13.5
Total 20.2 21.7 13.6
Vehicle revenue hours Heavy rail 21.0 31.4 14.6
Light rail 110.8 110.8 Not applicable
Bus 21.9 22.4 16.7
Total 23.3 24.9 15.5
Passenger miles traveled Heavy rail 37.2 39.1 35.9
Light rail 86.6 86.6 Not applicable
Bus 18.6 16.7 42.2
Total 28.3% 25.1% 36.8%
Source: GAO analysis of FTA NTD data.
Note: There is no light rail run by the MTA New York City transit agency, only heavy rail and bus.
Table 7: Growth in Operating Costs by Function and Mode, 1998–2008: United States National Trends and New York City
Total Vehicle
operationsVehicle
maintenanceNonvehicle
maintenance General
administration
Heavy rail United States 28.1% 33.9% 32.0% 30.4% 5.6%
United States not New York City
26.0% 34.3 29.4 28.7 1.9
New York City 30.1% 33.7 34.7 31.8 10.1
Light rail United States 88.4% 92.1 79.2 79.6 100.5
United States not New York City
88.4% 92.1 79.2 79.6 100.5
New York City Not applicable Not applicable Not applicable Not applicable Not applicable
Page 51 GAO-11-94 Public Transportation

Appendix II: Analyzing the Effect of New York
City on National Transit Trends
Total Vehicle
operationsVehicle
maintenanceNonvehicle
maintenance General
administration
Bus United States 36.5% 42.2 31.0 35.9 24.7
United States not New York City
34.5% 40.3 25.8 30.7 26.7
New York City 52.2% 57.6 65.8 75.7 7.8
Total United States 36.2% 42.0% 33.1% 35.2% 22.9%
Unites States not New York City
35.6% 41.5% 29.0% 34.8% 26.0%
New York 38.4% 44.1% 49.3% 35.8% 9.2%
Source: GAO analysis of FTA NTD data.
Note: There is no light rail run by the MTA New York City transit agency, only heavy rail and bus.
Table 8: Growth in Capital Costs by Function and Mode, 1998–2008: United States National Trends and New York City
Total Rolling stock Facilities Other
Heavy rail United States 92.3% 105.0% 86.2% 106.4%
United States not New York City 100.6 15.3 169.0 1.7
New York City 84.9 238.8 32.5 343.2
Light rail United States 164.8 74.2 191.0 172.0
United States not New York City 164.8 74.2 191.0 172.0
New York City Not applicable Not applicable Not applicable Not applicable
Bus United States 4.7 1.4 9.2 6.6
United States not New York City 12.6 18.2 7.2 6.6
New York City -58.2 -87.4 30.4 0.0
Total United States 68.1% 33.4% 91.0% 62.2%
United States not New York City 71.2% 25.3% 121.0% 19.3%
New York City 59.7% 66.4% 32.4% 343.2%
Source: GAO analysis of FTA NTD data.
Note: There is no light rail run by the MTA New York City transit agency, only heavy rail and bus.
Table 9: United States Percentage of Total Funding for Operating and Capital Expenditure Combined by Source
Calendar year Federal State Local Other
1998 16.9% 18.0% 32.5% 34.5%
1999 16.0 18.2 34.8 32.8
2000 17.3 17.8 34.0 33.0
Page 52 GAO-11-94 Public Transportation
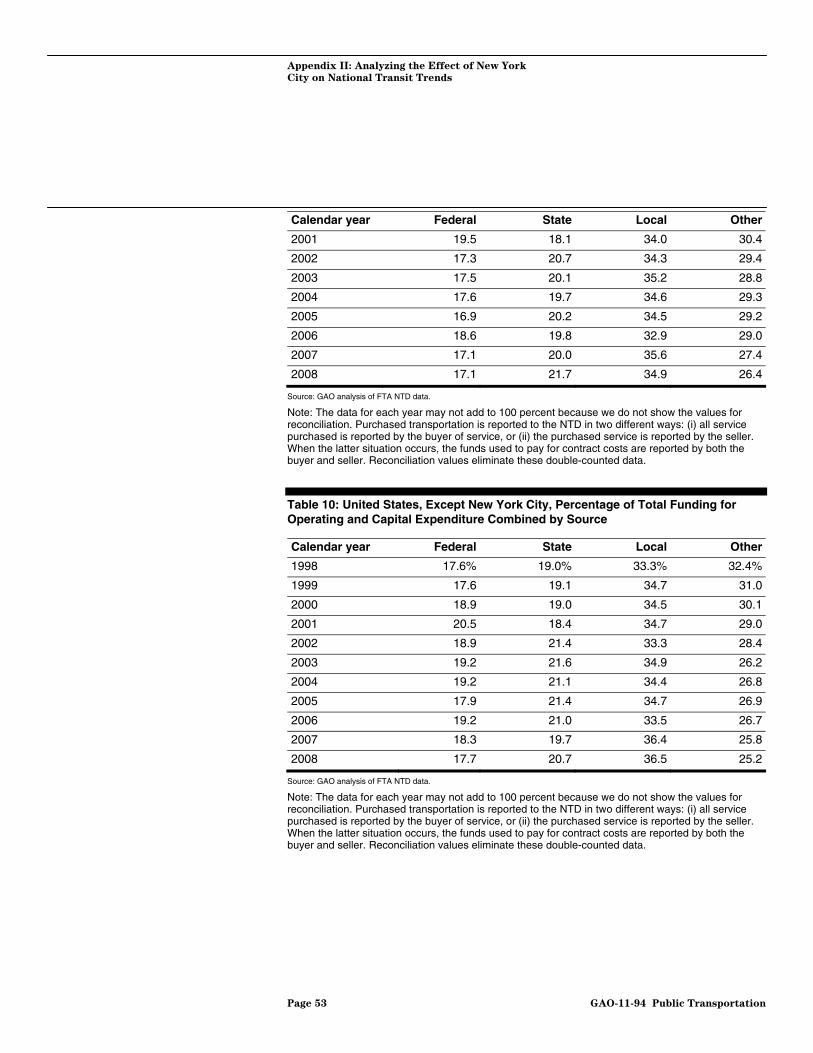
Appendix II: Analyzing the Effect of New York
City on National Transit Trends
Calendar year Federal State Local Other
2001 19.5 18.1 34.0 30.4
2002 17.3 20.7 34.3 29.4
2003 17.5 20.1 35.2 28.8
2004 17.6 19.7 34.6 29.3
2005 16.9 20.2 34.5 29.2
2006 18.6 19.8 32.9 29.0
2007 17.1 20.0 35.6 27.4
2008 17.1 21.7 34.9 26.4
Source: GAO analysis of FTA NTD data.
Note: The data for each year may not add to 100 percent because we do not show the values for reconciliation. Purchased transportation is reported to the NTD in two different ways: (i) all service purchased is reported by the buyer of service, or (ii) the purchased service is reported by the seller. When the latter situation occurs, the funds used to pay for contract costs are reported by both the buyer and seller. Reconciliation values eliminate these double-counted data.
Table 10: United States, Except New York City, Percentage of Total Funding for Operating and Capital Expenditure Combined by Source
Calendar year Federal State Local Other
1998 17.6% 19.0% 33.3% 32.4%
1999 17.6 19.1 34.7 31.0
2000 18.9 19.0 34.5 30.1
2001 20.5 18.4 34.7 29.0
2002 18.9 21.4 33.3 28.4
2003 19.2 21.6 34.9 26.2
2004 19.2 21.1 34.4 26.8
2005 17.9 21.4 34.7 26.9
2006 19.2 21.0 33.5 26.7
2007 18.3 19.7 36.4 25.8
2008 17.7 20.7 36.5 25.2
Source: GAO analysis of FTA NTD data.
Note: The data for each year may not add to 100 percent because we do not show the values for reconciliation. Purchased transportation is reported to the NTD in two different ways: (i) all service purchased is reported by the buyer of service, or (ii) the purchased service is reported by the seller. When the latter situation occurs, the funds used to pay for contract costs are reported by both the buyer and seller. Reconciliation values eliminate these double-counted data.
Page 53 GAO-11-94 Public Transportation

Appendix II: Analyzing the Effect of New York
City on National Transit Trends
Table 11: New York City, Percentage of Total Funding for Operating and Capital Expenditure Combined by Source
Calendar year Federal State Local Other
1998 13.6% 13.2 29.1 44.1%
1999 8.8 14.3 35.5 41.4
2000 9.5 12.2 31.5 46.8
2001 14.8 17.1 30.8 37.3
2002 9.5 17.5 38.8 34.2
2003 9.5 13.0 36.2 41.3
2004 9.8 13.3 35.3 41.5
2005 11.8 14.3 33.5 40.4
2006 15.5 13.5 29.9 41.2
2007 12.4 21.5 32.1 34.0
2008 14.8 25.7 28.4 31.2
Source: GAO analysis of FTA NTD data.
Table 12: All United States, Percentage of Total Funding for Operating Expenditure by Source
Calendar year Fares Federal State Local Other
1998 39.3% 4.0% 20.4% 30.1% 8.9%
1999 38.1 4.3 21.6 30.3 8.4
2000 37.5 4.6 20.8 30.5 9.5
2001 36.3 4.9 22.3 31.1 8.6
2002 34.4 5.4 25.3 28.4 9.0
2003 34.2 6.3 23.8 29.1 9.0
2004 34.5 7.5 22.5 29.4 7.9
2005 33.8 7.8 23.3 29.1 7.1
2006 33.9 8.2 22.5 29.0 6.9
2007 31.5 7.5 23.6 31.0 6.6
2008 31.3 7.1 25.8 29.5 6.4
Source: GAO analysis of FTA NTD data.
Page 54 GAO-11-94 Public Transportation

Appendix II: Analyzing the Effect of New York
City on National Transit Trends
Table 13: All United States, Except New York City, Percentage of Total Funding for Operating Expenditure by Source
Calendar year Fares Federal State Local Other
1998 34.6% 4.7% 20.5% 33.2% 10.1%
1999 33.9 5.1 21.6 33.0 9.5
2000 33.4 5.6 21.5 33.8 9.4
2001 32.7 5.9 21.5 34.0 9.8
2002 30.7 6.4 24.6 31.0 10.2
2003 29.9 7.5 24.5 32.0 9.0
2004 30.0 9.0 22.9 31.9 8.3
2005 29.6 9.4 23.8 30.7 7.9
2006 29.8 9.8 23.1 30.4 7.5
2007 28.6 9.3 22.1 32.9 7.3
2008 28.6 8.7 23.0 32.7 7.2
Source: GAO analysis of FTA NTD data.
Table 14: New York City, Percentage of Total Funding for Operating Expenditure by Source
Calendar year Fares Federal State Local Other
1998 62.6% 0.0% 19.5% 15.0% 2.8%
1999 58.9 0.0 21.4 16.6 3.1
2000 57.8 0.0 17.7 14.7 9.9
2001 54.1 0.0 26.0 17.1 2.8
2002 53.1 0.0 28.7 15.2 3.0
2003 56.0 0.0 20.5 14.4 9.1
2004 57.2 0.0 20.2 16.7 5.9
2005 54.8 0.0 20.6 21.2 3.4
2006 55.4 0.0 19.2 21.6 3.8
2007 43.4 0.0 29.7 23.3 3.5
2008 42.5 0.0 37.7 16.5 3.3
Source: GAO analysis of FTA NTD data.
Page 55 GAO-11-94 Public Transportation
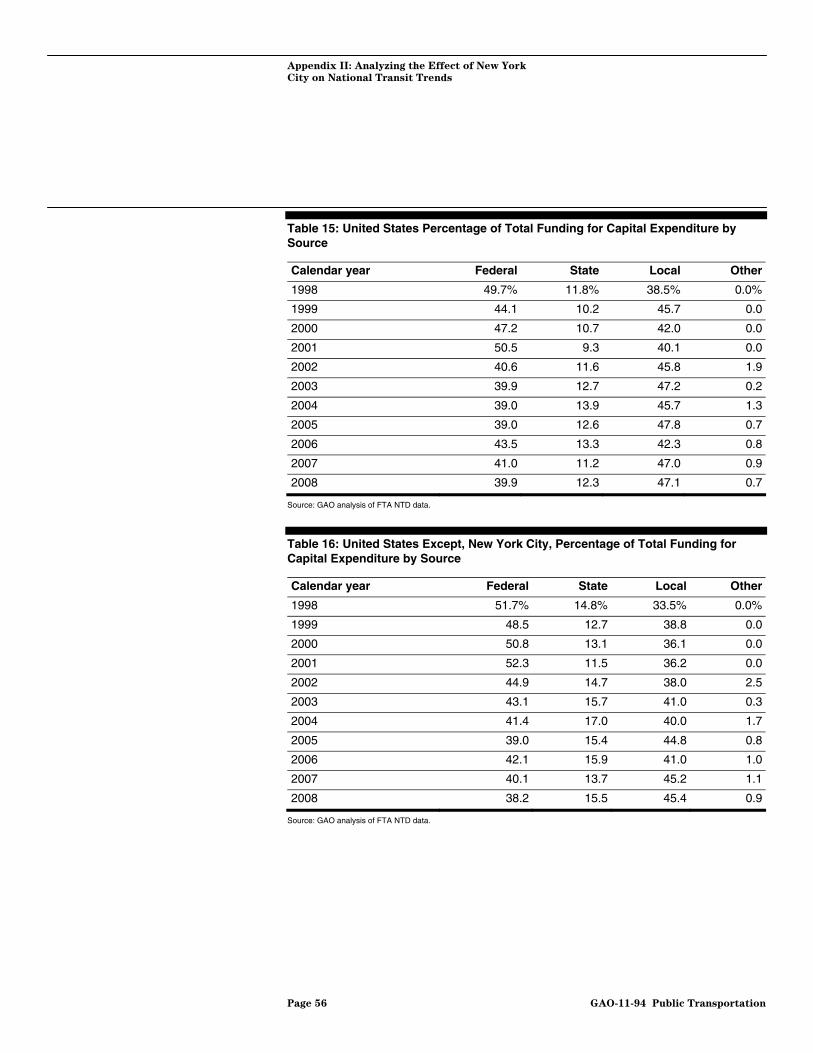
Appendix II: Analyzing the Effect of New York
City on National Transit Trends
Table 15: United States Percentage of Total Funding for Capital Expenditure by Source
Calendar year Federal State Local Other
1998 49.7% 11.8% 38.5% 0.0%
1999 44.1 10.2 45.7 0.0
2000 47.2 10.7 42.0 0.0
2001 50.5 9.3 40.1 0.0
2002 40.6 11.6 45.8 1.9
2003 39.9 12.7 47.2 0.2
2004 39.0 13.9 45.7 1.3
2005 39.0 12.6 47.8 0.7
2006 43.5 13.3 42.3 0.8
2007 41.0 11.2 47.0 0.9
2008 39.9 12.3 47.1 0.7
Source: GAO analysis of FTA NTD data.
Table 16: United States Except, New York City, Percentage of Total Funding for Capital Expenditure by Source
Calendar year Federal State Local Other
1998 51.7% 14.8% 33.5% 0.0%
1999 48.5 12.7 38.8 0.0
2000 50.8 13.1 36.1 0.0
2001 52.3 11.5 36.2 0.0
2002 44.9 14.7 38.0 2.5
2003 43.1 15.7 41.0 0.3
2004 41.4 17.0 40.0 1.7
2005 39.0 15.4 44.8 0.8
2006 42.1 15.9 41.0 1.0
2007 40.1 13.7 45.2 1.1
2008 38.2 15.5 45.4 0.9
Source: GAO analysis of FTA NTD data.
Page 56 GAO-11-94 Public Transportation

Appendix II: Analyzing the Effect of New York
City on National Transit Trends
Table 17: New York City, Percentage of Total Funding for Capital Expenditure by Source
Calendar year Federal State Local Other
1998 41.8% 0.0% 58.2% 0.0%
1999 26.6 0.0 73.4 0.0
2000 30.8 0.0 69.2 0.0
2001 43.0 0.0 57.0 0.0
2002 24.4 0.0 75.6 0.0
2003 26.0 0.0 74.0 0.0
2004 28.8 0.0 71.2 0.0
2005 38.7 0.0 61.3 0.0
2006 50.7 0.6 48.7 0.0
2007 44.9 0.0 55.0 0.0
2008 46.3 0.0 53.7 0.0
Source: GAO analysis of FTA NTD data.
Table 18: Unlinked Passenger Trips in 2008: United States Compared with New York City
United States New York City
New York City as a percentage of
United States
Unlinked passenger trips
Heavy rail
3,547,345,422 2,428,308,510 68.5%
Bus 5,447,524,557 902,640,956 16.6
Light rail
451,350,051 None 0
Total 9,446,220,030 3,330,949,466 35.3%
Source: GAO analysis of FTA NTD data.
Note: There is no light rail run by the MTA New York City transit agency, only heavy rail and bus.
Table 19: Vehicle Revenue Miles in 2008: United States Compared with New York City
United States New York City
New York City as a percentage of
United States
Vehicle revenue miles
Heavy rail 655,416,365 347,416,429 53.0%
Source: GAO analysis of FTA NTD data.
Note: There is no light rail run by the MTA New York City transit agency, only heavy rail and bus.
Page 57 GAO-11-94 Public Transportation

Appendix III: GAO
A
Contact and Staff
cknowledgments
Page 58 GAO-11-94
Appendix III: GAO Contact and Staff Acknowledgments
David Wise, (202) 512-5731 or [email protected]
In addition to the individual named above, other key contributors to this report were Steve Cohen, Assistant Director; Lauren Calhoun; Jean Cook; Colin Fallon; Elba Garcia; Brandon Haller; Michael Kendix; Catherine Kim; Mary Koenen; and Joshua Ormond.
Public Transportation
GAO Contact
Staff Acknowledgments
(542166)

GAO’s Mission The Government Accountability Office, the audit, evaluation, and investigative arm of Congress, exists to support Congress in meeting its constitutional responsibilities and to help improve the performance and accountability of the federal government for the American people. GAO examines the use of public funds; evaluates federal programs and policies; and provides analyses, recommendations, and other assistance to help Congress make informed oversight, policy, and funding decisions. GAO’s commitment to good government is reflected in its core values of accountability, integrity, and reliability.
The fastest and easiest way to obtain copies of GAO documents at no cost is through GAO’s Web site (www.gao.gov). Each weekday afternoon, GAO posts on its Web site newly released reports, testimony, and correspondence. To have GAO e-mail you a list of newly posted products, go to www.gao.gov and select “E-mail Updates.”
Obtaining Copies of GAO Reports and Testimony
Order by Phone The price of each GAO publication reflects GAO’s actual cost of production and distribution and depends on the number of pages in the publication and whether the publication is printed in color or black and white. Pricing and ordering information is posted on GAO’s Web site, http://www.gao.gov/ordering.htm.
Place orders by calling (202) 512-6000, toll free (866) 801-7077, or TDD (202) 512-2537.
Orders may be paid for using American Express, Discover Card, MasterCard, Visa, check, or money order. Call for additional information.
Contact:
Web site: www.gao.gov/fraudnet/fraudnet.htm E-mail: [email protected] Automated answering system: (800) 424-5454 or (202) 512-7470
Ralph Dawn, Managing Director, [email protected], (202) 512-4400 U.S. Government Accountability Office, 441 G Street NW, Room 7125 Washington, DC 20548
To Report Fraud, Waste, and Abuse in Federal Programs
Congressional Relations
Chuck Young, Managing Director, [email protected], (202) 512-4800 U.S. Government Accountability Office, 441 G Street NW, Room 7149 Washington, DC 20548
Public Affairs
Please Print on Recycled Paper