
GAO-03-46 Natural Gas: Analysis of Changes in Market Price
96
Report to Congressional Committees and Members of Congress United States General Accounting Office GAO December 2002 NATURAL GAS Analysis of Changes in Market Price GAO-03-46
Transcript of GAO-03-46 Natural Gas: Analysis of Changes in Market Price

Report to Congressional Committeesand Members of Congress
United States General Accounting Office
GAO
December 2002 NATURAL GAS
Analysis of Changes inMarket Price
GAO-03-46

Price spikes occur periodically in natural gas markets because suppliescannot quickly adjust to demand changes. In 2000-2001 for example,natural gas supplies were constrained and demand skyrocketed, leadingto the perfect environment for the price spike shown below. Whilemarket forces make natural gas prices susceptible to price volatility,investigations are underway to determine if natural gas prices weremanipulated in the Western United States during the winter of 2000-2001.
Federal agencies face major challenges in ensuring that natural gasprices are determined in a competitive and informed marketplace. TheFederal Energy Regulatory Commission lacks an adequate regulatory andoversight approach and is reviewing its statutory authority and marketmonitoring tools. The Commodity Futures Trading Commission does nothave regulatory authority for over-the-counter derivatives markets. Itdoes have antimanipulation authority and is currently investigating whatrole, if any, these markets played in the natural gas price spike of 2000-2001. Finally, the Energy Information Administration has an outdatednatural gas data collection program, but has made efforts to reassess itsdata needs to provide more useful information.
Gas utility companies can protect their residential customers againstprice spikes such as the one that occurred in 2000-2001. For example,using various hedging techniques, utilities can lock in prices for futuregas purchases. Continuing volatility in natural gas prices, especially theprice spike of 2000-2001, has increased the importance of price stabilityfor gas utility companies. Agencies that commented on this reportgenerally agreed with its conclusions.
Natural Gas Wholesale Prices (adjusted to 2001 dollars)
NATURAL GAS
Analysis of Changes in Market Price
www.gao.gov/cgi-bin/getrpt?GAO-03-46.
To view the full report, including the scopeand methodology, click on the link above.For more information, contact Jim Wells at(202) 512-3841.
Highlights of GAO-03-46, a report tocongressional committees and membersof Congress.
December 2002
During the winter of 2000-2001, thewholesale price of natural gaspeaked at a level four times greaterthan its usual level. Responding tothe congressional interest andconcern caused by these highprices, GAO undertook a study toaddress the (1) factors thatinfluence natural gas pricevolatility and the high prices of2000-2001; (2) federal government’srole in ensuring that natural gasprices are determined in acompetitive, informed marketplace;and (3) choices available to gasutility companies that want tomitigate the effects of price spikeson their residential customers.GAO surveyed a nationwide sampleof gas utilities and staff of stateutility regulatory agencies.
Page i GAO-03-46 Analysis of Changes in Natural Gas Prices
Letter 1
Results in Brief 5Background 7Market Forces Contributed to the Natural Gas Price Spike in 2000-
2001, but Price Manipulation Has Not Been Ruled Out 13Federal Government Faces Challenges in Ensuring a Competitive
and Informed Natural Gas Marketplace 27Consumers Can Be Protected against Price Spikes 35Conclusions 44Agency Comments 45
Appendix I Objectives, Scope, and Methodology 49
Appendix II Results of Investor-Owned and Municipally Owned
Utility Survey 52
Appendix III Additional Results of Investor-Owned and
Municipally Owned Utility Survey 69
Appendix IV Results of State Regulatory Agency Survey 72
Appendix V Additional Results of State Regulatory Agency
Survey 79
Appendix VI Comments from the Federal Energy Regulatory
Commission 85
Appendix VII Comments from the Energy Information
Administration 88
Contents

Page ii GAO-03-46 Analysis of Changes in Natural Gas Prices
Appendix VIII GAO Contacts and Staff Acknowledgments 90
Tables
Table 1: Results of a Hypothetical Gas Utility (GU-H) Hedging GasPurchases Versus Relying on Spot Market Prices forWinters 1990 through 2001 38
Table 2: Percentage of Gas Utility Companies That Reported UsingHedging Techniques in Gas Purchases for 2000-2001 43
Table 3: Changes in Utilities’ Use of Hedging Techniques sinceWinter of 2000-2001 43
Table 4: State Regulatory Agency Policy Concerning Gas CostStabilization Tools 44
Table 5: Gas Utilities’ Planned Use of Hedging for ResidentialCustomers 69
Table 6: Gas Utilities’ Actual Use of Hedging for ResidentialCustomers during the Winters of 2000-2001 and 2001-2002 70
Table 7: Gas Utilities’ Planned and Actual Volumes of Natural GasPurchased during the Winter Heating Season forResidential Customers 70
Table 8: Use of Natural Gas Storage Among Utilities (on Averageover the Past 5 Years) 71
Table 9: State Regulatory Agency Regulation of HedgingTechniques Used by Utilities for Natural Gas Purchases 79
Table 10: State Regulatory Agency Oversight of Gas Utilities 81
Figures
Figure 1: Natural Gas Wholesale Prices Per mmBtu, Adjusted to2001 Dollars 2
Figure 2: U.S. Natural Gas Usage by Sectors, 2000 8Figure 3: Principal Components of Residential Natural Gas Price
during Winter Heating Season 11Figure 4: Available Gas in Storage at the Beginning of the Winter
Heating Season, November 1976-November 2000 14Figure 5: Number of Gas Rigs in Operation and Gas Prices 16Figure 6: Monthly Average Number of Natural Gas Rigs in Use,
1993–2001 17Figure 7: Mean Temperatures in the Continental United States for
December 2000, in Degrees Fahrenheit 18
Page iii GAO-03-46 Analysis of Changes in Natural Gas Prices
Figure 8: Comparison of Price Impacts of Elastic Supply andInelastic Supply 24
Figure 9: Comparison of Price Impacts of Elastic and InelasticSupply and Demand 25
Figure 10: Comparison of Hedged and Unhedged Gas Prices forHypothetical Gas Utility 40
Figure 11: Percentage of Gas Utilities That Hedged None of TheirWinter Gas Supply for Residential Customers, 1995-2002 42
Abbreviations:
AGA American Gas AssociationAPGA American Public Gas Associationbcf billion cubic feetCEA Commodity Exchange ActCFMA Commodity Futures Modernization ActCFTC Commodity Futures Trading CommissionDOJ Department of JusticeDRI Data Resources, IncorporatedEIA Energy Information AdministrationFERC Federal Energy Regulatory CommissionFTC Federal Trade CommissionGU-H Hypothetical gas utilitymmBtu million British thermal unitsNARUC National Association of Regulatory Utility CommissionersNYMEX New York Mercantile ExchangeOMOI Office of Market Oversight and InvestigationOTC over-the-counterSEC Securities and Exchange Commissiontcf trillion cubic feet

Page 1 GAO-03-46 Analysis of Changes in Natural Gas Prices
December 18, 2002
Congressional Committees and Members of Congress
Natural gas is an essential energy source in this country that has manyapplications, including heating more than 59 million homes and 5 millionbusinesses, powering industrial and agricultural production, andgenerating a substantial amount of the nation’s peak electricity needs.During the winter of 2000-2001, the wholesale price of natural gas peakedat a level almost four times greater than the average price since 1993.Figure 1 reflects this price spike in relation to natural gas prices over theperiod from 1993 through 2001.
United States General Accounting Office
Washington, DC 20548

Page 2 GAO-03-46 Analysis of Changes in Natural Gas Prices
Figure 1: Natural Gas Wholesale Prices Per mmBtu, Adjusted to 2001 Dollars
Note: A million British thermal units (mmBtu) is a measure of energy content commonly used toquantify amounts of natural gas. It is approximately the equivalent of 1,000 cubic feet of gas.
One extraordinary aspect of this price spike was its prolonged duration,with prices remaining at high levels for a year. This period of high gasprices raised concerns among industry and government officials as towhether they would see the relatively low prices of the past any time in thenear future. Although the 2000-2001 price spike was the longestexperienced since federal wholesale price controls were removed in 1993,it did not mark the record high price for natural gas. This record highoccurred on February 2, 1996, when the price was 46 percent higher thanthe peak price of the 2000-2001 winter.

Page 3 GAO-03-46 Analysis of Changes in Natural Gas Prices
The dramatic and prolonged price spike of 2000-2001, coupled withincreased gas usage, affected all facets of the American economy. Millionsof residential customers who purchase natural gas from local utilitycompanies saw the costs of heating their homes increase significantlyfrom the previous winter’s costs. Nationwide, the average residentialcustomer’s total gas heating costs for the winter months increased from$380 to $624, and in some locations the increase was even greater. Inaddition, some companies significantly curtailed their production ofproducts such as fertilizer because of the increased price.
Over the past 25 years, the wholesale natural gas supply market hasevolved from a highly regulated market to a largely deregulated market,where prices are mainly driven by supply and demand. Beforeimplementation of the Natural Gas Policy Act of 1978, which beganderegulation of wholesale natural gas prices, the federal governmentcontrolled the prices that natural gas producers could charge for the gasthey sold through interstate commerce. Under this regulatory approach,producers located natural gas reserves, drilled wells, gathered the gas, andsold it at federally controlled prices to interstate pipeline companies. Afterpurchasing the natural gas, pipeline companies generally transported andsold the gas to local distribution or gas utility companies. Thesecompanies, under the oversight of state or local regulatory agencies, thensold and delivered the gas to their ultimate consumers, such ashomeowners.
In today’s deregulated market the federal government does not control theprice of natural gas. Producers still locate and gather natural gas, but theynow sell the gas at market-driven prices to a variety of companies,including marketers, broker/trader intermediaries, and a variety ofconsumers. Furthermore, the various players in the market may in turnsell gas back and forth several times before it is actually delivered to theultimate consumers. In addition, several types of natural gas derivatives,which are contracts whose market value is derived from the price of thegas itself, can be bought and sold through numerous sources by entitiesthat are interested in protecting themselves against increases in the priceof natural gas. Derivatives markets—which include federally-regulatedexchanges like the New York Mercantile Exchange (NYMEX) and off-exchange, over-the-counter (OTC) markets, which are generally notsubject to federal regulatory oversight—become important becausederivative prices typically move in parallel with the actual physical or cash

Page 4 GAO-03-46 Analysis of Changes in Natural Gas Prices
market. These derivatives include natural gas futures and options.1 Thus,there are a variety of different types of gas buying and sellingarrangements that can be quite involved.
Overall, since the removal of federal price controls, the price of natural gashas decreased but yet has become more volatile. In one extreme example,the wholesale price of gas increased by 286 percent and then decreased by71 percent over a 4-day trading period in 1996. A deregulated market alsoprovides a new challenge to three key federal agencies that do not controlthe fundamental nature and operation of the natural gas market, but arecharged with ensuring the existence of a competitive and informed naturalgas market that is not subject to fraud or price manipulation. The FederalEnergy Regulatory Commission (FERC) has responsibility for ensuring“just and reasonable rates” for the interstate transportation of natural gas,certain sales for resale of natural gas, and the wholesale price of electricitysold in interstate commerce. In addition, the Commodity Futures TradingCommission’s (CFTC) mission includes fostering transparent, competitive,and financially sound commodity futures and options markets. Finally, theEnergy Information Administration (EIA) is responsible for providingenergy information that promotes sound policymaking, efficient markets,and public understanding. In addition to the challenges faced by thesefederal agencies, gas utility companies, operating under state or localregulatory bodies, are challenged in their efforts to mitigate the effects ofprice spikes on their customers.
In this context, this report addresses the (1) factors that influence naturalgas price volatility and, in particular, the high prices that occurred duringthe winter of 2000–2001; (2) federal government’s role in ensuring thatnatural gas prices are determined in a competitive and informedmarketplace; and (3) choices available to gas utility companies that wantto mitigate the effects of price spikes on their residential consumers. Weare addressing this report to congressional committees of jurisdiction andto individual members that expressed concerns to us about natural gasprice spikes. The complete list of addressees appears at the end of thisletter.
1A futures contract is an agreement to buy or sell a commodity for delivery in the future ata price, or according to a pricing formula, that is determined at initiation of the contract.An obligation under a futures contract may be fulfilled without actual delivery of thecommodity by, for example, an offsetting transaction or cash settlement. An option givesthe buyer the right, but not the obligation, to buy or sell a commodity at a specific price onor before a specific date.

Page 5 GAO-03-46 Analysis of Changes in Natural Gas Prices
In addressing these issues, we examined government and industry pricedata to determine how and why natural gas prices have behaved since1993, when federal wholesale price controls were removed. We alsoreviewed the oversight responsibilities of agencies and their efforts tomonitor and collect information on the natural gas market. Finally, wesurveyed a sample of gas utility companies to learn what actions thesecompanies had taken or were planning to take to mitigate the effects offuture spikes in the price of natural gas. The survey included 112 utilitiesthat are members of the American Gas Association (AGA), which generallyrepresents larger investor-owned gas utility companies, and 21 additionallarge utilities. These companies tend to have large customer bases, andcollectively they distribute locally about 90 percent of the natural gasdelivered by gas utilities in this country. The survey also included a sampleof 342 of 906 smaller, municipally owned gas utilities that are representedby the American Public Gas Association (APGA). The municipally ownedutilities generally serve fewer customers than the investor-ownedcompanies. We received responses from 68 percent of the 133 largerutilities surveyed and 52 percent of the sampled smaller utilities. However,this response rate was not sufficient to generalize the results of our surveyto all gas utility companies; therefore, we reported the results of onlythose that responded. In addition to the gas utility company survey, wealso surveyed state regulatory agencies in the 48 contiguous states and theDistrict of Colombia to determine how they oversee the purchasing andpricing of natural gas by the utility companies under their jurisdiction. Weachieved a 100-percent response rate. A detailed description of ourobjectives, scope, and methodology is contained in appendix I.Appendixes II and III provide details on the gas utility companies’responses to our surveys. Appendix IV contains the state regulatoryagency survey and appendix V provides details on the state regulatoryagencies’ responses to our survey.
Price volatility is a natural condition of natural gas markets becausenatural gas supplies cannot quickly adjust to demand changes, leading toperiodic supply and demand imbalances. In 2000-2001 for example, naturalgas supplies, constrained by unusually low storage levels and the inabilityto quickly increase production levels, combined with skyrocketingdemand associated with extremely cold weather and strong economicgrowth to create the perfect environment for the price spike that occurred.The lack of timely and accurate data about the overall natural gas marketadds to the uncertainty about supply and demand conditions, furtherexacerbating price volatility. While market forces make natural gas pricesinherently susceptible to volatility, there are some indications that natural
Results in Brief

Page 6 GAO-03-46 Analysis of Changes in Natural Gas Prices
gas prices may have also been manipulated in the Western part of thecountry during the winter of 2000-2001. A number of investigations areunderway aimed at determining whether such manipulation occurred anduntil they are complete, it is not possible to definitely establish whetherand how much prices paid by consumers were affected.
The federal government faces major challenges in meeting its role toensure that natural gas prices are the result of supply and demand factorsin a competitive and informed marketplace. As we have recently reported,FERC—the agency responsible for ensuring wholesale natural gas prices,sold and transported through interstate commerce, are just andreasonable—lacks an adequate regulatory and oversight approach to meetthis role. FERC is still using legal authorities to regulate an evolving,competitive market that were enacted when the wholesale natural gassupply market was regulated. In addition, FERC’s market oversightinitiatives have been ineffective, serving more to educate staff about newmarkets than to produce effective oversight. As a result, FERC has beenslow to react to charges of possible market manipulation and lacksassurances that wholesale natural gas prices are just and reasonable.FERC recognizes that it previously lacked an adequate regulatory andoversight approach and is reviewing its statutory authority and marketmonitoring tools. Recently, FERC has taken positive steps by creating anew monitoring office to better understand energy markets. In addition,CTFC—the federal agency responsible for fostering competitivecommodity futures markets—does not have general regulatory authorityover trading in the OTC derivatives markets. CFTC does haveantimanipulation authority and is currently investigating what role, if any,that these markets may have played in the natural gas price spike of 2000-2001. These investigations could lead to enforcement actions or highlightthe need for legislative changes. Finally, EIA—the agency responsible forproviding energy information that promotes efficient natural gas marketsand public understanding—has an outdated natural gas data collectionprogram. Most elements of EIA’s current natural gas collection programhave been in place for more than 20 years, when the more regulatednatural gas market was much less competitive and complicated. As aresult, EIA’s ability to provide information that promotes understanding ofthe market price of natural gas has declined significantly. EIA recognizesthis limitation and has made efforts to reassess its information needs toprovide more useful market information.
Although the price of natural gas is volatile and significant price spikescan occur, gas utility companies have various means of protecting theirresidential customers against price spikes such as the one that occurred in

Page 7 GAO-03-46 Analysis of Changes in Natural Gas Prices
2000-2001. For example, through storage, fixed-price buying arrangements,and derivatives, utilities can hedge against the risk of price spikes bylocking in prices for future gas purchases. The goal of hedging is to ensurestable prices, which are not necessarily the lowest possible prices: stableprices locked in for the future may be lower or higher than future marketprices. However, continued volatility in market prices, most recently withthe price spike of 2000-2001, has increased the importance of pricestability for gas utility companies that serve residential customers and thestate regulatory agencies that oversee this service. As a result, gas utilitycompanies have increased their use of hedging. For example, 20 percent ofthe large and 32 percent of the small gas utilities responding to our surveyreported that before the price spike of 2000-2001 they had not planned tohedge any of their gas supply. Consequently, their customers had to paythe prevailing market prices. In contrast, 90 percent of all the utilitycompanies responding to our survey reported that they had decided tohedge some portion of their gas supply before the next winter (2001-2002).
This report does not contain any recommendations. However, in ourrecent report discussing FERC’s oversight of new energy markets, we didmake a number of recommendations to FERC on ways to improve itsoversight of competitive energy markets. We also suggested that theCongress might want to review FERC’s legal authorities to determinewhether revisions are needed to respond to the changing competitiveenergy markets.
Natural gas is a crucial source of energy in the United States. It is used infive sectors: residential, commercial, industrial, electric generation, andtransportation. The United States used about 23.5 trillion cubic feet (tcf) ofnatural gas in 2000. Figure 2 shows the percentages of total gas usage byeach of the five sectors.
Background

Page 8 GAO-03-46 Analysis of Changes in Natural Gas Prices
Figure 2: U.S. Natural Gas Usage by Sectors, 2000
EIA expects the country’s consumption of natural gas will increase to 33.8tcf per year by 2020. More than half of this increase is predicted to comefrom gas-fired electric generation. Eighty-four percent of the natural gasused in the United States is produced domestically, 15 percent comes fromCanada, and about 1 percent comes from other countries. Almost 8,000companies produce natural gas from wells located in 37 states andoffshore. The producing companies range in size from small, family-ownedbusinesses to large international corporations. According to theIndependent Petroleum Association of America, small companies, most ofwhich employ fewer than 20 people, produced 65 percent of the naturalgas consumed by Americans in 2001.
Over the years, the natural gas market has undergone major changes, andit is still growing and evolving. However, perhaps the most significantchange in the gas market—the transition from a regulated to a competitivenatural gas market—has already occurred. Under the regulated market,producers sold their gas directly to interstate pipeline companies at pricesset by federal regulation. Although this system ensured stable prices, italso caused severe gas supply shortages. These shortages occurredbecause, with artificially low prices, producers had no incentive toincrease production and consumers had no reason to curtail their demand.

Page 9 GAO-03-46 Analysis of Changes in Natural Gas Prices
Ultimately, the gas shortages led to delivery curtailments during coldwinters for many customers in the northern United States.
Responding to these supply problems, the Congress passed the NaturalGas Policy Act of 1978,2 which began the phased deregulation of naturalgas producer prices. This act established a pricing arrangement thatencouraged increased production of natural gas, but producer pricederegulation was not completed until after passage of the Natural GasWellhead Decontrol Act of 1989. This act mandated that federal controlsover natural gas wholesale prices end by 1993, allowing the price to be setfreely in the marketplace. In addition, FERC issued a series of ordersduring the 1980s and early 1990s to address the inability of natural gasusers to gain access through the pipeline systems to competitive naturalgas suppliers. The two most notable were Order 436 and Order 636. Order436, issued in 1985, instituted open-access, nondiscriminatory pipelinetransportation. In 1992, Order 636 was issued requiring pipeline companiesto completely separate or “unbundle” their transportation, storage, andsales services. As a result, natural gas as a commodity was separated fromgas transportation. Pipeline companies were required to treat other partieswishing to use the pipeline to transport natural gas the same as they wouldtheir own affiliated sales services. These laws and regulatory changes ledto the competitive and more complex natural gas market that exists today.
In today’s market, instead of selling natural gas strictly to the pipelinecompanies, producers now sell their gas to a variety of purchasers locatedacross the United States. With the removal of federal price controls,producers’ prices are determined in the marketplace. Natural gas is boughtand sold at many different locations, to numerous parties, and underdifferent sales and transportation arrangements. Numerous entities,including utilities and marketers, can buy, sell, re-buy and re-sell gas in avariety of ways.
The prices paid for natural gas can vary among the different buyingarrangements. For example, before deregulation, many gas utilities’ supplycontracts were long-term—often for 20 years or more—with littlevariability in price. As deregulation unfolded in the 1980s, gas utilitiesattempted to obtain better gas prices for their customers by developing aportfolio of long-term and short-term supply contracts and purchasing
2 P.L. No. 101-60 (1978).

Page 10 GAO-03-46 Analysis of Changes in Natural Gas Prices
some gas on the spot market.3 However, while generally lower on averagethan previously regulated prices, the prices for short-term gas supplycontracts and purchases on the spot market can be highly volatile. Asshown in figure 1, several prices spikes occurred over the 9-year periodending in 2001, but with one exception, during 2000-2001, the price ofnatural gas quickly returned to previous levels.
Natural gas prices also vary depending on location because of theimportance of factors such as proximity to gas production, pipelinecapacity, and local supply and demand conditions. In addition, prices varydepending upon the step in the natural gas distribution process duringwhich the gas is sold. Wholesale natural gas prices reflect the basic costsfor the commodity itself and are reported daily at a number of productionmarket centers throughout the country. Unless otherwise specified, thewholesale prices cited in this report are for gas at the Henry Hub, a naturalgas market center located in Louisiana. The Henry Hub is one of thelargest gas market centers in the United States and often serves as abenchmark for wholesale natural gas prices across the country. City gateprices are the prices at which gas is delivered from an interstate pipelineto a utility or large consumer. These prices are higher than wholesaleprices because they reflect transportation costs in addition to commoditycost. Finally, the retail prices paid by residential and other small-end usersare typically the highest gas prices because these customers must pay fornot only the gas itself, but also the costs of transporting the gas to theircity and the utility company’s costs for providing full service delivery. Fullservice is more expensive because it requires a utility company to meetcustomers’ full requirements, which can vary significantly depending onthe weather. State regulatory agencies, such as public utility commissions,usually regulate the retail gas prices charged by generally larger, investor-owned gas utility companies, and local bodies, such as city councils,usually regulate the prices charged by generally smaller, municipallyowned companies. Figure 3 shows the cost components for the residentialprice of natural gas.
3Spot market (sometimes referred to as the cash or physical market) prices are the currentcash prices at which natural gas is sold at the various market locations.

Page 11 GAO-03-46 Analysis of Changes in Natural Gas Prices
Figure 3: Principal Components of Residential Natural Gas Price during WinterHeating Season
Another development in the deregulated natural gas market is the use ofnatural gas derivatives—financial tools for managing risk that are based onnatural gas prices. NYMEX introduced natural gas derivatives, in the formof futures and options contracts in 1990 and 1992, respectively. Usingthese derivatives, gas utilities, along with electric power generators, otherlarge industries, and gas marketers, can hedge against price risk by lockingin or setting an upper limit on the prices they will pay for future gaspurchases. In the 1990s, the development of electronic trading systems andthe Internet added another layer of complexity to the natural gas market.At that time, natural gas derivatives began to be bought and sold in the off-exchange OTC markets, such as the Intercontinental Exchange and theformer EnronOnline. These OTC markets expanded both the terms (the
Page 12 GAO-03-46 Analysis of Changes in Natural Gas Prices
size, maturity, and price) and types (OTC markets introduced swaps4) ofhedging instruments available to natural gas marketplace participants.
Although the federal government has deregulated natural gas producerprices, three key agencies still maintain some role in ensuring that acompetitive and informed natural gas market exists. FERC wasestablished in 1977 as a successor to the Federal Power Commission andhas responsibility for ensuring “just and reasonable rates” for theinterstate transportation of natural gas, certain sales for resale of naturalgas, and the wholesale price of electricity sold in interstate commerce.CFTC’s mission is, in part, to oversee the nation’s commodity futures andoptions markets, including natural gas markets, and to protect marketusers and the public from fraud, manipulation, and abusive practices.Finally, EIA is responsible for providing energy information (includingnatural gas) to meet the requirements of government, industry and thepublic that promotes sound policymaking, efficient markets, and publicunderstanding. EIA was established by the Congress in 1977 and ischarged with providing unbiased, professional analyses of energy issuesand does not advocate policy. EIA’s role is as a depository for energyinformation and it has no direct influence on natural gas prices or policy.However, the data that the EIA collects are used to address significantenergy industry issues. EIA’s natural gas data collection program is part ofits National Energy Information System, a system created by the FederalEnergy Administration Act of 1974, as amended, to help fulfill the agency’smandate to collect data that adequately describes the energy marketplace.According to EIA, adequate evaluation of the industry requires production,processing, transmission, distribution, storage, marketing, consumption,and price data.
The Securities and Exchange Commission (SEC), the Department ofJustice (DOJ), and the Federal Trade Commission (FTC) also play roles inmaintaining competitive energy markets through their regulation of firmsparticipating in these markets. SEC administers and enforces federalsecurities laws to protect investors and to maintain fair, honest, andefficient markets. DOJ investigates and prosecutes illegal activities such as
4A commodity swap, including an energy swap, is typically between two parties who eachpromise to make a series of payments to the other, of which at least one series is based ona commodity price, such as the price of an energy product. For example, an airline mightagree to make fixed cash payments on particular dates over a certain period and to receivefrom the counter party on those same dates payments that are based on an index of oilprices. This would enable the airline to hedge against volatility in its fuel costs.

Page 13 GAO-03-46 Analysis of Changes in Natural Gas Prices
price fixing, insider trading, and wire fraud. Both agencies have ongoinginvestigations into the financial activities of energy companies. DOJ alsoenforces the Sherman Antitrust Act, which prohibits all contracts,combinations and conspiracies that unreasonably restrain interstate andforeign trade. FTC shares authority with DOJ under section 7 of theClayton Act to prohibit mergers or acquisitions that may substantiallylessen competition or tend to create a monopoly. In addition, section 5 ofthe Federal Trade Commission Act prohibits “unfair methods ofcompetition” and “unfair or deceptive acts or practices,” thus giving FTCresponsibilities in both the antitrust and consumer protection areas.
Available market evidence suggests that the inability of gas supplies tomeet surging demands contributed to the natural gas price spike thatoccurred in 2000-2001. Specifically, natural gas supplies were constrainedbecause of unusually low storage levels and the inability to quicklyincrease production levels. At the same time, demand during 2000-2001was high because of extremely cold weather in the beginning of the winterand continuing strong economic growth. The price spike of 2000-2001 isconsistent with the overall volatile nature of natural gas prices, which isdriven by the short-term inelasticity of supply and demand that neitherquickly nor easily adjusts to meet changes in the natural gas market. Inaddition, a lack of timely and accurate data about the overall natural gasmarket can create uncertainty about supply and demand conditions andfurther exacerbate price volatility. As a result, the combination of inelasticsupply and demand means that shifts in natural gas supply or demand, realor perceived, can and are likely in the future to continue to cause volatilityin the price of natural gas. While these market factors result in an inherentsusceptibility to price volatility, there are indications that marketmanipulation may have occurred as well in the winter of 2000-2001.Several federal investigations looking into the possibility of such pricemanipulation in the natural gas market are currently ongoing. However,because these investigations are ongoing, a final determination of whethernatural gas prices were manipulated, and if so, where and to what extentprices were further affected, has not yet been determined.
Market ForcesContributed to theNatural Gas PriceSpike in 2000-2001,but PriceManipulation Has NotBeen Ruled Out

Page 14 GAO-03-46 Analysis of Changes in Natural Gas Prices
Based on our analysis of EIA data and interviews with EIA and otherenergy analysts, constrained natural gas supplies, caused by unusually lowlevels of gas in storage on the part of gas utilities and gas marketers, andthe considerable time required for gas from new production to reach themarketplace, contributed to the increases in natural gas prices in 2000-2001.5
EIA data show that as of November 1, 2000, the volume of natural gas instorage was at the lowest level recorded for the beginning of a winterheating season since 19766: only 2,732 billion cubic feet (bcf). In 4 of 5months during the 2000-2001 winter heating season, the volumes of naturalgas in storage were at record low levels. And at the end of March 2001, thevolume of gas in storage dropped to 742 bcf, the lowest level everrecorded by EIA, or 36 percent below the level in March 2000.
Figure 4: Available Gas in Storage at the Beginning of the Winter Heating Season, November 1976-November 2000
5In general, gas supplies were not significantly hindered by transmission or pipelinecapacity constraints. However, EIA reported that although the use of natural gas pipelinecapacity rose to high levels (90 to 100 percent in many locations), the movement of gasfrom production areas to end-use markets encountered few problems, except in some fast-growing market areas, such as California, Florida, and New York. In California, forexample, according to the California Energy Commission, insufficient capacity within thestate and on the interstate El Paso pipeline system both contributed to the high price ofnatural gas in the fall and winter of 2000.
6The winter heating season is typically defined as November 1 through March 31.
Natural Gas Supplies WereConstrained because ofLow Storage Levels andDelays in Newly ProducedGas Reaching the Market

Page 15 GAO-03-46 Analysis of Changes in Natural Gas Prices
These low storage levels resulted primarily because wholesale gas pricesfrom April through September 2000 were higher than normal, climbingfrom around $3 to over $5 per mmBtu. According to EIA, these pricescaused some storage users to postpone buying gas to inject into storage inthe hope that prices would eventually decrease before the winter.However, instead of decreasing, gas prices generally stayed high and thevolume of gas placed into storage for the winter heating season did notreach normal levels. According to industry experts, natural gas priceswere high in the summer of 2000 because of the increased use of naturalgas for electric generation. The increased demand for electric generationwas compounded by the warmer-than-normal weather in the South andWest, which increased the demand for gas-fired electricity to run airconditioning units. In addition, some companies and marketers that hadput gas into storage earlier in the year reportedly sold it for profit whengas prices increased later that year, further depleting the already lowstorage reserves. In late September and October 2000, the industry did putmore gas into storage at rates higher than the previous 5-year average forthis period to prepare for the coming heating season; however, this latesurge of injections of gas into storage did not bring storage volumes up totheir usual levels.
Adding to the supply constraints caused by low storage levels was the factthat producers could not quickly increase their production levels to meetthe increasing demand for natural gas. During the winter of 2000-2001,almost all of the gas that could be produced from existing natural gaswells was being produced and sent into the marketplace. According to EIAanalysts, when over 90 percent of the maximum possible gas productivecapacity from wells is being utilized, the natural gas market is at greaterrisk for price spikes. Data supplied by EIA show that this was true duringthe winter of 2000-2001, when the nation’s natural gas utilization rate wasabove 90 percent and reached levels close to 100 percent in certain areasof the country. Therefore, new gas production was needed to respond toincreased demand, but this new production could not be developed fastenough to keep prices from rising.
Prior to 2000, drilling activity was lower as supply was sufficient andprices were lower. However, in response to the higher prices in 2000,natural gas producers took action to increase their production byincreasing the number of new gas wells they drilled. As shown in figure 5,the number of drilling rigs began increasing in the April to May 2000 timeframe, when gas prices first rose above $3 per mmBtu and continued toincrease for more than a year. However, the number of drilling rigs inoperation stopped increasing around July 2001, when gas prices again fell

Page 16 GAO-03-46 Analysis of Changes in Natural Gas Prices
below $3 and producers no longer had the economic incentive to increaseproduction.
Figure 5: Number of Gas Rigs in Operation and Gas Prices
Although the number of new natural gas wells being drilled in 2001decreased when gas prices decreased, the monthly average number of rigsin use that year was the highest recorded since natural gas prices werederegulated in 1993. Figure 6 compares the number of natural gas rigs inoperation for the years 1993 through 2001.

Page 17 GAO-03-46 Analysis of Changes in Natural Gas Prices
Figure 6: Monthly Average Number of Natural Gas Rigs in Use, 1993–2001
The effect of this increased drilling activity was not immediately felt in thesupply of natural gas available in the marketplace because there is a lagtime of 6 to 18 months before gas produced from new wells reaches themarket. Furthermore, according to EIA, there is an inherent delay betweengas price changes and changes in drilling activity. Gas prices began toincrease around May 2000 and peaked around January 2001, but rig countsdid not peak until July 2001 (see fig. 5). Therefore, the increased drilling in2000 and 2001 did not result in an immediate increase in the production ofnatural gas, and the new production that did occur did not reach themarketplace in time to respond to the growing demand and slow the risingprices. Moreover, industry officials told us that the typical delay associatedwith getting newly produced gas to the marketplace was exacerbated bythe low number of gas drilling rigs that were in operation before the priceincrease in 2000. According to these officials, low natural gas pricesbeginning in late 1998 and continuing through 1999 had caused producersto greatly reduce the number of drilling rigs in operation. In fact, as figure6 shows, the number of natural gas drilling rigs operating in 1999 averagedonly 496 per month and hit an almost 4-year low in April when the averagenumber of operating rigs dropped to 371. Therefore, natural gas producersfaced more than a normal delay in increasing their natural gas drillingactivity because of limited equipment availability.
Page 18 GAO-03-46 Analysis of Changes in Natural Gas Prices
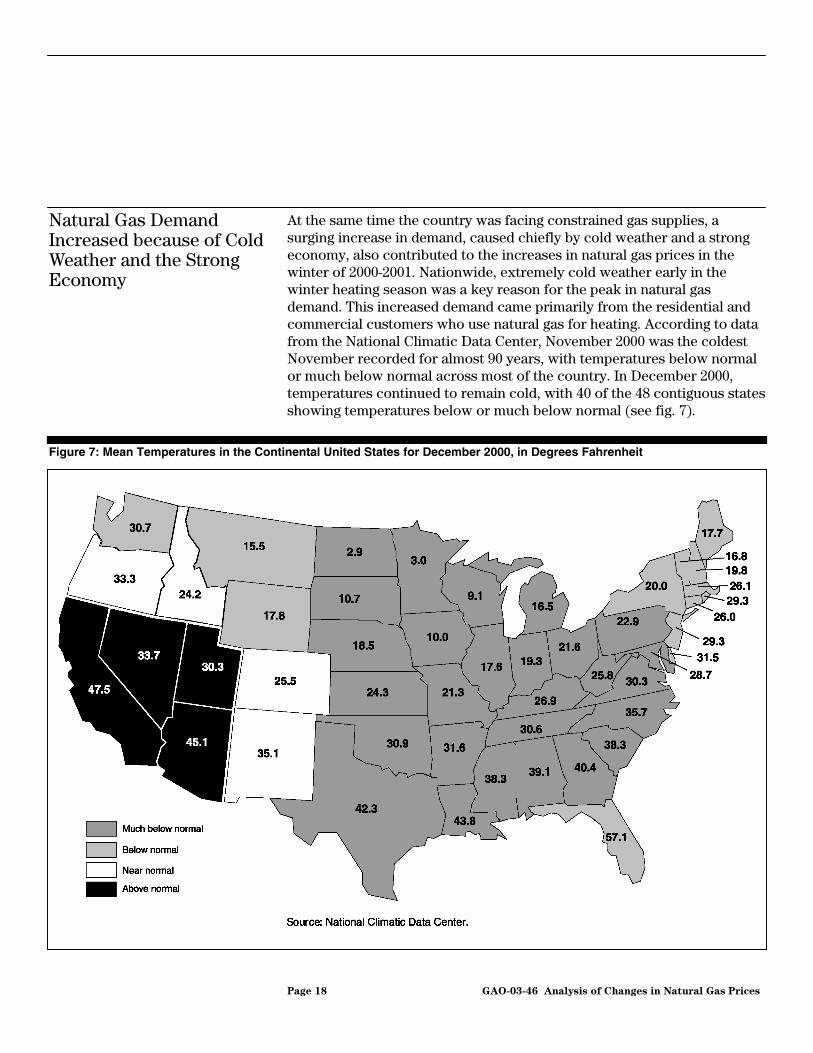
At the same time the country was facing constrained gas supplies, asurging increase in demand, caused chiefly by cold weather and a strongeconomy, also contributed to the increases in natural gas prices in thewinter of 2000-2001. Nationwide, extremely cold weather early in thewinter heating season was a key reason for the peak in natural gasdemand. This increased demand came primarily from the residential andcommercial customers who use natural gas for heating. According to datafrom the National Climatic Data Center, November 2000 was the coldestNovember recorded for almost 90 years, with temperatures below normalor much below normal across most of the country. In December 2000,temperatures continued to remain cold, with 40 of the 48 contiguous statesshowing temperatures below or much below normal (see fig. 7).
Figure 7: Mean Temperatures in the Continental United States for December 2000, in Degrees Fahrenheit
Natural Gas DemandIncreased because of ColdWeather and the StrongEconomy

Page 19 GAO-03-46 Analysis of Changes in Natural Gas Prices
According to EIA data, these frigid temperatures caused record natural gaswithdrawals from storage in November 2000, followed by the highest levelof withdrawals in 11 years for the month of December. These relativelylarge withdrawals, coupled with the low storage levels at the beginning ofthe winter heating season, caused some people in the natural gas industryto believe that storage levels in some areas would not be sufficient to lastthrough the winter if the cold weather continued. In fact, gas supplies didnot run out because the high gas prices motivated some consumers toreduce consumption or use substitute fuels when possible, especially inthe industrial and electric generation sectors. In addition, gas supplies didnot run out because the weather was milder during the rest of the winter.However, even with this eventual decrease in demand, by the end of thewinter heating season on March 31, 2001, the volume of natural gas instorage was at its lowest level since EIA began its complete monthly dataseries beginning in September 1975.
In addition, continuing economic growth throughout the 1990s and into2000 expanded the potential demand for natural gas and contributed to theprice spike that occurred in 2000-2001. This growth occurred in majorsectors of natural gas consumption: residential, commercial, industrial,and electric generation. The strong economy during the 1990s had boostednew home construction, and most of these homes were heated withnatural gas. Housing data that we reviewed show that from 1991 to 1999,two-thirds of the new homes and more than one-half of the newmultifamily buildings constructed were heated with natural gas. Further,many of these new houses tended to be larger, thus increasing thepotential for high natural gas consumption during colder weather. Thenumber of commercial gas customers also increased from 4.6 million in1995 to 5.1 million in 2000, while natural gas consumption in this sectorrose by 6 percent. Gas consumption in the industrial sector remained high,although it has decreased slightly since 1997 in part because of moreefficient equipment. Because of its clean burning properties, natural gas isnow the preferred source of energy for most new electric generationcapacity. Gas-fired electric generation facilities accounted for only about23 percent of natural gas consumption in the United States in 2001, butaccount for a greater percentage during the summer, when electricitydemand goes up because of the use of air conditioning.

Page 20 GAO-03-46 Analysis of Changes in Natural Gas Prices
Natural gas price volatility, as occurred during the winter of 2000-2001, isdriven by inelastic supply and demand, which means neither can quicklynor easily adjust to meet changes in the natural gas market. The supply ofgas from new production wells cannot quickly increase to meet higherdemand because of the lag time required to get the newly produced gasinto the marketplace. Similarly, the demand for natural gas does notquickly drop in response to higher prices: some consumers do not haveeasy access to alternative fuels, so their demand does not decreasesignificantly even when natural gas prices increase. In addition, a lack oftimely and accurate data about the overall natural gas market can createuncertainty about supply and demand conditions and further exacerbateprice volatility. As a result, the combination of inelastic supply anddemand means that small shifts in natural gas supply or demand, real orperceived, can and are likely to continue to cause relatively largefluctuations in the price of natural gas.
The inelastic nature of natural gas means that supply is slow to respond toprice changes in the marketplace. The immediate supply of natural gasprimarily comprises gas coming from production that goes straight intothe market and gas placed into storage during the warmer summer seasonfor use during the winter heating season. On the production side, there is asignificant delay from the time drilling begins to the time when newlyproduced gas enters the marketplace. Developing additional supplies fromnew wells and building the new infrastructure required to deliver thenewly produced gas to market—such as gas processing plants andpipelines—can take considerable time. The amount of time required to getnew gas to the market depends on several factors, including the locationof the natural gas well. For example, natural gas industry sources told usthat gas coming from new wells drilled in areas with established reservesthat are not deep in the ground takes about 6 months to reach the market.However, it takes much longer for gas being extracted from very deepwells, from new fields, or from offshore wells to reach the marketplace. Inaddition, gas extracted from a new field often cannot reach themarketplace until a pipeline segment and/or gathering line is constructed,and this requires even more time. Thus, new gas production often cannotbe brought into the marketplace quickly enough to meet increases indemand. In addition, the amount of natural gas available from storage tomeet increasing demands is limited. According to industry officials,natural gas is generally purchased and injected into storage during the7-month period from April through October. This gas is then withdrawnfrom storage for heating and other use during the winter heating seasonrunning from November through March. Once the injection season is over,the amount of gas in storage is typically set. Thus, when people in the gas
Natural Gas Market Supplyand DemandCharacteristics CausePrice Spikes
Natural Gas Supply Is Inelastic,and Information Is Limited
Page 21 GAO-03-46 Analysis of Changes in Natural Gas Prices
industry become concerned that the available supply of gas will not besufficient to last through the winter heating season, a significant pricespike can occur, as it did in 1996 and again in 2000-2001, when theamounts of gas in storage were at low levels.
Compounding the limited ability of production to respond quickly and thelimited gas in storage is the lack of comprehensive and timely informationon these market characteristics. This uncertainty can make it difficult formarket participants to determine when shifts in supply are occurring,leading to increased and frequent speculation that may ultimately increaseprice volatility because of perceived shifts in supply. According to EIA, theagency’s monthly production data are subject to problems of accuracy andtimeliness. First, the forms used to report production data vary from stateto state and often do not include all information requested by EIA.Therefore, EIA must estimate marketed production from whatever dataelements are submitted, information in state publications and web sites,the trade press, or prior year data. Also, EIA data is collected through anoptional survey. If a state does not comply with information requests, thefederal government has no authority to require it to provide information.In addition, monthly production data for a certain year are, for somestates, available to EIA only in the late summer of the following year,leading to inherent delays in reporting. Late or incomplete reports fromthe states to EIA are common.
Incorrect information concerning storage can also greatly affect themarket. As discussed above, because timely production information is notavailable, storage data have become a widely used indicator to estimatethe supply of natural gas. When this information is incorrect, it canincrease volatility in the natural gas market. For example, when AGAreported on August 15, 2001, that injections for the week ended Friday,August 10 totaled a record low of 3 bcf, the September futures contractdaily settlement price jumped by 12 percent from the previous day.Analysts had predicted that injections for that week would range from45 to 70 bcf. Later, AGA discovered that it had received erroneous datafrom an entity included in its survey and issued a corrected gas storagereport on August 22 showing that gas injection during the week endingAugust 10, 2001, was 50 bcf. As a result, the September futures contractprice on August 22 decreased by more than 10 percent from the daybefore. On October 12, 2001, AGA announced that in 2002 it would stopproviding weekly reports on the volume of natural gas in undergroundstorage. AGA said that it was discontinuing its reporting of storage dataprimarily because the staff time required to conduct the gas storage surveydrained staff resources that could be redirected to programs more

Page 22 GAO-03-46 Analysis of Changes in Natural Gas Prices
beneficial to its members. Shortly after the AGA announcement, theSecretary of the Department of Energy announced that because of theimportance of natural gas storage data in forecasting winter gas prices anddemand, EIA would begin providing this data in a weekly report.
The demand for natural gas is inelastic to varying degrees among majorgas consuming sectors: residential, commercial, industrial, and electricgeneration. Demand from residential and commercial customers isperhaps the most inelastic because heat is generally a necessity, not aluxury. Those consumers that heat their homes and businesses withnatural gas will require a certain level of heat even if gas prices are quitehigh. Furthermore, they cannot easily respond to high natural gas prices inthe short run by switching to a more economic fuel source for heat. Inaddition, many of these customers do not know beforehand that they arepaying higher gas prices because they are customarily billed later for gasthey are currently using.
Industrial natural gas demand is more elastic than demand fromresidential and commercial customers. For example, some industrialcustomers have the ability to switch from natural gas to other fuels whennatural gas prices rise. However, many do not have this capability andothers have limited fuel switching capability. As natural gas prices rise,some industrial customers may choose to reduce their operations and sellthe gas they had under contract to the highest bidder. When natural gasprices rose significantly in 2000-2001, this option was more profitable forcertain industrial users than if they had continued their operations usingnatural gas at higher-than-normal prices. Natural gas demand for electricgeneration may now be more elastic, but according to industry experts it isbecoming more inelastic. Previously, many of these users had facilitiesthat could use either natural gas or an alternate fuel, such as oil,depending on which energy source was less expensive. However, naturalgas prices were low throughout the 1990s, so many electric generationfacilities decided to use natural gas as their only source of energy, thusincreasing their dependency on natural gas. The demand for natural gas inthe electric generation sector is growing faster than in any other sectorand if EIA’s projections for gas-fired electricity are realized, this sector willlikely have a significant effect on future natural gas prices. EIA projectsthat the demand for natural gas in the electric generation sector will growat an annual rate of 4.5 percent, and by 2020 the demand will have risen to10.3 tcf of gas, accounting for 30 percent of the natural gas used annuallyin this country. In addition, industry analysts told us that because of thehigh demand for gas-fired electricity in some markets, some electric
Natural Gas Demand IsInelastic, and Information IsLimited

Page 23 GAO-03-46 Analysis of Changes in Natural Gas Prices
generating facilities are willing to pay premium prices for the natural gasneeded to produce this electricity.
As with gas supply data, some aspects of natural gas demand informationare also limited, making it difficult for the market to see real changes indemand. The resulting increased speculation about perceived shifts indemand can also exacerbate price volatility. According to EIA, the growthand restructuring of the natural gas industry have made it more difficult tocollect data concerning natural gas demand. For example, changes incertain regulatory requirements have led to the elimination of informationthat EIA needs to ensure the quality and completeness of its data. Inaddition, firms providing natural gas delivery do not always know theintended use for the gas they are delivering. For example, a gas suppliercould deliver gas to a city building that contains both residentialapartments and retail space. The supplier has no way to know whatpercentage of the gas delivered is used for what purpose and thereforecannot determine in what usage sector the gas should be reported. In theelectric generation sector, the importance of nonutility generators,including independent power producers and cogenerators, is growing. Inthe past, EIA has included these entities in the statistics it develops forindustrial or commercial users of natural gas sectors, therebyunderreporting the amount of gas used to generate electricity. However,EIA is implementing a better approach to measure and report the amountof natural gas used for electric generation by nonutility generators. Also,EIA recently changed how it estimates and presents data on the fuels usedto produce electricity. The purpose of this change is to improve dataquality, ensure that data are reported consistently throughout EIApublications, and provide users with a better understanding of how fuelsare consumed.
Any market with inelastic supply and demand characteristics—as is thecase in the natural gas market—is more susceptible to significant pricefluctuations than a more elastic market: in an inelastic market, relativelysmall shifts in supply or demand can result in significant price changes.Natural gas supply is relatively fixed in the short term; it is limited toavailable storage and current production and cannot be quickly increasedto meet increased demand. Thus, an increase in demand will result in agreater increase in price than if the supply were more elastic. Basically, inthe perfectly inelastic supply market, more demand competes for the samelevel of supply, driving prices higher than they would go if supply weremore readily available—more elastic. Figure 8 illustrates this example bycomparing the smaller price increase in a market with elastic supply(panel A) with the larger price increase in a market with perfectly inelastic
Short-term Inelasticity MeansSmall Shifts in Supply orDemand Can Lead toSignificant Price Fluctuations

Page 24 GAO-03-46 Analysis of Changes in Natural Gas Prices
supply (panel B) when faced with the same increased level of demand.Figure 9 goes farther, illustrating this difference for a market with bothinelastic supply and demand—as is the case with the natural gas market.Figure 9 compares the smaller price increase in a market with both elasticsupply and demand (panel A) with the larger price increase in a marketwith inelastic supply and demand (panel B) when demand increases andsupply decreases.
Figure 8: Comparison of Price Impacts of Elastic Supply and Inelastic Supply
Note: In panel A, assume we have a good with elastic supply; elastic supply is represented by asupply line whose upward slope is relatively not very steep. Initially, the price and quantity settle at Pa
0
and quantity Q0 as determined by the intersection of supply Sa and demand D0. Next, assume thatdemand increases, as depicted by an outward shift in the demand line to D1. Because supply issomewhat elastic, additional supply is made available to meet the increased demand, albeit at ahigher price Pa
1. The increase in price is represented by ∆Pa—the difference between Pa
1 and Pa
0.However, in an inelastic supply situation, the supply response is weaker. A more limited quantity issupplied to the market to meet the increased demand, resulting in a steeper rise in price than in themore elastic case. Graphically, this inelasticity is represented by a supply line that is much steeperthan the elastic supply line. Taking an extreme example, assume that supply is totally inelastic—thatis, supply is fixed no matter what the demand—as depicted in panel B with a vertical supply line, Sb.The initial price and quantity are the same as in panel A. Given the fixed supply, in order to meet thesame increase in demand to D1, the price would have to increase to Pb
1 to “choke off” the excessdemand. The increase in price from Pb
0 to Pb
1 for the inelastic supply case, as represented by ∆Pb, issignificantly higher than the increase in price in the elastic supply case, ∆Pa.
Page 25 GAO-03-46 Analysis of Changes in Natural Gas Prices
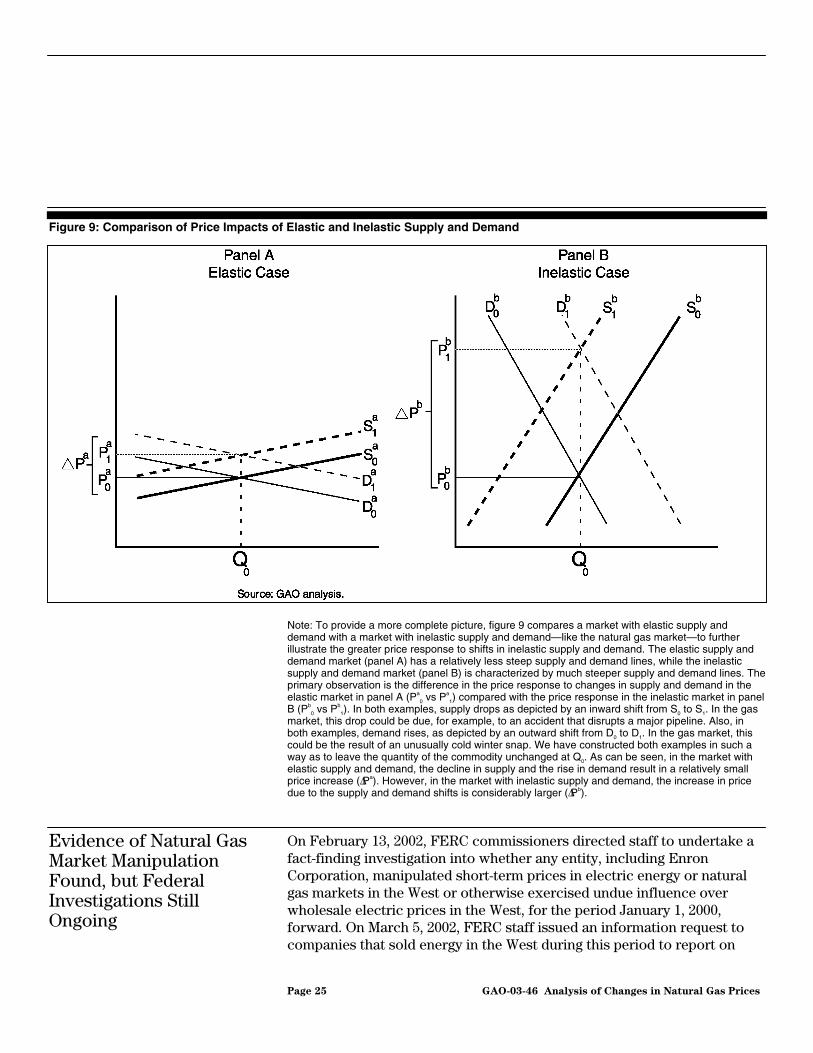
Figure 9: Comparison of Price Impacts of Elastic and Inelastic Supply and Demand
Note: To provide a more complete picture, figure 9 compares a market with elastic supply anddemand with a market with inelastic supply and demand—like the natural gas market—to furtherillustrate the greater price response to shifts in inelastic supply and demand. The elastic supply anddemand market (panel A) has a relatively less steep supply and demand lines, while the inelasticsupply and demand market (panel B) is characterized by much steeper supply and demand lines. Theprimary observation is the difference in the price response to changes in supply and demand in theelastic market in panel A (Pa
0 vs Pa
1) compared with the price response in the inelastic market in panelB (Pb
0 vs Pb
1). In both examples, supply drops as depicted by an inward shift from S0 to S1. In the gasmarket, this drop could be due, for example, to an accident that disrupts a major pipeline. Also, inboth examples, demand rises, as depicted by an outward shift from D0 to D1. In the gas market, thiscould be the result of an unusually cold winter snap. We have constructed both examples in such away as to leave the quantity of the commodity unchanged at Q0. As can be seen, in the market withelastic supply and demand, the decline in supply and the rise in demand result in a relatively smallprice increase (∆Pa). However, in the market with inelastic supply and demand, the increase in pricedue to the supply and demand shifts is considerably larger (∆Pb).
On February 13, 2002, FERC commissioners directed staff to undertake afact-finding investigation into whether any entity, including EnronCorporation, manipulated short-term prices in electric energy or naturalgas markets in the West or otherwise exercised undue influence overwholesale electric prices in the West, for the period January 1, 2000,forward. On March 5, 2002, FERC staff issued an information request tocompanies that sold energy in the West during this period to report on
Evidence of Natural GasMarket ManipulationFound, but FederalInvestigations StillOngoing

Page 26 GAO-03-46 Analysis of Changes in Natural Gas Prices
their capacity and energy sales transactions. On May 6, 2002, counsel forEnron released several memos to FERC staff that indicated the companyhad actively worked at manipulating California’s wholesale electric powermarkets. On May 8, 2002, FERC issued an “Admit or Deny” order requiringother companies to either admit or deny they engaged in strategies thatmight have inflated market prices during California’s energy crisis of 2000-2001. A May 22, 2002, FERC order further expanded the investigation byrequesting that natural gas sellers in both the West and Texas provideinformation on “wash trading.”7 In an initial staff report issued August 13,2002, FERC found indications that several companies, including Enron,may have manipulated spot prices upward for natural gas delivered toCalifornia during 2000-2001.8 FERC staff reported that during the monthsOctober 2000 to July 2001, the correlation of spot prices for natural gas atthe California delivery points with prices at producing basins in theSouthwest and the Rockies and Henry Hub was abnormally low. FERCstaff found that published natural gas price data are susceptible tomanipulation and cannot be independently validated. The staff reportnoted that the lack of formal verification opens the door for entities todeliberately misreport information in order to manipulate prices and/orvolumes for both electricity and natural gas. The staff report concludedthat in the absence of some form of double-checking, such misreporting islikely to be undetected in the reporting process and uncorrected whenprices are published. FERC staff also found that Enron’s trading strategies,described in internal Enron memos, used false information in an attemptto manipulate prices. The FERC staff report stated that while the exacteconomic impact of Enron’s trading strategies remains difficult todetermine, the Enron trading strategies have adversely affected theconfidence of the markets (electric and natural gas) far beyond their dollarimpact on spot prices. Based on the staff report, FERC ordered formalinvestigations into instances of possible misconduct by Avista Corporationand Avista Energy, Inc., El Paso Electric Company, and three Enron
7Wash trading, also know as “round-trip trading,” is defined in the natural gas market as“the sale of natural gas together with a simultaneous or pre-arranged purchase of the sameproduct at or near the same price.” It gives the appearance of trading when no bona fide,competitive trade has occurred. The practice creates the false impression that an energyfirm sold more power or natural gas than it actually controlled and may inflate the price ofthe commodity to the extent that the artificial and higher price created by the wash trade isused as a basis for pricing.
8Initial Report on Company-Specific Separate Proceedings and Generic Reevaluations:
Published Natural Gas Price Data; and Enron Trading Strategies (FERC, Aug. 13, 2002).

Page 27 GAO-03-46 Analysis of Changes in Natural Gas Prices
corporate affiliates—Enron Power Marketing, Inc., Enron Capital andTrade Resources Corporation, and Portland General Electric Corporation.
In addition to the FERC investigation, on September 23, 2002, a FERCadministrative law judge found that El Paso Natural Gas Companyexercised market power during the 2000-2001 winter heating season bywithholding substantial volumes of pipeline capacity to its Californiadelivery points, thereby tightening natural gas supply to the state andincreasing its price. The California Public Utilities Commission originallybrought the case, filing a complaint with FERC in 2000. The judgerecommended that FERC commissioners institute penalty procedures. TheCommission will review the judge’s recommended decision. In addition tothe FERC investigations, CFTC Chairman James E. Newsome confirmedduring congressional testimony in March 2002 and again at a pressconference in May 2002 that CFTC had began an investigation into variousenergy trading schemes, including possible wash trading, in gas and powerfutures markets. However, consistent with CFTC policy on ongoinginvestigations, CFTC could not tell us about the scope or reportingdeadlines of its investigation.
FERC, CFTC, and EIA play front-line roles in promoting a competitivenatural gas marketplace by monitoring business activities and deterringanticompetitive actions that could undermine these markets, andobtaining information and analyzing trends in the industry that are used bydecisionmakers in both industry and government. However, regulatorygaps and outdated data collection efforts have impeded effective federaloversight of the natural gas marketplace to ensure competition and limitedits ability to provide market information. As we have recently reported,FERC has not adequately revised its regulatory and oversight approach torespond to the transition to competitive energy markets. As a result, it hasbeen slow to react to charges of possible market manipulation and lacksassurances that wholesale natural gas and electricity prices are just andreasonable. We note, however, that FERC has recently take actions tocorrect this with the formation of the Office of Market Oversight andInvestigation (OMOI). In addition, CTFC—the federal agency responsiblefor fostering competitive commodity futures markets—generally does nothave regulatory authority over trading in the OTC derivatives markets.Finally, EIA recognizes that most elements of its natural gas datacollection program were set in place more than 20 years ago, well beforederegulation spawned a host of new entities and markets that influencenatural gas prices. EIA recognizes that its ability to provide informationthat promotes understanding of the market price of natural gas has
Federal GovernmentFaces Challenges inEnsuring aCompetitive andInformed Natural GasMarketplace
Page 28 GAO-03-46 Analysis of Changes in Natural Gas Prices
declined significantly and is currently reevaluating its data collectionneeds.
Under federal law, FERC is responsible for regulating the terms,conditions, and rates for interstate transportation by natural gas pipelinesand public utilities to ensure that wholesale prices for natural gas andelectricity, sold and transported in interstate commerce, are “just andreasonable.” However, FERC jurisdiction over sales for resale is limited todomestic gas sold by pipelines, local distribution companies, and theiraffiliates. The Commission does not prescribe prices for these commoditysales. As energy markets deregulate, FERC has concluded that itsapproach to ensuring just and reasonable prices needs to change: fromone of reviewing individual companies’ rate requests and supporting costdata to one of proactively monitoring energy markets to ensure that theyare working well to produce competitive prices. However, we reported inJune 20029 that FERC has not yet adequately revised its approach toregulating and overseeing the nation’s natural gas and electric powerindustries. The problems we identified include the following:
• FERC is using legal authorities to regulate competitive markets that wereenacted when the energy industries were regulated monopolies. Forinstance, FERC generally does not have the authority to levy meaningfulcivil penalties. While this authority may not have been necessary whenenergy industries were regulated monopolies, it is important, in today’smarket, if FERC is to deter anticompetitive behavior or violations ofmarket rules by market participants.
• FERC’s oversight initiatives have been incomplete or ineffective. FERCinitiatives to monitor competitive markets have served more to helpeducate FERC’s staff about the new markets than produce effectiveoversight. Additional market data available to staff have not been used toinitiate an enforcement action or to confirm or refute a problem identifiedelsewhere in the agency.
• FERC’s organizational structure limits its ability to monitor competitivemarkets because it diffuses its market oversight function, making it moredifficult to provide the communication, focus, and management attentionneeded to successfully implement a new regulatory and oversightapproach.
9Energy Markets: Concerted Actions Needed by FERC to Confront Challenges That
Impede Effective Oversight (GAO-02-656, June 14, 2002).
FERC Faces ChallengesThat Impede EffectiveOversight

Page 29 GAO-03-46 Analysis of Changes in Natural Gas Prices
• FERC must overcome significant human capital challenges, such asrecruitment and retention of qualified staff.
We concluded that absent an effective regulatory and oversight approach,FERC lacks assurance that today’s energy markets are producinginterstate wholesale natural gas and electricity prices that are just andreasonable. FERC’s response to the natural gas price spikes during thewinter of 2000-2001 highlighted the challenges it faces in providing marketoversight. Because FERC did not have a system in place to monitor naturalgas spot markets, it was slow in responding to charges of possible marketmanipulation. For example, the investigation into whether EnronCorporation or others manipulated short-term prices in electric energy ornatural gas markets in the West for the period January 1, 2000, forward didnot begin until February 2002, and remains incomplete almost 2 years afternatural gas prices first spiked. According to FERC, this investigationshould be completed by the first quarter of 2003. Further, this investigationwas largely reactive to complaints and accusations of improper behaviorby energy companies such as Enron, and relies heavily on requests forinformation from various energy companies. For example, theinvestigation had to rely on energy companies to report back to FERC,through information requests or “Admit or Deny” orders on whether theyhad engaged in any behavior that might have inflated market prices.
Our previous report recommended that FERC take actions to ensure thatit can effectively carry out its responsibilities for overseeing interstatewholesale natural gas and electricity markets, such as updating itsstrategic plan for overseeing energy markets and developing a trainingaction plan for staff involved or potentially involved in carrying outFERC’s market oversight functions. We also suggested that the Congressmight wish to convene public hearings to review FERC’s authorizationlegislation and determine, in consultation with FERC Commissioners,whether FERC’s authorities needed to be revised in the light of thechanging energy markets. We also suggested that the Congress might wantto consider providing FERC with the appropriate range of authorities tolevy civil penalties against market participants that engage inanticompetitive behavior and violate market rules. FERC agreed with theconclusions of our report and noted that its internal restructuring tosupport its new market oversight role has not kept pace with the speed ofenergy industry restructuring. Specifically, FERC stated that it needsadditional statutory authority—in particular, the ability to assess ameaningful range of penalties for violations of the law or FERC rules. Toaddress organizational problems, FERC created a new Office of MarketOversight and Investigation whose purpose is to oversee and assess the

Page 30 GAO-03-46 Analysis of Changes in Natural Gas Prices
fair and efficient operations of energy markets. OMOI reports directly toFERC’s Chairman and its responsibilities include understanding energymarkets and risk management, measuring market performance,investigating compliance violations, and analyzing market data. Accordingto FERC, a multidisciplinary team of 120 people will staff OMOI and 89 ofthem have been hired.
In addition to the statutory and organizational problems that limit itsoversight of energy markets, FERC is in the early stages of assessing whatinformation it needs to have in order to monitor and regulate competitivemarkets for wholesale electricity, and to ensure that open access naturalgas transportation and electric transmission services are provided fairlyand efficiently, without the exploitation of market power. In September2001, FERC formed a Comprehensive Information Assessment Team tosurvey its current data collections to ensure they meet FERC’s traditionaland future information needs. The team’s goal is to assess and proposechanges to FERC’s reporting requirements in order to improve FERC’smonitoring of competitive markets and performance of traditionalregulatory duties.
In addition to these problems, current FERC regulations governing theconduct of natural gas pipeline companies with affiliates are outdated.Because these regulations were set in place in 1988, significant changeshave occurred in the natural gas marketplace, such as unbundling,capacity release, growth of e-commerce, and market growth andconsolidation, that have expanded the number and types of pipelineaffiliates. FERC’s current affiliate regulations do not address the potentialexercise of market power through sharing information among pipelinecompanies and their affiliates because the regulations excludenonmarketing affiliates, local distribution companies, and affiliatedproducers and gatherers. FERC issued a Notice of Proposed Rulemakingin September 2001, which puts forth new affiliate standards that wouldapply uniformly to natural gas pipeline companies by extending standardsof conduct to relationships between the transmission providers, and allaffiliates.
CFTC’s regulatory oversight of natural gas derivatives varies amongnatural gas derivatives markets. CFTC was created in 1974 to oversee thenation’s commodity futures and options markets and has a twofoldmission: to foster transparent, competitive, and financially sound markets,and to protect market users and the public from fraud, manipulation, andabusive practices in those markets. NYMEX—the largest exchange thattrades natural gas derivatives—is a federally designated contract market
CFTC Regulatory OversightVaries Among Markets
Page 31 GAO-03-46 Analysis of Changes in Natural Gas Prices
that is fully regulated by CFTC. CFTC staff routinely monitored tradingand price relationships in the NYMEX natural gas contracts and found noreason to take enforcement action during the 2000-2001 natural gas pricespike. There are numerous off-exchange, or OTC, derivatives markets thattrade substantial volumes of natural gas derivatives and that are generallynot subject to CFTC regulations.10 CFTC is currently conducting aninvestigation into whether wash trading or other price-manipulativemisconduct occurred in the OTC or spot markets during the price spikeperiod. However, until CFTC’s investigation is complete, it is unknown,what role, if any, these markets may have played in the 2000-2001 naturalgas price spike, or what, if any, enforcement or other actions may result.
NYMEX reported that the average daily contract amount11 of its derivativestrades for all of 2001 was $13 billion. As a federally designated contractmarket, NYMEX must file all terms and conditions of traded contracts andcontract changes with CFTC. CFTC reviews exchange rules to ensure thatlisted contracts are not readily susceptible to manipulation; oversees theregistration of participants on the exchange; and requires daily reportingof key market and trader position information such as position size,trading volume, open interest,12 and prices. NYMEX participants aresubject to CFTC’s antifraud and antimanipulation provisions, includingprohibitions on wash trading. In addition, NYMEX is required to conductmarket surveillance and enforce minimum financial requirements for itsmembers. Also, because NYMEX acts as a clearinghouse,13 it protects allparticipants against counterparty credit risk, which is the risk of failure by
10The Commodity Exchange Act (CEA) excludes certain types of derivatives entirely fromthe CFTC’s jurisdiction, such as off-exchange swaps between certain qualifying parties(called “eligible contract participants”) that are based on broad economic measures likeinterest rates or stock indices beyond the control of the parties. The act exempts certainother types of derivatives from much, but not all, of the CFTC’s jurisdiction, such aselectronically-executed multilateral transactions in energy or metals commodities amongcertain qualifying commercial enterprises (called “eligible commercial entities”), overwhich the CFTC retains antifraud and antimanipulation authority.
11Contract amount is a measure of the volume of certain derivatives (such as futures andoptions) that is based on the value of the underlying contract.
12Open interest is the total number of futures contracts long or short in a delivery month ormarket that have been entered into and not yet liquidated by an offsetting transaction orfulfilled by delivery.
13A clearinghouse is an institution that acts as the buyer to every seller and the seller toevery buyer, thereby guaranteeing performance on a contract.

Page 32 GAO-03-46 Analysis of Changes in Natural Gas Prices
a contract counterparty to settle the contract by paying funds as theybecome due as a result of the trade.
For NYMEX natural gas contracts, CFTC market surveillance staff told usthey found no market problems that required CFTC intervention duringthe winter of 2000-2001. Surveillance staff told us that because no unusualproblems or excessive speculative positions were identified during thisperiod using the customary daily surveillance tools and procedures, nospecial reports were prepared by CFTC pertaining to the price spike.Based on its monitoring, CFTC concluded that NYMEX natural gascontracts behaved normally during this period and that natural gas futuresprices, though high, were driven by supply and demand. Because of thehigh prices and price volatility during this period, the natural gas futuresmarket was discussed at 18 of the Commission’s weekly surveillancebriefings in September 2000 through March 2001, which represented a highfrequency for the commodity.
Natural gas OTC markets are structured differently than NYMEX andgenerally are not subject to CFTC regulation. Natural gas OTC derivativescan be traded on multilateral basis (typically on an electronic tradingfacility in which multiple buyers and sellers participate) or on a bilateral,or principal-to-principal basis, which may also be through an electronictrading facility. Unlike exchange-traded derivatives, the maturity dates,quantities, and delivery points for the commodities underlying thederivatives offered in the OTC markets are negotiable among participantsand are not subject to CFTC review and approval. The Commodity FuturesModernization Act (CFMA) of 2000 provided a series of exclusions andexemptions that removed these markets from most of CFTC’s regulatoryauthority. Therefore, these markets typically are not subject to dailymonitoring by CFTC. However, CFTC can take action to address the use ofOTC transactions in natural gas derivatives, other than swaps, tomanipulate the underlying commodity and, depending on the parties to thetransactions, the Commission can take action to prevent or addressfraud.14 Also, CFTC has authority to investigate manipulation ofcommodity prices. Finally, participants in the OTC derivatives marketsgenerally bear counterparty credit risk, but a clearinghouse function is
14Nonswap bi-lateral natural gas OTC transactions between eligible commercial entities aresubject to provisions in the CEA prohibiting manipulation. Such transactions involvingparticipants that do not qualify as eligible commercial entities are also subject to CEAantifraud provisions. Multilateral natural gas derivatives traded on an electronic exchangeare subject to both the antimanipulation and antifraud provisions.

Page 33 GAO-03-46 Analysis of Changes in Natural Gas Prices
legally permitted. For example, the Intercontinental Exchange, an OTCmultilateral energy derivatives trading facility, has a clearing service.NYMEX also clears OTC energy derivatives.
During the natural gas price spike of 2000-2001, CFTC, consistent with itslack of general regulatory authority, did not monitor or assess activity inthe OTC markets. However, during congressional testimony in March 2002,CFTC Chairman Newsome confirmed that CFTC was among the federalagencies investigating Enron. Subsequently, in May 2002, responding towidely publicized concerns about wash trading in gas and power markets,Chairman Newsome stated that CFTC was investigating various energytrading schemes, including possible wash trading, in these markets.However, CFTC, consistent with agency policy, would not discuss thenature or extent of its ongoing investigations. As a result, the scope of itsinvestigations and the authority upon which they are being undertaken isunknown.
Further, it remains unclear what information CFTC may rely upon,conclusions it may draw, or enforcement or other actions it may take inrelationship to the role the OTC markets may have played, if any, in thenatural gas price spike of 2000-2001. However, in October 2002, the CFTCChairman said that the agency’s investigations, in addition to leading toformal actions, might reveal facts that cause CFTC to revisit its rules or tosuggest legislative changes.
EIA—the federal agency responsible for analyzing energy pricemovements—reports that its ability to understand the market price ofnatural gas has declined significantly, largely because most elements of itsdata collection program for the industry were set in place before theindustry’s restructuring. Most elements of EIA’s natural gas data collectionprogram have been in place for more than 20 years, when pipelines andlocal distribution companies owned the natural gas in their custody andknew its purchase and sales price. In that environment, EIA designed itsdata collection program to survey a relatively small number of firms toobtain a complete picture of the industry. Today, pipeline and distributioncompanies do not know the prices of the gas they transport for others, andmost industrial and commercial gas is priced in unreported private deals.In addition, entities that did not exist a decade ago—marketers,independent storage facilities, spot markets, and futures markets—arecentral to the operation of the industry. Because of these changes in theindustry, the data collected under EIA’s outdated approach have come todescribe only a portion of the industry.
EIA Is Trying to ModernizeOutdated Data CollectionProgram

Page 34 GAO-03-46 Analysis of Changes in Natural Gas Prices
EIA has recognized that its collection of data on prices and volumes needsto be timelier because the natural gas market is no longer based solely onlong-term contracts. With some exceptions, EIA’s current natural gas datacollection program remains basically an annual effort to obtaincomprehensive information on natural gas volumes and prices. Monthlydata series are less complete and the largest monthly survey is a samplesurvey selected from respondents to the core annual survey. In responseto the problems in data coverage and quality, EIA began a review in 1998,called the Next Generation Natural Gas Initiative, to assess the effect ofindustry restructuring and shifting customer needs on its future naturalgas information program. This review includes efforts to identify dataquality problems in EIA’s current price and volume series as well asrequirements for new kinds of data. After a period of public comment inMarch of this year, EIA submitted a proposal to the Office of Managementand Budget for its review that would update EIA’s natural gas datacollection program package. EIA expects OMB to make final approval ofchanges to EIA’s information program in December 2002, so that thechanges take effect in January 2003.
In addition, EIA has recently began to provide more real time marketinformation that traders and other gas industry analysts use as anindicator of both supply and demand. On May 9, 2002, EIA began releasingweekly estimates of natural gas in underground storage for the UnitedStates and three regions of the United States—a key predictor of futurenatural gas price movements. EIA began this weekly estimate becauseAGA discontinued its own estimate of natural gas in storage, with its finalweekly report dated May 1, 2002. EIA has also undertaken efforts to betterunderstand derivatives markets. In February 2002, the Secretary of Energydirected EIA to report on, among other things, how derivatives are beingused and to discuss the impediments to the development of energy riskmanagement tools. A draft EIA report, scheduled for release in December2002, states that, when properly used, derivatives are generally beneficialin managing risk. EIA concluded that all available evidence indicates thatthe oil industry in particular, and the natural gas industry to a lesserextent, has successfully used derivatives to manage risk. However, EIAfound that continuing problems with the reporting of natural gas pricedata and with pipeline transmission costs might be denying the benefits ofderivatives to many potential users.
Page 35 GAO-03-46 Analysis of Changes in Natural Gas Prices
Residential customers who rely on natural gas to heat their homes areespecially vulnerable to price spikes because they may have limited abilityto switch to alternate fuels for heating their homes or to obtain gas fromsources other than the gas utility companies. Therefore, when the gasutilities pay higher wholesale prices for natural gas, residential customersusually see their heating costs increase as well. This is true because amajority of gas utility companies, under state or local regulatory oversight,pass their gas costs on to their customers. However, utility companies canuse various techniques to protect or hedge against the risk of rising naturalgas costs by locking in the prices they will pay for gas purchased forresidential customers. Hedging does not, however, ensure that a utilitycompany will pay the lowest possible price for future natural gaspurchases: it simply provides stable gas prices and protection against pricespikes such as the one that occurred in 2000-2001. Hedging may result inthe utility company paying natural gas prices that are higher or lower thanthe prevailing market price. In the 5 years prior to the recent price spike,between 20 percent of the small and 45 percent of the large gas utilitycompanies responding to our survey reported that they did not hedge anyof their natural gas purchases. Further, industry data that we reviewedshowed that prior to and during the winter of 2000-2001, many gas utilitycompanies were relying more on shorter-term contracts and the moreexpensive spot market for the gas they were purchasing to satisfycustomer needs throughout the winter heating season. As a result, asignificant number of gas utilities likely had to pay higher prevailingmarket prices when they purchased the natural gas needed to satisfy theircustomers’ needs in 2000-2001, and these higher prices were likely passedon to their customers. This recent price spike increased the importance ofprice stability for those gas utilities that serve residential customers andthe regulatory agencies that oversee this service. As a result of the 2000-2001 price spike, gas utilities have increased their use of hedging whenbuying natural gas. Ninety percent of the utilities responding to our surveyreported that after the price spike they made plans to hedge some portionof their gas supply for the winter of 2001-2002.
Gas utilities can use several hedging techniques to stabilize their gassupply costs and thereby protect their customers against the unpredictableprice behavior of natural gas. Hedging techniques include both physicaland financial tools. Physical tools, which are widely used by gas utilities,include the following:
• Storage of gas for future use can provide a hedge against the effects ofprice volatility. According to industry officials, many gas utility companies
Consumers Can BeProtected againstPrice Spikes
Various Tools AreAvailable to Protectagainst Rising Gas Prices

Page 36 GAO-03-46 Analysis of Changes in Natural Gas Prices
have traditionally purchased a portion of their gas supply during thewarmer summer months when prices are lower and stored the gas for useduring the winter heating season when prices are typically higher.However, there are costs associated with storing natural gas and, becauseit is stored underground in geologic formations, such as salt caverns, andin depleted oil and gas wells located in 30 states, not all gas utilitycompanies can take advantage of this tool.
• Fixed price contracts, or forward contracting arrangements, can alsoprovide a hedge against price volatility. Under such an arrangement, autility agrees to take delivery of a set amount of natural gas at a specifiedtime, price, and location. However, the buyer must pay the contract priceeven if the market price at the time of purchase is lower.
For those gas utility companies that cannot or do not want to rely onphysical hedges, various derivatives can also provide protection againstincreasing gas prices. Derivatives are contracts whose value is linked to,or derived from, the price of the gas itself. There are costs associated withusing all derivatives, but most of the state regulatory agencies we surveyedallow gas utilities to recover these costs through their gas rates.Derivatives include natural gas futures, options, and swaps.
• Futures contracts that are traded on regulated exchanges, such as NYMEXgenerally are standardized. A gas utility that purchases a futures contractor an options contract through NYMEX is protected against counterpartycredit risk. Simply stated, the financial performance of both the buyer andthe seller of futures and options are guaranteed by the exchange. A naturalgas futures contract may be purchased to lock in a future price for up to 72months in the future and natural gas options can be used to guaranteeprices in increments of $0.05 per mmBtu for various time periods. Forexample, a purchaser of a futures contract traded on NYMEX makes alegal commitment to take delivery of 10,000 mmBtu of gas at the HenryHub in Louisiana on a specified date in the future. However, hedgers whobuy futures contracts usually do not take delivery of the gas. According toa NYMEX official, less than 1 percent of the gas futures contracts tradedon the exchange result in physical delivery of the commodity. Instead,those holding futures typically sell the contracts through NYMEX beforethe contractual date of delivery at the going market price. Then, whateverprofit or loss accrues from this transaction offsets the change in naturalgas prices from the time they bought the contract to when they buy gas fordelivery. For example, in March a gas utility company wishing to hedgeagainst a possible future price increase buys a futures contract for gas tobe delivered in January at $4.60. If the January cash price later increases to$5.15, the company can buy its gas on the spot market for $5.15 and sell

Page 37 GAO-03-46 Analysis of Changes in Natural Gas Prices
the futures contract on NYMEX for $5.15 thereby accruing a gain of $.55on the futures contract and a net gas cost of $4.60. If, however, the Januarycash price drops to $4.25, the company could buy its gas at this price, sellthe futures contract at $4.25 and take a loss of $0.35. But, the company’snet gas cost would still be $4.60.
• Options, which can be bought for a premium on NYMEX or in the OTCmarkets, give a utility the right, but not the obligation, to buy or sellnatural gas at a certain price at some time in the future. Some analystsbelieve that purchasing options is the best way for gas utility companies tohedge against possible price increases, because the utility holding anoption is protected against possible increases in the price of gas, but at thesame time has the ability to participate in any downward changes in price.
• Swaps generally provide more flexibility to users than do exchange-tradedfutures because their terms can often be individually negotiated, such asfor different amounts of gas and for different delivery points. However,natural gas swaps are traditionally traded in the OTC markets, and thesemarkets often do not provide the same level of protection against creditexposure as NYMEX.
A gas utility company that follows a hedging strategy is not guaranteedthat it will pay the lowest price for natural gas. In fact, minimizing pricevolatility through hedging and minimizing gas costs (beating the market)are two entirely different objectives. A hedging strategy for a gaspurchaser aims at gaining more certainty with respect to future costs, oravoiding exposure to large price fluctuations in the future that could comefrom total reliance on spot market prices. This is a different strategy fromone that tries to secure the lowest possible prices in the future. Neitherstrategy is costless, and parties that use them risk that their effectivecosts, after the fact, may be higher than those of alternative strategies.
To show how a hedging strategy can result in prices that are lower orhigher than spot market prices, we conducted an analysis based on ahypothetical utility and actual spot and futures gas prices.
• We constructed a hypothetical gas utility, GU-H, whose gas use patternsmirror, on a smaller scale, the pattern of residential gas consumption inthe United States from 1990 through 2001. We modeled GU-H so that itsgas requirements each month are equal to about 2.5 percent of residentialgas consumption in the United States. This makes GU-H a fairly large gasutility.
Hedging Does NotGuarantee the LowestPossible Gas Prices

Page 38 GAO-03-46 Analysis of Changes in Natural Gas Prices
• We assumed that GU-H follows a hedging strategy whereby it purchasesNYMEX gas futures contracts for the months of November throughMarch–the months for which it has the highest gas requirements duringthe year.
• We assumed GU-H purchases the same amount of NYMEX contracts foreach month of the winter season every year, based on its estimate of“baseload” for that month. We assumed that its baseload estimate is equalto the lowest amount of gas used for that month from 1990 through 2001.For example, the lowest amount of gas GU-H used during the month ofJanuary was in 1992 at slightly under 20 bcf, so we assumed that GU-Hhedges this amount for the month of January each year.
• We assumed GU-H effectively “locks-in” prices for the coming Novemberthrough March by purchasing NYMEX gas futures contracts on the firsttrading day in April of each year. For example, on April 3, 2000, GU-Hpurchased NYMEX gas contracts for the months of November andDecember 2000 and January through March of 2001.
• We assumed a transactions cost for the NYMEX contracts based onconversations with NYMEX officials. This cost was added to the hedgedcost of gas, but it is relatively small.
• We assumed that monthly amounts of natural gas used above the baseloadamounts covered by the futures contracts were bought on the spot marketat a price indexed to a monthly average spot price at the Henry Hub,effectively resulting in zero transmission costs, another simplifyingassumption.
Given the above, we compared the cost of GU-H’s gas purchases for thewinter months of November through March with and without a hedgingstrategy. Without hedging, GU-H purchases all its gas requirements on thespot market at the monthly spot price. Table 1 summarizes the results ofour analysis with respect to GU-H’s gas purchase costs from the 1990-1991winter through the 2001-2002 winter.
Table 1: Results of a Hypothetical Gas Utility (GU-H) Hedging Gas Purchases Versus Relying on Spot Market Prices forWinters 1990 through 2001Dollars in millions
Winter Heating Season (November through March)90-91 91-92 92-93 93-94 94-95 95-96 96-97 97-98 98-99 99-00 00-01 01-02
Unhedged gas costs $136.8 $120.6 $175.2 $202.1 $122.5 $270.4 $275.3 $205.6 $152.2 $201 $644.3 $192.1Hedged gas costs 155.1 156.4 153.5 193.9 179.4 196.1 209.6 195.7 214.3 195.2 368.7 412.7Hedging gain (loss) (18.3) (35.8) 21.7 8.2 (56.9) 74.3 65.7 9.9 (62.1) 5.8 275.6 (220.6)
Source: GAO analysis of EIA, NYMEX, and other data.

Page 39 GAO-03-46 Analysis of Changes in Natural Gas Prices
As the table shows, GU-H’s hedging strategy would have resulted in netsavings over the spot market price in gas purchase costs for some winterseasons and losses for others. For the winter of 2000-2001, the savingswould have been unusually large—over $275 million—because spotmarket prices turned out to be far higher than NYMEX futures prices.However, the very opposite would have been the case in the winter of2001-2002, when GU-H’s losses would have been over $220 million.
We also calculated the effective monthly prices for the winter months withand without hedging. Interestingly, over the 11-year period, the overallaverage price paid for gas under the two scenarios was virtually the same,at about $2.56 per mmBtu for the unhedged case and $2.57 per mmBtu forthe hedged case.15 However, the level of volatility was greater for theunhedged case. According to one commonly used measure of deviationfrom averages (standard deviation), the hedged case resulted inconsiderably less exposure to price volatility than the unhedged case. Ameasure of dispersion from the average price was about $1.41 for theunhedged case and only about $0.97 for the hedged case. Figure 10 showsa comparison of hedged and unhedged gas prices for a hypothetical gasutility.
15These are simple averages in the sense that they are not “weighted” by the quantities ofgas purchased/delivered for the individual months.
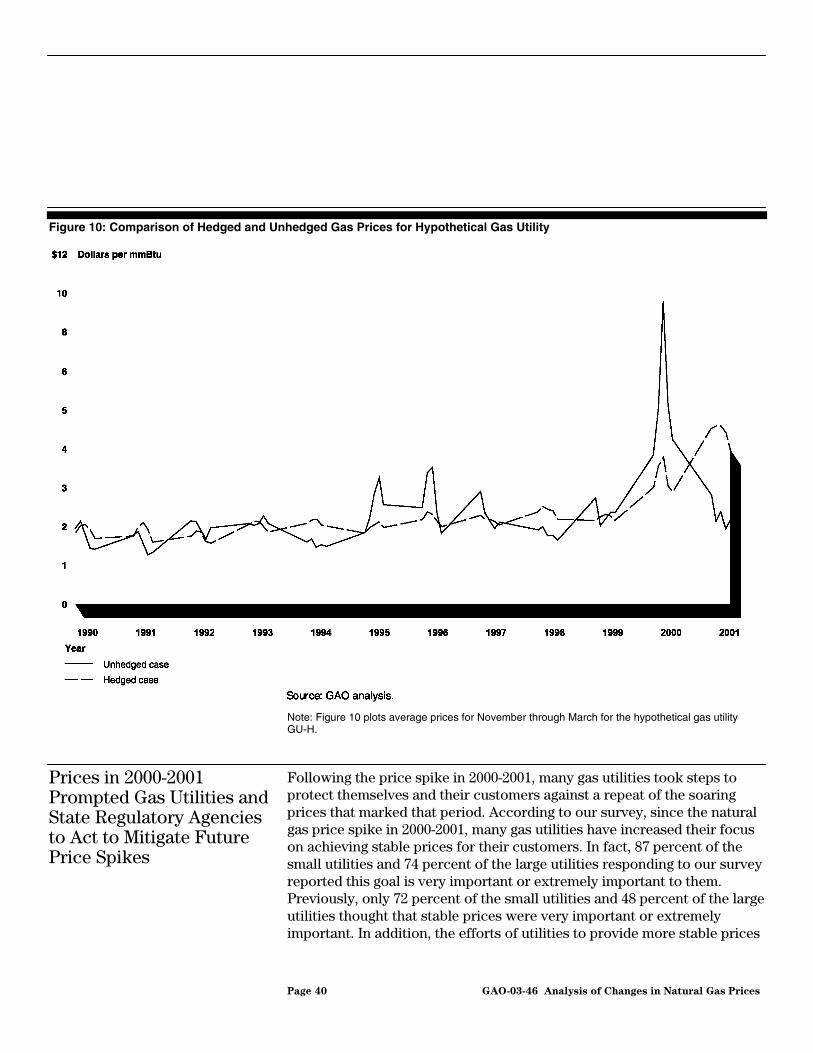
Page 40 GAO-03-46 Analysis of Changes in Natural Gas Prices
Figure 10: Comparison of Hedged and Unhedged Gas Prices for Hypothetical Gas Utility
Note: Figure 10 plots average prices for November through March for the hypothetical gas utilityGU-H.
Following the price spike in 2000-2001, many gas utilities took steps toprotect themselves and their customers against a repeat of the soaringprices that marked that period. According to our survey, since the naturalgas price spike in 2000-2001, many gas utilities have increased their focuson achieving stable prices for their customers. In fact, 87 percent of thesmall utilities and 74 percent of the large utilities responding to our surveyreported this goal is very important or extremely important to them.Previously, only 72 percent of the small utilities and 48 percent of the largeutilities thought that stable prices were very important or extremelyimportant. In addition, the efforts of utilities to provide more stable prices
Prices in 2000-2001Prompted Gas Utilities andState Regulatory Agenciesto Act to Mitigate FuturePrice Spikes

Page 41 GAO-03-46 Analysis of Changes in Natural Gas Prices
for their customers have received more support from state regulatoryagencies. For example, state regulatory officials from 29 of the 48 agenciesthat we spoke with told us that they consider it very important orextremely important for gas utility companies to work toward achievingstable prices for their residential customers. Before the gas price spike in2000-2001, only 14 agencies surveyed had considered this goal to be veryimportant or extremely important.
Consistent with the increased importance of stable prices, many gasutilities increased the percentage of their gas supply that they hedged afterthe winter price spike of 2000-2001. During the 2000-2001 winter, 20percent of the large utilities and 32 percent of the small utilities thatresponded to our survey did not hedge any of their winter gas supply forresidential customers. As a result, these utilities had to pay the prevailinghigh spot market prices for gas, resulting in higher bills for theircustomers. In contrast, during the 2001-2002 winter, only 10 percent ofthese utilities did not hedge any of their winter gas supply for residentialcustomers. About 63 percent of the large utilities and 81 percent of thesmall utilities that responded to our survey reported that they hedged atleast one-half of their winter gas supply during 2001-2002. In comparison,during the previous year, about 44 percent of the large utilities and 56percent of the small utilities hedged at least one-half of their gas supply. Inaddition, a recent survey of 52 companies completed by AGA found that amajority of them planned to increase their use of hedging techniques toprotect at least part of their gas supply portfolios from future price spikes.According to an AGA official, the extreme price volatility experiencedduring the winter of 2000-2001 made it clear to many gas utilities thathedging a portion of their gas supply helped to shield their customers fromdramatic increases in natural gas prices. As figure 11 shows, since 1995,the number of utilities that do not hedge any of their gas supply forresidential customers has steadily decreased.

Page 42 GAO-03-46 Analysis of Changes in Natural Gas Prices
Figure 11: Percentage of Gas Utilities That Hedged None of Their Winter Gas Supply for Residential Customers, 1995-2002
Many gas utility companies continued to use fixed price contracting andstorage as the primary tools for stabilizing their gas acquisition costs.However, some gas utilities also used derivatives, including futures,options, and swaps, as a way of stabilizing their gas costs. Table 2 showsthat the gas utility companies that responded to our survey used physicalhedging tools much more than derivatives, and large utilities reportedmuch higher use of financial hedging techniques than small utilities.

Page 43 GAO-03-46 Analysis of Changes in Natural Gas Prices
Table 2: Percentage of Gas Utility Companies That Reported Using HedgingTechniques in Gas Purchases for 2000-2001
Hedging techniquesLarge utilities(percentage)
Small utilities(percentage)
Physical toolsStorage 84 49Fixed price contracts 56 65
Financial toolsFutures 35 24Options 36 4Swaps 28 5
Source: GAO analysis of survey data.
Overall, 57 percent of the large gas utility companies and 47 percent of thesmall gas utility companies responding to our survey reported that theyhad increased their use of one or more hedging techniques since the 2000-2001 winter. Table 3 shows the specific changes in the use of differenthedging techniques among the utility companies. More details on the gasutilities’ responses to our survey questions can be found in appendixes IIand III.
Table 3: Changes in Utilities’ Use of Hedging Techniques since Winter of 2000-2001
Percentage using hedging technique Percentage not currently using hedging techniqueUse has
increasedUse has remained
the sameUse has
decreasedPlan to use in the next 12
monthsDo not plan to use in the
next 12 monthsLarge utilitiesPhysical toolsStorage 13 72 0 2 13Fixed price contracts 42 36 2 5 14Financial toolsFutures 23 29 2 8 38Options 20 30 5 9 36Swaps 18 30 1 7 43Small utilitiesPhysical toolsStorage 9 51 0 3 37Fixed price contracts 34 42 4 6 15Financial toolsFutures 22 19 1 5 52Options 5 13 2 5 75Swap 3 17 1 1 79
Source: GAO analysis of survey data.

Page 44 GAO-03-46 Analysis of Changes in Natural Gas Prices
According to our survey of state regulatory agencies, most allow the gasutilities under their jurisdiction to use hedging techniques when theypurchase gas for their residential customers. However, despite anincreasing openness to the idea of hedging tools, these regulatory agenciesfavored the use of physical hedging tools over financial tools. Table 4reflects the positions of state regulatory agencies on the use of hedgingtools by the gas utilities they regulate.
Table 4: State Regulatory Agency Policy Concerning Gas Cost Stabilization Tools
Cost stabilization tool
Number of stateagencies
allowing use ofthe tool
Number of stateagencies not
allowing use ofthe tool
Does notapplya No response
Physical toolsStorage 45 0 3 0Fixed price contracts 45 0 3 0
Financial toolsFutures 42 1 5 0Options 40 3 5 0Swaps 36 1 10 1
Note: We surveyed the 48 continental states and the District of Columbia. The Nebraska PublicService Commission declined to respond because natural gas is regulated on a local level and theCommission handles only pipeline disputes.
aEither the tool is not available in a certain area or the agency has not addressed the tool in its policy.
Source: GAO analysis of survey data.
In general, state regulatory agencies that allow gas utilities to use hedgingtools do not restrict the amount of gas purchased through use of thesetools. In addition, a large percentage of the gas utilities responding to oursurvey reported that their regulatory agency allows them to recover allcosts associated with hedging. And, while 90 percent of the utilitiesregulated by state agencies reported being subject to prudence audits oftheir gas-buying strategy, only 7 percent have had costs associated withgas purchases disallowed by an agency because of such an audit. Moredetails concerning the state regulatory officials’ responses to our surveyquestions are shown in appendixes IV and V.
Although the federal government is not a direct regulator of natural gasprices, it has an interest in promoting a competitive and informed naturalgas marketplace that protects the public from unnecessary price volatility.The principal tools available to federal agencies to promote a competitivenatural gas marketplace and protect the public from price volatility
Conclusions

Page 45 GAO-03-46 Analysis of Changes in Natural Gas Prices
include monitoring for anticompetitive behavior; taking appropriateenforcement actions where necessary; and providing decision-makers inindustry and government with sound, up to date, natural gas marketplaceinformation, such as short-term price movements and long-term demandand supply trends. However, at this date, the federal government facesmajor challenges in meeting its role of ensuring that natural gas prices aredetermined by supply and demand factors in a competitive and informedmarketplace.
We had previously recommended that FERC take actions to update itsstrategic plan and to develop an action plan for overseeing energymarkets, so that it could more effectively carry out its responsibilities foroverseeing interstate wholesale natural gas and electricity markets. Wecontinue to believe these steps are important and are encouraged thatFERC is beginning actions to address this recommendation. FERCrecognizes that it needs to improve its market oversight and is reviewingits statutory authority and market monitoring tools. In addition, wesuggested and continue to believe that the Congress might wish toconvene public hearings to review FERC’s authorizing legislation anddetermine, in consultation with FERC Commissioners, whether FERC’sauthorities need to be revised in light of the changing energy markets. Ofparticular concern would be any changes needed to support FERC’s newOffice of Market Oversight and Investigation. CFTC, consistent with itsauthority, did not monitor activity in the OTC markets during the winter of2000-2001, but it is continuing its investigation into whether OTC energyderivatives markets were manipulated during this period. Findings fromthese investigations may lead to enforcement actions and may alsohighlight the need for changes in federal oversight. Finally, EIA hasrecognized the need to collect more accurate and timely data on thenatural gas market and has begun taking steps to update its data collectionprogram for natural gas. We support these efforts and believe it isimportant that the agency continue to refine its efforts to provide moretimely natural gas market data and focus on implementing changes to itsnatural gas data collection program as soon as possible.
We provided FERC, EIA, and CFTC with a draft of this report for reviewand comment. FERC generally agreed with our conclusions (see app. VI),and noted that it previously lacked an adequate regulatory and oversightapproach to monitor a restructured natural gas industry. FERC stated thatwith the creation of its Office of Market Oversight and Investigation it hastaken the steps needed to oversee and assess the fair and efficientoperation of electric power and natural gas markets. In addition to its
Agency Comments

Page 46 GAO-03-46 Analysis of Changes in Natural Gas Prices
letter, FERC provided us with technical changes to our draft, which weincorporated into the final report as appropriate. EIA generally agreedwith our conclusions (see app. VII), and noted that it recognized the needto collect more accurate and timely data on the natural gas market and hasbegun taking steps to update its data collection program for natural gas. Inaddition to its letter, EIA provided us with technical changes to our draft,which we incorporated into the final report as appropriate. CFTC did notprovide us a formal letter, but met with us to provide us with technicalchanges, which we incorporated into the report as appropriate. It alsogenerally agreed to our conclusions.
Copies of this report will also be sent to the FERC Chairman, the CFTCChairman, the DOE Secretary, and other interested parties. We will makecopies available to others upon request. In addition, the report will beavailable at no charge at GAO’s Web site at http: www.gao.gov.
Questions about this report should be directed to me at (202) 512-3841.Key contributors to this report are listed in appendix VIII.
Jim WellsDirector, Natural Resources and Environment
Page 47 GAO-03-46 Analysis of Changes in Natural Gas Prices
List of Addressees
The Honorable Jeff BingamanChairmanThe Honorable Frank MurkowskiRanking Minority MemberCommittee on Energy and Natural ResourcesUnited States Senate
The Honorable Joseph I. LiebermanChairmanThe Honorable Fred ThompsonRanking Minority MemberCommittee on Governmental AffairsUnited States Senate
The Honorable Tom HarkinThe Honorable Fred ThompsonUnited States Senate
The Honorable W.J. “Billy” TauzinChairmanThe Honorable John D. DingellRanking Minority MemberCommittee on Energy and CommerceHouse of Representatives
The Honorable Dan BurtonChairmanThe Honorable Henry A. WaxmanRanking Minority MemberCommittee on Government ReformHouse of Representatives
The Honorable Spencer BachusThe Honorable Ed BryantThe Honorable Bob ClementThe Honorable Bud CramerThe Honorable Bob EtheridgeThe Honorable Bart GordonThe Honorable Edward J. MarkeyThe Honorable Janice D. SchakowskyThe Honorable John M. Spratt, Jr.The Honorable John Tanner

Page 48 GAO-03-46 Analysis of Changes in Natural Gas Prices
The Honorable Mike ThompsonThe Honorable Zach WampHouse of Representatives

Appendix I: Objectives, Scope, and
Methodology
Page 49 GAO-03-46 Analysis of Changes in Natural Gas Prices
In our study of the natural gas market, we addressed (1) the factors thatinfluence price volatility and, in particular, the high prices that occurredduring the winter of 2000-2001; (2) the federal government’s role inensuring that natural gas prices are determined in a competitive andinformed marketplace; and (3) choices available to gas utility companiesthat want to mitigate the effects of future price spikes on their residentialgas customers.
To address these objectives, we reviewed pertinent documents andobtained information and views from a wide range of officials in bothgovernment and the private sector. Our review encompassed the entirenatural gas market from the wellhead, where gas is produced and firstvalued, to the end-user. We obtained information and views from federal,state, and local agencies and from natural gas industry officials through avariety of means, including interviews and surveys. We interviewedanalysts from the Department of Energy’s Energy InformationAdministration (EIA), the Federal Energy Regulatory Commission (FERC),the Commodity Futures Trading Commission (CFTC), the New YorkMercantile Exchange (NYMEX), companies involved in over-the-countergas markets, such as the Intercontinental Exchange, and state utilityregulatory commissions, to obtain their views on the factors that influencenatural gas prices. We also discussed natural gas prices withrepresentatives from various industry organizations, including theAmerican Gas Association (AGA), the American Public Gas Association(APGA), the National Association of Regulatory Utility Commissioners(NARUC), the National Association of State Utility Consumer Advocates,the Natural Gas Supply Association, the Independent PetroleumAssociation of America, and the Interstate Natural Gas Association ofAmerica. Finally, we spoke with various individuals who work in thenatural gas industry, including experts working at production companies,gas marketing companies, and gas utilities.
In addition to our interviews, we obtained and analyzed natural gas pricedata supplied by the EIA, Data Resources, Incorporated (DRI), andNYMEX. The EIA provided wholesale gas prices, city gate prices, and end-user prices by customer class and by state, while the DRI databaseprovided prices for the Henry Hub spot market prices and NYMEXofficials provided prices for NYMEX natural gas futures contracts. Ouranalyses focused on how gas prices have behaved since 1993, whennatural gas wholesale prices became fully deregulated. We also collectedand analyzed data on factors that influence natural gas supply anddemand, such as production, storage, consumption, weather, and gas-firedelectric generation, as well as data on natural gas derivatives trading.
Appendix I: Objectives, Scope, andMethodology

Appendix I: Objectives, Scope, and
Methodology
Page 50 GAO-03-46 Analysis of Changes in Natural Gas Prices
Because residential customers usually have limited ability to switch toalternate fuels and few choices concerning who will supply their naturalgas, we concentrated on determining how high prices affected this groupof end users and what gas utilities can do to protect them from futureprice spikes.
We also reviewed laws and regulations pertaining to CFTC’s, EIA’s, andFERC’s responsibilities for monitoring and providing information aboutthe natural gas market. In addition, we identified key changes in naturalgas regulation and in the development of the natural gas market thatchanged how gas prices are established. We also examined pertinentCFTC, EIA, and FERC documents, including annual reports and filings,staff research papers, fact sheets, reports, and congressional testimonies.
We surveyed a sample of both investor-owned and municipally-owned gasutility companies to determine how they acquire their natural gas andwhat actions they have taken or plan to take to mitigate the effects offuture price spikes. We identified our sample primarily from the lists ofmember utilities belonging to the AGA and the APGA. The AGA generallyrepresents larger, investor-owned gas utilities; whereas, the APGAgenerally represents smaller, municipal gas utility companies. Since somecompanies were members of both organizations, we adjusted our sampleby removing duplicates from the APGA list. We also included in our surveyfour large gas utility companies, which were identified by AGA staff asmajor utilities that are not members of their organization. Thus, ouroverall population consisted of all gas utility companies in the UnitedStates that were members of either the AGA or APGA, plus four additionalcompanies.
We sent survey questionnaires to the 112 gas utilities on AGA’smembership list, plus the 4 large investor-owned utilities that are notmembers of the AGA. In addition, we selected 17 large municipal utilitiesfrom APGA’s members list of 923 utilities for inclusion in our survey. Eachof these 17 companies reported that it serves more than 20,000 customers.Thus, the first group of gas utilities we surveyed, referred to as the AGAgroup, consisted of 133 companies that serve large customer bases anddeliver a large majority of the total volume of natural gas sold in thiscountry. According to AGA, their members plus four additional largecompanies account for more than 90 percent of the natural gas deliveredby gas utilities annually in the United States. We then selected a statisticalsample from the remaining 906 (923–17) municipally-owned gas utilitiesfound on the APGA members list. Our sample consisted of 342 municipalutilities, which provided 95 percent confidence intervals of +5 percentage

Appendix I: Objectives, Scope, and
Methodology
Page 51 GAO-03-46 Analysis of Changes in Natural Gas Prices
points. Thus, our second group of gas utilities, referred to as the APGAgroup, consisted of 342 municipal companies that tend to have smallercustomer bases. Before mailing our survey questionnaire to the twogroups, we pretested it at six utility companies across the country thatserve a range of customers. During these visits, we administered thesurvey and asked the utility staff to fill out the survey as if they hadreceived it in the mail. After completing the survey, we interviewed therespondents to ensure that (1) the questions were clear and unambiguous,(2) the terms we used were precise, (3) the questionnaire did not place anundue burden on the staff completing it, and (4) the questionnaire wasindependent and unbiased.
We did not receive a high enough response rate to our survey of gas utilitycompanies to allow us to generalize the results of our analysis to all gasutilities located in the United States. We did, however, receive responsesfrom 90 or 68 percent of the 133 companies in the first group (AGA list)and 179 responses or 52 percent of the 342 companies in the second group(APGA list). Because we cannot generalize the results of our survey, wehave reported the results from the two groups–large utilities (AGA) andsmall utilities (APGA)–separately.
We also surveyed staff from the utility regulatory agencies of the 48contiguous states and the District of Colombia. We did not include Alaskaand Hawaii in our survey, as these states are unique in their use of naturalgas because their geographic locations separate them from the rest of thecountry’s natural gas infrastructure. We pretested our questionnaire withthe regulatory agencies in Maryland, New Mexico, and the District ofColumbia and then completed a structured interview with staff from the 48states and the District of Colombia. However, because the NebraskaPublic Service Commission does not regulate gas utility companies (suchregulation occurs at the local government level), we exempted this statefrom our analysis of regulatory agencies. To identify the most qualifiedperson within the agencies to contact, we obtained a list from NARUC,whose members include the governmental agencies that are engaged in theregulation of utilities and carriers of telecommunications, energy, andwater. In cases where NARUC was unable to provide a contact, we calledthe agency directly.
We performed our review from June 2001 through September 2002 inaccordance with generally accepted government auditing standards.However, we were unable to assess the accuracy of the natural gas pricesand other information provided by the EIA or the DRI database, as noresources exist to verify this data.

Appendix II: Results of Investor-Owned and
Municipally Owned Utility Survey
Page 52 GAO-03-46 Analysis of Changes in Natural Gas Prices
We mailed a questionnaire to 475 from a population of 1,039 gas utilities in thecontinental United States. The questionnaire, reprinted below, contained 33 questionscovering the utility’s basic characteristics, gas purchasing strategy for residentialcustomers, use of hedging tools, and regulatory framework.
In the following results we provide statistics for our two sampling groups. Weidentified these groups primarily from the lists of member utilities belonging to AGAand APGA. The first group consists primarily of AGA members, which are generallylarge, investor-owned gas utilities. This group also includes four large investor-ownedutilities identified by AGA staff as the investor-owned utilities that did not belong totheir organization, as well as the 17 companies on the APGA list that reported servingmore than 20,000 natural gas customers. For simplicity, in the results we refer to thisgroup as AGA. The second group consists of a sample of the APGA mailing list, whichtend to be small, municipally owned gas utilities. In the results we refer to this groupas APGA. We received responses from 269 utilities; 90 from AGA members for aresponse rate of 68 percent and 179 from APGA members for a response rate of 52percent.
For most of the questions of the reprinted survey, we identified the percent of utilitiesthat marked each box to each question. For other questions, we included tables of theresponses in appendix III and referred the reader to these tables. For the questions onpopulation, we included the mean, median and range of responses. Also, several gasutilities did not respond to each question, so some questions have fewer totalrespondents than others. We included the number of respondents to each question,with N referring to the total number of respondents that answered a question and nreferring to the number of respondents that indicated a certain answer to a question.
Appendix II: Results of Investor-Owned andMunicipally Owned Utility Survey

Appendix II: Results of Investor-Owned and
Municipally Owned Utility Survey
Page 53 GAO-03-46 Analysis of Changes in Natural Gas Prices

Appendix II: Results of Investor-Owned and
Municipally Owned Utility Survey
Page 54 GAO-03-46 Analysis of Changes in Natural Gas Prices

Appendix II: Results of Investor-Owned and
Municipally Owned Utility Survey
Page 55 GAO-03-46 Analysis of Changes in Natural Gas Prices

Appendix II: Results of Investor-Owned and
Municipally Owned Utility Survey
Page 56 GAO-03-46 Analysis of Changes in Natural Gas Prices

Appendix II: Results of Investor-Owned and
Municipally Owned Utility Survey
Page 57 GAO-03-46 Analysis of Changes in Natural Gas Prices
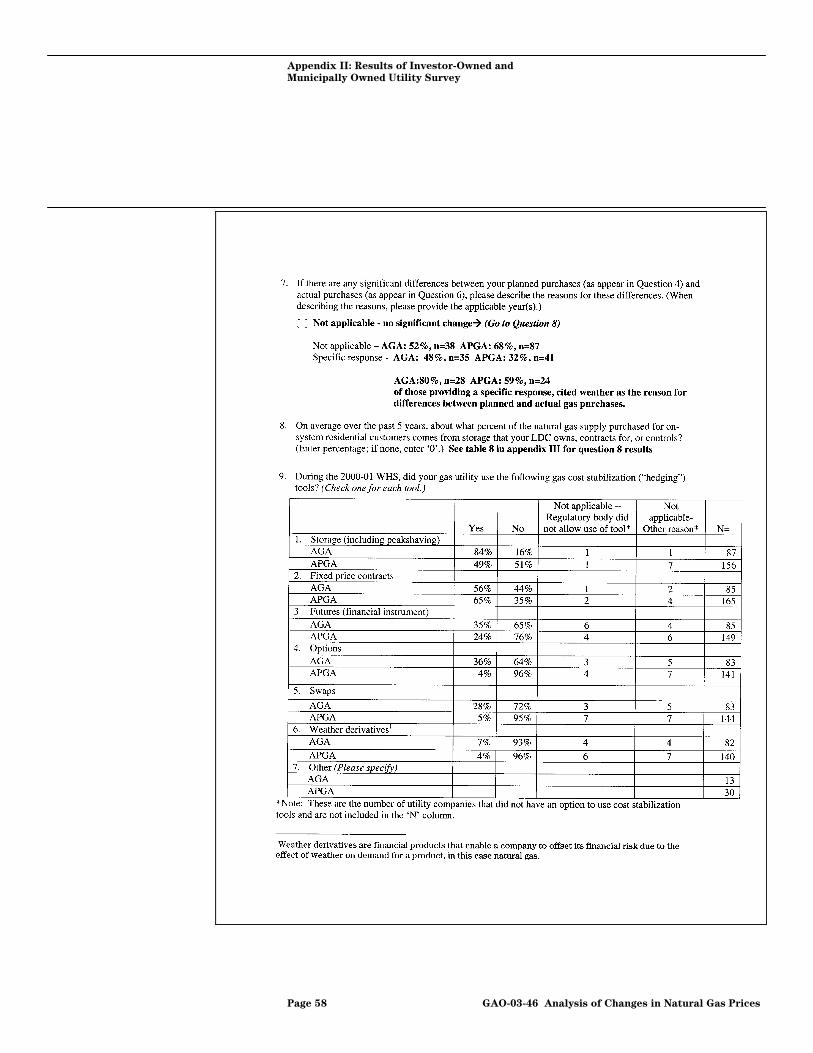
Appendix II: Results of Investor-Owned and
Municipally Owned Utility Survey
Page 58 GAO-03-46 Analysis of Changes in Natural Gas Prices

Appendix II: Results of Investor-Owned and
Municipally Owned Utility Survey
Page 59 GAO-03-46 Analysis of Changes in Natural Gas Prices

Appendix II: Results of Investor-Owned and
Municipally Owned Utility Survey
Page 60 GAO-03-46 Analysis of Changes in Natural Gas Prices

Appendix II: Results of Investor-Owned and
Municipally Owned Utility Survey
Page 61 GAO-03-46 Analysis of Changes in Natural Gas Prices

Appendix II: Results of Investor-Owned and
Municipally Owned Utility Survey
Page 62 GAO-03-46 Analysis of Changes in Natural Gas Prices
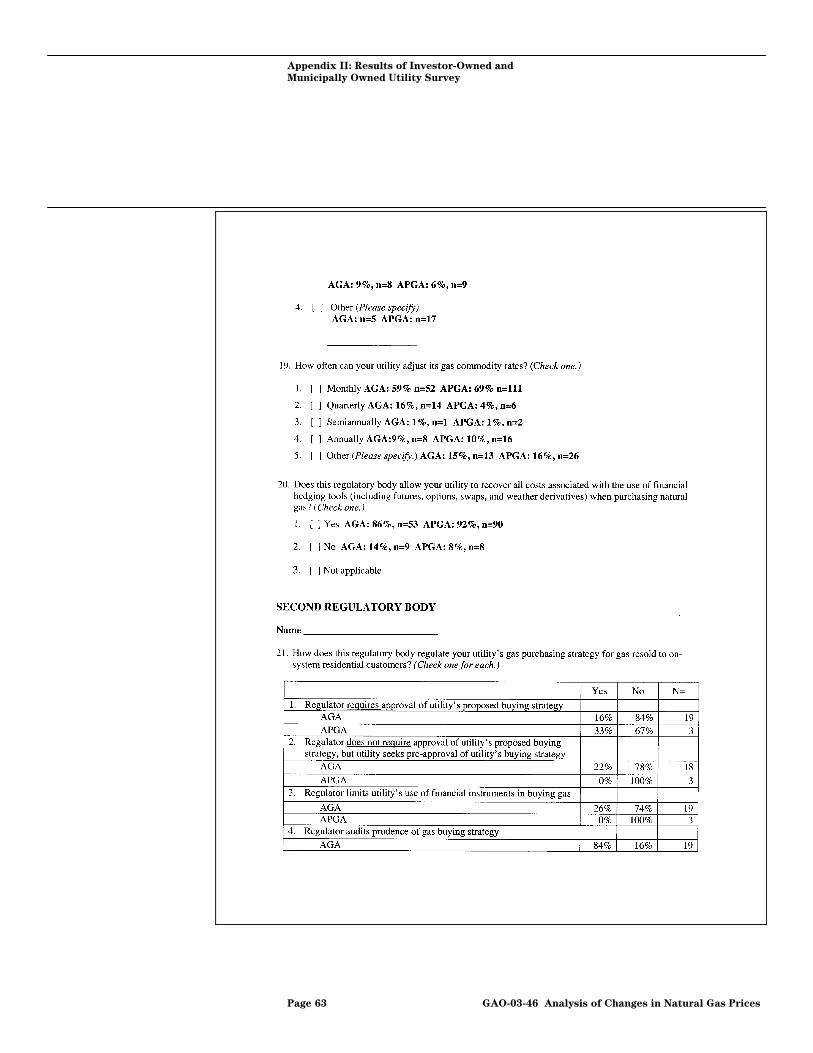
Appendix II: Results of Investor-Owned and
Municipally Owned Utility Survey
Page 63 GAO-03-46 Analysis of Changes in Natural Gas Prices
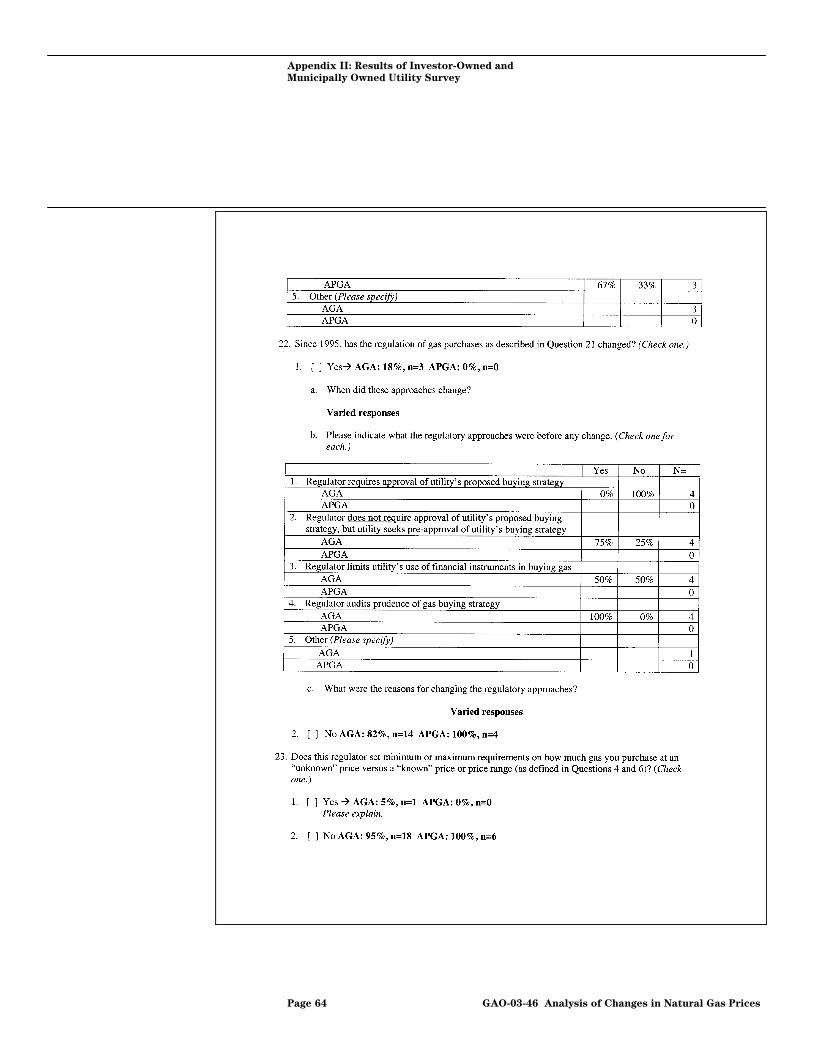
Appendix II: Results of Investor-Owned and
Municipally Owned Utility Survey
Page 64 GAO-03-46 Analysis of Changes in Natural Gas Prices

Appendix II: Results of Investor-Owned and
Municipally Owned Utility Survey
Page 65 GAO-03-46 Analysis of Changes in Natural Gas Prices

Appendix II: Results of Investor-Owned and
Municipally Owned Utility Survey
Page 66 GAO-03-46 Analysis of Changes in Natural Gas Prices

Appendix II: Results of Investor-Owned and
Municipally Owned Utility Survey
Page 67 GAO-03-46 Analysis of Changes in Natural Gas Prices

Appendix II: Results of Investor-Owned and
Municipally Owned Utility Survey
Page 68 GAO-03-46 Analysis of Changes in Natural Gas Prices

Appendix III: Additional Results of Investor-
Owned and Municipally Owned Utility Survey
Page 69 GAO-03-46 Analysis of Changes in Natural Gas Prices
The tables in this appendix list results from our survey of 269 gas utilitiesthat could not be displayed in the body of the survey. Table 5 identifies thepercentage of the residential customers’ gas supply that gas utilitiesplanned to hedge during the winters of 1995-1996 through 2001-2002. It islikely that fewer utilities answered for earlier years because somecompanies do not keep records for many years. Table 6 identifies thepercentage of the residential customers’ gas supply that gas utilitiesactually hedged during the winters of 2000-2001 and 2001-2002. Table 7identifies the volumes that gas utilities planned to purchase and actuallypurchased for residential customers in the winters of 1999-2000 through2001-2002. These volumes cannot be directly compared in some casesbecause the number of respondents may differ. However, as shown inappendix II, differences between planned and actual gas purchases werein large part due to changes in weather. Finally, table 8 identifies howmuch of utilities’ gas supply came from storage on average over the last 5years.
Table 5: Gas Utilities’ Planned Use of Hedging for Residential Customers
AGAPercentage of natural gas supplyutilities planned to hedge duringthe winter heating season
1995-1996(N=44)
1996-1997(N=43)
1997-1998(N=45)
1998-1999(N=48)
1999-2000(N=81)
2000-2001(N=84)
2001-2002(N=86)
0 39 35 27 23 21 20 101 to 49 43 49 42 42 38 36 2750 to 99 14 12 24 29 32 37 52100 5 5 7 6 9 7 10APGAPercentage of natural gas supplyutilities planned to hedge duringthe winter heating season
1995-1996(N=88)
1996-1997(N=89)
1997-1998(N=93)
1998-1999(N=96)
1999-2000(N=159)
2000-2001(N=159)
2001-2002(N=159)
0 45 42 41 36 31 32 101 to 49 7 7 6 9 14 12 950 to 99 20 24 24 30 28 31 46100 27 28 29 24 28 25 35
Source: GAO.
Appendix III: Additional Results of Investor-Owned and Municipally Owned Utility Survey

Appendix III: Additional Results of Investor-
Owned and Municipally Owned Utility Survey
Page 70 GAO-03-46 Analysis of Changes in Natural Gas Prices
Table 6: Gas Utilities’ Actual Use of Hedging for Residential Customers during theWinters of 2000-2001 and 2001-2002
AGAPercentage of natural gas supply utilities actuallyhedged
2000-2001(N=85)
2001-2002(N=46)
0 18 91 to 49 44 2650 to 99 31 57100 8 9APGAPercentage of natural gas supply utilities actuallyhedged
2000-2001(N=161)
2001-2002(N=86)
0 30 121 to 49 16 1250 to 99 29 38100 25 38
Source: GAO.
Table 7: Gas Utilities’ Planned and Actual Volumes of Natural Gas Purchasedduring the Winter Heating Season for Residential Customers
AGA Median Range N=Planned volumes
1999-2000 4,373,786 46,647-200,000,000 732000-2001 4,229,400 49,127-210,000,000 732001-2002 4,940,969 46,800-220,000,000 73
Actual volumes1999-2000 3,652,357 46,647-193,000,000 732000-2001 4,865,541 49,127-228,000,000 73
APGA Median Range N=Planned volumes
1999-2000 97,708 5,100-154,000,000 1182000-2001 100,000 6,200-145,000,000 1222001-2002 100,000 6,000-125,000,000 127
Actual volumes1999-2000 95,000 5,000-145,000,000 1372000-2001 95,000 5,820-125,000,000 141
Source: GAO.

Appendix III: Additional Results of Investor-
Owned and Municipally Owned Utility Survey
Page 71 GAO-03-46 Analysis of Changes in Natural Gas Prices
Table 8: Use of Natural Gas Storage Among Utilities (on Average over the Past 5Years)
Percentage of gas supply for residential customers instorage
AGAN=79
APGAN=146
0 15 531 to 25 37 2726 to 50 42 1351 to 100 6 8
Source: GAO.
Appendix IV: Results of State Regulatory
Agency Survey
Page 72 GAO-03-46 Analysis of Changes in Natural Gas Prices
We surveyed staff specializing in natural gas regulation from the state regulatoryagencies, which are usually known as public utility commissions or public servicecommissions, that oversee gas utilities. We contacted the agencies of the 48contiguous states and the District of Colombia in a series of structured telephoneinterviews. However, because the Nebraska Public Service Commission does notregulate gas utility companies (such regulation occurs at the local government level),we exempted this state from our analysis of regulatory agencies. Therefore wereceived responses from a total of 48 state regulatory agencies.
For each question in the reprinted survey, we identified the number of stateregulatory agencies that indicated each response. A few commissions did not respondto all of the questions, so some questions have fewer total respondents than others. Inaddition, certain questions are presented in greater detail in appendix V.
Appendix IV: Results of State RegulatoryAgency Survey

Appendix IV: Results of State Regulatory
Agency Survey
Page 73 GAO-03-46 Analysis of Changes in Natural Gas Prices
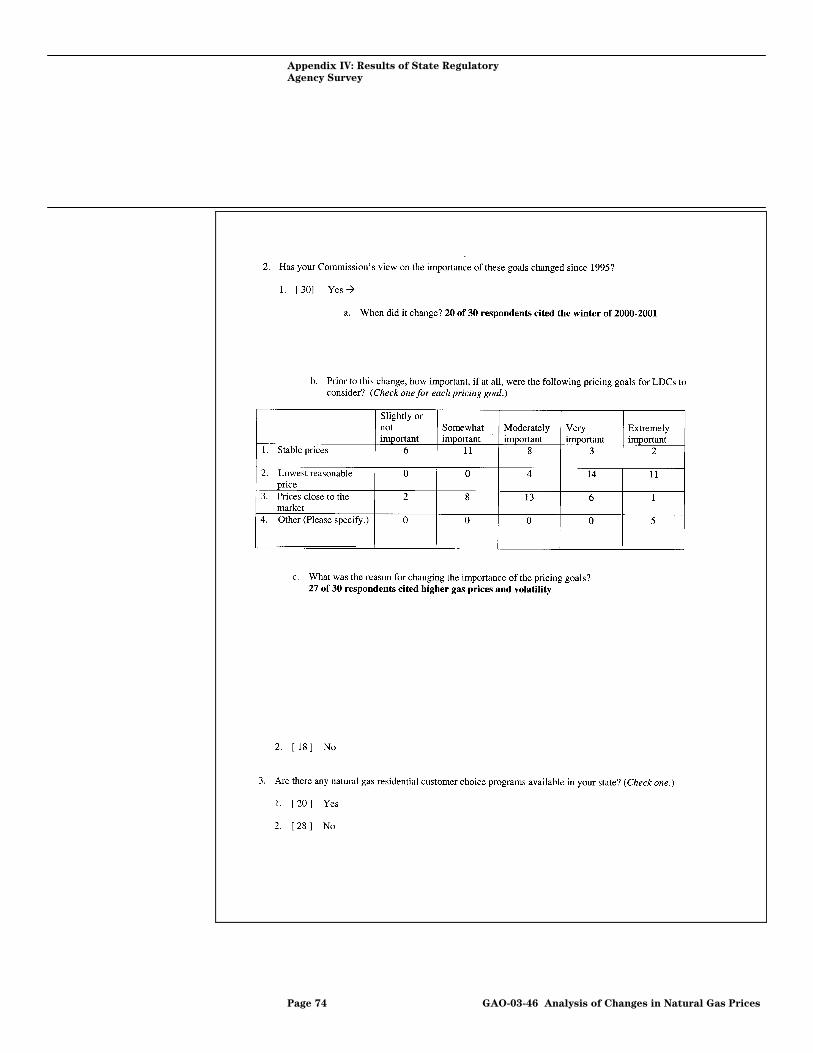
Appendix IV: Results of State Regulatory
Agency Survey
Page 74 GAO-03-46 Analysis of Changes in Natural Gas Prices

Appendix IV: Results of State Regulatory
Agency Survey
Page 75 GAO-03-46 Analysis of Changes in Natural Gas Prices

Appendix IV: Results of State Regulatory
Agency Survey
Page 76 GAO-03-46 Analysis of Changes in Natural Gas Prices

Appendix IV: Results of State Regulatory
Agency Survey
Page 77 GAO-03-46 Analysis of Changes in Natural Gas Prices

Appendix IV: Results of State Regulatory
Agency Survey
Page 78 GAO-03-46 Analysis of Changes in Natural Gas Prices

Appendix V: Additional Results of State
Regulatory Agency Survey
Page 79 GAO-03-46 Analysis of Changes in Natural Gas Prices
This appendix provides selected results from our survey of regulatoryagencies located in the 48 contiguous states and the District of Columbia.Table 9 shows what hedging tools the state and the District of Columbiaregulatory agencies allow or do not allow gas utilities under theirjurisdiction to use when purchasing natural gas for their residentialcustomers. Table 10 shows the various approaches the regulatory agenciesuse in their oversight of gas utilities.
Table 9: State Regulatory Agency Regulation of Hedging Techniques Used by Utilities for Natural Gas Purchases
State regulatoryagency Storage
Fixed pricecontracts Futures Options Swaps
Weatherderivatives
Alabama Public ServiceCommission
Allows Allows Allows Allows Allows Does not allow
Arizona CorporationCommission
N/Aa Allows N/A N/A N/A N/A
Arkansas Public ServiceCommission
Allows Allows Allows Allows Allows N/A
California Public UtilityCommission
Allows Allows Allows Allows Allows N/A
Colorado Department ofRegulatory Agencies,Public UtilityCommission
Allows Allows Allows Allows Allows N/A
Connecticut Departmentof Public Utility Control
Allows N/A N/A N/A N/A N/A
Delaware Public ServiceCommission
Allows Allows Allows Allows Allows Allows
District of ColumbiaPublic ServiceCommission
Allows Allows Allows Allows N/A N/A
Florida Public ServiceCommission
N/A Allows Allows Allows Allows N/A
Georgia Public ServiceCommission
Allows Allows Allows Does not allow Does not allow Does not allow
Idaho Public Utilities Allows Allows Allows Allows Allows AllowsIllinois CommerceCommission
Allows Allows Allows Allows Allows Allows
Indiana UtilityRegulatory Commission
Allows Allows Allows Allows Allows Allows
Kansas CorporationCommission
Allows Allows Allows Allows Allows Allows
Kentucky Public ServiceCommission
Allows Allows Allows Allows Allows N/A
Louisiana Public ServiceCommission
Allows Allows Allows Allows Allows Allows
Maine Public UtilityCommission
Allows Allows Allows Allows Allows Allows
Maryland Public ServiceCommission
Allows Allows Allows Allows Allows Allows
Appendix V: Additional Results of StateRegulatory Agency Survey

Appendix V: Additional Results of State
Regulatory Agency Survey
Page 80 GAO-03-46 Analysis of Changes in Natural Gas Prices
State regulatoryagency Storage
Fixed pricecontracts Futures Options Swaps
Weatherderivatives
MassachusettsDepartment of PublicUtilities
Allows N/A N/A N/A N/A N/A
Michigan Public ServiceCommission
Allows Allows Allows Allows N/A N/A
Minnesota Public UtilityCommission
Allows Allows Allows Allows N/A N/A
Mississippi PublicUtilities Staff
Allows Allows Allows Allows Allows Does not allow
Missouri Public ServiceCommission
Allows Allows Allows Allows N/A N/A
Montana Public ServiceCommission
Allows Allows Does not allow Does not N/A Allows
Nebraska Public ServiceCommission
No response No response No response No response No response No response
Nevada Public UtilitiesCommission
Allows Allows Allows Allows Allows Allows
North CarolinaDepartment ofCommerce UtilitiesCommission
Allows Allows Allows Allows Allows Allows
North Dakota PublicService Commission
Allows Allows Allows Allows Allows Allows
New Hampshire PublicUtilities Commission
Allows Allows Allows Allows Allows Allows
New Jersey Board ofPublic Utilities
Allows Allows Allows Does not allow Allows Allows
New Mexico PublicRegulatory Commission
Allows Allows Allows Allows Allows Allows
New York PublicService Commission
Allows Allows Allows Allows Allows Allows
Ohio Public UtilityCommission
Allows Allows Allows Allows Allows Allows
OklahomaCorporationCommission, PublicUtility Division
Allows Allows N/A N/A N/A N/A
Oregon Public UtilityCommission
Allows Allows Allows Allows Allows N/A
Pennsylvania PublicUtility Commission
Allows Allows Allows Allows Allows N/A
Rhode Island PublicUtility Commission
Allows Allows Allows Allows Allows Does not allow
South Carolina PublicService Commission
Allows Allows Allow Allows No response No response
South Dakota PublicUtilities Commission
Allows Allows Allows Allows Allows Allows
Tennessee RegulatoryAuthority, Energy andWater Division
Allows Allows Allows Allows Allows N/A

Appendix V: Additional Results of State
Regulatory Agency Survey
Page 81 GAO-03-46 Analysis of Changes in Natural Gas Prices
State regulatoryagency Storage
Fixed pricecontracts Futures Options Swaps
Weatherderivatives
Texas RailroadCommission
N/A N/A N/A N/A N/A N/A
Utah Public ServiceCommission
Allows Allows Allows Allows Allows Allows
Vermont Public ServiceBoard
Allows Allows Allows Allows Allows Allows
Virginia StateCorporationCommission
Allows Allows Allows Allows Allows N/A
Washington Utilities andTransportationCommission
Allows Allows Allows Allows Allows N/A
West Virginia PublicService Commission
Allows Allows Allows Allows Allows N/A
Wisconsin PublicService Commission
Allows Allows Allows Allows Allows N/A
Wyoming Public ServiceCommission
Allows Allows Allows Allows Allows Allows
aEither the regulatory agency has not addressed this technique in its policy or procedures or thetechnique is not available.
Source: GAO.
Table 10: State Regulatory Agency Oversight of Gas Utilities
Regulatoryagency
Regulatoryapproval ofbuying strategyrequired
Utilities seekapproval ofbuying strategybut not required
Regulator limits Useof financialderivatives
Regulator conductsprudence audits
Since 1995regulator hasdisallowed utilitygas commoditycosts
Alabama PublicServiceCommission
No No No No No
ArizonaCorporationCommission
No No No Yes No
Arkansas PublicServiceCommission
No Yes No Yes No
California PublicUtility Commission
No No Yes Yes Yes
ColoradoDepartment ofRegulatoryAgencies, PublicUtility Commission
No No No Yes No
ConnecticutDepartment ofPublic UtilityControl
No No No Yes Yes
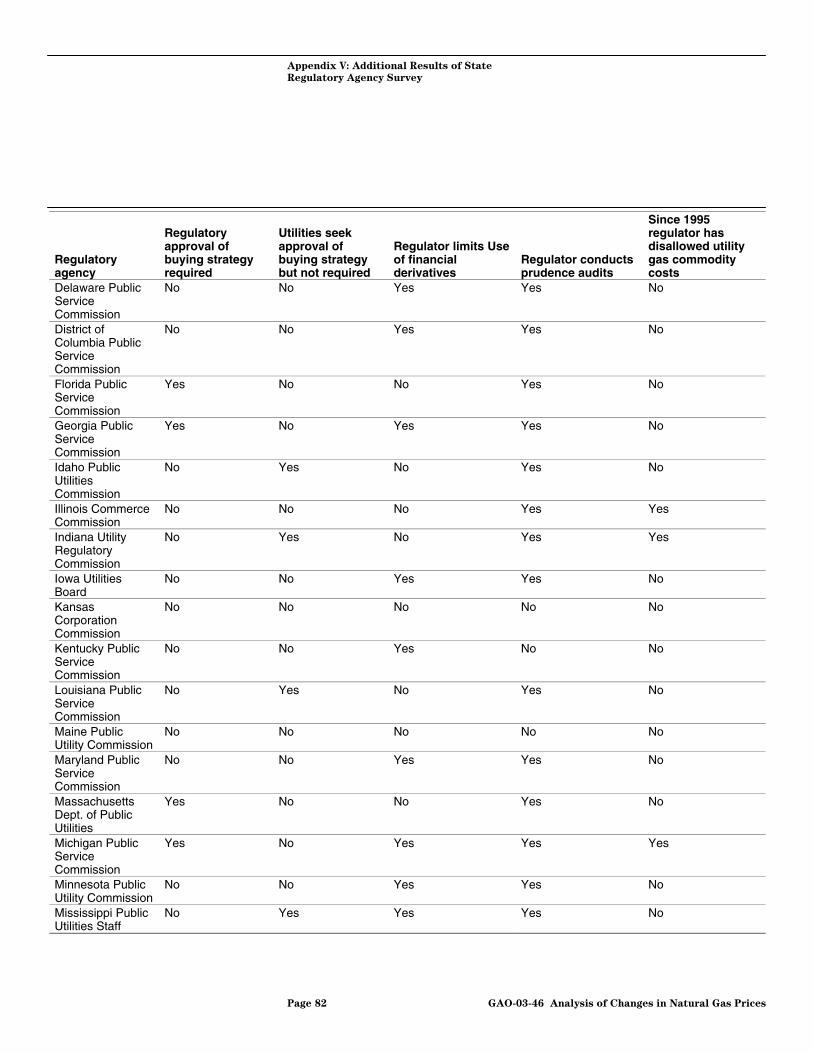
Appendix V: Additional Results of State
Regulatory Agency Survey
Page 82 GAO-03-46 Analysis of Changes in Natural Gas Prices
Regulatoryagency
Regulatoryapproval ofbuying strategyrequired
Utilities seekapproval ofbuying strategybut not required
Regulator limits Useof financialderivatives
Regulator conductsprudence audits
Since 1995regulator hasdisallowed utilitygas commoditycosts
Delaware PublicServiceCommission
No No Yes Yes No
District ofColumbia PublicServiceCommission
No No Yes Yes No
Florida PublicServiceCommission
Yes No No Yes No
Georgia PublicServiceCommission
Yes No Yes Yes No
Idaho PublicUtilitiesCommission
No Yes No Yes No
Illinois CommerceCommission
No No No Yes Yes
Indiana UtilityRegulatoryCommission
No Yes No Yes Yes
Iowa UtilitiesBoard
No No Yes Yes No
KansasCorporationCommission
No No No No No
Kentucky PublicServiceCommission
No No Yes No No
Louisiana PublicServiceCommission
No Yes No Yes No
Maine PublicUtility Commission
No No No No No
Maryland PublicServiceCommission
No No Yes Yes No
MassachusettsDept. of PublicUtilities
Yes No No Yes No
Michigan PublicServiceCommission
Yes No Yes Yes Yes
Minnesota PublicUtility Commission
No No Yes Yes No
Mississippi PublicUtilities Staff
No Yes Yes Yes No
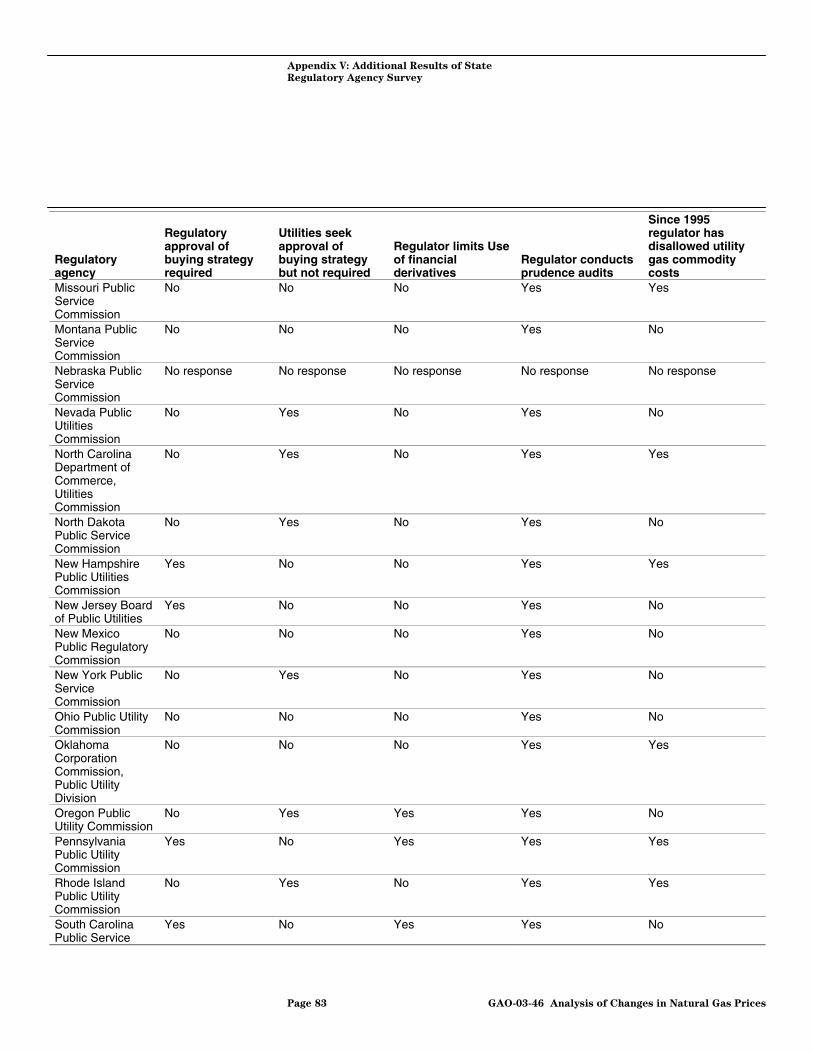
Appendix V: Additional Results of State
Regulatory Agency Survey
Page 83 GAO-03-46 Analysis of Changes in Natural Gas Prices
Regulatoryagency
Regulatoryapproval ofbuying strategyrequired
Utilities seekapproval ofbuying strategybut not required
Regulator limits Useof financialderivatives
Regulator conductsprudence audits
Since 1995regulator hasdisallowed utilitygas commoditycosts
Missouri PublicServiceCommission
No No No Yes Yes
Montana PublicServiceCommission
No No No Yes No
Nebraska PublicServiceCommission
No response No response No response No response No response
Nevada PublicUtilitiesCommission
No Yes No Yes No
North CarolinaDepartment ofCommerce,UtilitiesCommission
No Yes No Yes Yes
North DakotaPublic ServiceCommission
No Yes No Yes No
New HampshirePublic UtilitiesCommission
Yes No No Yes Yes
New Jersey Boardof Public Utilities
Yes No No Yes No
New MexicoPublic RegulatoryCommission
No No No Yes No
New York PublicServiceCommission
No Yes No Yes No
Ohio Public UtilityCommission
No No No Yes No
OklahomaCorporationCommission,Public UtilityDivision
No No No Yes Yes
Oregon PublicUtility Commission
No Yes Yes Yes No
PennsylvaniaPublic UtilityCommission
Yes No Yes Yes Yes
Rhode IslandPublic UtilityCommission
No Yes No Yes Yes
South CarolinaPublic Service
Yes No Yes Yes No

Appendix V: Additional Results of State
Regulatory Agency Survey
Page 84 GAO-03-46 Analysis of Changes in Natural Gas Prices
Regulatoryagency
Regulatoryapproval ofbuying strategyrequired
Utilities seekapproval ofbuying strategybut not required
Regulator limits Useof financialderivatives
Regulator conductsprudence audits
Since 1995regulator hasdisallowed utilitygas commoditycosts
Commission
South DakotaPublic UtilitiesCommission
No No No No No
TennesseeRegulatoryAuthority, Energyand WaterDivision
No No Yes Yes Yes
Texas RailroadCommission
No No No Yes Yes
Utah PublicServiceCommission
No Yes No Yes No
Vermont PublicService Board
No Yes No Yes Yes
Virginia StateCorporationCommission
Yes No No No No
WashingtonUtilities andTransportationCommission
No Yes No Yes No
West VirginiaPublic ServiceCommission
No No No Yes No
Wisconsin PublicServiceCommission
Yes No Yes Yes No
Wyoming PublicServiceCommission
No Yes No Yes No
Source: GAO.

Appendix VI: Comments from the Federal Energy
Regulatory Commission
Page 85 GAO-03-46 Analysis of Changes in Natural Gas Prices
Appendix VI: Comments from the FederalEnergy Regulatory Commission

Appendix VI: Comments from the Federal Energy
Regulatory Commission
Page 86 GAO-03-46 Analysis of Changes in Natural Gas Prices

Appendix VI: Comments from the Federal Energy
Regulatory Commission
Page 87 GAO-03-46 Analysis of Changes in Natural Gas Prices

Appendix VII: Comments from the Energy Information Administration
Page 88 GAO-03-46 Analysis of Changes in Natural Gas Prices
Appendix VII: Comments from the EnergyInformation Administration

Appendix VII: Comments from the Energy Information Administration
Page 89 GAO-03-46 Analysis of Changes in Natural Gas Prices

Appendix VIII: GAO Contacts and Staff
Acknowledgments
Page 90 GAO-03-46 Analysis of Changes in Natural Gas Prices
Jim Wells (202) 512-3841
Mark Gaffigan (202) 512-3168
In addition to those named above, James Cooksey, James Rose, DarenSweeney, Timothy Minelli, Diane Berry, Philip Farah, Luann Moy, MarkRamage, Barbara Timmerman, and Nancy Crothers made keycontributions to this report.
Appendix VIII: GAO Contacts and StaffAcknowledgments
GAO Contacts
Acknowledgments
(360091)

The General Accounting Office, the investigative arm of Congress, exists tosupport Congress in meeting its constitutional responsibilities and to helpimprove the performance and accountability of the federal government for theAmerican people. GAO examines the use of public funds; evaluates federalprograms and policies; and provides analyses, recommendations, and otherassistance to help Congress make informed oversight, policy, and fundingdecisions. GAO’s commitment to good government is reflected in its core valuesof accountability, integrity, and reliability.
The fastest and easiest way to obtain copies of GAO documents at no cost isthrough the Internet. GAO’s Web site (www.gao.gov) contains abstracts and full-text files of current reports and testimony and an expanding archive of olderproducts. The Web site features a search engine to help you locate documentsusing key words and phrases. You can print these documents in their entirety,including charts and other graphics.
Each day, GAO issues a list of newly released reports, testimony, andcorrespondence. GAO posts this list, known as “Today’s Reports,” on its Web sitedaily. The list contains links to the full-text document files. To have GAO e-mailthis list to you every afternoon, go to www.gao.gov and select “Subscribe to dailyE-mail alert for newly released products” under the GAO Reports heading.
The first copy of each printed report is free. Additional copies are $2 each. Acheck or money order should be made out to the Superintendent of Documents.GAO also accepts VISA and Mastercard. Orders for 100 or more copies mailed to asingle address are discounted 25 percent. Orders should be sent to:
U.S. General Accounting Office441 G Street NW, Room LMWashington, D.C. 20548
To order by Phone: Voice: (202) 512-6000TDD: (202) 512-2537Fax: (202) 512-6061
Contact:
Web site: www.gao.gov/fraudnet/fraudnet.htmE-mail: [email protected] answering system: (800) 424-5454 or (202) 512-7470
Jeff Nelligan, managing director, [email protected] (202) 512-4800U.S. General Accounting Office, 441 G Street NW, Room 7149Washington, D.C. 20548
GAO’s Mission
Obtaining Copies ofGAO Reports andTestimony
Order by Mail or Phone
To Report Fraud,Waste, and Abuse inFederal Programs
Public Affairs


