GAO-03-236 Federal Employees' Health Plans: Premium · PDF fileexpenditures from 1998 to 2000...
37
Report to the Subcommittee on International Security, Proliferation, and Federal Services, Committee on Governmental Affairs, U.S. Senate United States General Accounting Office GAO December 2002 FEDERAL EMPLOYEES’ HEALTH PLANS Premium Growth and OPM’s Role in Negotiating Benefits GAO-03-236
Transcript of GAO-03-236 Federal Employees' Health Plans: Premium · PDF fileexpenditures from 1998 to 2000...

Report to the Subcommittee on International Security, Proliferation, and Federal Services, Committee on Governmental Affairs, U.S. Senate
United States General Accounting Office
GAO
December 2002 FEDERAL EMPLOYEES’ HEALTH PLANS
Premium Growth and OPM’s Role in Negotiating Benefits
GAO-03-236

FEHBP’s premium trends from 1991 to 2002 were generally in line with other large purchasers—increasing on average about 6 percent annually. OPM announced that average FEHBP premiums would increase about 11 percent in 2003, 2 percentage points less than in 2002 and less than some other large purchasers are expecting. FEHBP enrollees would likely have paid even higher premiums in recent years if not for modest benefit reductions and enrollees who shifted to less expensive plans. Increasing premiums are related to the plans’ higher claims expenditures. For FEHBP’s three largest plans, about 70 percent of increased claims expenditures from 1998 to 2000 was due to prescription drugs and hospital outpatient care. Most of the increase in drug expenditures was due to higher plan payments per drug, while the increase in hospital outpatient care expenditures was due to higher utilization. OPM relies on enrollee choice, competition among plans, and annual negotiations with participating plans to moderate premium increases. Whereas some large purchasers require plans to offer standardized benefit packages and reject bids from plans not offering satisfactory premiums, OPM contracts with all plans willing to meet minimum standards and allows plans to vary benefits, maximizing enrollees’ choices. Each year, OPM suggests cost containment strategies for plans to consider and relies on participating plans to propose benefits and premiums that will be competitive with other participating plans. OPM generally concurred with our findings. Average Annual Change in Premiums for FEHBP and Other Large Purchasers, 1991 through 2003
Note: FEHBP and large employers’ premium increases in 2001 and 2002 were within 0.3 percentage points of each other. The data from the Kaiser Family Foundation/Health Research and Educational Trust for large employers for 2003 were not available at the time of our work.
FEDERAL EMPLOYEES' HEALTH PLANS
Premium Growth and OPM's Role in Negotiating Benefits
www.gao.gov/cgi-bin/getrpt?GAO-03-236. To view the full report, including the scope and methodology, click on the link above. For more information, contact Kathryn G. Allen on (202) 512-7118.
Highlights of GAO-03-236, a report to the Subcommittee on International Security, Proliferation, and Federal Services, Committee on Governmental Affairs, U.S. Senate
December 2002
Federal employees’ health insurance premiums have increased at double-digit rates for 3 consecutive years. GAO was asked to examine how the Federal Employees Health Benefits Program’s (FEHBP) premium trends compared to those of other large purchasers of employer-sponsored health insurance, factors contributing to FEHBP’s premium growth, and steps the Office of Personnel Management (OPM) takes to help contain premium increases compared to those of other large purchasers. GAO compared FEHBP to the California Public Employees’ Retirement System (CalPERS), General Motors, and a large private-employer purchasing coalition in California as well as data from employee benefit surveys.

Page i GAO-03-236 Federal Employees' Health Premium Growth
Letter 1
Results in Brief 2 Background 4 Rise in FEHBP Premiums Has Been Similar to Increases for Other
Large Purchasers 9 Increases in Expenditures for Prescription Drugs and Hospital
Outpatient Care Drove Most of Recent Rise in Premiums for FEHBP’s Largest Plans 13
OPM’s Reliance on Competition among Plans and Annual Negotiations to Contain Premium Increases Differs in Some Ways from Other Large Purchasers 17
Comments from OPM and Other Reviewers 24
Appendix I Methodology 26
Appendix II Comments from the Office of Personnel
Management 30
Tables
Table 1: FFS Plans Participating in FEHBP, 2002 7 Table 2: Cost Drivers for the Three Largest FEHBP Plans, 1998 to
2000 14 Table 3: Selected Characteristics of FEHBP Compared to Health
Benefit Programs Offered through CalPERS, PBGH, and GM 29
Figures
Figure 1: Average Annual Change in Premiums, 1991 through 2003 10 Figure 2: Change in Per-Enrollee Claims Expenditures due to Plan
Payments and Utilization for Major Categories of Health Care Services for the Three Largest FEHBP Plans, 1998 to 2000 16
Contents

Page ii GAO-03-236 Federal Employees' Health Premium Growth
Abbreviations
BCBS Blue Cross and Blue Shield CalPERS California Public Employees’ Retirement System FEHBP Federal Employees Health Benefits Program FFS fee-for-service GEHA Government Employees Hospital Association, Inc. GM General Motors HMO health maintenance organization HRET Health Research and Educational Trust OPM Office of Personnel Management PBGH Pacific Business Group on Health POS point of service PPO preferred provider organization

Page 1 GAO-03-236 Federal Employees' Health Premium Growth
December 31, 2002
The Honorable Daniel K. Akaka Chairman The Honorable Thad Cochran Ranking Minority Member Subcommittee on International Security, Proliferation, and Federal Services Committee on Governmental Affairs United States Senate
After a period of decline in the mid-1990s, federal employees’ health insurance premiums have increased at double-digit rates in recent years. During the past 5 years, premiums for the Federal Employees Health Benefits Program (FEHBP)—which is the nation’s largest purchaser of employer-sponsored health benefits with about 8.3 million covered lives—have increased cumulatively by about 50 percent. For 2003, premiums are expected to increase on average about 11 percent following an average increase of about 13 percent in 2002.
Concerned about the continuing increases in FEHBP premiums, you asked that we analyze these premium increases and the Office of Personnel Management’s (OPM) approaches to containing cost growth and compare these increases and approaches to other large public- and private-sector purchasers of employer-sponsored health benefits. To do this, we examined
• trends for FEHBP’s premiums compared to premiums for other large purchasers over the last decade,
• factors that contributed most to FEHBP’s recent premium growth, and • steps that OPM takes to help contain premium increases compared to
those of other large purchasers. To identify trends in the federal government’s and other large purchasers’ health insurance premiums over the last decade, we obtained premium data from OPM, from the California Public Employees’ Retirement System (CalPERS)—the second largest public purchaser of employee health benefits—and, for other large purchasers, from the Kaiser Family Foundation/Health Research and Educational Trust (Kaiser/HRET) surveys of private employer-sponsored health benefits. To identify factors contributing to FEHBP premium trends, we analyzed available OPM data,
United States General Accounting Office
Washington, DC 20548

Page 2 GAO-03-236 Federal Employees' Health Premium Growth
including summary reports it received on enrollees’ health care utilization and related claim expenditures for 1998 through 2000 from the three largest nationwide plans participating in FEHBP. These three plans are all fee-for-service (FFS) plans and represented 90 percent of FEHBP enrollment in FFS plans and almost two-thirds of FEHBP enrollment in all plans. We also interviewed OPM officials. To ascertain how OPM and selected large purchasers attempt to control costs, we interviewed actuaries and other officials at OPM, CalPERS, General Motors (GM)—the largest private purchaser of employee health benefits in the United States—and the Pacific Business Group on Health (PBGH), a California-based purchaser representing 19 large employers. To obtain information on large purchasers’ cost containment strategies in general, we reviewed the literature and interviewed employee health benefit consultants. In addition, we reviewed the applicable statute and regulations and interviewed representatives of major plans participating in FEHBP and federal employee unions.
Appendix I provides more detailed information on our methodology. We performed our work from December 2001 through December 2002 in accordance with generally accepted government auditing standards.
Since 1991, the average increase in premiums for FEHBP has been similar to those of other major purchasers. Premiums for FEHBP, CalPERS, and other large employers increased, on average, about 6 percent per year from 1991 through 2002. FEHBP premium increases were lower than other large purchasers’ average from 1991 to 1996, while from 1997 to 2002 FEHBP’s premium increases were higher than other large purchasers. The 11 percent average premium increase in 2003 for all FEHBP plans that OPM announced in September 2002 represents a lower rate of increase than FEHBP’s 13.3 percent average increase in 2002 and is less than some employee-benefit experts expect for many other purchasers. For example, CalPERS health maintenance organizations’ (HMO) premiums were expected to increase by an average of 26 percent in 2003. FEHBP enrollees would likely have faced higher premium increases in recent years but for some modest reductions in benefits—mostly increased enrollee cost sharing—and their shifts in enrollment to plans with lower premiums.
FEHBP premium trends are influenced by plans’ claims expenditures. Increasing expenditures for prescription drugs and hospital outpatient care accounted for the largest share of increased claims expenditures in recent years for the three largest FEHBP plans covering most FEHBP enrollees. The increases in claims expenditures represented changes in
Results in Brief

Page 3 GAO-03-236 Federal Employees' Health Premium Growth
plan payments and utilization for these categories; for drugs, most of the increase was due to higher plan payments per drug dispensed, while for hospital outpatient care the increase was due to higher utilization.
OPM relies on enrollee choice among competing plans and its negotiations with plans to help contain FEHBP premium growth, while other large purchasers adopt some different approaches. To maximize enrollee choice, OPM allows plans that meet minimum standards to participate in FEHBP. OPM does not require a standardized benefit package, resulting in plans competing for enrollment based on varying benefits. Plans also compete for enrollees based on the premiums they offer. Further, the statutorily defined method for determining the government’s and enrollees’ shares of premiums results in enrollees having an incentive to select lower cost plans because they would pay more for plans with higher premiums. Each year OPM negotiates with plans to encourage benefit adjustments and other steps to control premiums. For example, it typically will not allow plans to add new benefits without a corresponding adjustment to other benefits to offset the additional costs. In several respects, other major purchasers follow a different purchasing approach. For example, CalPERS, GM, and PBGH negotiate with plans based on standardized benefit packages, which facilitate purchaser and enrollee comparison of costs across plans. These purchasers then select only some plans and may reject others in order to offer those they believe offer the best value in terms of quality and cost. Many large purchasers, facing projections of double-digit premium increases in the next few years, are shifting more health care costs to enrollees in an effort to control premium increases. In addition, some of these purchasers are beginning to explore new strategies to reduce overall health care costs, such as giving people more responsibility for their health care spending through innovative benefit designs that provide enrollees with a set amount of money to pay health care expenses along with a high-deductible insurance plan.
OPM generally concurred with our findings.

Page 4 GAO-03-236 Federal Employees' Health Premium Growth
The federal government has provided health insurance benefits to its employees through FEHBP since 1960.1 The Congress established FEHBP primarily to help the government compete with private-sector employers in attracting and retaining talented and qualified workers. All active and retired federal workers and their dependents are eligible to enroll in FEHBP plans, and about 86 percent of eligible workers and retirees participate in the program. As of July 2002, FEHBP provided health insurance coverage to about 8.3 million individuals, including 2.2 million active workers, 1.9 million retirees, and an estimated 4.2 million of their dependents. The government pays a portion of each enrollee’s health insurance benefit premium cost. Currently, as set by statute, the government pays 72 percent of the weighted average premium of all health benefit plans participating in FEHBP, but no more than 75 percent of any plan’s premium.2 The premiums are intended to cover enrollees’ health care costs, plans’ expenses, reserves, and OPM’s administrative costs.3 Total FEHBP health insurance premiums paid by the government and enrollees were about $22 billion in 2001.
The legislative history of the FEHBP statute indicates that the Congress wanted enrollees to exercise choice among various plan types and, by using their own judgment, select health plans that best meet their specific needs.4 The FEHBP statute authorizes OPM to contract with FFS plans
1FEHBP was established by the Federal Employees Health Benefits Act of 1959, Pub. L. No. 86-382, 73 Stat. 708. The act, as amended, is codified at 5 U.S.C. §§ 8901 et seq. Unless otherwise noted, our reference to the statute throughout this report refers to these sections of the U.S. Code. The law became effective on July 1, 1960. Before FEHBP was established, federal employee unions and organizations had established their own health plans to provide group coverage to their members. When the Congress established FEHBP, it allowed these plans to be included in the program and to compete for enrollees.
2The Balanced Budget Act of 1997 established the government’s current share of the premiums effective in 1999. Pub. L. No. 105-33, § 7002, 111 Stat. 251, 662 (amending 5 U.S.C. § 8906). OPM determines separate averages for self-only and for self and family enrollments.
3The premiums paid by employees, retirees, and the government are held in the Employees Health Benefits Fund. The FEHBP statute requires that an amount not to exceed 3 percent of the contributions made to this fund for each health benefit plan participating in FEHBP must be set aside in contingency reserves. Contingency reserve funds are placed in special reserve accounts for each plan. The contingency reserve for FFS plans is set to cover about 2 months of claims and these plans can use the money to fund claim expenses that were larger than expected or offset future premium increases. OPM uses the HMOs’ reserves to adjust payments to them. An additional amount, not to exceed 1 percent of premiums, is set aside to cover OPM’s administrative costs.
4See House Committee on Post Office and Civil Service, H.R. Rep. No. 86-957, at 3-4 (1959).
Background

Page 5 GAO-03-236 Federal Employees' Health Premium Growth
which include the Blue Cross and Blue Shield (BCBS) service benefit plan and plans sponsored by federal employee and postal organizations, such as those for the Foreign Service and rural letter carriers and comprehensive medical plans (commonly known as HMOs), thereby providing choice to enrollees.5 Some plans offer two levels of benefits, which provide enrollees with more options, and some plans also offer a point-of-service (POS) option that provides an enrollee a choice of using the plan’s health care providers or, by paying a higher fee, selecting providers outside of the plan’s provider network.
By statute, OPM is responsible for negotiating contracts with the FFS plans and HMOs each year.6 Under this authority, OPM can negotiate these contracts without regard to competitive bidding requirements.7 Those plans meeting the minimum requirements specified in the statute and regulations may participate in the program and their contracts may be automatically renewed each year. However, plans can choose to terminate their contracts with OPM at the end of the contract period, and under certain circumstances OPM has the authority to terminate contracts.8
As part of its contracting responsibility, OPM negotiates benefits and premiums with each plan. In April of each year, OPM sends a letter to all approved and participating FFS plans and HMOs—its annual “call letter”—to solicit proposed benefit and premium changes for the next year, which are due by the end of May. The statute does not define a specific benefit package that must be offered but indicates the core health care services
5The statute also provided for one indemnity benefit plan. The only such plan withdrew from FEHBP in 1990 and has not been replaced. The House Committee report accompanying this provision indicated that the indemnity plan was to make payments for medical services to either the service provider or directly to the enrollee, whereas the service benefit plan, where possible, was to make payments to the provider.
65 U.S.C. § 8902.
7Each year, HMOs can submit applications to participate in FEHBP without having to respond to a specific request for proposals. The statute limits the participation of FFS plans in FEHBP to one service benefit plan, one indemnity plan, and certain employee organization plans and thereby limits entry of new FFS plans.
8OPM can terminate a plan’s contract at the end of its term if fewer than 300 federal employees and retirees were enrolled during the two preceding contract terms. In addition, if a plan fails to meet program requirements, OPM can withdraw its approval after giving the plan notice and providing an opportunity to have a hearing.

Page 6 GAO-03-236 Federal Employees' Health Premium Growth
that plans must cover.9 Each plan therefore proposes its own benefit package in response to the call letter. In addition, the plans propose the premiums for these benefits, which must be provided for two levels of coverage—self-only and self and family. As a result, each plan’s benefit package and premiums can differ.
OPM attempts to complete its negotiations by August so that brochures describing the plans’ benefits and premiums can be ready for the FEHBP open season that begins in November and lasts about a month. FEHBP’s brochures, which OPM approves each year, facilitate enrollee plan comparisons and selections.10 During each open season, federal workers and retirees are free to switch to other plans for the next calendar year, regardless of any preexisting health conditions. Thus, enrollees can determine which plans best meet their needs. OPM data show that in 2000 and 2001 less than 5 percent of enrollees switched plans.11
Thirteen FFS plans participated in FEHBP in 2002. Overall, about 70 percent of federal employees and retirees who participate in FEHBP were enrolled in FFS plans. Enrollees in these plans can choose their own physicians and hospitals and the plan reimburses the provider or the enrollee for the cost of each covered service provided up to a stated limit. In addition, 11 of the 13 FFS plans had preferred provider organization (PPO) networks, and by using providers in these networks, enrollees can spend less in cost-sharing requirements compared to non-PPO providers.
9For example, the service benefit plan—BCBS—must include hospital, surgical, in-hospital medical, ambulatory patient, supplemental, and obstetrical benefits. An indemnity benefit plan would have to provide hospital care; surgical care and treatment; medical care and treatment; obstetrical benefits; prescribed drugs, medicines, and prosthetic devices; and other medical supplies and services. Employee organization plans and HMOs must provide the same types of benefits as the service benefit or indemnity plans, or both. The core benefits that plans must provide have been expanded over time by federal laws and executive orders.
10In testimonies commenting on information provided to Medicare beneficiaries, we have identified OPM as a model in how it presents information to facilitate plan comparison and choice. See, for example, U.S. General Accounting Office, Medicare+Choice: HCFA Actions
Could Improve Plan Benefit and Appeal Information, GAO/T-HEHS-99-108 (Washington, D.C.: Apr. 13, 1999).
11In addition, about 2 percent of enrollees were newly enrolled in or disenrolled from FEHBP.

Page 7 GAO-03-236 Federal Employees' Health Premium Growth
The FEHBP statute establishes the rate-setting process for FFS plan premiums.12 FFS plans are experience rated—that is, the premiums are to be updated each year based on past claims experience and benefit adjustments. As a result, premiums are designed to cover the cost of all claims filed for enrollees as well as plan profit and administrative costs and, therefore, will differ for each FFS plan.13 In 2002, all active federal workers and retirees could enroll in the BCBS service benefit plan and in six of the FFS employee organization plans. (See table 1.) The remaining six FFS organization plans were available only to members of the sponsoring organizations.
Table 1: FFS Plans Participating in FEHBP, 2002
FFS plans open to all FFS plans open only to specific groups
Blue Cross and Blue Shield Alliance Health Plan American Postal Workers Union Health Plan Government Employees Hospital Association, Inc. Mail Handlers National Association of Letter Carriers Health Benefits Plan Postmasters Benefit Plan
Association Benefit Plan Foreign Service Panama Canal Area Rural Carrier Benefit Plan Special Agents Mutual Benefit Association Secret Service
Source: OPM, FEHBP 2002 Guide: Guide to Federal Employees Health Benefits Plans for Federal Civilian Employees (Washington, D.C.: Nov. 2001).
In 2002, 170 HMOs, located in local markets throughout the country, participated in FEHBP and accounted for about 30 percent of FEHBP enrollees.14 HMO enrollees must generally use a plan’s provider network to obtain services. OPM has established the rate-setting process for HMOs
125 U.S.C. § 8902(i).
13OPM negotiates the profit amount (also called the service charge) with each FFS plan. When negotiating the profit amount, OPM considers such factors as the contractor’s performance, cost control, and risk. While OPM does not guarantee a minimum profit, its negotiating objective is that a plan’s profit may not exceed 1.1 percent of the projected incurred claims and administrative costs.
14The total number of participating HMOs has declined over time. From 2000 through 2002, while the number of FFS plans remained constant, the total number of HMOs participating in FEHBP declined from 276 to 170 as HMOs have either withdrawn from the program or have merged with other plans. See U.S. General Accounting Office, Federal Employees’
Health Program: Reasons Why HMOs Withdrew in 1999 and 2000, GAO/GGD-00-100 (Washington, D.C.: May 2, 2000).

Page 8 GAO-03-236 Federal Employees' Health Premium Growth
participating in FEHBP in regulations. For most HMOs, OPM bases the FEHBP premium rate on the rates paid to the HMO by the two other employer-sponsored groups with the most similarly sized enrollments in that community.15 This ensures that FEHBP obtains a rate that is at least comparable to the lower of the rates paid by two other similarly sized groups, with adjustments to account for differences in the demographic characteristics of FEHBP enrollees and the benefits provided. The number of HMOs available to federal workers and retirees depends on the area where they live or work. In 2002, 11 states16 had no HMOs participating in FEHBP and, in the other states and the District of Columbia, the median number of HMOs available to federal enrollees was two. Some local markets had higher HMO participation. For example, the Washington, D.C., area and southern California had at least four HMOs in which federal workers and retirees could enroll in 2002.
A few plans accounted for the largest share of FEHBP enrollment. The largest plan—the BCBS service benefit plan—had about half of the 2002 enrollment. The three largest plans, including BCBS, were all FFS plans and accounted for almost two-thirds of FEHBP enrollment. About two-thirds of the 183 participating FFS plans and HMOs enrolled fewer than 5,000 active federal workers and retirees, and slightly less than a third of all plans enrolled fewer than 1,000 in 2002.
The three other large purchasers we reviewed varied in the extent to which they provide coverage through HMOs, FFS plans, and PPOs as well as in the number of plans they offer. GM, the largest private-sector purchaser of employer-sponsored health insurance, purchased coverage for about 1.2 million workers, retirees, and their dependents through 81 FFS plans, 31 PPOs, and 136 HMOs in 2002. About 71 percent of the unionized employees and retirees and about 63 percent of the salaried employees and retirees were enrolled in FFS plans and PPOs. CalPERS purchased coverage in 2002 for about 1.2 million active and retired state and local government public employees and their family members who obtained coverage through nearly 1,100 local government agencies,
15As most HMOs are paid on a per-person basis rather than for each service they provide, few have enough experience with paying claims or have the claims data needed to be paid on a FFS basis. Eighteen FEHBP HMOs are experience rated in the same way as the FFS plans. Premiums are based on the claims expenditures for FEHBP enrollees for past years along with amounts to cover profit and administrative costs.
16The 11 states were Alaska, Arkansas, Delaware, Idaho, Maine, Mississippi, Montana, Nebraska, New Hampshire, South Carolina, and West Virginia.

Page 9 GAO-03-236 Federal Employees' Health Premium Growth
including schools, and the state of California. About 74 percent of CalPERS enrollees were in 7 HMOs, with the remainder in 2 PPOs and 3 plans covering members of such associations as the association of highway patrolmen in 2002. PBGH, a California employer coalition, purchased HMO coverage through its Negotiating Alliance for 19 large employers. About 350,000 workers, retirees, and dependents were in PBGH’s 7 HMOs in 2002. This represented about 70 percent of participants in these employers’ plans. Participating employers made their own arrangements for non-HMO coverage, primarily through PPOs, for the remaining employees.
From 1991 through 2002, health insurance premiums for FEHBP increased on average 5.9 percent a year compared to 6.4 percent for large employers—those in the Kaiser/HRET survey with 5,000 or more employees—and 5.8 percent for CalPERS.17 (See fig. 1.) FEHBP average premium increases have exceeded 10 percent beginning in 2001, but higher premium increases were partially offset by some plans reducing benefits—mostly increased enrollee cost sharing—and some enrollees switching to plans with lower premiums.
17By comparison, annual spending for Medicare increased, on average, by 7.5 percent annually (from $109.7 billion in 1990 to $242.4 billion in 2001).
Rise in FEHBP Premiums Has Been Similar to Increases for Other Large Purchasers

Page 10 GAO-03-236 Federal Employees' Health Premium Growth
Figure 1: Average Annual Change in Premiums, 1991 through 2003
aThe 1991 premium increase for large employers includes mid- and large-sized firms because the survey did not separately report premiums for employers with 5,000 or more employees.
bIn 2001, premium increases for FEHBP were 10.5 percent and for large employers were 10.8 percent.
cIn 2002, premium increases for FEHBP were 13.3 percent and for large employers were 13.0 percent.
dThe Kaiser/HRET survey data for large employer premium increases for 2003 were not available at the time of our work.
Generally, FEHBP premiums increased at a lower rate than premiums for other large employers and CalPERS during the first half of the last decade, but increased faster during the second half. For example, cumulatively from 1991 to 1996, premiums increased on average about twice as fast for large employers (6.1 percent per year) than for FEHBP (3.2 percent per
1991a 1992 1993 1994 1995 1996 1997 1998 1999 2000 2001b 2002c 2003d
Calendar year
FEHBP
Large employers (5,000 or more employees)
CalPERS
-10
-5
0
5
10
15
20
100
25
Percentage
Source: OPM, Kaiser Family Foundation/Health Research and Educational Trust (HRET) employer surveys, and CalPERS.
Page 11 GAO-03-236 Federal Employees' Health Premium Growth
year). Premiums for CalPERS also increased faster (5.1 percent per year) on average during this period than for FEHBP.
During the mid-1990s, the rate of change in premiums was negative for both FEHBP and CalPERS and as a result average premiums declined temporarily. FEHBP premiums declined on average by about 4 percent in 1995, while CalPERS premiums declined on average from 0.8 to 4 percent per year from 1995 to 1997.
Cumulatively from 1997 to 2002, FEHBP average premiums grew about 2 percentage points per year faster than those of CalPERS and large employers—8.6 percent per year compared to 6.5 and 6.7 percent per year, respectively. Much of the difference in premium increases between FEHBP and other major purchasers during this period occurred in 1998 and 1999. OPM attributes much of FEHBP’s premium growth in these years to changes made to the reserve balances maintained by FEHBP plans. FEHBP’s average premium increase of 13.3 percent in 2002 was similar to increases for other large purchasers,18 but about 4 percentage points higher than the CalPERS increase.
OPM announced in September 2002 that average premiums would increase by 11.1 percent in 2003 for all FEHBP plans. Premiums for FEHBP’s FFS plans were expected to increase on average by 10.5 percent, while HMO premiums were expected to rise an average of 13.6 percent. This represents the third straight year of double-digit premium increases for FEHBP, but this increase was less than FEHBP’s average increase in 2002, and less than those many other employers anticipate. While 2003 premiums for many large employers were still being negotiated at the time of our work, two employee benefit consulting firms reported preliminary findings from surveys of employee health benefits managers that anticipated overall premium increases of from 13 to 15 percent, and average HMO premium increases of 16 percent, for 2003.19 CalPERS in
18The Kaiser/HRET survey found that premiums for large employers increased by about 13 percent in 2002. See the Kaiser Family Foundation/HRET, Employer Health Benefits
2002 Annual Survey (Menlo Park, Calif.: 2002).
19See Hewitt Associates, “Health Care Cost Increases Expected to Continue Double-Digit Pace in 2003,” http://www.hewitt.com/hewitt/resource/newsroom/pressrel/2002/10-14-02.htm (downloaded Nov. 4, 2002), and Towers Perrin, “Towers Perrin Forecasts 15% Increase In Health Care Costs—Highest Percentage Increase in More Than a Decade,” http://www.towers.com/towers_news/news/PressRelease_2002/pr100202.htm (downloaded Nov. 4, 2002).

Page 12 GAO-03-236 Federal Employees' Health Premium Growth
particular is facing a significant premium increase in 2003. Premiums for CalPERS’ HMOs—which enroll the bulk of its participants—were expected to increase an average of 26 percent in 2003. Premiums for CalPERS’ two PPOs were expected to increase about 19 and 22 percent.
FEHBP’s premium increases in recent years would have been higher but for increased cost-sharing requirements for employees and retirees as well as shifts in enrollment to plans with lower premiums. Over the last 6 years, FEHBP plans have been required to cover certain new benefits,20 but plans have also had some offsetting benefit reductions—mostly increased enrollee cost sharing—thereby resulting in a net benefit reduction. Like many FEHBP and other large employers’ health plans, from 2000 through 2002, three large FFS plans increased or introduced cost-sharing features such as copayments or coinsurance for prescription drugs and physicians as well as deductibles for other services, as the following examples illustrate.
• BCBS raised its standard option employee copayment for PPO home and physician visits from $12 to $15, and raised its annual deductible from $200 to $250 per individual and from $400 to $500 for families. BCBS also introduced cost sharing for mail-order prescription drugs for Medicare beneficiaries, which the plan had previously waived.
• The Government Employees Hospital Association, Inc. (GEHA) raised the copayment for a physician office visit from $10 to $15, and raised employee coinsurance for non-PPO providers from 20 percent to 25 percent. In addition, GEHA raised its annual deductible from $250 to $300 per individual and from $500 to $600 for families, and increased the maximum annual out-of-pocket limit from $4,500 to $5,500.
• Mail Handlers raised the standard option deductible from $200 to $250 per individual, and from $600 to $750 for families. Enrollees who have shifted to plans with lower premiums have also reduced FEHBP’s average premium increases. Specifically, OPM’s actuarial estimates indicate that FEHBP enrollees who switch to plans offering lower premiums have reduced average premium increases about 1 percent per year since 1997. For 2003, OPM anticipated that this
20Since the late 1990s, federal law or executive orders have required coverage for several benefits by FEHBP plans, including certain prescription drugs, nonexperimental bone marrow transplants, mammography screening, minimum benefits for childbirth and mastectomies, and parity between specified aspects of mental health and substance abuse benefits and medical and surgical benefits.

Page 13 GAO-03-236 Federal Employees' Health Premium Growth
phenomenon would offset the overall premium increase by about 1.2 percent from what it otherwise would have been. Our analysis shows that, from 1999 to 2002, more than two-thirds of plans with premium increases lower than the median FEHBP premium increase gained enrollment.21
FEHBP premium increases are related to prior years’ increased claims expenditures, which for the three largest FEHBP plans from 1998 to 2000 were in large part driven by increasing expenditures for prescription drugs and hospital outpatient care.22 Increasing plan payments per drug dispensed accounted for most of the increase in expenditures for drugs, while increasing utilization accounted for the increase in hospital outpatient care expenditures.23
Our analysis of 1998 to 2000 claims data for FEHBP’s three largest plans—all FFS plans—indicate that per-enrollee claims expenditures increased by about 12.6 percent, including increases of about 8.6 percent from 1998 to 1999, and about 3.7 percent from 1999 to 2000.24 We specifically examined claims expenditures for these three plans because HMOs typically do not track or report claims data to OPM and the three plans we reviewed represented about 90 percent of FFS enrollees and about two-thirds of
21Specifically, of the 88 FEHBP plans whose premium changes from 2001 to 2002 were less than the median premium increase, 67 gained enrollment and 21 lost enrollment. Similarly, of the 109 plans with premium changes less than the median from 2000 to 2001, 74 gained enrollment and 35 lost enrollment; and of the 138 plans with premium changes less than the median from 1999 to 2000, 91 gained enrollment and 47 lost enrollment. Some of the observed changes in enrollment may be due to individuals leaving or entering FEHBP plans for reasons other than cost, such as individuals entering or leaving employment with the federal government.
22Our analysis is based on claims expenditures paid by FEHBP plans, and excludes expenditures paid for FEHBP enrollees by Medicare and other payers, and FEHBP enrollees’ cost sharing. Data for hospital outpatient care are for two of the three plans because comparable data were not available for the third plan.
23We derived plan payments per service from the cost per unit of each category of care, such as the payment per prescription drug dispensed, outpatient hospital case, inpatient hospital day, or physician visit.
24Claims expenditures are one of the key components OPM and FEHBP’s experience-rated plans evaluate in negotiating premiums. However, there is a lag between changes in claims and premiums because future premiums are based on actuarial projections estimated from past claims. In 1999, the average increases in premiums and claims expenditures for the three plans were similar, while in 2000, the average increase in premiums was more than double the average increase in claims expenditures.
Increases in Expenditures for Prescription Drugs and Hospital Outpatient Care Drove Most of Recent Rise in Premiums for FEHBP’s Largest Plans

Page 14 GAO-03-236 Federal Employees' Health Premium Growth
total FEHBP enrollees. Claims expenditures for prescription drugs and hospital outpatient care accounted for more than 70 percent of the overall increase in per-enrollee claims expenditures for these plans from 1998 through 2000, while hospital inpatient care and physician visits accounted for most of the remainder. Increases in claims for prescription drugs accounted for the largest share (47 percent) of the overall increase in claims expenditures from 1998 to 2000 and increased at the fastest rate during this period—by nearly one-fourth. (See table 2.)25
Table 2: Cost Drivers for the Three Largest FEHBP Plans, 1998 to 2000
Per enrollee claims expenditure
Expenditure (percentage change)
Category 1998 1999 2000
Increase (percentage
of total) 1998 to 2000
Percentage change 1998 to
2000Prescription drugs $946 $1,156 (22.2%) $1,181 (2.1%) $235 (47.1%) 24.8Hospital outpatient carea 706 757 (7.2%) 825 (9.0%) 119 (23.8%) 16.8Hospital inpatient care 867 899 (3.6%) 924 (2.8%) 57 (11.3%) 6.5Physician visitsb 461 482 (4.5%) 506 (5.0%) 45 (8.9%) 9.7All otherc 981 1,009 (2.9%) 1,025 (1.6%) 44 (8.8%) 4.5Total $3,961 $4,303 (8.6%) $4,460 (3.7%) $499 (100%) 12.6
Source: GAO analysis of OPM claims expenditure data.
Note: Analysis includes FEHBP plan expenditures only, and does not include expenditures for FEHBP enrollees by other payers (such as Medicare) and FEHBP enrollees’ cost sharing. The three plans whose claims expenditures we analyzed represent 90 percent of the enrollment in all FEHBP FFS plans and almost two-thirds of all FEHBP enrollees. Numbers may not add to totals due to rounding.
aData for hospital outpatient care are for two of the three plans because comparable data were not available for all 3 years.
bIncludes inpatient, outpatient, and out-of-hospital physician visits, but not surgery or other physician services that the plans reported to OPM in other categories.
25While prescription drugs are the primary driver of claims expenditures for FEHBP plans, two studies have shown that increasing inpatient hospital expenditures have represented a larger share of overall increases in health care expenditures. For example, see Bradley C. Strunk, Paul B. Ginsberg, and Jon R. Gabel, “Tracking Health Care Costs,” Health Affairs (Web Exclusive) (Bethesda, Md.: Sept. 26, 2001), http://www.healthaffairs.org/WebExclusives/Strunk_Web_Excl_92601.htm (downloaded Nov. 4, 2002). FEHBP plans’ claims expenditures may not be as sensitive to inpatient hospital expenditures because a large portion of these hospital costs is paid by Medicare for FEHBP enrollees who are Medicare-eligible.

Page 15 GAO-03-236 Federal Employees' Health Premium Growth
cIncludes services such as surgery, dental care, laboratory services, alcohol/substance abuse and mental health treatment, and other ancillary services.
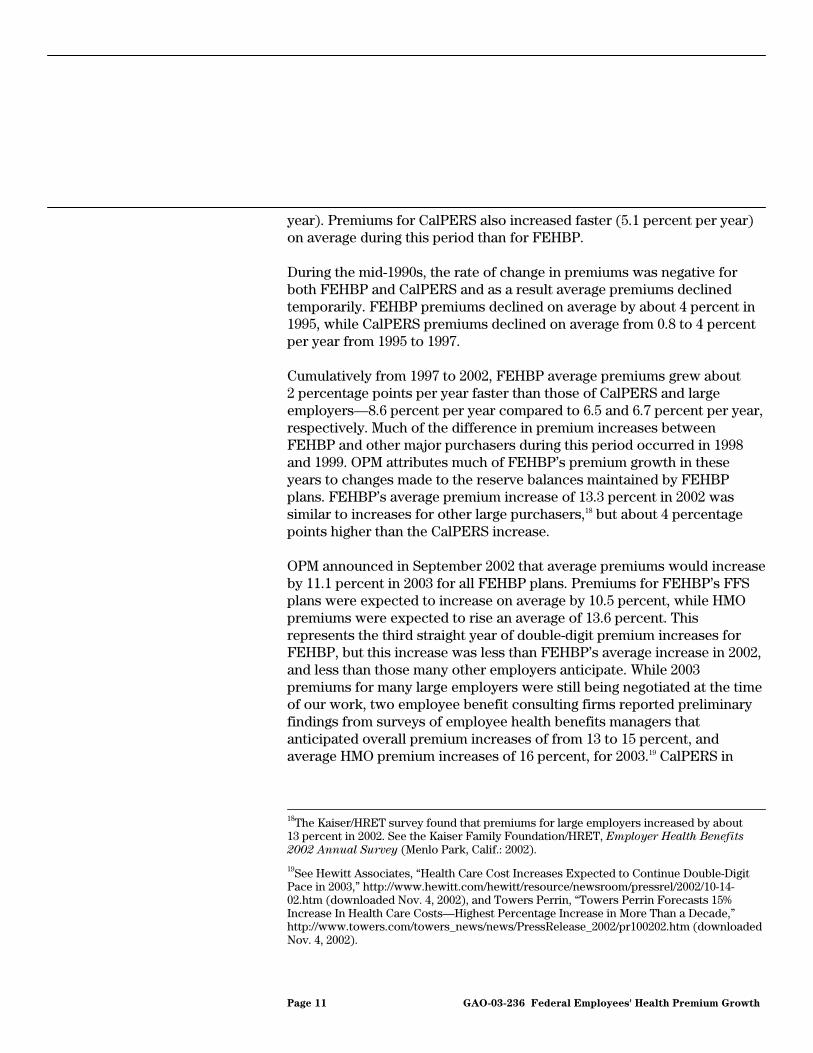
The increase in per-enrollee claims expenditures for each of these services represents changes in plan payments per service and utilization for these categories. Specifically, figure 2 shows that increasing plan payments per service played the larger role in changing claims expenditures for prescription drugs, hospital inpatient care, and physician visits— 66 percent of the $235 increase in expenditures for prescription drugs, 76 percent of the $57 increase for hospital inpatient care, and 93 percent of the $45 increase for physician visits. Utilization increases accounted for all of the increase in expenditures for hospital outpatient care and the remainder of the increases for prescription drugs, hospital inpatient care, and physician visits.

Page 16 GAO-03-236 Federal Employees' Health Premium Growth
Figure 2: Change in Per-Enrollee Claims Expenditures due to Plan Payments and Utilization for Major Categories of Health Care Services for the Three Largest FEHBP Plans, 1998 to 2000
Note: The three plans included in this analysis represented 90 percent of the enrollment in all FEHBP FFS plans and almost two-thirds of all FEHBP enrollees. Data for hospital outpatient care are for two of the three plans, because comparable data were not available for the third plan for all 3 years.
Aging FEHBP enrollees and the changing health care market may have contributed to increasing plan payments and utilization. Increased utilization was in part associated with FEHBP’s aging enrollee population. OPM actuaries estimate that a 1-year increase in the average age of the FEHBP population translates into almost a 3.3 percent increase in total health costs. From 1998 through 2000, the average age of FEHBP enrollees increased by about half a year, from 61.6 years to 62.1 years. Recently, higher payments have also resulted from providers’ negotiations with managed care plans. In the early and mid-1990s, managed care plans were able to extract significant discounts from providers that they included in
Source: GAO analysis of claims data for the three largest FEHBP plans.
-50
0
50
100
150
200
250
Hos
pita
l
inpa
tient
c
are
Hos
pita
l o
utpa
tient
car
e
Pres
crip
tion
dru
gs
P
hysi
cian
vi
sits
Change due to utilization
Change due to plan payment per service
In dollars

Page 17 GAO-03-236 Federal Employees' Health Premium Growth
their networks. However, in recent years studies have indicated that providers have secured higher payments in part due to consolidations—particularly among hospitals in some major metropolitan areas—that may have increased their market power.26 In addition, there is some evidence in these studies that physicians are demanding and receiving higher fees.
Consistent with the design of FEHBP, which encourages enrollee choice, OPM relies on competition among plans and its annual negotiations with participating plans to moderate FEHBP plans’ premium increases. To maximize enrollees’ choices among plans, OPM contracts with all plans meeting minimum standards and allows plans to propose varying benefit designs. In its annual negotiations with the plans, OPM suggests various cost containment strategies for plans to consider as they prepare their benefit and premium proposals, and for 2003 placed more emphasis on encouraging the plans to propose approaches to control cost increases. Other major purchasers, such as CalPERS, PBGH, and GM, adopt different approaches in developing their health benefit offerings such as negotiating based on a standardized benefit package and contracting only with plans with which they reach a satisfactory agreement. As large purchasers face escalating premiums, they continue to look for new ways to help control costs, including offering plans that make enrollees more sensitive to the costs of health care by giving them more control over their health care spending, charging enrollees more when they go to higher cost hospitals, or focusing more attention on managing chronic health care conditions.
OPM contracts with all plans meeting certain standards and requirements. As long as plans continue to meet the minimum standards, OPM does not exclude them from the program. Although the statute gives OPM the authority to remove plans from FEHBP under certain circumstances, OPM officials said that they have not recently exercised this authority primarily
26For example, see Bradley C. Strunk, Paul B. Ginsberg, and Jon R. Gabel, “Tracking Health Care Costs,” Health Affairs (Web Exclusive), and William M. Mercer, Incorporated, Mercer/Foster Higgins National Survey of Employer-Sponsored Health Plans 2001 (New York, N.Y.: 2002).
OPM’s Reliance on Competition among Plans and Annual Negotiations to Contain Premium Increases Differs in Some Ways from Other Large Purchasers
FEHBP Encourages Enrollee Choice and Competition for Enrollment among Plans

Page 18 GAO-03-236 Federal Employees' Health Premium Growth
because they wanted to maximize enrollee choice and minimize enrollee disruption, especially in less populated areas of the country.27
While FFS plans and HMOs do not have to compete against one another to participate in FEHBP, they do have to compete with other plans to attract enrollees. One way plans compete is by the benefits they offer. Since the FEHBP statute does not define a specific benefit package, but rather requires plans to offer a core set of benefits, plans propose the benefits they will offer to remain competitive within their own market areas, whether national or local. Each year, OPM negotiates each plan’s benefits package, ensuring that the costs for any new benefits proposed by the plan are offset by reductions in other benefits.
Plans also compete for enrollees based on their premiums. By statute, premiums must “reasonably and equitably” reflect the cost of the benefits provided by the different plan types participating in FEHBP.28 Premiums for FFS plans are experience rated. Over time, their premiums approximately equal average service expenditures, administrative costs, and profits. If OPM and the plans set premiums too high or too low in one year, OPM makes appropriate adjustments to premiums and reserve balances in subsequent years. To set FEHBP premium rates for the HMOs, OPM relies on the negotiations that these plans conduct with two similarly sized purchasers in each market, requiring FEHBP to receive the lower of the two rates. OPM’s Office of the Inspector General conducts periodic audits to assure the validity of these rates.29
The government’s method for setting premium contributions provides plans an incentive to price their products competitively since enrollees pay less for lower cost plans and pay the entire cost exceeding the
27OPM can withdraw its approval of a contract if a plan fails to meet the minimum eligibility requirements, but only after providing its reason for doing so and giving the plan an opportunity for a hearing. In addition, the statute gives OPM the authority to terminate a contract if during the preceding 2 contract years the plan did not have 300 or more federal workers or retirees enrolled. In 2002, OPM data show that 24 participating HMOs had fewer than 300 active workers and retirees enrolled.
285 U.S.C. § 8902(i).
29According to OPM officials, in the past one of the most common findings of these audits was that the plans selected for comparison were not similarly sized groups. For example, one plan recently agreed to pay over $87 million—a record amount—to settle allegations that it charged FEHBP higher rates than its commercial customers.

Page 19 GAO-03-236 Federal Employees' Health Premium Growth
maximum government share.30 For example, for a plan with a self-only premium of $3,200 per year, the enrollee would pay $800 and the government would pay the other 75 percent ($2,400). For a plan costing $3,400, the enrollee would pay $856 while the government would pay the maximum $2,544. For any plan costing more, the enrollee would have to pay the entire additional cost—a plan costing $3,600, for example, would require a $1,056 annual premium from the enrollee while the government share would remain at $2,544. Few plans have premiums much higher than the amount where the enrollee would receive the maximum government share: Only 19 of the 183 plans in 2002 had premiums more than 10 percent above $3,392 (the premium equivalent to the maximum government share of $2,544), while 97 had premiums at least 10 percent below this amount.
Each year, OPM’s “call letter” provides its negotiation objectives and calls for the plans’ new benefit and premium proposals. OPM uses its annual letter to give guidance regarding the goals to be achieved and the types of cost containment efforts plans may want to consider to help contain premium increases. OPM encourages plans to consider implementing cost containment strategies each year as they draft their FEHBP benefit and premium proposals.
During negotiations over benefits and premiums, OPM tends to focus its cost containment efforts on plans that submit proposals with the highest premium increases or those that are outliers in some other way. To some degree, OPM relies on the competitive nature of the program to achieve results in that each plan must weigh the potential effect of its benefit offerings and premiums on its market share. Changes in benefits, and any resulting premium changes, can affect a plan’s enrollment, but there is a trade-off since increased benefits may be attractive to potential enrollees while the associated increased premium may deter enrollment.
OPM has encouraged plans to consider several strategies to help moderate premium increases. For example, for contract year 1998, OPM encouraged FFS plans to expand and strengthen their existing PPO arrangements by
30Under the statute, the government generally pays 72 percent of the weighted average premium of all plans, but no more than 75 percent of any plan’s premium. In 2002, the maximum government share of the premium was $2,544 for self-only coverage and $5,809 for self and family coverage. In addition, the Postal Service pays a higher share of Postal Service employees’ premiums. In 2002, it paid 85 percent of the weighted average premium but no more than 88.75 percent of any plan’s premium.
OPM Uses Annual Negotiations with Plans to Help Moderate Premium Increases

Page 20 GAO-03-236 Federal Employees' Health Premium Growth
obtaining discounts when cost effective. For that year, it also encouraged all plans to consider proposing a point-of-service (POS) product. OPM’s call letter stated that POS products were an effective way to introduce enrollees to the concept of managed health care. For contract years 2001 and 2002, OPM’s call letters encouraged ways to control rising prescription drug costs including use of drug formularies and three-tier drug benefits—that is, lower cost sharing for generic and brand name drugs on a plan’s formulary than for drugs not included on the formulary.31
Even more than in past years, OPM’s latest call letter for contract year 2003 challenged plans to identify ways to reduce premium increases. OPM asked plans to propose innovative ideas to help contain these increases.32 For 2003, OPM also encouraged plans to consider several specific cost containment strategies including increasing enrollees’ out-of-pocket costs, reemphasizing the need to manage prescription drug costs, and putting more emphasis on care management for enrollees who have chronic conditions. In addition, the call letter told plans to expect very tough negotiations, a specific direction OPM did not include in past letters.
On September 17, 2002, OPM announced that FEHBP premiums would increase by an average of about 11.1 percent for 2003, about 2 percentage points less than in 2002. In addition, OPM officials indicated that, while some individual plans increased or decreased benefits, overall benefit levels would be largely similar to those available in 2002. OPM officials reported that the initial proposals submitted by the plans would have resulted in a 13.4 percent increase for 2003. Following negotiations with OPM on benefits and premiums, the average increase was reduced to 12.4 percent. OPM officials anticipated that the remaining savings from the initial proposals would result from FEHBP enrollees switching to lower cost plans during the open enrollment season.
31A plan’s formulary is a list of drugs that physicians and enrollees are encouraged to use.
32In response to OPM’s request for innovative ideas, one FEHBP plan is offering a new “consumer-driven” option in 2003. Under this option, enrollees will receive a personal spending account of $1,000 for single coverage and $2,000 for family coverage to be used to cover health care expenses. Enrollees exhausting this spending account must pay an out-of-pocket deductible of $600 for single coverage or $1,200 for family coverage before insurance coverage begins.

Page 21 GAO-03-236 Federal Employees' Health Premium Growth
Whereas OPM contracts with all plans meeting minimum standards and negotiates benefit packages that can vary with each plan, other large purchasers we reviewed follow a different approach. CalPERS, GM, and PBGH conduct negotiations based on a standardized benefit package. At the end of the negotiations, these purchasers can decide not to contract with a plan that does not meet their standards in such areas as cost or quality. Some of these purchasers also reward enrollees by paying more of the premiums when enrollees choose plans the purchasers consider to be the best value. Continuing premium increases have caused these and many other large purchasers to search for ways to reduce their premium costs. While many purchasers first look to shift more of the costs to their employees by taking such actions as increasing plan deductibles, some are also exploring new strategies to help contain these increases.
The three large purchasers we reviewed rely on a standardized benefits package when conducting negotiations, particularly in negotiations with HMOs. CalPERS standardized benefits and copayments across its HMOs in 1993 to be able to better assess differences in plans’ costs, and GM also negotiates with HMOs using a standardized benefits package. PBGH, in conjunction with other national purchasers, developed an annual request for proposals that it uses for its standardized HMO benefit package.33
Along with using standardized benefit packages, some large purchasers exclude plans if they cannot negotiate a satisfactory agreement with them. During its negotiations for benefit year 2002, for example, CalPERS rejected bids from all participating HMOs as too high and then allowed them to resubmit revised bids. CalPERS rejected the bids because the proposed increases were twice as high as those that occurred in the past 5 years and were considerably higher than what CalPERS had expected. CalPERS ultimately dropped 3 of its 10 HMOs at the end of its negotiations that year. For benefit year 2003, CalPERS dropped 2 of the remaining 7 HMOs at the end of its negotiations to help control premium increases and to provide the best value for those premiums. GM reviews and scores HMOs on the basis on quality and cost. Plans scoring relatively low will either be dropped or be given a year to improve.
33PBGH also has HMOs bid on several benefit modifiers and adjusters in addition to the standardized benefit package. For example, HMOs bid on pharmacy benefits with both two-tiers and three-tiers of cost sharing. Participating employers can decide which level they want to include in their benefit packages.
Other Large Purchasers Use Different Approaches in Negotiations and Cost Containment
Three Other Large Purchasers Offer Standardized Benefits, Facilitating Comparisons for Purchasers and Enrollees, and May Not Contract with All Plans

Page 22 GAO-03-236 Federal Employees' Health Premium Growth
Like FEHBP, some other large purchasers vary the premiums some employees pay to encourage enrollment in certain plans.34 For example, as part of its value purchasing strategy, which the company started in 1997, GM evaluates HMOs for quality and value and encourages salaried employees to enroll in those plans it rates as higher value plans. For salaried employees, GM covers a larger share of the premiums for HMOs designated as higher value.35 GM estimates that it saves about $4.6 million annually by having its salaried employees move into HMOs designated as higher value and that these employees save about $2 million in premiums.36 Also, PBGH states that it focuses its purchasing efforts on plans it has identified as high quality and some employers participating in the group support PBGH’s effort by setting their premium contributions to encourage employee enrollment in plans considered to be high value.37
Over the next several years, analysts predict that double-digit health insurance premium increases will continue.38 As a result, many large purchasers are searching for ways to slow this growth. Shifting more of the costs to employees is one of the first cost containment strategies employers consider as premium rates escalate. In particular, many of the largest employers have increased deductibles for PPO plans. For example, employer survey data show that the average annual deductible for self-only in-network PPO coverage increased from $175 in 1999 to $310 in 2002, while out-of-network deductibles increased from $272 in 1999 to $529 in 2002.39 Similarly, very large employers are increasingly using multiple-tier
34CalPERS allows participating employers to determine how much to contribute toward their employees’ premiums.
35GM’s value purchasing strategy does not apply to unionized workers, who represent 74 percent of active GM workers enrolled in health benefit plans and whose benefits and premiums are negotiated through collective bargaining agreements.
36In 2001, GM paid about $235 million in HMO premiums for salaried employees.
37However, GM and PBGH’s approaches may not be widespread; most large employers do not set contributions to encourage their employees to use higher value plans. See James Maxwell, et al, “Corporate Health Care Purchasing Among Fortune 500 Firms,” Health Affairs (May/June 2001).
38For example, see Jon Gabel, et al, “Job-Based Health Benefits In 2002: Some Important Trends,” Health Affairs (September/October 2002) and William M. Mercer, Incorporated, Mercer/Foster Higgins National Survey of Employer-Sponsored Health Plans 2001
(2002).
39See the Kaiser Family Foundation/HRET, Employer Health Benefits 2002 Annual Survey
(2002) and Employer Health Benefits 1999 Annual Survey (1999).
Some Large Purchasers Consider New Strategies to Control Rising Premiums

Page 23 GAO-03-236 Federal Employees' Health Premium Growth
cost sharing for prescription drugs as a cost containment strategy. According to another employer survey, 22 percent of PPOs had a three-tier drug copayment in 2000, but the number increased to 40 percent in 2001.40
Some large purchasers, including OPM and those we reviewed, are beginning to explore new strategies to help reduce escalating costs. For example, some are in the early stages of considering “consumer-driven” plans that provide employees with more financial incentives to be sensitive to health care costs and more control over their health care spending decisions. As this concept covers a wide range of possible approaches, there is no single definition. However, all approaches tend to shift more decision-making responsibility regarding health care from employers to employees. For example, they could provide employees with a personal spending account, which the employer would fund at different levels. One plan funds these accounts at $1,000 for an individual or at $2,000 for a family. Employees could use this money to pay medical expenses. If employees spend all the money in their accounts, they would have to spend their own money until a deductible amount—which for one plan was $600 for an individual employee and $1,200 for a family—is met. Then, coverage through an insurance policy purchased by the employer would begin. In some approaches, employees who do not spend all the money in their accounts could carry the money over from year to year. To date, as these plans are so new, few people are enrolled—several studies have estimated that fewer than 1 percent of enrollees with employer-sponsored health insurance are in some form of consumer-driven health plans.41
Other new strategies that some purchasers are considering include plans that contain provisions to help reduce hospital costs and costs for enrollees with chronic conditions. For example, CalPERS and PBGH are exploring the use of financial incentives for enrollees when choosing from
40See William M. Mercer, Incorporated, Mercer/Foster Higgins National Survey of
Employer-Sponsored Health Plans 2001 (2002) and Mercer/Foster Higgins National
Survey of Employer-Sponsored Health Plans 2000 (2001).
41For example, see Jon R. Gabel, Anthony T. Lo Sasso, and Thomas Rice, “Consumer-Driven Health Plans: Are They More Than Talk Now?” Health Affairs (Web Exclusive) (Bethesda, Md.: Nov. 20, 2002), http://www.healthaffairs.org/WebExclusives/Gabel_Web_Excl_112002.htm (downloaded Nov. 22, 2002), and Mercer Human Resource Consulting, “Are Consumer-Directed Health Plans Good Medicine?” http://www.mercerhr.com/knowledgecenter/reportsummary.jhtml?idContent=1068735 (downloaded Nov. 22, 2002).

Page 24 GAO-03-236 Federal Employees' Health Premium Growth
which hospital to receive care. Such plans are now becoming available but represent a very small share of the market. These plans offer tiered copayments for enrollees that are lower for hospitals that offer the best rates and are higher for those that are more expensive. Another approach attracting attention among many large employers is disease management, which focuses attention on chronic illnesses such as asthma, diabetes, and heart disease that generate a large amount of health care expenditures. For example, CalPERS, PBGH, and GM are all actively involved in pursuing disease management programs. Also, in its call letter for contract year 2003, OPM encouraged FEHBP plans to consider using disease management programs. However, according to one employer survey, many purchasers said that disease management programs are too new and data are not yet available to assess the benefits compared to the costs.
We provided a draft of this report to OPM, CalPERS, GM, and PBGH for their review. OPM generally concurred with our study findings, highlighting its negotiating strategy as contributing to average FEHBP premiums for 2003 being below national trends. OPM also indicated that in the coming year it will strengthen its efforts by adding enhanced consumer education to provide enrollees with additional information for making informed choices. CalPERS and GM also concurred with our findings. PBGH, along with OPM and CalPERS, provided technical comments, which we incorporated as appropriate. (App. II contains the full text of OPM’s comments.)
As agreed with your offices, unless you publicly announce its contents earlier, we plan no further distribution of this report until 30 days after its date. We will then send copies to the Director of OPM, other interested parties, and appropriate congressional committees. We will also make copies available to others on request. In addition, this report will be available at no charge on GAO’s Web site at http://www.gao.gov.
Comments from OPM and Other Reviewers
Page 25 GAO-03-236 Federal Employees' Health Premium Growth
Please call me at (202) 512-7118 or John Dicken at (202) 512-7043 if you have any additional questions. N. Rotimi Adebonojo and Joseph Petko were major contributors to this report.
Kathryn G. Allen Director, Health Care—Medicaid and Private Health Insurance Issues

Appendix I: Methodology
Page 26 GAO-03-236 Federal Employees' Health Premium Growth
To compare premium trends for the Federal Employees Health Benefits Program (FEHBP) and other large purchasers over the last decade, we obtained data from the Office of Personnel Management (OPM), the California Public Employees’ Retirement System (CalPERS), and surveys of private employer-sponsored health benefits conducted by the Kaiser Family Foundation and the Health Research and Educational Trust (Kaiser/HRET).1
To identify factors driving FEHBP’s recent premium growth, we analyzed several OPM data sources, including summary reports it received from the three largest nationwide plans on enrollees’ health care service utilization and related plan payments for 1998 through 2000. These three plans are all fee-for-service (FFS) plans and accounted for 90 percent of FEHBP enrollment in FFS plans and almost two-thirds of the total FEHBP enrollment.2 We analyzed expenditure and utilization data for services, including hospital inpatient care, hospital outpatient care, physician visits, prescription drugs, laboratory services, surgery, and mental health and substance abuse3 for 1998 through 2000 for the three largest plans.4 These summary data are submitted to OPM by each FFS experience-rated plan, reporting utilization and expenditures incurred by the plan in a calendar year and paid in that calendar year and through the first 9 months of the next calendar year. Because each plan reports its data to OPM slightly differently, we aggregated expenditures and utilization for multiple
1Kaiser/HRET has been conducting surveys of private employer-sponsored health benefits since 1999. These surveys capture data from employers ranging in size from 3 workers to 300,000 or more workers. In earlier years, KPMG Peat Marwick conducted the surveys.
2Generally, federal workers and retirees can enroll in two types of health care plans—FFS plans and health maintenance organizations (HMO).
3One plan did not provide a separate breakout of utilization and expenditures for mental health and substance abuse.
4We requested data for several years prior to 1998, but these data were available for only one of the three plans. Data since 2000 were not available from OPM at the time of our analysis.
Appendix I: Methodology

Appendix I: Methodology
Page 27 GAO-03-236 Federal Employees' Health Premium Growth
categories of services, including hospital inpatient,5 hospital outpatient,6 prescription drugs, and physician visits—and all other services. We adjusted each plan’s expenditures by enrollment as reported by the plans to OPM to calculate per-enrollee expenditure and utilization, and calculated a payment per unit for each category of service. We weighted the expenditure and utilization for the three plans by their respective enrollments for each year from 1998 to 2000. We calculated the increase in per-enrollee claims expenditure attributable to increased plan payments from 1998 through 2000 using the change in plan payments over the 3 years and assuming utilization remained steady at the 1998 level. Similarly, we calculated the increase in per-enrollee claims attributed to increased utilization using the change in utilization from 1998 to 2000 and assuming plan payments were constant at the 2000 level.
In addition, using OPM’s data for all FEHBP plans, we compared each plan’s premium and enrollment changes from 1999 through 2002. We could only do this analysis for those plans that participated in FEHBP in each of the comparison years—for example, in both 2001 and 2002. We identified how many plans with premium changes less than and greater than the median premium gained and lost enrollment. These counts do not include plans that dropped out of FEHBP because we do not know what type of premium and enrollment changes these plans would have experienced in the following year.7 We also reviewed the literature and interviewed OPM officials and actuaries at the Hay Group, Hewitt Associates LLC, and William M. Mercer, Inc.
To examine the steps OPM takes to control FEHBP costs, we interviewed officials in OPM’s Office of Insurance Programs and Office of the Actuary.
5One of the plans we analyzed changed the way it reported inpatient data from 1998 to 1999. Utilization for maternity services was included with inpatient services data reported to OPM for 1998 for this plan, but was reported separately in 1999 and 2000. To be consistent across years, we added these expenditures and utilization to the plan’s inpatient data for 1999 and 2000. In 1999 and 2000, maternity services for this plan represented about 2.1 percent and 3.4 percent, respectively, of its inpatient expenditure and hospital days.
6Due to a change in the way that one of the plans reported its outpatient utilization and expenditure data from 1998 to 1999, we were unable to compare outpatient data for this plan across all 3 years. Therefore, the data presented for outpatient care exclude utilization and expenditure data reported by this plan.
7Our prior work indicated that plans withdraw from FEHBP for several reasons, including low enrollment and noncompetitive premiums. See U.S. General Accounting Office, Federal Employees’ Health Program: Reasons Why HMOs Withdrew in 1999 and 2000, GAO/GGD-00-100 (Washington, D.C.: May 2, 2000).

Appendix I: Methodology
Page 28 GAO-03-236 Federal Employees' Health Premium Growth
To obtain the plans’ perspectives, we interviewed officials at the Blue Cross Blue Shield Association8 and at Kaiser Permanente—two large plans participating in FEHBP. We also interviewed representatives from two federal employee unions—the American Federation of Government Employees and the National Treasury Employees Union.
To examine how other large purchasers negotiate health benefits and attempt to control costs, we reviewed the literature and employee benefit surveys; interviewed employee benefit consultants; and interviewed officials of three large purchasers of employer-sponsored health insurance, including CalPERS—the largest public purchaser of health insurance after the federal government, Pacific Business Group on Health (PBGH)—a California-based purchaser representing 19 large employers, and General Motors (GM)—the largest private purchaser of employer-sponsored health benefits. See table 3 for selected characteristics of FEHBP and the other large group purchasers.
8The Blue Cross Blue Shield Association negotiates the contract for the Blue Cross and Blue Shield (BCBS) service benefit plan.

Appendix I: Methodology
Page 29 GAO-03-236 Federal Employees' Health Premium Growth
Table 3: Selected Characteristics of FEHBP Compared to Health Benefit Programs Offered through CalPERS, PBGH, and GM
Characteristics FEHBP CalPERS PBGH GM Enrollment for 2002 About 8.3 million active
workers, retirees, and dependents
About 1.2 million active workers, retirees, and dependents
About 350,000 active workers, retirees, and dependents
About 1.2 million active workers, retirees, and dependents
Coverage areas Nationwide and outside the country
Primarily California Primarily California Nationwide and outside the country
Enrollment by plan type 70% FFS/PPO 30% HMO
23% PPO 74% HMO 3% association plans
100% HMOa Hourly workers: 71% FFS/PPO 29% HMO Salaried workers: 63% FFS/PPO 37% HMO
Number of plans for 2002 7 FFS plans available to all, 6 FFS plans open to specific groups, and 170 HMOsb
2 PPOs available to all, 7 HMOs, 2 association HMOs, and 1 association PPO
7 HMOs 81 FFS 31 PPOs 136 HMOs
Participating employers Civilian federal agencies
1,099 California public sector agencies
19 California private sector companies
GM
Source: GAO analysis of information from FEHBP, CalPERS, PBGH, and GM.
aPBGH negotiates HMO but not other types of coverage for participating employers. Therefore, the 350,000 active workers, retirees, and dependents covered through PBGH are all in HMOs. However, this represents about 70 percent of participants in these employers’ health plans. The remainder are primarily in PPOs offered directly by the employers.
bTo arrive at the number of FEHBP plans, we used data OPM provided on plan enrollment. We counted the number of FFS plans and HMOs as indicated by OPM’s plan codes. If a plan had two benefit options, we counted this as one plan. Starting in 2002, BCBS was listed under two separate codes (one for the service benefit plan and one for the basic plan). We counted this as one FFS plan to be consistent with our counts for the previous years.

Appendix II: Comments from the Office of
Personnel Management
Page 30 GAO-03-236 Federal Employees' Health Premium Growth
Appendix II: Comments from the Office of Personnel Management

Appendix II: Comments from the Office of
Personnel Management
Page 31 GAO-03-236 Federal Employees' Health Premium Growth
(290141)


The General Accounting Office, the investigative arm of Congress, exists to support Congress in meeting its constitutional responsibilities and to help improve the performance and accountability of the federal government for the American people. GAO examines the use of public funds; evaluates federal programs and policies; and provides analyses, recommendations, and other assistance to help Congress make informed oversight, policy, and funding decisions. GAO’s commitment to good government is reflected in its core values of accountability, integrity, and reliability.
The fastest and easiest way to obtain copies of GAO documents at no cost is through the Internet. GAO’s Web site (www.gao.gov) contains abstracts and full-text files of current reports and testimony and an expanding archive of older products. The Web site features a search engine to help you locate documents using key words and phrases. You can print these documents in their entirety, including charts and other graphics.
Each day, GAO issues a list of newly released reports, testimony, and correspondence. GAO posts this list, known as “Today’s Reports,” on its Web site daily. The list contains links to the full-text document files. To have GAO e-mail this list to you every afternoon, go to www.gao.gov and select “Subscribe to daily E-mail alert for newly released products” under the GAO Reports heading.
The first copy of each printed report is free. Additional copies are $2 each. A check or money order should be made out to the Superintendent of Documents. GAO also accepts VISA and Mastercard. Orders for 100 or more copies mailed to a single address are discounted 25 percent. Orders should be sent to:
U.S. General Accounting Office 441 G Street NW, Room LM Washington, D.C. 20548
To order by Phone: Voice: (202) 512-6000 TDD: (202) 512-2537 Fax: (202) 512-6061
Contact:
Web site: www.gao.gov/fraudnet/fraudnet.htm E-mail: [email protected] Automated answering system: (800) 424-5454 or (202) 512-7470
Jeff Nelligan, managing director, [email protected] (202) 512-4800 U.S. General Accounting Office, 441 G Street NW, Room 7149 Washington, D.C. 20548
GAO’s Mission
Obtaining Copies of GAO Reports and Testimony
Order by Mail or Phone
To Report Fraud, Waste, and Abuse in Federal Programs
Public Affairs