GAO-02-663 Medicare Home Health Care: Payments to Home Health
22
Report to Congressional Committees United States General Accounting Office GA O May 2002 MEDICARE HOME HEALTH CARE Payments to Home Health Agencies Are Considerably Higher than Costs GAO-02-663
Transcript of GAO-02-663 Medicare Home Health Care: Payments to Home Health

Report to Congressional Committees United States General Accounting Office
GAO
May 2002 MEDICARE HOME HEALTH CARE
Payments to Home Health Agencies Are Considerably Higher than Costs
GAO-02-663
Page i GAO-02-663 Medicare Home Health Care
Letter 1
Results in Brief 2 Background 3 Home Health PPS Episode Payments Are Considerably Higher than
Estimated Costs of Care Provided 7 Conclusions 9 Matters for Congressional Consideration 10 Agency Comments and Our Evaluation 10
Appendix I Scope and Methodology 14
Appendix II Comments from the Centers for Medicare and Medicaid
Services 16
Appendix III GAO Contacts and Staff Acknowledgments 18
Tables
Table 1: Average Estimated Cost per Home Health Episode and Average Home Health Episode Payment, January-June 2001 8
Table 2: Payment Amounts Compared to Average Estimated Costs for 10 Most Frequent Home Health Payment Groups, January-June 2001 9
Contents

Page ii GAO-02-663 Medicare Home Health Care
Abbreviations
AAHomecare American Association for Homecare BBA Balanced Budget Act of 1997 BIPA Medicare, Medicaid and SCHIP Benefits Improvement and Protection Act of 2000 CMS Centers for Medicare and Medicaid Services HCFA Health Care Financing Administration HHA home health agency HHRGs home health resource groups IPS interim payment system LUPA low utilization payment amount NAHC National Association for Home Care PEP partial episode payment PPS prospective payment system SAF Standard Analytic File SCIC significant change in condition VNAA Visiting Nurse Associations of America

Page 1 GAO-02-663 Medicare Home Health Care
May 6, 2002
Congressional Committees
In response to rapidly rising home health spending from the late 1980s through the mid-1990s, the Congress enacted major changes to Medicare’s home health payments in the Balanced Budget Act of 1997 (BBA).1 These and subsequent changes culminated in the implementation of a prospective payment system (PPS) on October 1, 2000, which provides incentives to home health agencies (HHAs) to operate efficiently. Under the PPS, HHAs are paid a fixed amount, adjusted for a beneficiary’s care needs, for providing up to 60 days of care, termed a home health episode. The BBA also created an interim payment system (IPS) that imposed new payment limits to moderate spending until the PPS could be implemented. The PPS was designed to lower Medicare spending below what it was under the IPS. This spending reduction was to be achieved by setting the PPS episode payment amount so that total home health spending under the PPS in fiscal year 2000 would equal what would have been spent had the interim limits been reduced by 15 percent. Subsequent legislation delayed implementation of the mandated reduction to the episode payment amount until October 2002.2 The Centers for Medicare and Medicaid Services (CMS)3 has determined that the fiscal year 2003 episode payment rate would have to be reduced by about 7 percent to achieve the mandated level of savings.4
To help decide whether to implement, modify, or eliminate the reduction to Medicare home health payments, the Congress directed us to evaluate
1Pub. L. No. 105-33, title IV, subtitle G, ch. 1, 111 Stat. 251, 466-475.
2Section 501 of the Medicare, Medicaid and SCHIP Benefits Improvement and Protection Act of 2000 (BIPA) (Pub. L. No. 106-554, Appendix F., 114 Stat. 2763, 2763A-529), delayed the mandated reduction until October 1, 2002.
3CMS, the agency responsible for administering Medicare, was known as the Health Care Financing Administration (HCFA) until July 1, 2001. This report refers to the agency as HCFA when referring to actions before the name change and as CMS when referring to actions taken since the name change.
4For fiscal year 2003, CMS will also update the payment rate for inflation by the increase in the home health market basket, which is projected (in April 2002) to be about 2.1 percent.
United States General Accounting Office
Washington, DC 20548

Page 2 GAO-02-663 Medicare Home Health Care
payments under the PPS.5 To do this, we estimated average home health episode costs and calculated average episode payments for the first 6 months of 2001. We also interviewed industry representatives and officials from CMS and reviewed regulations and studies of the home health PPS. We performed our work from November 2001 through April 2002 in accordance with generally accepted government auditing standards. (For a discussion of our scope and methodology, see appendix I.)
Medicare’s payments for full home health care episodes were, on average, about 35 percent higher than the estimated costs of home health care provided in the first 6 months of 2001. This disparity results from an episode payment amount that was initially set assuming a higher number of visits than was being provided prior to the PPS. After the PPS was implemented, HHAs further reduced the number of visits provided per episode, which lowered their costs. At the same time, a higher proportion of beneficiaries receiving home health care was categorized into the more intensive payment groups, which generated higher payments. 6 Across the Medicare PPS payment groups, there was considerable variation in the relationship between payments and estimated costs. Payments were above estimated costs for 75 of the 80 payment groups. For five of the payment groups, payments were slightly below or about equal to estimated costs. These payment and cost disparities indicate that Medicare’s PPS, which was designed to ensure adequate payments for HHAs that operate efficiently, overpays many HHAs for the services that were actually provided, although some HHAs that face extraordinary costs not accounted for by the payment groups may be financially disadvantaged.
Because Medicare payments for home health care far exceed associated estimated costs, the Congress should consider allowing the mandated reduction to payments to be implemented. However, as we have stated before, we believe that the incentives of the episode-based PPS need to be moderated to protect beneficiaries from underservice, the Medicare program from overpaying for services, and HHAs from potential
5Section 501 of BIPA.
6These home health payment groups are used to adjust payments to account for differences in beneficiary care needs. They reflect three dimensions of care: clinical severity, functional severity, and service utilization. They are known as home health resource groups (HHRGs).
Results in Brief

Page 3 GAO-02-663 Medicare Home Health Care
underpayments.7 Therefore, we continue to believe that the PPS should incorporate risk sharing of financial gains and losses between the Medicare program and HHAs.
In written comments on a draft of this report, CMS stated that our findings are consistent with its preliminary analysis of data from the first year of the PPS, but that HHA costs cannot be known with certainty until Medicare cost reports are available. CMS expressed concern about implementing risk sharing as part of the home health PPS, stating that risk sharing is inconsistent with providing timely and predictable payments under the PPS, is administratively difficult, and is not necessary because our concerns about possible overpayments or underpayments to HHAs can be addressed in other ways. Concerning CMS’ first point, our episode cost estimates are based on the actual number and mix of visits provided to Medicare beneficiaries during the first 6 months of 2001 and the per-visit cost estimates used by the Heath Care Financing Administration (HCFA) to set the initial episode payments, updated for inflation and adjusted for the change in average visit time. We note that CMS has experience in administering payment adjustments similar to risk sharing that rely on actual provider experience while ensuring that payments are timely and predictable. Furthermore, monitoring activities to detect overpayments or underpayments have not yet been implemented. In oral comments on a draft of this report, representatives from three home health care associations stated that they disagreed with our conclusions and believe that a reduction in Medicare’s payments will harm the industry. However, the magnitude of the disparity between payments and estimated costs demonstrates that the reduction would not harm the industry. Risk sharing would provide protection to those HHAs that may incur costs that are higher than these estimates.
Medicare’s home health benefit enables certain beneficiaries with post-acute-care needs (such as recovery from joint replacement) and chronic conditions (such as congestive heart failure) to receive care in their homes. To qualify for home health care, beneficiaries must be confined to
7U.S. General Accounting Office, Medicare Home Health Care: Prospective Payment
System Will Need Refinement as Data Become Available, GAO/HEHS-00-9, (Washington, D.C.: Apr. 7, 2000) and Medicare Home Health Care: Prospective Payment System Could
Reverse Recent Declines in Spending, GAO/HEHS-00-176, (Washington, D.C.: Sept. 8, 2000).
Background
Page 4 GAO-02-663 Medicare Home Health Care
their residence (“homebound”);8 require part-time or intermittent skilled nursing, physical therapy, or speech therapy; be under the care of a physician; and have the services furnished under a plan of care prescribed and periodically reviewed by a physician. If these conditions are met, Medicare will pay for the following types of visits: skilled nursing; physical, occupational, and speech therapy; medical social service; and home health aide. As long as beneficiaries continue to remain eligible for home health services, they may receive an unlimited number of visits. Beneficiaries are not liable for any out-of-pocket costs for this benefit.
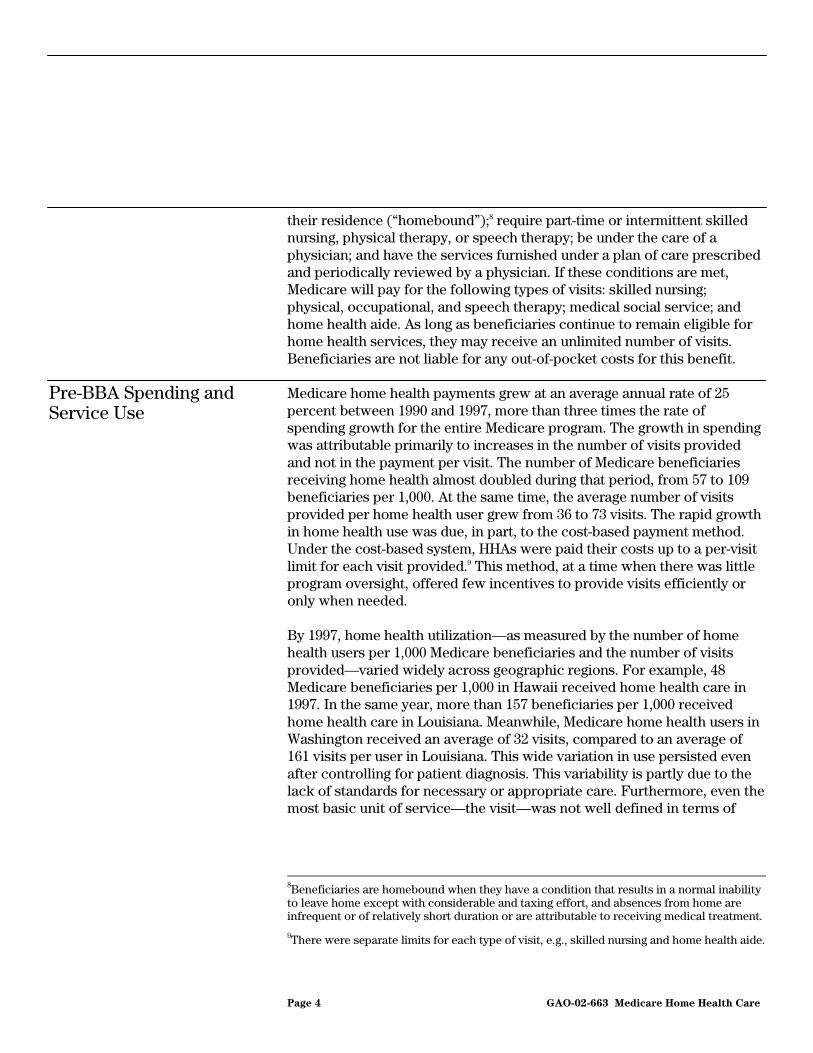
Medicare home health payments grew at an average annual rate of 25 percent between 1990 and 1997, more than three times the rate of spending growth for the entire Medicare program. The growth in spending was attributable primarily to increases in the number of visits provided and not in the payment per visit. The number of Medicare beneficiaries receiving home health almost doubled during that period, from 57 to 109 beneficiaries per 1,000. At the same time, the average number of visits provided per home health user grew from 36 to 73 visits. The rapid growth in home health use was due, in part, to the cost-based payment method. Under the cost-based system, HHAs were paid their costs up to a per-visit limit for each visit provided.9 This method, at a time when there was little program oversight, offered few incentives to provide visits efficiently or only when needed.
By 1997, home health utilization—as measured by the number of home health users per 1,000 Medicare beneficiaries and the number of visits provided—varied widely across geographic regions. For example, 48 Medicare beneficiaries per 1,000 in Hawaii received home health care in 1997. In the same year, more than 157 beneficiaries per 1,000 received home health care in Louisiana. Meanwhile, Medicare home health users in Washington received an average of 32 visits, compared to an average of 161 visits per user in Louisiana. This wide variation in use persisted even after controlling for patient diagnosis. This variability is partly due to the lack of standards for necessary or appropriate care. Furthermore, even the most basic unit of service—the visit—was not well defined in terms of
8Beneficiaries are homebound when they have a condition that results in a normal inability to leave home except with considerable and taxing effort, and absences from home are infrequent or of relatively short duration or are attributable to receiving medical treatment.
9There were separate limits for each type of visit, e.g., skilled nursing and home health aide.
Pre-BBA Spending and Service Use

Page 5 GAO-02-663 Medicare Home Health Care
either the amount of time spent with a patient or the type of services provided.
To constrain Medicare home health spending growth, BBA required HCFA to replace Medicare’s cost-based, per-visit payment method with a PPS by fiscal year 2000.10 Until PPS could be implemented, BBA imposed spending controls under the IPS: For 3 years beginning October 1, 1997, the IPS incorporated tighter per-visit cost limits than had previously been in place and subjected each HHA to an annual Medicare revenue cap, which was the product of an HHA-specific, per-beneficiary amount and the number of beneficiaries that the HHA served.11
Under the PPS, an HHA receives a single payment for all items and services furnished during each 60-day episode of care.12 The payment rate is based on the national average cost of providing care in 1997, not an HHA’s actual costs. Because the payment is divorced from an HHA’s cost of delivering care, an HHA that delivers care for less than the payment amount can profit; conversely, an HHA will lose financially if its service costs are higher than the payment. To account for differences in beneficiary care needs, PPS episode payments are adjusted from a base rate (which was $2,115 in fiscal year 2001). These adjustments are based on a classification system that groups home health beneficiaries into 80 payment groups. The payment for a beneficiary in the most intensive payment group is approximately five times greater than the payment for a beneficiary in the least intensive group. In fiscal year 2001, episode payments ranged from $1,114 to $5,947.
10Section 4603 of BBA, 111 Stat. 467. The Omnibus Consolidated and Emergency Supplemental Appropriations Act of 1999 (Pub. L. No. 105-277, division J, title V, Sec. 5101, 112 Stat. 2681, 2681-914) delayed the PPS implementation by 1 year to October 1, 2000.
11The per-beneficiary amount was a blend of each agency’s 1994 average annual payments for treating a Medicare beneficiary and a regional or national average annual amount. For agencies that had not participated in Medicare for a full year by October 1994, the amount was based on the 1994 national median payment.
12If four or fewer visits are provided during the 60-day episode, Medicare makes a low-utilization payment adjustment (LUPA) and pays a per-visit amount. HHAs receive less than a full episode payment, known as a partial episode payment (PEP), if the episode of care is interrupted, such as when a beneficiary elects to transfer to another HHA, or when a beneficiary is discharged because treatment goals are attained but then returns for additional services to the same HHA. Payments are also adjusted when the beneficiary experiences a significant change in condition (SCIC). An HHA may receive an additional outlier payment for certain extremely high-cost episodes.
BBA Changes to Home Health Payment Policies
Page 6 GAO-02-663 Medicare Home Health Care
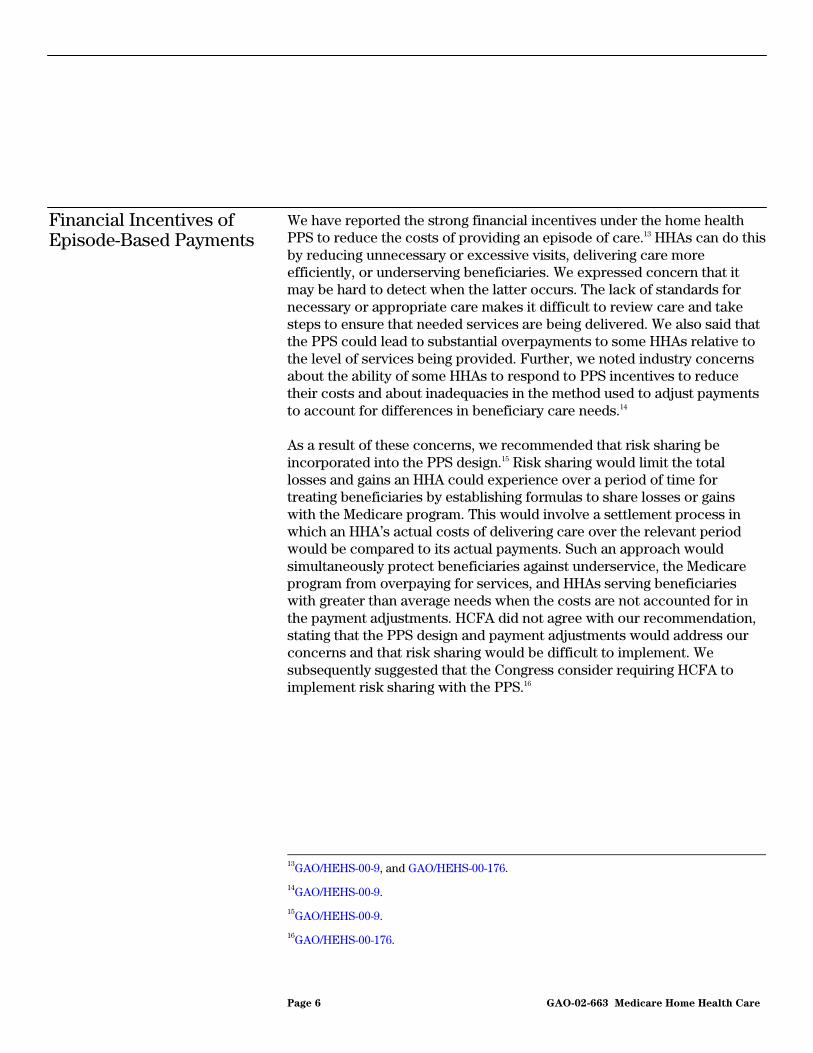
We have reported the strong financial incentives under the home health PPS to reduce the costs of providing an episode of care.13 HHAs can do this by reducing unnecessary or excessive visits, delivering care more efficiently, or underserving beneficiaries. We expressed concern that it may be hard to detect when the latter occurs. The lack of standards for necessary or appropriate care makes it difficult to review care and take steps to ensure that needed services are being delivered. We also said that the PPS could lead to substantial overpayments to some HHAs relative to the level of services being provided. Further, we noted industry concerns about the ability of some HHAs to respond to PPS incentives to reduce their costs and about inadequacies in the method used to adjust payments to account for differences in beneficiary care needs.14
As a result of these concerns, we recommended that risk sharing be incorporated into the PPS design.15 Risk sharing would limit the total losses and gains an HHA could experience over a period of time for treating beneficiaries by establishing formulas to share losses or gains with the Medicare program. This would involve a settlement process in which an HHA’s actual costs of delivering care over the relevant period would be compared to its actual payments. Such an approach would simultaneously protect beneficiaries against underservice, the Medicare program from overpaying for services, and HHAs serving beneficiaries with greater than average needs when the costs are not accounted for in the payment adjustments. HCFA did not agree with our recommendation, stating that the PPS design and payment adjustments would address our concerns and that risk sharing would be difficult to implement. We subsequently suggested that the Congress consider requiring HCFA to implement risk sharing with the PPS.16
13GAO/HEHS-00-9, and GAO/HEHS-00-176.
14GAO/HEHS-00-9.
15GAO/HEHS-00-9.
16GAO/HEHS-00-176.
Financial Incentives of Episode-Based Payments

Page 7 GAO-02-663 Medicare Home Health Care
The average episode payment HHAs received to provide an episode of care in the first 6 months of 2001 was about 35 percent higher than the average estimated cost of providing that care.17 The average episode payment, accounting for the mix of beneficiaries treated in the first 6 months of 2001, was $2,691. (See table 1.) During this period, we estimated that the cost of providing an episode of care was $1,997 after adjusting for the mix of services provided by agencies and changes in the average time spent for each type of visit since the introduction of the PPS.
This large difference between the average episode payment and estimated cost is due to three factors. First, the PPS episode payment amount was calculated on the assumption that about 32 visits would be provided during an average episode, although immediately prior to PPS implementation only about 29 visits per episode were provided. Second, HHAs have further lowered their costs since PPS by providing, on average, only about 22 visits per episode during the first half of 2001. Third, HHA payments have increased because a larger proportion of home health users have been categorized into higher payment groups.
While the PPS adjusts payment rates to account for expected variation in costs due to patient care needs, the relationship between average payments and average estimated costs masks wider differences between payments and estimated costs across the 80 home health payment groups. The relationship between payments and estimated costs for the 10 payment groups that account for almost half of home health episodes ranged from 72 percent above the estimated cost to 4 percent below in the first 6 months of 2001. (See table 2.) For the five payment groups with the lowest payments relative to estimated costs, which accounted for 8 percent of all episodes, the payment ranged from about 9 percent below to about equal the average estimated cost of services provided. The payment was greater than the average estimated cost for the remaining groups.
For any HHA, the relationship between Medicare payments and the costs of providing care will likely vary from the averages we report here. The
17Less than 16 percent of all episodes in the first 6 months of 2001 received a LUPA. These were not included in our analysis because they are not reflective of episode payments or costs. Episodes that required a SCIC adjustment (which may have increased or decreased the payment), a PEP adjustment (which reduced the payment), or an outlier adjustment (which increased the payment) were included although SCIC, PEP, and outlier adjustments were not reflected in our reported payments. Episodes with SCIC or PEP adjustments were less than 5 percent and episodes with outlier adjustments were less than 3 percent of all episodes in the first 6 months of 2001.
Home Health PPS Episode Payments Are Considerably Higher than Estimated Costs of Care Provided

Page 8 GAO-02-663 Medicare Home Health Care
PPS was designed to provide adequate payments to HHAs that operate efficiently and to provide incentives for HHAs to become more efficient. But certain HHAs may have costs higher than payments if they face extraordinary costs not accounted for by the PPS payment groups.
Table 1: Average Estimated Cost per Home Health Episode and Average Home Health Episode Payment, January-June 2001
Type of visit Estimated cost
per visit Average visits per
episodeaAdjusted cost per
episodeb Medical social services $153.59 0.20 $31.71 Speech therapy 113.26 0.17 19.49 Occupational therapy 104.76 0.75 78.57 Physical therapy 104.05 4.24 452.63 Skilled nursing 94.96 10.63 1,035.64 Home health aide 41.75 5.63 228.40 Total 21.63 $1,919.70 Additional costs associated with nonroutine medical supplies, other therapy services, and changes in reporting requirements
$77.11 Average estimated cost per episode
$1,996.81
Average payment per episodec
$2,691.28
aExcludes all episodes with four or fewer visits.
bAdjusted for any increases or decreases in the time spent on visits in 2001 compared to 2000.
CAverage payment across all payment groups, excluding low-utilization episodes. Payment does not include 10 percent rural add-on amount for episodes provided to rural beneficiaries beginning April 1, 2001.
Source: HCFA Final Rule, July 3, 2000, and GAO analysis of 1.48 million episodes from CMS’ home health claims (January-June 2001).

Page 9 GAO-02-663 Medicare Home Health Care
Table 2: Payment Amounts Compared to Average Estimated Costs for 10 Most Frequent Home Health Payment Groups, January-June 2001
Payment groupa Share of episodes
(in percent) Payment amountb
Payments as a percentage of average
estimated cost C2F2S0 8 $2,105 105 C1F2S0 8 $1,736 117 C2F2S2 5 $4,132 168 C1F2S2 5 $3,762 172 C1F1S0 5 $1,516 111 C0F1S0 4 $1,314 106 C2F1S0 4 $1,886 96 C0F2S0 4 $1,533 110 C3F4S0 3 $3,387 149 C2F4S0 3 $2,539 136 Total Sharec 48
aPayment group classifications represent three dimensions of care: clinical severity (C), functional severity (F), and service utilization (S). There are four clinical severity levels (0-3), five functional severity levels (0-4), and four service utilization levels (0-3).
bPayment does not include 10 percent rural add-on amount for episodes provided to rural beneficiaries beginning April 1, 2001.
cShare of episodes does not total to 48 percent due to rounding.
Source: HCFA Final Rule, July 3, 2000, and GAO analysis of 1.48 million episodes from CMS’ home health claims (January-June 2001).
The Medicare program is paying HHAs on average considerably more than the estimated cost of care beneficiaries are receiving. Consequently, implementation of the BBA-mandated 15 percent payment reduction, which would lower fiscal year 2003 PPS payments by 7 percent, should not affect HHAs’ ability to serve Medicare beneficiaries. This payment reduction would move the Medicare program closer to becoming a prudent purchaser of home health care, but the reduction by itself is not sufficient. A single payment to cover all services provided during a 60-day episode of care, combined with the lack of standards for what constitutes necessary or appropriate home health care, leaves beneficiaries vulnerable to underservice, Medicare vulnerable to future overpayments, and HHAs with a disproportionate number of beneficiaries with extensive needs vulnerable to underpayments. Implementing the 15 percent reduction would not lessen these vulnerabilities. This is why we have previously recommended that the PPS include risk sharing to simultaneously protect beneficiaries, the Medicare program, and HHAs.
Conclusions

Page 10 GAO-02-663 Medicare Home Health Care
The Congress should consider making no change in the requirement for a reduction in Medicare home health payments. We continue to urge the Congress to require CMS to incorporate risk sharing into the PPS design.
In written comments on a draft of this report, CMS stated that our findings are consistent with its preliminary analysis of data for the first year of the PPS. It noted that cost report data, which are not yet available for the first year of the PPS, would be required to determine the costs of home health services under the PPS with certainty. CMS reiterated its concerns about implementing risk sharing as a part of the PPS. It believes that risk sharing would undermine the main benefit of PPS, which is payments that are timely and predictable. Further, CMS stated its belief that the outlier payment policy under the home health PPS and planned monitoring activities should mitigate our concern that some HHAs may be vulnerable to underpayments. Finally, CMS stated that risk sharing is administratively difficult.
Although cost report data would more accurately reflect an HHA’s costs, our episode cost estimates build on historic visit costs, adjusted for inflation and changes in visit time, and reflect actual service use, a major determinate of episode costs. We believe that the new evidence we present on the wide disparity between payments and estimated costs on average and across payment groups demonstrates the need for and the value of risk sharing in conjunction with the home health PPS. Risk sharing would not remove the incentives under the PPS for HHAs to provide care efficiently, because they would continue to benefit financially when their costs are below their payments and lose financially when their costs are above their payments. Yet, risk sharing would mitigate extreme gains and losses under the PPS. While the monitoring activities and refinements that CMS discusses such as revisions to the payment groups could mitigate extreme gains or losses, it could be some time until they are implemented. Furthermore, outlier payments, which account for less than 3 percent of payments, are not by themselves sufficient to protect vulnerable HHAs that have higher than average costs across a number of patients, nor do they protect the Medicare program from excessive spending.
We believe that CMS could overcome any administrative difficulties in implementing risk sharing. CMS incorporated a risk-sharing arrangement in its demonstration project on the home health PPS while ensuring predictable and timely payments. We note that CMS has considerable
Matters for Congressional Consideration
Agency Comments and Our Evaluation

Page 11 GAO-02-663 Medicare Home Health Care
experience in adjusting prospective payments to providers based on expectations for a provider’s costs in the coming year, most recently in implementing the hospital outpatient PPS, which has a provision to protect hospitals from losses.
CMS’ comments are included as appendix II.
We received oral comments on a draft of this report from representatives of three home health care associations—American Association for Homecare (AAHomecare), National Association for Home Care (NAHC), and Visiting Nurse Associations of America (VNAA). These organizations disagreed with our conclusions. All three associations expressed concern about the effect of a potential payment reduction on the industry’s stability and, in particular, its ability to care for medically complex patients. The associations said it was too early in the experience of the PPS to accurately measure home health care use, visit costs, episode costs, or industry profit margins. VNAA stated that our cost estimates do not reflect current fixed costs under the PPS. NAHC raised questions about the timeliness of payments if risk sharing is a part of the home health PPS. The associations said that more information was needed on how low-utilization episodes, partial episodes, and outlier payments would affect the relationship between average episode costs and payments to HHAs.
Our results are consistent with CMS’ analysis of a full year of experience under the PPS. Our analysis of 1.48 million episodes did not consider the payment reduction for partial episodes, payment enhancement for outliers, or variable payment adjustments for a significant change in a beneficiary’s condition. When calculating episode payments and estimated costs we treated these as full episodes. The impact of these payment adjustments on average episode payments is likely to be minimal because they are partially offsetting and apply to less than 8 percent of episodes. Whether the visit costs for these types of episodes is different from the average visit costs is not known. We excluded low-utilization episodes from our analysis because they are not paid an episode rate. HHA visits per user have been dropping since 1997, allowing ample time for HHAs to bring their fixed costs in line with current use patterns. The magnitude of the difference between payments and estimated costs provides compelling evidence that the legislated reduction would not destabilize the home health industry. Further, risk sharing if implemented would moderate any negative effects on the HHAs that may incur costs that are higher than these estimates including when HHAs treat medically complex patients.

Page 12 GAO-02-663 Medicare Home Health Care
We are sending copies of this report to the Administrator of CMS. We will also make copies available to others upon request.
If you or your staff have any questions, please call me at (202) 512-7114. Other contacts and staff who contributed to this report are listed in appendix III.
Laura A. Dummit Director, Health Care—Medicare Payment Issues

Page 13 GAO-02-663 Medicare Home Health Care
List of Committees
The Honorable Max Baucus, Chairman The Honorable Charles E. Grassley Ranking Minority Member Committee on Finance United States Senate
The Honorable W. J. “Billy” Tauzin, Chairman The Honorable John D. Dingell Ranking Minority Member Committee on Energy and Commerce House of Representatives
The Honorable William M. Thomas, Chairman The Honorable Charles B. Rangel Ranking Minority Member Committee on Ways and Means House of Representatives

Appendix I: Scope and Methodology
Page 14 GAO-02-663 Medicare Home Health Care
We conducted our analyses using Medicare provider, claims, and beneficiary files for calendar years 2000 and 2001. We included only those providers that were listed as active in each year. For episodes ending on January 1, 2001 through June 30, 2001, we used all final bills from the home health Standard Analytic File (SAF) for 2001 that were available as of January 24, 2002. Our file of 1.48 million episodes, which excludes all low-utilization episodes, does not include any claims for the first 6 months of 2001 submitted after January 24, 2002. For 2000, we used all final bills ending on January 1, 2000 through June 30, 2000.
To compute our estimate of average episode costs, we used HCFA’s per-visit cost estimates that were used to establish the PPS episode rates and that were calculated from the sample of fiscal year 1997 audited costs reports.1 The per-visit costs, which include all costs of home health services covered and paid for on a reasonable cost basis, were inflated to 2001 cost levels using the market basket index for home health services. Then we adjusted the per-visit costs to account for the change in the time spent for each type of visit in 2001 compared to 2000. We estimated episode costs by multiplying the adjusted per-visit cost for each type of visit by the average mix of visits provided in each payment group in a 2001 episode. We also added an additional amount for the costs of other services not included in the per-visit costs.2 Our methodology assumes that the relationship between direct patient care costs and overhead costs has remained the same over time and therefore that administrative costs have not increased or decreased since the PPS.
1See Medicare Program: Prospective Payment System for Home Health Agencies, 65 Federal Register 41,128 (2000). HCFA also made several additional adjustments to the basic cost-per-visit calculations, including increasing the audited cost report data for nonroutine medical supplies, and decreasing costs for providers affected by the per-visit limits (see 65 Federal Register 41,170).
2The additional services include certain therapies not in the visits, additional medical supplies, and costs associated with new reporting requirements. See Medicare Program: Prospective Payment System for Home Health Agencies, 65 Federal Register 41,128 (2000).
Appendix I: Scope and Methodology

Appendix I: Scope and Methodology
Page 15 GAO-02-663 Medicare Home Health Care
We calculated the average payment as the payment amount for each of the 80 payment groups weighted by the proportion of all episodes in 2001 provided within each payment group.
We interviewed CMS officials and industry representatives from the American Association for Homecare, National Association for Home Care, Gentiva Health Services, Rocky Mountain Health Care, and the Visiting Nurse Associations of America regarding the changes in provider practices since the implementation of PPS.

Appendix II: Comments from the Centers for
Medicare and Medicaid Services
Page 16 GAO-02-663 Medicare Home Health Care
Appendix II: Comments from the Centers for Medicare and Medicaid Services

Appendix II: Comments from the Centers for
Medicare and Medicaid Services
Page 17 GAO-02-663 Medicare Home Health Care

Appendix III: GAO Contacts and Staff
Acknowledgments
Page 18 GAO-02-663 Medicare Home Health Care
James E. Mathews, (202) 512-9427 Nancy Edwards, (202) 512-3340
In addition to those named above, Leslie V. Gordon, Dan Lee, Carolyn Manuel-Barkin, Lynn Nonnemaker, and Paul M. Thomas made key contributions to this report.
Appendix III: GAO Contacts and Staff Acknowledgments
GAO Contacts
Staff Acknowledgments
(290147)

The General Accounting Office, the investigative arm of Congress, exists to support Congress in meeting its constitutional responsibilities and to help improve the performance and accountability of the federal government for the American people. GAO examines the use of public funds; evaluates federal programs and policies; and provides analyses, recommendations, and other assistance to help Congress make informed oversight, policy, and funding decisions. GAO’s commitment to good government is reflected in its core values of accountability, integrity, and reliability.
The fastest and easiest way to obtain copies of GAO documents at no cost is through the Internet. GAO’s Web site (www.gao.gov) contains abstracts and full-text files of current reports and testimony and an expanding archive of older products. The Web site features a search engine to help you locate documents using key words and phrases. You can print these documents in their entirety, including charts and other graphics.
Each day, GAO issues a list of newly released reports, testimony, and correspondence. GAO posts this list, known as “Today’s Reports,” on its Web site daily. The list contains links to the full-text document files. To have GAO e-mail this list to you every afternoon, go to www.gao.gov and select “Subscribe to daily E-mail alert for newly released products” under the GAO Reports heading.
The first copy of each printed report is free. Additional copies are $2 each. A check or money order should be made out to the Superintendent of Documents. GAO also accepts VISA and Mastercard. Orders for 100 or more copies mailed to a single address are discounted 25 percent. Orders should be sent to:
U.S. General Accounting Office 441 G Street NW, Room LM Washington, D.C. 20548
To order by Phone: Voice: (202) 512-6000 TDD: (202) 512-2537 Fax: (202) 512-6061
Contact:
Web site: www.gao.gov/fraudnet/fraudnet.htm E-mail: [email protected] Automated answering system: (800) 424-5454 or (202) 512-7470
Jeff Nelligan, managing director, [email protected] (202) 512-4800 U.S. General Accounting Office, 441 G Street NW, Room 7149 Washington, D.C. 20548
GAO’s Mission
Obtaining Copies of GAO Reports and Testimony
Order by Mail or Phone
To Report Fraud, Waste, and Abuse in Federal Programs
Public Affairs


![[ ]70-663.by.mandy.pdf](https://static.fdocuments.in/doc/165x107/55cf8f8f550346703b9d787f/wwwmcseccnacom70-663bymandypdf.jpg)