Gamma-Ray Imaging Spectrometry - Lawrence Livermore National

GAMMA-RAY SPECTROMETRY OF LDEF SAMPLES AT SRL
Willard G. Winn
Westinghouse Savannah River CompanySavannah River Site
Aiken, SC 29808
Phone:
N9')-93299
803/725-2057 Fax: 803/725-3272
SUMMARY
A total of 3 1 samples from LDEE including materials of aluminum, vanadium, and
steel trunnions were analyzed by ultra-low-level gamma spectrometry. The study
quantified particle induced activations of 22Na, 46Sc, 51Cr, 54Mn, 56C0, 57C0, 58C0, and
6°C0. The samples of trunnion sections exhibited increasing activity toward the outer end
of the trunnion and decreasing activity toward its radial center. The trunnion sections did
not include end pieces, which have been reported to collect noticeable 7Be on their
leading surfaces. No significant 7Be was detected in the samples analyzed.
The Underground Counting Facility at Savannah River Laboratory (SRL) was used in
this work. The facility is 50 ft underground, constructed with low-background shielding
materials, and operated as a clean room. The most sensitive analyses were performed
with a 90%-efficient HPGe gamma-ray detector, which is enclosed in a purged active/
passive shield. Each sample was counted for one to six days in two orientations to yield
more representative average activities for the sample. The non-standard geometries of
the LDEF samples prompted the development of a novel calibration method, whereby
the efficiency about the sample surfaces (measured with point sources) predicted the
efficiency for the bulk sample.
INTRODUCTION
Prior to retrieval of LDEF in January 1990, NASA Marshall Space Center initiated a
program for radiometric analysis of the LDEF samples. 1 Due to extensive experience in
ultra-low-level counting of environmental samples at the SRL Underground Counting
Facility, NASA selected it as one of the laboratories for LDEF analyses. SRL received its
first LDEF samples on March 7, 1990, and a total of 68 gamma spectrometry analyses
were conducted on 31 samples submitted during 1990-1991. Round robin gamma
analyses of these or similar samples were conducted at PNL, LNL, LBL, LLL, ORNL,
TVA, and at NASA facilities in Houston, Texas and Huntsville, Alabama.
This report emphasizes the measurements of the induced radioactivity in the LDEF
samples submitted to SRL whereby it identifies particle reactions for producing the
observed radionuclides, and examines trends within the data. These results will be used
to appraise and improve models for characterizing trapped particles and cosmic rays. 2-4
A special emphasis is also given to the development of efficiencies for these somewhat
unorthodox samples.
PREC.Fr..{)tr_ PAGE BLAi"_K I_'}'i" FILMED287
https://ntrs.nasa.gov/search.jsp?R=19920014056 2018-05-02T14:02:47+00:00Z
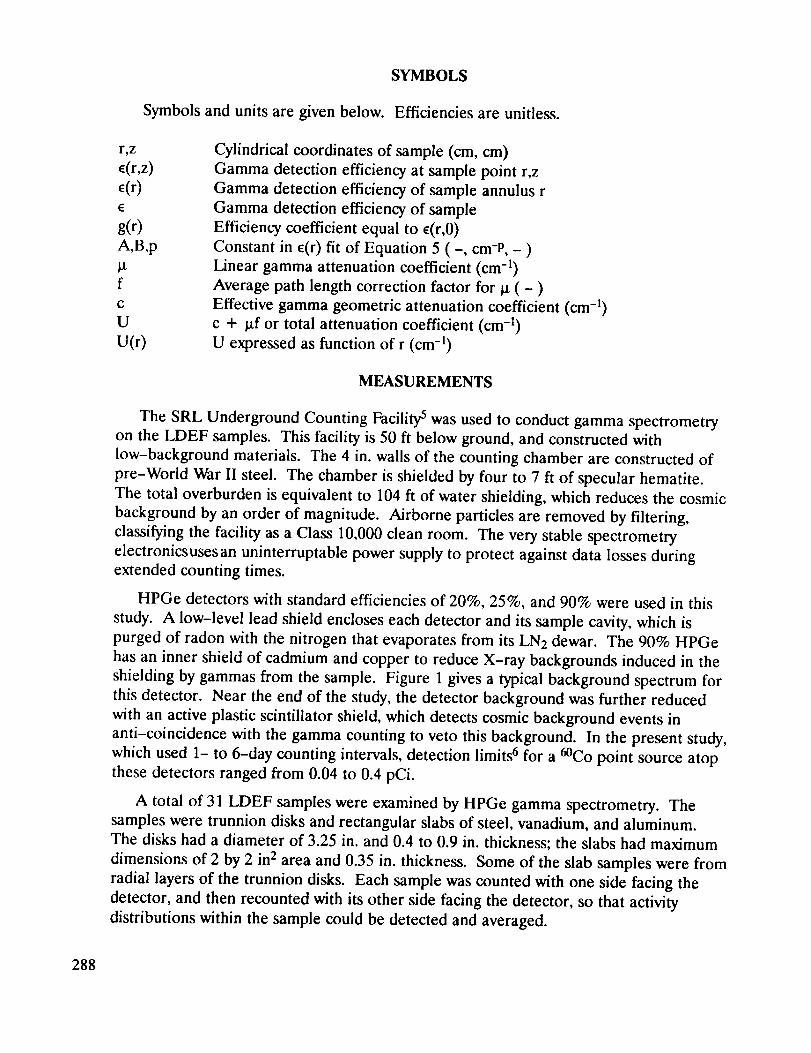
SYMBOLS
Symbols and units are given below. Efficiencies are unitless.
r,z
_(r,z)
_(r)
E
g(r)
A,B,p
Ixf
C
U
U(r)
Cylindrical coordinates of sample (cm, cm)
Gamma detection efficiency at sample point r,z
Gamma detection efficiency of sample annulus r
Gamma detection efficiency of sample
Efficiency coefficient equal to c(r,0)
Constant in _(r) fit of Equation 5 ( -, cm-P, - )
Linear gamma attenuation coefficient (cm -1)
Average path length correction factor for _ ( - )
Effective gamma geometric attenuation coefficient (cm -1)
c + t.tf or total attenuation coefficient (cm -1)
U expressed as function of r (cm -1)
MEASUREMENTS
The SRL Underground Counting Facility 5 was used to conduct gamma spectrometry
on the LDEF samples. This facility is 50 ft below ground, and constructed with
low-background materials. The 4 in. walls of the counting chamber are constructed of
pre-World War II steel. The chamber is shielded by four to 7 ft of specular hematite.
The total overburden is equivalent to 104 ft of water shielding, which reduces the cosmic
background by an order of magnitude. Airborne particles are removed by filtering,
classifying the facility as a Class 10,000 clean room. The very stable spectrometry
electronicsusesan uninterruptable power supply to protect against data losses during
extended counting times.
HPGe detectors with standard efficiencies of 20%, 25%, and 90% were used in this
study. A low-level lead shield encloses each detector and its sample cavity, which is
purged of radon with the nitrogen that evaporates from its LN2 dewar. The 90% HPGe
has an inner shield of cadmium and copper to reduce X-ray backgrounds induced in the
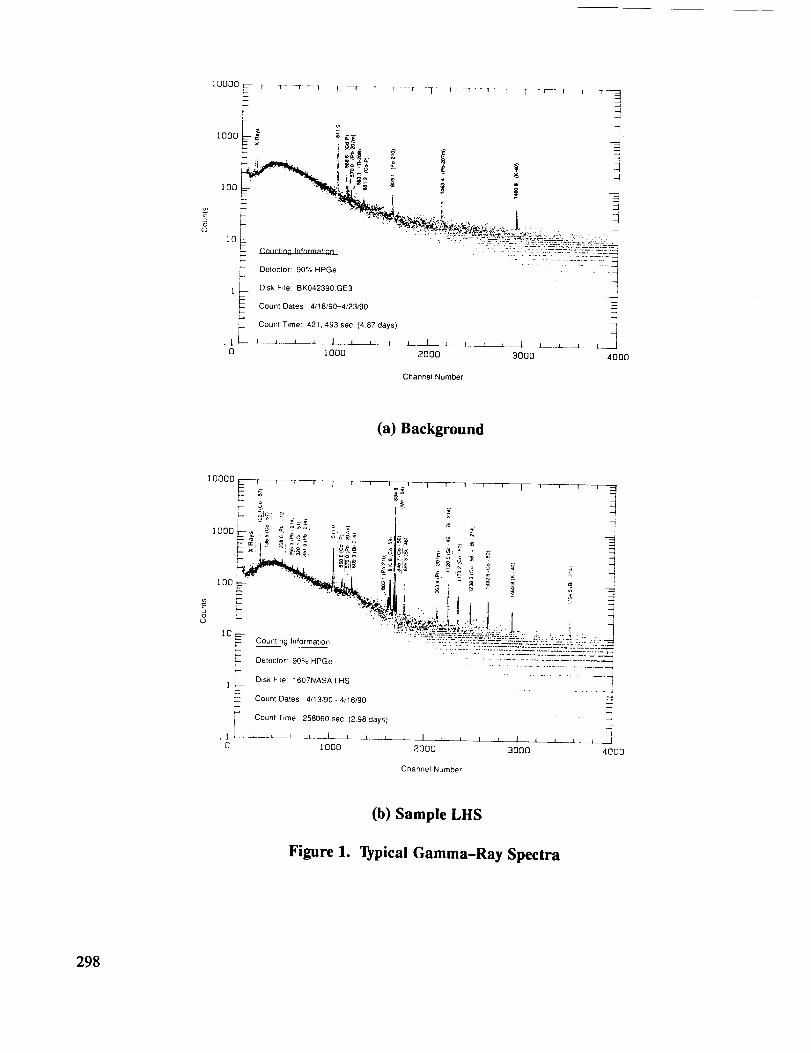
shielding by gammas from the sample. Figure 1 gives a typical background spectrum for
this detector. Near the end of the study, the detector background was further reduced
with an active plastic scintillator shield, which detects cosmic background events in
anti-coincidence with the gamma counting to veto this background. In the present study,
which used 1- to 6-day counting intervals, detection limits 6 for a 6°Co point source atop
these detectors ranged from 0.04 to 0.4 pCi.
A total of 31 LDEF samples were examined by HPGe gamma spectrometry. The
samples were trunnion disks and rectangular slabs of steel, vanadium, and aluminum.
The disks had a diameter of 3.25 in. and 0.4 to 0.9 in. thickness; the slabs had maximum
dimensions of 2 by 2 in 2 area and 0.35 in. thickness. Some of the slab samples were from
radial layers of the trunnion disks. Each sample was counted with one side facing the
detector, and then recounted with its other side facing the detector, so that activity
distributions within the sample could be detected and averaged.
288
Detector efficiency calibration for the above samples used a method of mapping the
point source efficiency over the sample surfaces. Point sources of 54Mn, 57C0, COCo,
133Ba, and 137Cs were used. Such a non-destructive calibration technique was important
in this work because NASA required the samples be returned intact for round robin
analyses at other laboratories.
ANALYSES
General
The HPGe data were collected as 4000 channel gamma spectra, as illustrated in
Figure 1. The GRABGAM code, 5 which was developed at SRL for low-level counting,
analyzed the spectra. This code uses three peak-area trapping windows, the largest of
which is very sensitive for picking out peaks with low counting statistics. The peaks are
examined as integral probability functions F(x) per channel x to provide better statistics
than afforded by fitting the peaks to differential probabilitiesf(x)dx. Such enhanced
statistics are useful in characterizing the centroids and widths of low-level peaks.
Following the analysis any peak contributions from the background spectrum are
subtracted. The HPGe efficiency analyses procedures are overviewed in Figure 2 where
methods for the trunnion disks and slab samples are outlined. Cylindrical coordinates r
and z, relative to the sample, are used in the development of the HPGe efficiencies.
Trunnion Disks
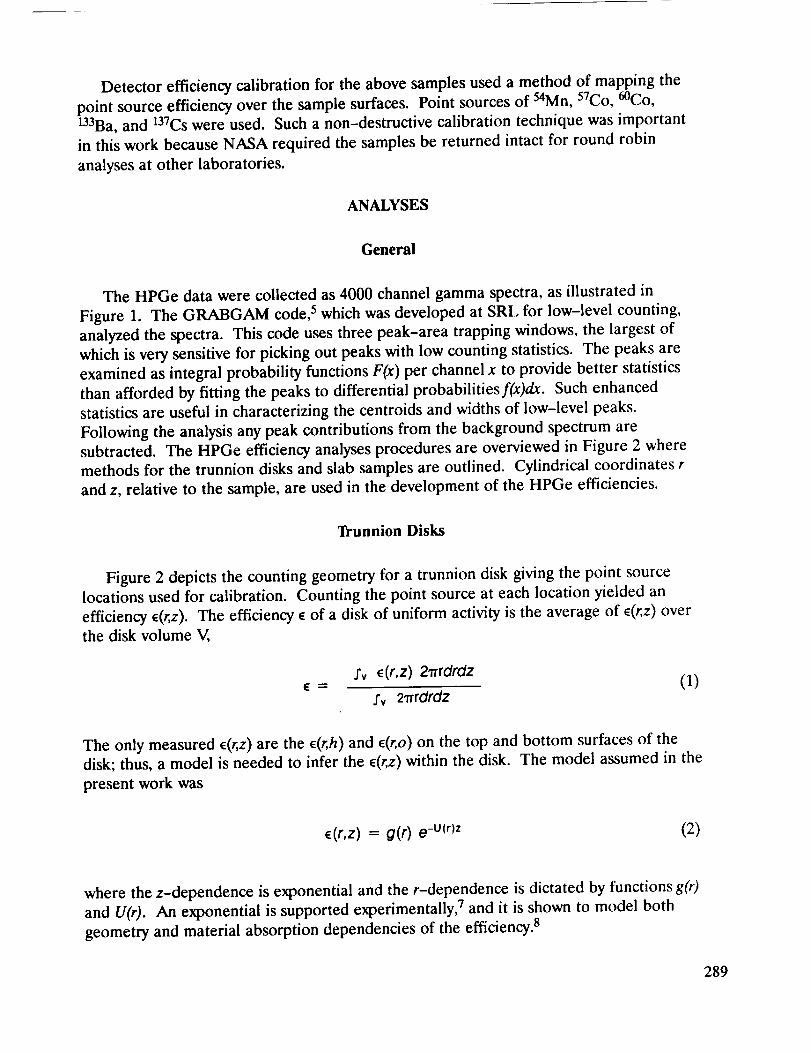
Figure 2 depicts the counting geometry for a trunnion disk giving the point source
locations used for calibration. Counting the point source at each location yielded an
efficiency ¢(r,z). The efficiency _ of a disk of uniform activity is the average of _(r,z) over
the disk volume V,
Iv e(r,z) 2rrrdrdz= (1)
.rv 2'rrrdrdz
The only measured c(r,z) are the _(r,h) and c(r,o) on the top and bottom surfaces of the
disk; thus, a model is needed to infer the c(r,z) within the disk. The model assumed in the
present work was
c(r,z) = g(r) e-U(r)z (2)
where the z-dependence is exponential and the r-dependence is dictated by functions g(r)
and U(r). An exponential is supported experimentally, 7 and it is shown to model both
geometry and material absorption dependencies of the efficiency. 8
289
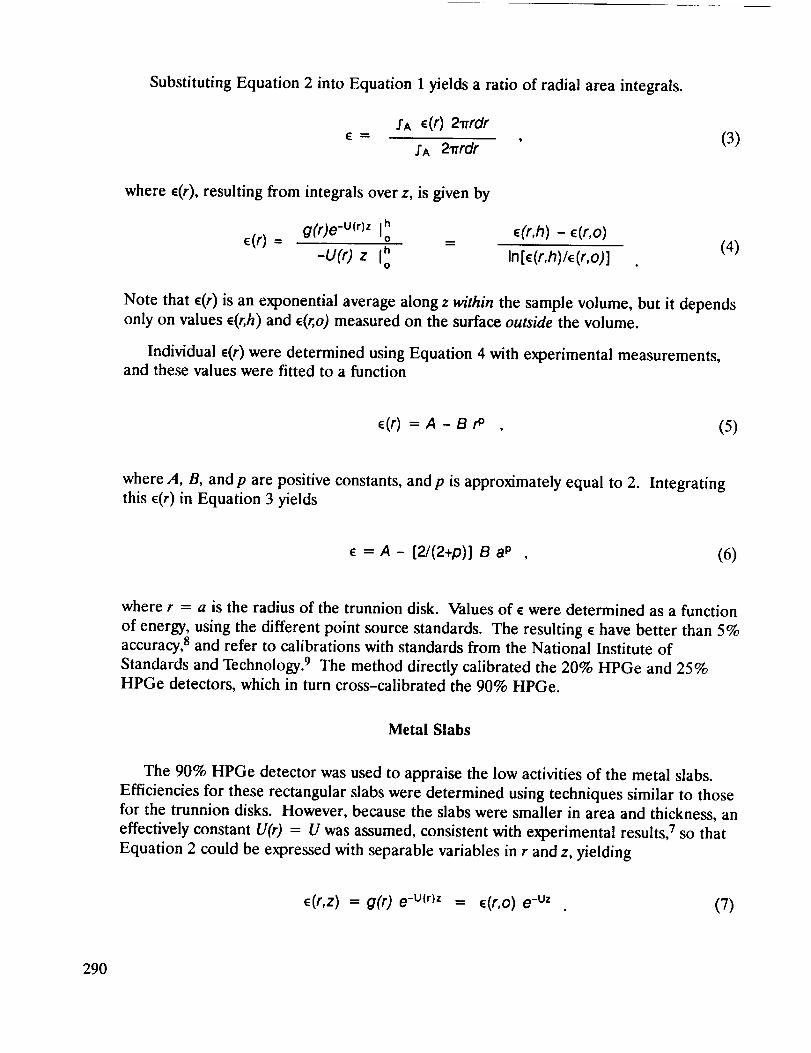
Substituting Equation 2 into Equation 1 yields a ratio of radial area integrals.
IA c(r) 2_rdr
f A 2"rrrdr(3)
where e(r), resulting from integrals over z, is given by
E(r) = g(r)e -u(r)z I_ = e(r,h) - F.(r,o) (4)
-U(r) z In[c(r,h)/_(r,o)]
Note that _(r) is an exponential average along z within the sample volume, but it depends
only on values _(r,h) and c(r,o) measured on the surface outside the volume.
Individual c(r) were determined using Equation 4 with experimental measurements,and these values were fitted to a function
_(r) =A-Bt9 , (5)
where A, B, and p are positive constants, and p is approximately equal to 2. Integrating
this c(r) in Equation 3 yields
= A - [2/(2+p)] e ap (6)
where r = a is the radius of the trunnion disk. Values of c were determined as a function
of energy, using the different point source standards. The resulting c have better than 5%
accuracy, 8 and refer to calibrations with standards from the National Institute of
Standards and Technology. 9 The method directly calibrated the 20% HPGe and 25%
HPGe detectors, which in turn cross-calibrated the 90% HPGe.
Metal Slabs
The 90% HPGe detector was used to appraise the low activities of the metal slabs.
Efficiencies for these rectangular slabs were determined using techniques similar to those
for the trunnion disks. However, because the slabs were smaller in area and thickness, an
effectively constant U(r) = U was assumed, consistent with experimental results, 7 so that
Equation 2 could be expressed with separable variables in r and z, yielding
c(r,z) = g(r) e -u(m = c(r,o) e -u' . (7)
290

When inserted in Equation 1, this e(r,z) yields
h e_Uz dzIA e(r,o) 2"rrrdr I ° = <e(r,O)>A 1-e-Uh= (8)h
IA 2"rrrdr fo dz Uh
where the first term is the numerical integrated average over the rectangular bottom
surface, and the second term is integrated average over z. The point source mappings on
the detector surface are used to determine the first term. The second term requires a
knowledge of U, which may be expressed as
u = c + , (9)
where c models the geometry dependence, and laf models the material absorption. 8 Here,
the material attenuation coefficient I.t is increased by a factor off to correct for the
average attenuation path, which is somewhat greater than z. The entire energy-
dependence of U is primarily contained in p, as c and f are essentially geometric
parameters. Experimental measurements with sources of 54Mn, 57C0, 6°C0, and 137Cs
yielded U as a function of It, to allow interpolation for predicting U for the other
radionuclides. The tl for the gamma energies of these radionuclides were obtained from
tabulations. 1° The resulting U were then used in Equation 8 to yield the slab efficiency E.
A correction to e needed to be developed for the 22Na that was produced in the
aluminum slabs, as its detected 1274 keV gamma peak is depleted by summing with its
511 keV annihilation gammas. Experimental measurements and calculations deduced
that the observed 1274 keV count rate should be multiplied by a summing correction of1.41 for the 90% HPGe detector. 8
RESULTS
Trunnion disk sample results are summarized in Table 1. Specific activities are given
for 7Be, 46Sc, 51Cr, 54Mn, 56Mn, 57Co, 58Co, and 6°Co, where 54Mn is dominant and 7Be is
only marginally detected at best. Here the results from counting both sides of the disk
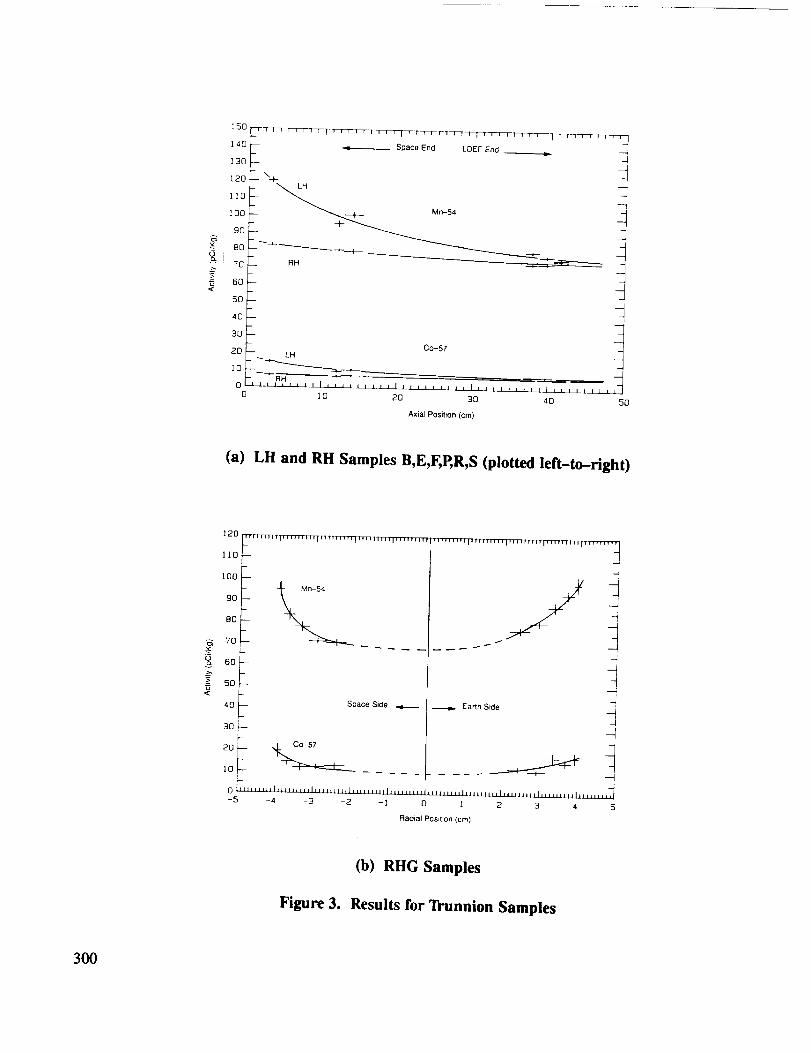
have been averaged to yield the values presented. Figure 3a plots the disk results for
54Mn and 57Co as a function of axial position along the trunnion, showing that these
activities decrease as the position nears the LDEF end of the trunnion from the space
end. Both trunnions were from the earth end of LDEE where the LH-trunnion faced
west, and the RH-trunnion faced east.
Trunnion radial layer activities are given in Table 2. The only significant radionuclides
detected in these relatively small samples were 54Mn and 57Co. The results are the
average from counting both sides of the sample. Figure 3b plots the layer results,
showing that the activities increase with increasing radial position of the trunnion. The
data also suggest that the radial profiles on the space side of the trunnion differ from
291

those on the earth side. The axial position of this RH-trunnion piece is 18 cm from its
space end.
Vanadium and aluminum sample activities are presented in Table 2. Only 46Sc was
detected in the vanadium and only 22Na was detected in the aluminum. Again, the
activities are the average from counting both sides. The vanadium samples were from
extreme LDEF locations, as the DISCUSSION will describe. The aluminum samples
were from the keel plate and the end support retainer plate.
DISCUSSION
The LDEF samples examined in the present work implied cosmic activations induced
by protons and neutrons. The trunnions imply activations as 14N(p,2007Be; 46"I'i(n,p)46Sc;
54Fe(n,_)51Cr; 56Fe(p,2pn)54Mn; 58Ni(p,2pn)56Co; 58Ni(p,2p)57Co; 58Ni(n,p)58Co; and59Co(nH)6°Co. Actually, little if any 7Be was observed. Noticeable 7Be had been
reported on samples with leading surfaces that can collect particles in the LDEF path, 11
but none of the samples analyzed at SRL had such surfaces. The only respective
activations in the vanadium and aluminum samples were 5IV(p,*) 46Sc and 27Al(p,*)22Na,
where spallation (*) reactions occurred.
Trunnions
The activities of 54Mn and 57Co decrease for axial positions closer to the LDEF body.
The activities also decrease for decreasing radial position. Both decreasing trends are
consistent with increased cosmic ray shielding. In addition, the LH or west-facing
trunnion was activated somewhat more than the RH or east-facing trunnion; this is a
signature of the trapped proton anisotropy in the South Atlantic Anomaly region. 3 The
results are further supported by independent measurements on trunnions, 7 which are
consistent for predictions for trapped and galactic protons. 4
The data of Figure 3 also provide a self-consistency test between the modeled gamma
efficiencies for the layer and disk samples. For the RHG section, its two radial activity
profiles (earth side and space side) for 54Mn were combined to yield their average radial
profile, which was integrated to yield an activity of 79.8 pCi/kg for the RHG disk. This is
consistent with the RH-trunnion trend of Figure 3 as the adjacent RHF disk activity was
78.98 __. 1.34 pCi/kg. Although the 57Co radial profile is consistent with that of the 54Mn,
the imprecise data allow rather different profiles as well. However, no reasonable 57Co
profile yielded an integrated activity that was consistent with the trunnion trend in
Figure 3. Specifically, the reasonable 57Co profiles predicted a range of 10.5 to 13.7
pCi/kg for the RHG disk 8 while the adjacent RHF disk activity was 7.00 +_.0.59 pCi/kg.
292
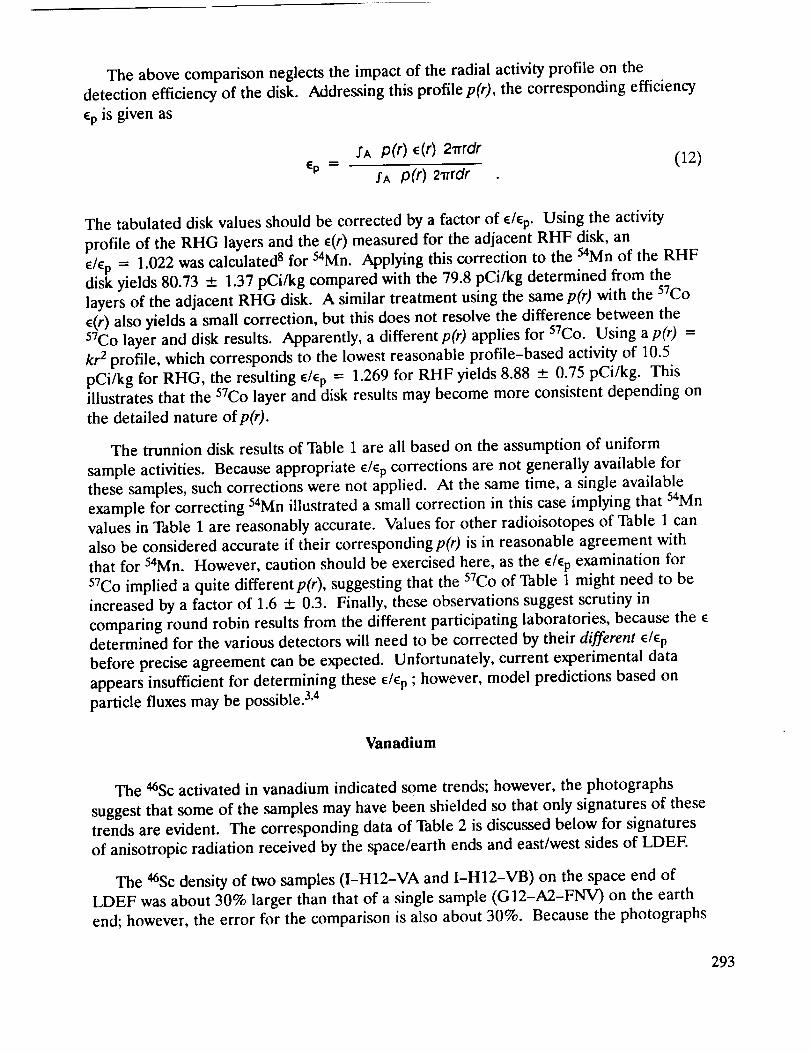
The abovecomparison neglectsthe impact of the radial activity profile on thedetection efficiency of the disk. Addressing this profile p(r), the corresponding efficiency
Cp is given as
,rA p(r) c(r) 2_rdr% = (12)
./'A p(r) 2_rrdr
The tabulated disk values should be corrected by a factor of C/Cp. Using the activityprofile of the RHG layers and the c(r) measured for the adjacent RHF disk, an
C/Cp = 1.022 was calculated 8 for 54Mn. Applying this correction to the 54Mn of the RHF
disk yields 80.73 _+ 1.37 pCi/kg compared with the 79.8 pCi/kg determined from the
layers of the adjacent RHG disk. A similar treatment using the same p(r) with the 57Co
c(r) also yields a small correction, but this does not resolve the difference between the
57Co layer and disk results. Apparently, a differentp(r) applies for 57Co. Using ap(r) =
kr 2 profile, which corresponds to the lowest reasonable profile-based activity of 10.5
pCi/kg for RHG, the resulting C/_p = 1.269 for RHF yields 8.88 _ 0.75 pCi/kg. Thisillustrates that the 57Co layer and disk results may become more consistent depending on
the detailed nature ofp(r).
The trunnion disk results of Table 1 are all based on the assumption of uniform
sample activities. Because appropriate e/% corrections are not generally available for
these samples, such corrections were not applied. At the same time, a single available
example for correcting 54Mn illustrated a small correction in this case implying that 54Mn
values in Table 1 are reasonably accurate. Values for other radioisotopes of Table 1 can
also be considered accurate if their corresponding p(r) is in reasonable agreement with
that for 54Mn. However, caution should be exercised here, as the _/_p examination for
57Co implied a quite differentp(r), suggesting that the 57Co of Table 1 might need to be
increased by a factor of 1.6 _ 0.3. Finally, these observations suggest scrutiny in
comparing round robin results from the different participating laboratories, because the c
determined for the various detectors will need to be corrected by their different e/c obefore precise agreement can be expected. Unfortunately, current experimental data
appears insufficient for determining these C/Cp ; however, model predictions based onparticle fluxes may be possible. 3,4
Vanadium
The 46Sc activated in vanadium indicated some trends; however, the photographs
suggest that some of the samples may have been shielded so that only signatures of these
trends are evident. The corresponding data of Table 2 is discussed below for signatures
of anisotropic radiation received by the space/earth ends and east/west sides of LDEE
The 'UiSc density of two samples (I-H12-VA and I-H12-VB) on the space end of
LDEF was about 30% larger than that of a single sample (G 12-A2-FNV) on the earth
end; however, the error for the comparison is also about 30%. Because the photographs
293
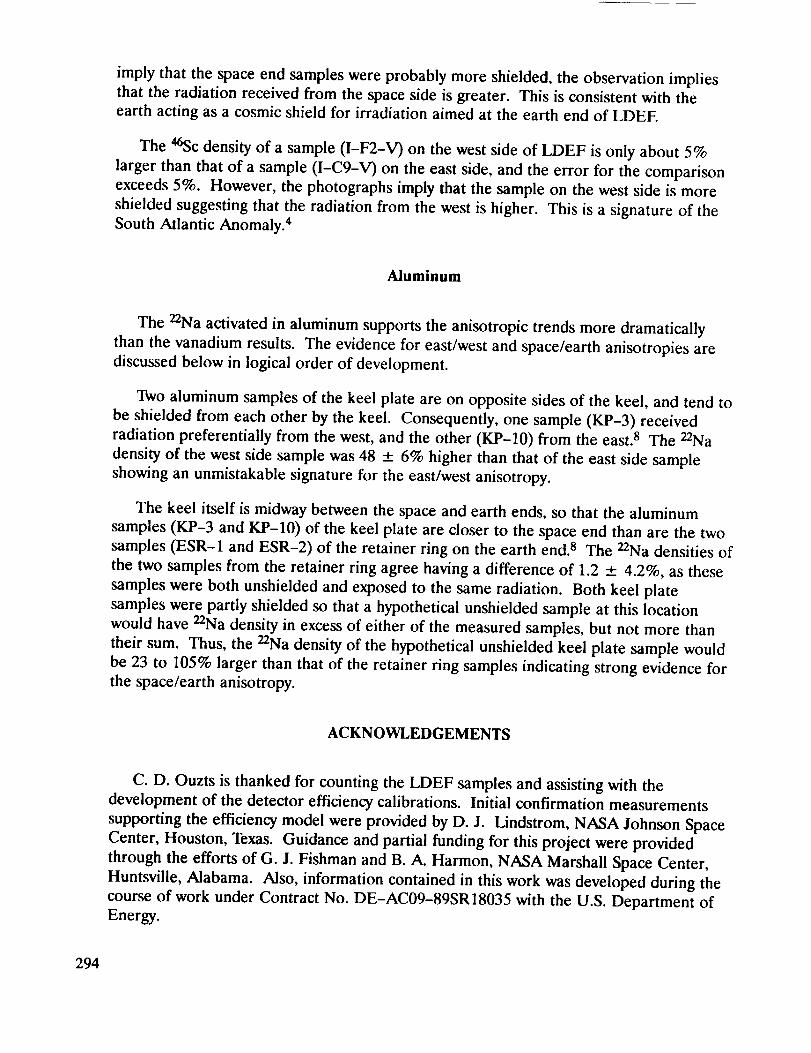
imply that the space end samples were probably more shielded, the observation implies
that the radiation received from the space side is greater. This is consistent with the
earth acting as a cosmic shield for irradiation aimed at the earth end of LDEE
The 46Sc density of a sample (I-F2-V) on the west side of LDEF is only about 5%
larger than that of a sample (I-C9-V) on the east side, and the error for the comparison
exceeds 5%. However, the photographs imply that the sample on the west side is more
shielded suggesting that the radiation from the west is higher. This is a signature of the
South Atlantic Anomaly. 4
Aluminum
The 22Na activated in aluminum supports the anisotropic trends more dramatically
than the vanadium results. The evidence for east/west and space/earth anisotropies are
discussed below in logical order of development.
Two aluminum samples of the keel plate are on opposite sides of the keel, and tend to
be shielded from each other by the keel. Consequently, one sample (KP-3) received
radiation preferentially from the west, and the other (KP-10) from the east. 8 The 22Na
density of the west side sample was 48 __+6% higher than that of the east side sample
showing an unmistakable signature for the east/west anisotropy.
The keel itself is midway between the space and earth ends, so that the aluminum
samples (KP-3 and KP-10) of the keel plate are closer to the space end than are the two
samples (ESR-1 and ESR-2) of the retainer ring on the earth end. 8 The 22Na densities of
the two samples from the retainer ring agree having a difference of 1.2 ___4.2%, as these
samples were both unshielded and exposed to the same radiation. Both keel plate
samples were partly shielded so that a hypothetical unshielded sample at this location
would have 22Na density in excess of either of the measured samples, but not more than
their sum. Thus, the 22Na density of the hypothetical unshielded keel plate sample would
be 23 to 105% larger than that of the retainer ring samples indicating strong evidence for
the space/earth anisotropy.
ACKNOWLEDGEMENTS
C. D. Ouzts is thanked for counting the LDEF samples and assisting with the
development of the detector efficiency calibrations. Initial confirmation measurements
supporting the efficiency model were provided by D. J. Lindstrom, NASA Johnson Space
Center, Houston, Texas. Guidance and partial funding for this project were provided
through the efforts of G. J. Fishman and B. A. Harmon, NASA Marshall Space Center,
Huntsville, Alabama. Also, information contained in this work was developed during the
course of work under Contract No. DE-AC09-89SR18035 with the U.S. Department of
Energy.
294

REFERENCES
.
,
.
.
.
o
Q
.
.
G. J. Fishman, T. A. Parnell, and B. A. Harmon, "Long Duration Exposure Facility
(LDEF) Induced Radioactivity Plan", NASA Marshall Space Center, Huntsville, AL,
Astrophysics Division, Space Science Laboratory Report, Dec. 1989.
E. V. Benton and W. Heinrich, "Ionizing Radiation Exposure on LDEF", University of
San Francisco, San Francisco, CA, USF-TR-77, Aug. 1990.
T. W. Armstrong and B. L. Colborn, "Scoping Estimates of the LDEF Satellite Induced
Radioactivity", Science Applications International Corp., Prospect, TN,
SAIC-90/1462, Sep. 1990.
T. W. Armstrong and B. L. Colborn, "Radiation Calculations and Comparisons with
Data", First LDEF Post-Retrieval Symposium, Kissimmee, Florida (June 2-8, 1991),
NASA CP-3134, 1992.
W. G. Winn, W. W. Bowman, and A. L. Boni, "Ultra-Clean Underground Counting
Facility for Low-Level Environmental Samples", The Science of the Total Environment
Vol. 69, February 1988, pp. 107-144.
W. G. Winn, "Ultrasensitive Examination of Environmental Samples by SRL
Underground Counting Facility", Trans. Am. Nuc. Soc. Vol. 54, June 1987, pp. 34-35.
C. E. Moss and R. C. Reedy, "Measurements of Induced Radioactivity in Some LDEF
Samples", First LDEF Post-Retrieval Symposium, Kissimmee, Florida (June 2-8,
1991), NASA CP- 3134, 1992.
W. G. Winn, "Gamma-Ray Spectrometry of LDEF Samples", Westinghouse Savannah
River Company, Aiken, SC, WSRC-RD-91-16, Aug. 1991.
W. G. Winn and R. A. Sigg, "Pre-Operational Radio-Environmental Studies of Plant
Vogtle", Westinghouse Savannah River Company, Aiken, SC, WSRC-RD-89-161 May
1, 1989.
10. K. Debertin and R. G. Helmer, Gamma and X-ray Spectrometry with Semiconductor
Detectors, North-Holland, Elsevier Science Publishing Co., New York, 1988.
11. G. J. Fishman, B. A. Harmon, et al, "Observation of 7Be on the Surface of LDEF
Spacecraft", Nature, Vol 439, Feb. 1991, pp. 678-680.
295

Table 1. Trunnion Disk Results
Decay Correction Date - January 20, 1990
Sample
LHB
LHE
LHF
LHP
LHR
LHS
RHB
RHE
RHF
RHP
RHR
RHS
Be-7 Sc-46Isotopic Activities in pCi/kg Sample
Cr-51 Mn-54 C_56 C0--$7
4.31 - 120.21 4.58 15.17
___.59 ± 1.53 ± .75 ± .73
4.57 - 95.21 2.92 9.60
± .71 __+1.75 ± .77 + .66
3.37 - 100.50 4.84 10.47
± .51 ___1.41 ___.75 ___.63
Co-58
1.33
± 1.35
Co-60
1.96
± .18
1.59
± .30
1.40
± .19
0.95 3.53 16.38 79.43 2.65 7.48 4.90 1.58
__.3.29 ___.20 ___7.38 ± .68 --_.21 __-.28 ± .33 ±. 11
-7.48 3.78 34.35 76.71 2.66 7.23 4.68 1.52
±3.65 ±.21 ±8.43 ± .68 ±.23 ± .36 ±.35 ±.11
2.56 4.34 23.14 75.25 2.53 6.22 4.92 1.55
± 3.28 +__.19 ± 8.15 ± .59 +--.20 +_..25 ± .30 ± .09
4.67
± 1.27
2.35
± 1.27
5.04 - 82.52 3.21 7.34
± 1.00 ± 1.36 ± .79 ± .59
1.96 - 79.77 2.15 6.63
± .75 ± 1.57 ± .95 _.+.57
2.99 - 78.98 3.75 7.00
_.+.64 ± 1.34 ± .89 ± .59
2.45
± 1.26
1.39
± .25
1.16
± .22
1.32
± .20
5.36 3.46 35.22 72.56 2.67 7.28 4.39 1.45
+__3.53 ± .21 ±8.84 ±.66 ±.22 ±.30 ±.33 ± .11
8.75 3.48 26.16 72.75 2.41 6.20 4.29 1.55
__+3.07 ± .19 ___8.13 ± .60 ___.19 ± .24 ± .30 ± .09
4.32
± .41
2.67 3.94 31.89 74.66 2.73 6.01
± 3.74 ± .23 ± 10.08 ± .71 ___.25 ± .32
1.44
±.12
All errors are 1-o counting errors
296

Table 2. Metal Slab Sample Results
Decay Correction Date: January 20, 1990
Space Side Trunnion Layers
RHQ-$P- oCi/kgv
Mn-_4 Co-57
2 95.10 19.57
-t-3.44 23.17
3 83.24 14.78
+_ 2.77 __.1.88
4 77.62 11.98
_ 2.25 ± 1.72
5 70.89 12.18
__+1.44 _+_1.27
6 70.26 12.74
+ 1.63 + 1.43
Earth Side Trunnion Layers
RHG-ER- pCi/kg
Mn-54 Co-57
2 98.46 17.50
+_.3.60 ±2.51
3 93.62 15.02
± 2.04 ___1.69
4 87.82 17.48
± 2.36 ± 2.22
5 80.00 10.92± 1.47 _ 1.19
6 76.64 12.07
± 1.63 +__1.22
Vanadium
Sample
G12-A2-FNV
I-C9-V
I-F2-V
I-H12-VA
I-H12-VB
pCi/kgSc-46
16.00
± 1.32
Aluminum
Sample
ESR-1
ESR-5
KP-3
KP-10
pCi/kgNa-22
75.33
±2.60
All errors are 1-o counting errors
297
IO000
I000
o i0_
-- C:ountinn Infnrm_tir_n
Detector: 90% HPGe
1 --_- Disk File: BK042390 GE3 -t--_
Count Datesl 4t18/90-4t23/90
Count Time: 421,493 sec (487 days) -_
• i L _ ..... ____,_. I , , ,_____ _____._ _t __ ___.____J0 1000 2000 3000 4000
Channel Number
(a) Background
I0000
1000
_00
o
10
- _ i- _- -1
. , _- _ #-,_ _ _ _ <_
: Detector: 90% HPGe ...... "" ':+.""}_-'!:_+--.---__:--.7"-_'_--'._'-:----_/_.'-_l llllllli=l_
Disk File 1607NASALHS /1 .............
Count Dates 41t 3t90 - 4/16/90
Counl Time: 258060 sec (298 days}
0 lOGO 2000 3000 4000
Channel Number
(b) Sample LHS
Figure 1. Typical Gamma-Ray Spectra
298

h
0
Z
I___ a ---'lI
!ii!iiiiii iiiiii i!i ii iiiiiiii,.,.. ,G.,.,D ;.e. G iii!iii i ii iiii iiiiiiii ii
IIII
Point SourceLocation: •
Data: c(r,z)
Ip r
O)
(z)
(3)
DISK ANALYSIS
Exponential Average
_(r,h)- _(r,0)_(r) =
ln[c(r,h) / _(r,0)]
Radial Fittin_
c(r) = A- Br ?
Sample Average
c = A - [2/(2 + p)]Ba P
SLAB ANALYSIS
(5)
(2)
(3)
(4)
S.eparable r,z Model
_(r,z) = _(r,O) e -uz
Sample Average _(r,O)
< _(r,0) > A
Measure U/Average ¢ -uz
(1-e-Uh)/Uh
Sample Average
c = < c(r,0) > a (1-e-Uh)/Uh
Figure 2. HPGe Efficiency Calibration
299
150
]40
_30
120
100
90
_ ' 70
f,
5O
40
3O
2O
10
0
Space End LDEF End _ -_[
-_ _ -.b---+--
- Co-57 -
-- LH
- _-__..__..___.______ __- _ '
10 20 30 40 50
Axial Position (cm)
(a) LH and RH Samples B,E,F,P,R,S (plotted left-to-right)
<
]20
llO
I00
go
80
_Tjl Illl I I I I I f It I Illll[[_l I I_1 ItT|IIIIIIII[I _lllTIffrl I
70 _ /
6o
i-
5o
40 Space Side _ _ Earth Side
I20 Co-57,ol ............
0 _ LIJJ_.,WJ_J JJ* h i i Jt I i i I I i J ! t i ! * ! JI_-5 -4 -3 -2 -1 0 l 2 3 4 5
Radial Position (cm)
(b) RHG Samples
Figure 3. Results for Trunnion Samples
3OO