Gaming Spotlight, 2015 Review - s3. · PDF fileIDC U.S. Gamer Survey, 3Q15 (n = 5,687); App...
17
Gaming Spotlight, 2015 Review Released: March 2016
-
Upload
vuongxuyen -
Category
Documents
-
view
214 -
download
1
Transcript of Gaming Spotlight, 2015 Review - s3. · PDF fileIDC U.S. Gamer Survey, 3Q15 (n = 5,687); App...

Gaming Spotlight, 2015 ReviewReleased: March 2016
Agenda
1. 2015 Gaming Trends
2. US Gamer Breakdown
3. Key Themes & Takeaways
2
0
25
50
75
100
125
150
2013 2014 2015
Home Game Consoles
PC and Mac Gaming
Mobile Gaming
Handheld Game Consoles
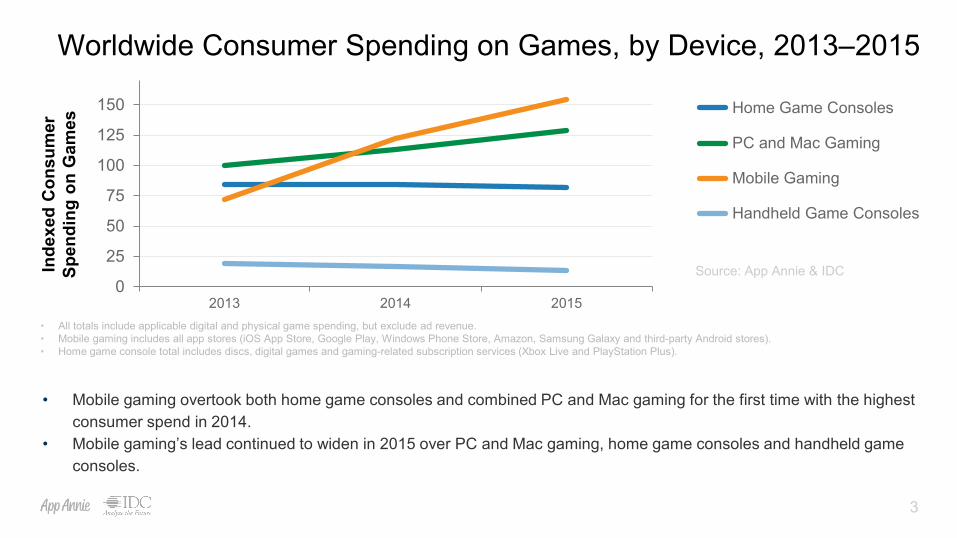
Worldwide Consumer Spending on Games, by Device, 2013–2015In
dexe
d C
onsu
mer
Sp
endi
ng o
n G
ames
Source: App Annie & IDC
3
• Mobile gaming overtook both home game consoles and combined PC and Mac gaming for the first time with the highest consumer spend in 2014.
• Mobile gaming’s lead continued to widen in 2015 over PC and Mac gaming, home game consoles and handheld game consoles.
• All totals include applicable digital and physical game spending, but exclude ad revenue.• Mobile gaming includes all app stores (iOS App Store, Google Play, Windows Phone Store, Amazon, Samsung Galaxy and third-party Android stores).• Home game console total includes discs, digital games and gaming-related subscription services (Xbox Live and PlayStation Plus).

Worldwide Share of iOS & Google Play Downloads& Consumer Spending Attributable to Games, 2014-2015
• Games are over 80% of total worldwide consumer spend for combined iOS App Store and Google Play despite a slight decline in their combined share of downloads, from about 40% to 38%, in 2015.
• Games made up a larger share of Google Play’s consumer spending compared to iOS. However, in terms of amount spent on games, consumers spent more on iOS than Google Play.
0%
25%
50%
75%
100%
iOS App Store Google Play0%
25%
50%
75%
100%
iOS App Store Google Play
2014
2015
Games: Share of App Store Downloads
Games: Share of App Store Consumer Spending
Source: App Annie
4
Source: App Annie

0%
25%
50%
75%
100%
2014 2015 2014 2015 2014 2015 2014 2015
North America
Western Europe
Asia-Pacific
Rest of World
Worldwide Consumer Spending Shares on Games, by Region, 2015
• Asia-Pacific gained in share of game spending for iOS App Store and Google Play combined due to iOS’ explosive growth in China and the healthy growth of all major APAC markets.
• Asia-Pacific also gained in share of consumer spending for both handheld games and PC and Mac gaming.• Home consoles didn’t see much growth in Asia-Pacific despite the 14 year ban on consoles in China being
lifted in 2015. Western Europe showed growth in home game console spending in 2015.5
Source: App Annie & IDC
Combined iOS App Store and Google Play
Handheld Game Consoles
Home Game ConsolesPC and Mac Gaming
+3.4 pts +3.4 pts+1.6 pts+2.5 pts

Top 5 Worldwide Grossing Portable Games, by Platform, 2015
Source: App Annie & IDC
6
Rank iOS App Store Google Play Handheld Game Consoles
1 Clash of ClansSupercell, Finland
Monster StrikeMixi, Japan
Animal Crossing: Happy Home DesignerN3DS; Nintendo, Japan
2 Monster StrikeMixi, Japan
Clash of ClansSupercell, Finland
Monster Hunter XN3DS; Capcom, Japan
3 Game of War – Fire AgeMachine Zone, United States
Puzzle & DragonsGungHo Online, Japan
The Legend of Zelda: Majora's Mask 3D N3DS; Nintendo, Japan
4 Puzzle & DragonsGungHo Online, Japan
Game of War – Fire AgeMachine Zone, United States
Yo-Kai Watch Busters: Red Cat Team / White Dog Squad
N3DS; Level-5, Japan
5 Fantasy Westward JourneyNetEase, China
Garena Online, Singapore
Candy Crush SagaKing, United Kingdom
Pokémon Omega Ruby / Alpha Sapphire N3DS; Game Freak/Nintendo, Japan
= New entrant to the top 5 in 2015

0
100
200
300
400
500
Mobile Gaming Handheld Game Consoles Home Game ConsolesPC and Mac Gaming
Worldwide Game Spending Per Gaming Device, 2015
• Home game consoles far and away led other gaming mediums in consumer spend per device.• Mobile gaming saw the smallest consumer spending per device, but had the largest gaming base, reaching
not only core gamers but also a significant amount of casual gamers who may not otherwise play games.
Inde
xed
Con
sum
er S
pend
ing
on G
ames
per
Dev
ice
Source: App Annie & IDC
7
• Spending refers to game software and directly related service spending only.• Hardware revenue and in-game ad revenue are excluded. Only devices used for gaming are included.

Key Themes & Takeaways: Gaming Trends• Mobile gaming overtook both home game consoles and combined PC and Mac gaming in consumer spend
for the first time in 2014; the gap widened in 2015 and shows no signs of slowing.
• Games continued to have the majority share of worldwide consumer spending on both Google Play and the iOS App Store, with each store seeing incremental year-over-year gains in gaming-related share of consumer spending.
• Home game console spending was disproportionately high in North America and Western Europe. Mobile game and PC and Mac game spending was centered in Asia-Pacific and shifted further in that direction in 2015. Asia-Pacific in particular saw explosive growth in share of consumer spending on the iOS App Store.
• The top revenue-generating titles on mobile were actually more stable year-over-year than those on handheld game consoles (partly due to handheld games being sold in physical packaging).
• Home and handheld game consoles declined marginally in consumer spend from 2013 to 2015.
• Home game consoles saw the highest consumer spend per device in 2015 at nearly 5x that of mobile games. However, given their broad appeal, mobile games have a much larger user base and therefore monetize higher overall.
8

Agenda
1. 2015 Gaming Trends
2. US Gamer Breakdown
3. Key Themes & Takeaways
9

0%
25%
50%
75%
100%
Female
Male
US Gaming Device Demographics, by Gender, 3Q 2015
• Males and females were represented evenly among US iPhone and Android Phone gamers and combined PC and Mac gamers.
• US home console gamers skewed male (approximately 59%) in 3Q 2015.• Handheld game consoles in the US skewed the strongest female (approximately 53%) in 3Q 2015.
10
Handheld Game Consoles
Home Game Consoles
PC and Mac Gaming
iPhone and Android Phone
Sources: IDC U.S. Gamer Survey, 3Q15 (n = 5,687); App Annie Intelligence, July 2015–September 2015.

0%
25%
50%
75%
100%
45+
25-44
13-24
US Gaming Device Demographics, by Age, 3Q 2015
• PC and Mac gaming skewed older than other US gaming devices in 3Q15 with about 59% aged 45+.• Handheld game consoles had the largest share of young American gamers at 36%+ under 24 years old
in 3Q 2015.• US mobile gamers were strongest in the 25–44-year-old bracket at about 40%.
11
Handheld Game Consoles
Home Game Consoles
PC and Mac Gaming
iPhone and Android Phone
Sources: IDC U.S. Gamer Survey, 3Q15 (n = 5,687); App Annie Intelligence, July 2015–September 2015.

0
2
4
6
8
10
12
US Gaming Device Demographics, by Hours of Gameplay Per Person, 3Q 2015
• US Android Phone gamers played less than 3 hours per week on average in 3Q 2015. • This mobile gaming community is larger and includes a significantly higher share of casual gamers.
• 41% of PC and Mac gamers played less than 5 hours per week versus 22% on consoles.• 14% of PC and Mac gamers played greater than 20 hours per week versus 8% on consoles.
12
Handheld Game Consoles Home Game ConsolesPC and Mac GamingAndroid Phone
Hou
rs P
er W
eek
Sources: IDC U.S. Gamer Survey, 3Q15 (n = 5,687); App Annie Intelligence, July 2015–September 2015.

Key Themes & Takeaways: US Gamers
• There was practically an even gender split within both the mobile gaming (Android Phone and iPhone gamers) and PC and Mac gaming communities in the US in 3Q 2015. Related games represent a great opportunity for marketers to reach both male and female customers.
• In 3Q 2015, PC and Mac gamers skewed toward those aged 45+, handheld and console gamers skewed towards those aged 13–24, and mobile was more evenly distributed with the largest age bracket being 25–44.
• Android phones trailed significantly behind the other gaming platforms in typical hours of gameplay per week. (Such gamers spent less than one-third the time of those on home game consoles, handheld consoles and combined PC and Mac.)
• Appealing to a broader user base, which includes non-traditional and casual gamers, US Android Phone gamers played less time per person per week. Gamers on other devices had much higher weekly gameplay hours per person.
13

Agenda
1. 2015 Gaming Trends
2. US Gamer Breakdown
3. Key Themes & Takeaways
14

Key Themes & Takeaways: Wrap-Up• Mobile gaming surpassed both home game console and PC and Mac gaming to become the top global
platform by consumer spending in 2014, furthering this lead over other gaming devices in 2015.
• Mobile gaming grew to over 40% of total consumer spend on games last year, up from about 35% in 2014.
• More than 80% of combined iOS and Google Play consumer app spending in 2015 was derived from games, which enjoyed significant spending growth.
• On iOS, this share topped 75% in the second half of 2015.
• The Asia-Pacific region saw the greatest growth in share of game consumer spending worldwide on iOS and Google Play app stores, handheld gaming, and combined PC and Mac gaming, a testament to the cultural gaming tradition of many countries in the region as well as the ongoing expansion of China as an increasingly large and viable market for game monetization.
• Home console gaming saw more than double the consumer spend per device than any other gaming platform. Mobile gaming saw the lowest consumer spend per device, but had the largest audience, giving it the highest overall consumer spend in 2015.
15

Key Themes & Takeaways: Wrap-Up (Cont.)
• In the US, there is a significant opportunity across all platforms to attract male and female gamers.
• Console gamers skewed decidedly male. Android Phone and iPhone along with PC and Mac gaming represented near-even gender divides for gamers.
• Across handheld, PC and Mac and home console games, users spend roughly the same amount of time per week playing games on average.
• PC and Mac gamers have much more variance in the amount of typical gameplay per week compared to home console gamers, with almost double the size of the user base at both extremes (less than 5 hours per week and greater than 20 hours per week).
• Hours of gameplay per user per week on Android phones was significantly lower than other gaming platforms, a result of the wide appeal and broadened user base from casual gamers.
16Report methodology and updates are available here.

Questions?
@AppAnnie
@lewisAWard
17