Gaming Innovation Group Q3 2019 · Innovation Group and shareholder value creation. The underlying...
36
Gaming Innovation Group 6 November 2019 iGaming solutions based on innovative technology Q3 2019
Transcript of Gaming Innovation Group Q3 2019 · Innovation Group and shareholder value creation. The underlying...

Gaming Innovation Group
6 November 2019
iGaming solutions based on innovative
technology
Q3 2019
Highlightspage 3
letter from the chairmanpage 5
Summary and outlookpage 6
operational reviewpage 9
financial reviewpage 15
contents
consolidated financial statEmentspage 20
GiG overviewpage 31
sustainabilitypage 19
Q 3 2 0 1 9 I n te r i m Re p o r t G a m i n g I n n o vat i o n G r o u p · 2
Financial Highlights
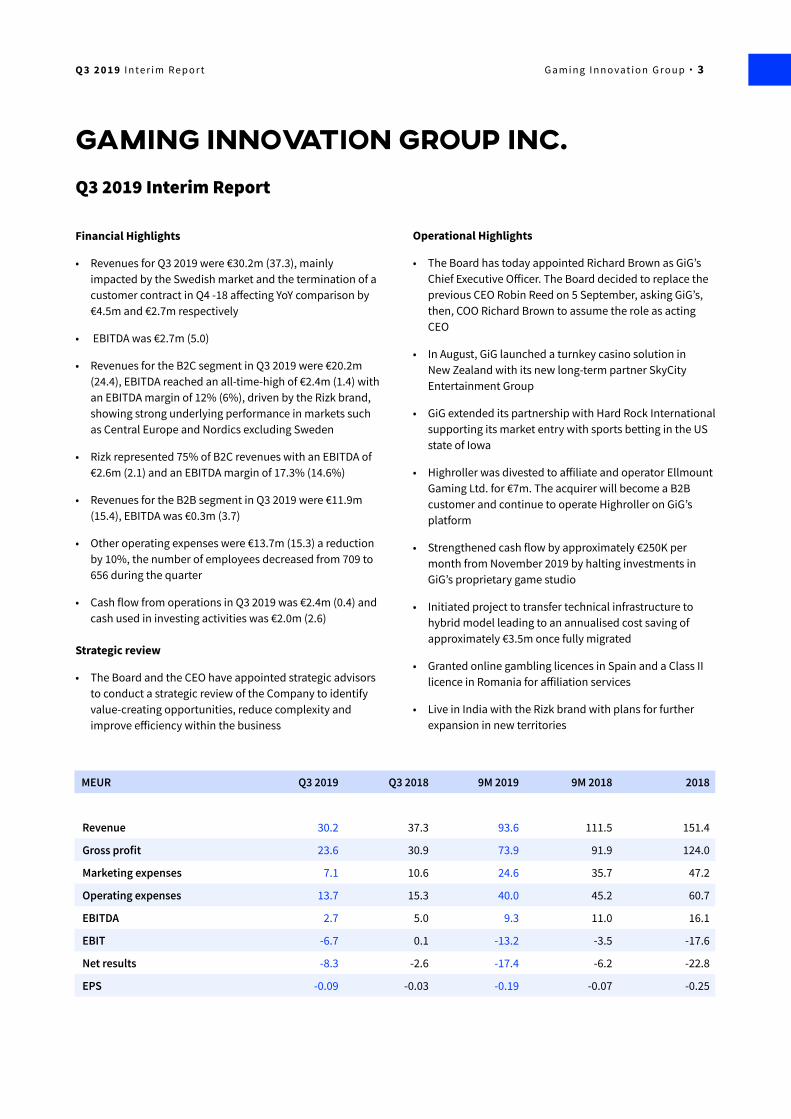
• Revenues for Q3 2019 were €30.2m (37.3), mainly impacted by the Swedish market and the termination of a customer contract in Q4 -18 affecting YoY comparison by €4.5m and €2.7m respectively
• EBITDA was €2.7m (5.0)
• Revenues for the B2C segment in Q3 2019 were €20.2m (24.4), EBITDA reached an all-time-high of €2.4m (1.4) with an EBITDA margin of 12% (6%), driven by the Rizk brand, showing strong underlying performance in markets such as Central Europe and Nordics excluding Sweden
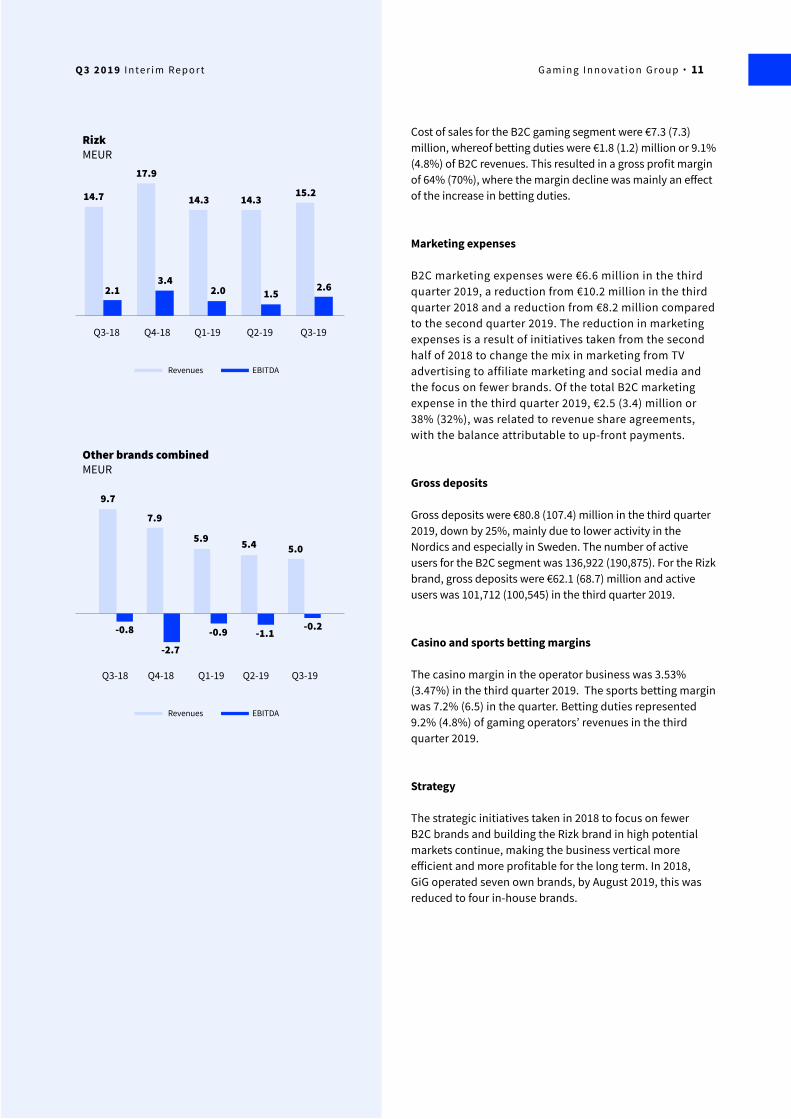
• Rizk represented 75% of B2C revenues with an EBITDA of €2.6m (2.1) and an EBITDA margin of 17.3% (14.6%)
• Revenues for the B2B segment in Q3 2019 were €11.9m (15.4), EBITDA was €0.3m (3.7)
• Other operating expenses were €13.7m (15.3) a reduction by 10%, the number of employees decreased from 709 to 656 during the quarter
• Cash flow from operations in Q3 2019 was €2.4m (0.4) and cash used in investing activities was €2.0m (2.6)
Strategic review
• The Board and the CEO have appointed strategic advisors to conduct a strategic review of the Company to identify value-creating opportunities, reduce complexity and improve efficiency within the business
gaming innovation group inc.Q3 2019 Interim Report
MEUR Q3 2019 Q3 2018 9M 2019 9M 2018 2018
Revenue 30.2 37.3 93.6 111.5 151.4
Gross profit 23.6 30.9 73.9 91.9 124.0
Marketing expenses 7.1 10.6 24.6 35.7 47.2
Operating expenses 13.7 15.3 40.0 45.2 60.7
EBITDA 2.7 5.0 9.3 11.0 16.1
EBIT -6.7 0.1 -13.2 -3.5 -17.6
Net results -8.3 -2.6 -17.4 -6.2 -22.8
EPS -0.09 -0.03 -0.19 -0.07 -0.25
Operational Highlights
• The Board has today appointed Richard Brown as GiG’s Chief Executive Officer. The Board decided to replace the previous CEO Robin Reed on 5 September, asking GiG’s, then, COO Richard Brown to assume the role as acting CEO
• In August, GiG launched a turnkey casino solution in New Zealand with its new long-term partner SkyCity Entertainment Group
• GiG extended its partnership with Hard Rock International supporting its market entry with sports betting in the US state of Iowa
• Highroller was divested to affiliate and operator Ellmount Gaming Ltd. for €7m. The acquirer will become a B2B customer and continue to operate Highroller on GiG’s platform
• Strengthened cash flow by approximately €250K per month from November 2019 by halting investments in GiG’s proprietary game studio
• Initiated project to transfer technical infrastructure to hybrid model leading to an annualised cost saving of approximately €3.5m once fully migrated
• Granted online gambling licences in Spain and a Class II licence in Romania for affiliation services
• Live in India with the Rizk brand with plans for further expansion in new territories
Q 3 2 0 1 9 I n te r i m Re p o r t G a m i n g I n n o vat i o n G r o u p · 3
Events after Q3
GiG acquired 75% of the shares of Croatian company Top Games, expanding GiG’s B2C online gaming offering in a growing regulated market with the remaining 25% retained by the local partner. The payment for this acquisition is based on a contribution of resources by the parties with no cash being paid. Online operations are expected to start in the first half of 2020.
Outlook and guidance
The Company is expecting both revenue growth and improved bottom line in Q4 2019 and H1 2020. This will be supported by the focus on cost control, execution and global expansion, with cost savings estimated in excess of €8m in the next two years. Media is expected to show a similar performance in Q4 2019 as in Q3 2019 and to return to its robust performance from H1 2020.
The Board and the CEO have appointed strategic advisors to conduct a strategic review of the Company to identify value-creating opportunities, reduce complexity and improve efficiency within the business. The outcome of the review will work as a base for strategic planning and the future roadmap for the Company. Bond advisors ABG Sundal Collier and Pareto Securities are also appointed to facilitate the refinancing of the bond.
Q 3 2 0 1 9 I n te r i m Re p o r t G a m i n g I n n o vat i o n G r o u p · 4

Letter from THECHAIRMANPetter Nylander“I am confident that we are making the necessary strategic adjustments to ensure the full potential of Gaming Innovation Group and shareholder value creation."
Dear Shareholders,
For a while now the gaming industry has been in a bit of a storm, going through a period of structural change, not a structural decline. With increased regulation and taxation putting pressure on margins, it is time to adapt to the new reality in order to steer out of the epicentre.
Because it is important to remember that a storm will end. And with the exciting trends in Germany, Latin America, New Zealand and other jurisdictions which are looking to regulate in the upcoming years, we believe this will present growth and business opportunities for Gaming Innovation Group. Short term it might seem a bit cloudy, however the global potential in our industry is still substantial, and GiG is well-positioned for the future.
However, we need to become clearer on what we are doing and how. And we need to deliver on what we are saying.
Sweden is still hurting us on all levels and is a major reason for our overall decline in Group revenue going from €37.3 to 30.2 million. Like many of our peers, we were hit by the Swedish regulation in every vertical and we have re-allocated marketing spend to more lucrative markets. Despite this, our B2C business impressively reached an all-time-high EBITDA of €2.4 million, mainly driven by the Rizk brand, which represents 75% with B2C revenues of €20.2 million. It is still very early days, and in the long run, we are confident that the market will settle, and operators will be able to drive business without fearing the risk of being fined at current levels and frequency.
We have already proven our strength in forming joint ventures with major land-based operators with strong brands such as Hard Rock International in the US and SkyCity Entertainment Group in New Zealand, accelerating their transition from offline to online. Growing together with our partners is the long-term goal for the Group. Having established our model, we are now stepping up investments in sales resources to expand our pipeline of long-term partners with our turnkey and fully managed online solutions in strategic markets.
In order to achieve that, we need to shape the Company to fit market demands. This is done by reducing the complexity of the business, this quarter by divesting our B2C brand Highroller and closing our proprietary game studio, and by improving our efficiency with a strong focus on execution and securing ROI in everything we do.
The process has already started.
Strategic initiatives for cost savings and to focus on fewer and stronger B2C brands started in the beginning of 2018. We are soon to launch our second generation data platform, which we believe will be an industry leader in one of the most crucial aspects of iGaming platform services. In addition, through the coming six months we will also be migrating to a new hybrid infrastructure model, which will lead to annualised cost savings of €3.5 million vs the current run rate once system migration is complete. Benefits from cost savings will have a positive effect from Q4 2019.
In Q3, we also took a several steps to prepare the organisation for the future. This meant that the operational cost reduced from €15.3 to 13.7 million, mainly due to the reduction in the number of staff. Naturally, it is never an easy thing to say goodbye to colleagues who might have been with the Company for several years, but in order to ensure an effective organisation, we in the Board believe that it was necessary in order to secure the Company for a future of sustainable and profitable growth.
Another colleague who has left in the last quarter was the co-founder and former CEO Robin Reed. I would like to take the opportunity to express my gratitude and admiration to Robin, his hard work and determination to make his vision a reality.
However, the company now enters the next phase of its development with different challenges and opportunities and the Board reached the conclusion that GiG therefore also needed a different leadership. We have a skilled management team in place, I and the Board have full confidence in the Chief Operating Officer, Richard Brown, who will be the CEO of GiG from today.
Richard has a proven track record and the Board is certain that he is the best person to drive the necessary changes and provide leadership as the company now enters the next phase.
I am confident that we are making the necessary strategic adjustments to ensure the full potential of Gaming Innovation Group and shareholder value creation. The underlying drivers are there and together with the rest of the Board, the management, and not to forget our employees, we are looking forward to drive and deliver future success.
Q 3 2 0 1 9 I n te r i m Re p o r t G a m i n g I n n o vat i o n G r o u p · 5
Summary and OutlookFinancial highlights
Consolidated revenues in Gaming Innovation Group Inc. (GiG), representing income deriving from revenue share and other fee-based agreements from the B2B operations and Net Gaming Revenue (NGR) from the B2C operation, were €30.2 (37.3) million in the third quarter 2019. The 19% decline is a result of lower revenues in the B2C segment impacted by the Swedish market, and the termination of a B2B customer contract in Q4 -18 affecting YoY comparison by €4.5m and €2.7m respectively. In-house brand Rizk represented 75% of total B2C revenues with a year-on-year growth of 2%.
Gross profit for the Group was €23.6 (30.9) million in the third quarter 2019, a decline of 24%. Gross profit margin for the third quarter 2019 came in at 78% (83%). The lower gross margin is largely a result of increased betting duties.
Marketing expenses were €7.1 (10.6) million in the third quarter 2019, a reduction of 33% supported by seasonal, lower marketing levels plus a change in marketing channels to reduce above the line marketing and use more efficient marketing channels. Marketing expenses were 20% lower quarter-on-quarter and represented 24% (29%) of total revenues in the third quarter 2019.
Other operating expenses amounted to €13.7 (15.3) million in the third quarter 2019, a reduction of 10.5%. The reduction in operating expenses is a result of initiatives on both cost control and operational efficiency taken in
2018 together with a reduction in the average number of employees from 734 in the third quarter 2018 to 656 in the third quarter 2019. Continued investments into the development of new technology resulted in capitalised salaries of €1.7 (1.5) million.
EBITDA was €2.7 (5.0) million. The Media services vertical is the largest profit generator in the Group with an EBITDA of €4.2 (4.3) million in the third quarter 2019, corresponding to an EBITDA margin of 52% (51%).
Depreciation and amortisation amounted to €6.6 (5.0) million in the third quarter 2019, whereof €2.4 (2.4) million relates to amortisation of intangible assets from affiliate acquisitions completed in 2015 - 2017. GiG is amortising acquired affiliate assets conservatively over three years for customer contracts and eight years for domains/SEO which is at a faster pace than industry peers. €2.3 (1.7) million relates to capitalised investments in software development and IT infrastructure technology. Depreciation was €1.0 (0.4) million.
The discontinuation of the Company’s game studio resulted in an impairment of €2.5 million in the third quarter 2019. In addition, an investment in a start-up company was impaired by €0.4 million.
Net other income was €-1.5 (-2.6) million in the third quarter 2019 and included €1.5 (1.2) million in interest expense, and a net gain of €0.7 million related to the bond due to the change in the SEK/€ exchange rate in the quarter.
The net result in the third quarter 2019 was €-8.4 (-2.6) million. EPS in the third quarter 2019 was €-0.09 (-0.03).
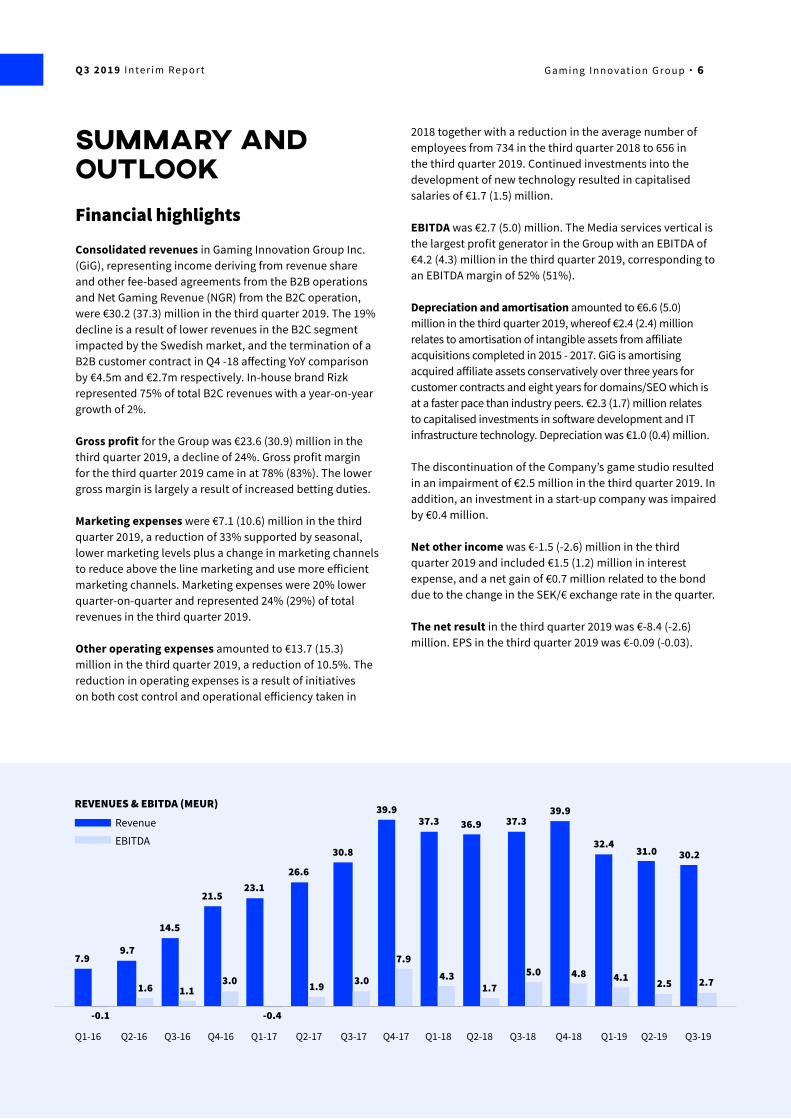
REVENUES & EBITDA (MEUR)
Revenue
7.9
Q2-18
9.7
Q2-16
14.5
Q3-16
21.523.1
26.6
Q4-16 Q1-17 Q2-17 Q3-17 Q4-17 Q1-18
30.8
39.937.3
Q1-16
36.9 37.3
Q3-18
39.9
-0.1
1.6 1.13.0
-0.4
1.9 3.0
7.94.3
1.75.0 4.8
Q4-18
EBITDA 32.4
4.1
Q1-19
31.0
2.5
Q2-19
2.7
30.2
Q3-19
Q 3 2 0 1 9 I n te r i m Re p o r t G a m i n g I n n o vat i o n G r o u p · 6
Operational highlights
People Changes
Change of Chief Executive Officer
The Board has today elected Richard Brown as GiG’s Chief Executive Officer. During the evaluation process from 5 September, Mr Brown has shown an impressive momentum and strong focus on execution by increasing efficiency and further reducing costs.
The Board decided to replace the previous CEO Robin Reed on 5 September, asking GiG’s, then, COO Richard Brown to assume the role as acting CEO.
Additional management appointment
At the beginning of Q3 2019, Chris Armes was appointed Chief Information Officer, responsible for developing the Company’s technology strategy.
Group
A toughened regulatory environment is being mitigated by strong focus on execution, reduced complexity and cost control. This strategy is teamed with expansion into high potential markets which are expected to regulate in the mid to long term.
Examples of this strategy in the third quarter was the expansion of GiG’s B2B services into New Zealand during the quarter and the closure of GiG Games to reduce cost and complexity.
GiG was granted two licences for online gambling in Spain and a Class II licence in Romania for affiliate marketing.
On 1 July, GiG’s subsidiary Zecure Gaming Ltd, which operates its in-house brands in Sweden received a penalty from the Swedish Gambling Authority. GiG has appealed the sanction and took a voluntary step by temporarily closing its own brands for sports betting in Sweden until clarification from the regulator is given. This action will have marginal impact on the Company’s revenue.
B2C
GiG continued the execution of its strategic initiatives taken in 2018 to drive increased profitability in its B2C operator business by focusing on fewer and stronger brands, focusing on growing the Rizk brand in a few select markets,
including new high-potential territories. For example, in June, Rizk.com was launched in India and throughout Q4 GiG is expecting revenues to onset as operations are settling.
To improve the profitability and performance in the B2C vertical and to put the focus on fewer brands, GiG has divested its brand Highroller to affiliate and operator Ellmount Gaming Ltd. The total purchase price of €7 million is paid over a period of 48 months. The acquirer will become a B2B customer of GiG and continue to operate Highroller using GiG’s Platform Services, Front End solution and Managed Services. The adverse impact on Gaming Operators’ revenues is approximately €3.0m per year and GiG expects positive contribution to its B2B segment from Highroller under the new owner.
B2B
New customer signings
In August, GiG launched a turnkey casino solution with its new long-term partner SkyCity Entertainment Group in New Zealand. GiG is supporting SkyCity’s growth with a fully managed gaming solution including a licence, the technical platform, fully managed services, front end development and marketing.
GiG extended its partnership with Hard Rock International further by supporting its market entry with sports betting in the US state of Iowa. The sportsbook will initially launch with an over-the-counter solution on the casino floor at the Hard Rock Hotel & Casino Sioux City in Iowa. The launch of online and mobile sports betting in Iowa is expected in Q4 2019. For GiG, this means the Company will be able to leverage its platform in the US, adding more scale to its network and revenues to the business.
GiG Games
In September, GiG took a strategic decision to halt investments in building its proprietary game studio ‘GiG Games’. The rationale behind this decision is to reduce OPEX, to reduce complexity and to concentrate focus on key strategic areas, developing the technology and product to enable the full business potential as ‘The global partner and operator for strong brands in iGaming’. This action leads to cash savings building to approximately €250,000 per month once the full effect is realised. Revenues generated from the proprietary games’ division have been negligible. The 25 people employed by GiG Games received termination packages in September.
GiG started its game studio at the end of 2017, launching its first in-house developed casino game in October 2018.
Q 3 2 0 1 9 I n te r i m Re p o r t G a m i n g I n n o vat i o n G r o u p · 7
GiG’s games IP allows the Company to re-enter the casino games vertical at a later stage should proprietary content be considered strategically more important. GiG will continue to offer a large portfolio of casino games to internal and external operators from third party providers as part of the Platform Services.
Initiatives taken for cost savings and reduction of OPEX
GiG has during 2019 implemented cost savings initiatives and focus on reducing OPEX, these actions will continue. During Q3 the lower number of employees lead to further decline in OPEX. The focus going forward will be on capital allocation, reduced complexity and value creation.
These initiatives were intensified during Q3 with a new data platform to improve efficiency and speed and to start moving infrastructure from a primarily cloud-based model to a hybrid model with greater emphasis on on-premises. This step will generate significant cost savings from 2020, with full effect from 2021, with yearly cost savings of approximately €3.5 million. Discontinuation of non-core business areas such as Games will lead to cost savings of €250,000 per month.
Investments into product continued in order to: drive down the cost/revenue delta; increase integration capacity; reduce time to market for new features, new markets and customer launches.
US Media strategy
GiG’s approach for its media services to the US involves building powerful domains through which the Company is able to target all regulated states and those which are yet to become regulated. As part of this strategy, in September GiG launched a redesign of its sports betting affiliate product WSN.com. Traffic to the website has been steadily growing, both from the US as a whole and from regulated states, such as New Jersey and Pennsylvania. At the same time, GiG is positioning its flagship casino affiliate portal CasinoTopsOnline.com to become the leading source of information for licensed US casinos. By developing and growing these assets from the portfolio, GiG is confident its media services will assume a leadership position in the US gambling affiliation market. However, it is a long term strategy to grow organically nationwide and it is expected to take time until the financial impact will be realised.
Events after Q3
GiG is entering the regulated Croatian market
GiG signed a share purchase agreement with the Croatian company Top Games d.o.o. (Top Games), a company which qualifies for a remote ambling permit. The agreement provides market access to GiG’s largest in-house brand, based on a collaborative partnership model where GiG will be able to expand its B2C online gaming offering in a growing regulated market with launch expected in the first half of 2020.
GiG will through this partnership grow its B2C business in a regulated market with the competition of currently five other operators. Only operators with a land-based licence are allowed to offer online casino in Croatia. The regulator will further control market participants by introducing IP blocking for operators without a licence.
GiG will acquire 75% of Top Games with the remaining 25% retained by the local partner. The payment for this acquisition is solely based on a profit-sharing agreement, no cash transaction will take place. The local partner will upfront the initial set-up costs and will cover licence fees, initial marketing expenditure and other operating expenses, whereas GiG will provide rights of use of brand, a gambling platform and operational expertise.
Outlook and guidance
The Company is expecting both revenue growth and improved bottom line in Q4 2019 and H1 2020. This will be supported by the focus on cost control, execution and global expansion, with cost savings estimated in excess of €8m in the next two years. Media is expected to show a similar performance in Q4 2019 as in Q3 2019 and to return to its robust performance from H1 2020.
The Board and the CEO have started a strategic review of the Company to identify value-creating opportunities, reduce complexity and improve efficiency within the business to create both short and long term shareholder value. The outcome of the review will work as a base for strategic planning and the future roadmap for the Company. The review is expected to: lead to direct financial benefits; focus on growth opportunities, further align internal stakeholders with the strategic direction of the business, all driving an improved performance in a flexible and sustainable organisation.
Q 3 2 0 1 9 I n te r i m Re p o r t G a m i n g I n n o vat i o n G r o u p · 8
To facilitate the refinancing of the 2017 bond which matures in March 2020, the Company has appointed ABG Sundal Collier and Pareto Securities as its advisors.
Target markets
GiG’s expansion strategy for the Group is to primarily focus on regulated and soon-to-be regulated markets, both with its media business and in partnership with strategic operators to grow long term. To support further growth, investments are being made to also pursue expansion in markets with high potential such as Spain, Latin America, Canada and certain Asian markets throughout 2019 and 2020.
GiG’s targets for B2B customers are operators with a strong position in single or multiple local markets as evidenced through brick and mortar locations, brand equity or marketing strength. GiG is unique and well positioned in that it can supply such customers with the turnkey platform, operational experience and support to drive online gambling revenues for the operators. GiG is also targeting a wider range of customers with modular services.
Q 3 2 0 1 9 I n te r i m Re p o r t G a m i n g I n n o vat i o n G r o u p · 9
operational reviewB2C Gaming Operators
The B2C segment included in Q3 2019 GiG’s in-house gaming operators; Rizk.com, Guts.com (and gutsXpress.com), Kaboo.com, Thrills.com and Highroller.com until mid-August.
Revenues and EBITDA
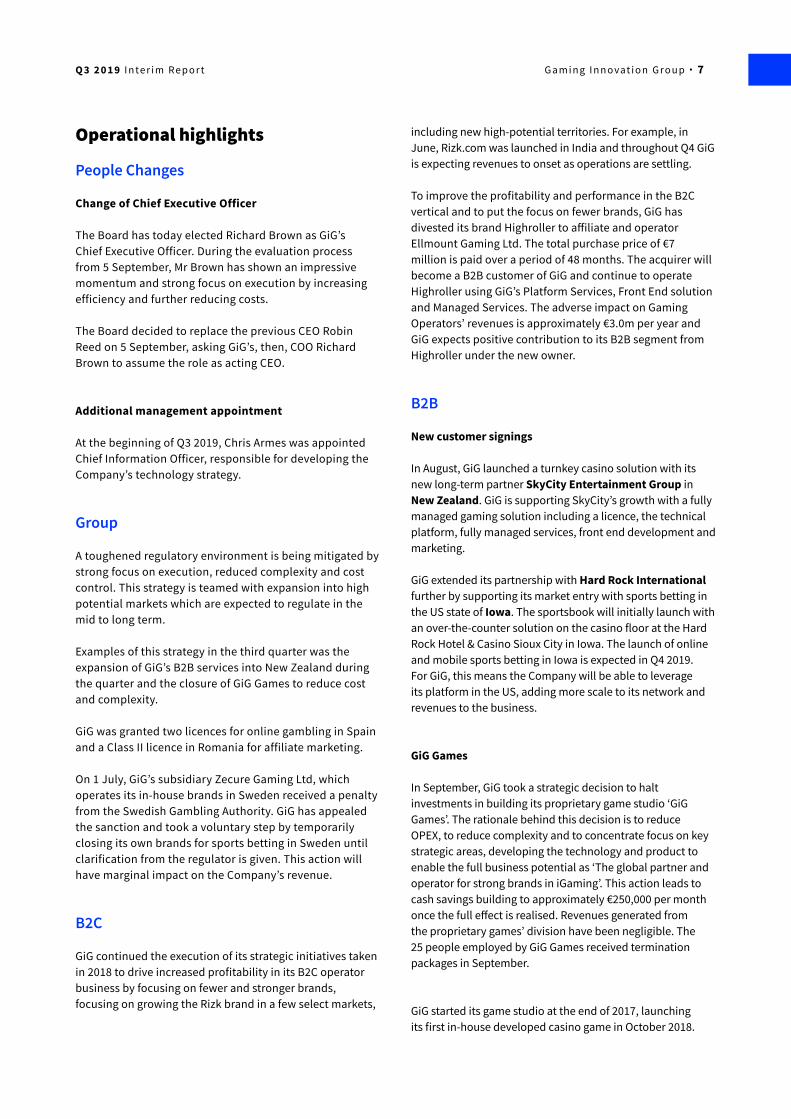
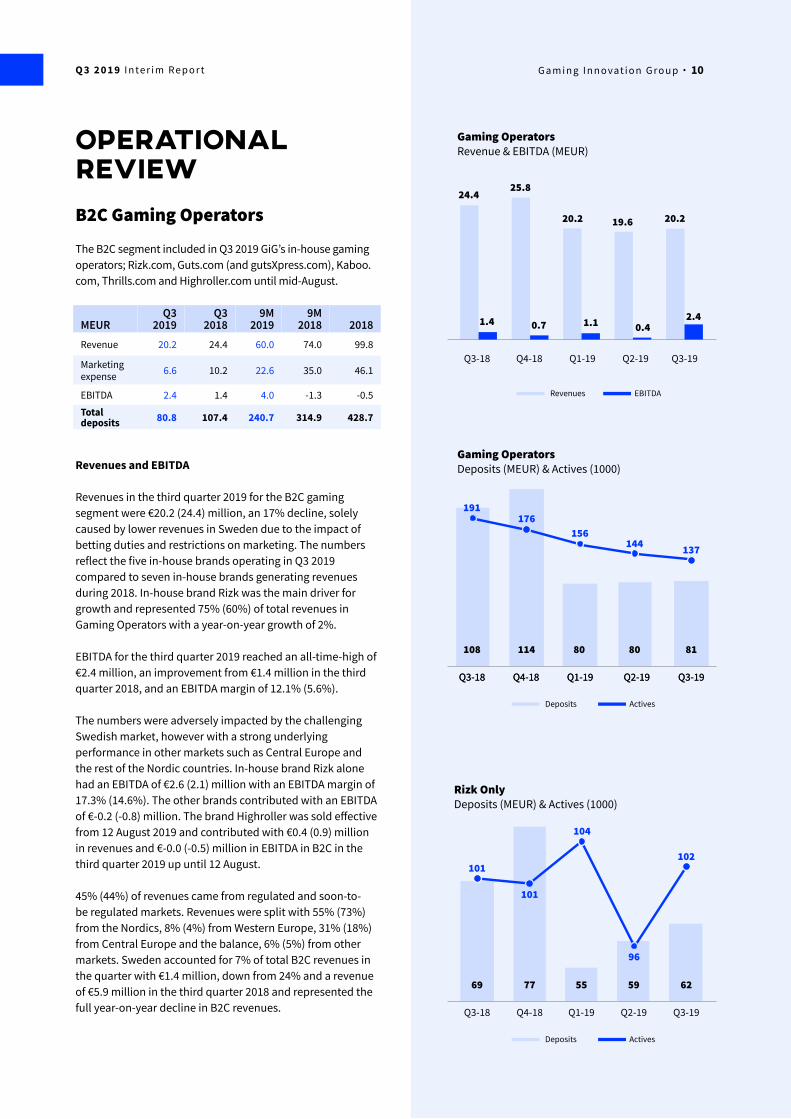
Revenues in the third quarter 2019 for the B2C gaming segment were €20.2 (24.4) million, an 17% decline, solely caused by lower revenues in Sweden due to the impact of betting duties and restrictions on marketing. The numbers reflect the five in-house brands operating in Q3 2019 compared to seven in-house brands generating revenues during 2018. In-house brand Rizk was the main driver for growth and represented 75% (60%) of total revenues in Gaming Operators with a year-on-year growth of 2%.
EBITDA for the third quarter 2019 reached an all-time-high of €2.4 million, an improvement from €1.4 million in the third quarter 2018, and an EBITDA margin of 12.1% (5.6%).
The numbers were adversely impacted by the challenging Swedish market, however with a strong underlying performance in other markets such as Central Europe and the rest of the Nordic countries. In-house brand Rizk alone had an EBITDA of €2.6 (2.1) million with an EBITDA margin of 17.3% (14.6%). The other brands contributed with an EBITDA of €-0.2 (-0.8) million. The brand Highroller was sold effective from 12 August 2019 and contributed with €0.4 (0.9) million in revenues and €-0.0 (-0.5) million in EBITDA in B2C in the third quarter 2019 up until 12 August.
45% (44%) of revenues came from regulated and soon-to-be regulated markets. Revenues were split with 55% (73%) from the Nordics, 8% (4%) from Western Europe, 31% (18%) from Central Europe and the balance, 6% (5%) from other markets. Sweden accounted for 7% of total B2C revenues in the quarter with €1.4 million, down from 24% and a revenue of €5.9 million in the third quarter 2018 and represented the full year-on-year decline in B2C revenues.
MEUR Q3
2019Q3
20189M
20199M
2018 2018Revenue 20.2 24.4 60.0 74.0 99.8
Marketing expense 6.6 10.2 22.6 35.0 46.1
EBITDA 2.4 1.4 4.0 -1.3 -0.5
Total deposits 80.8 107.4 240.7 314.9 428.7
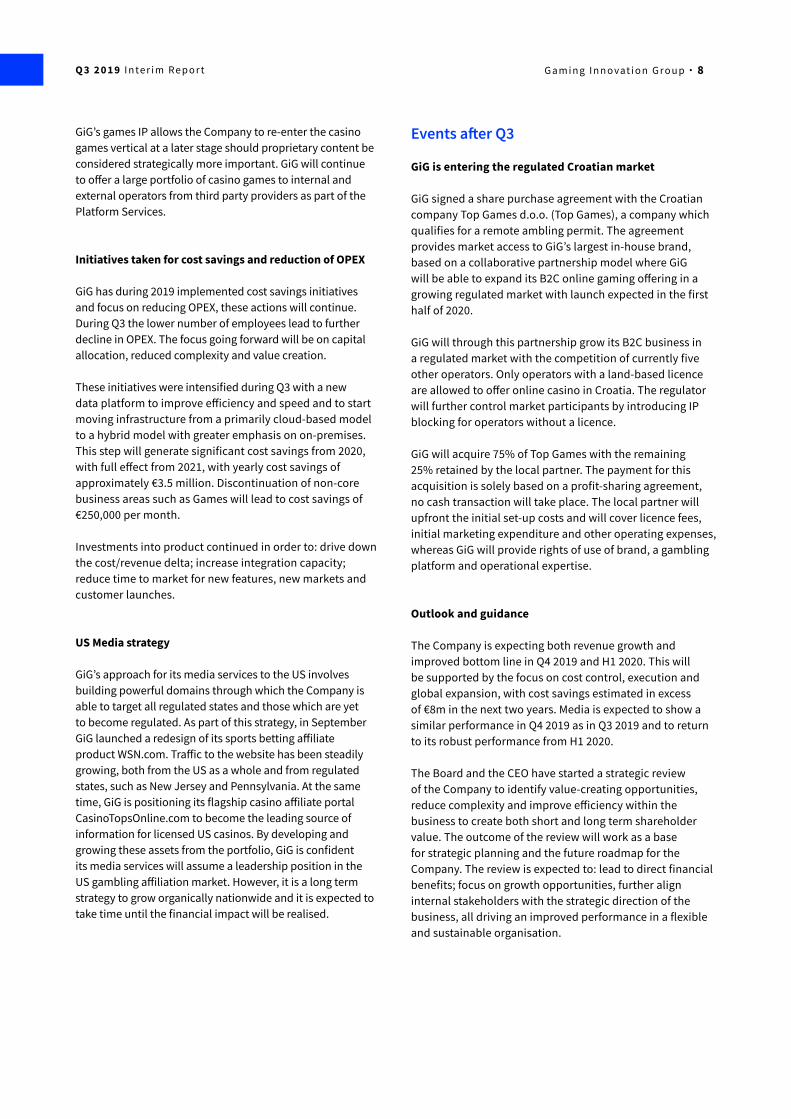
Q2-19 Q3-19Q3-18 Q4-18 Q1-19
108 114 80 80 81
191176
156144
Gaming OperatorsDeposits (MEUR) & Actives (1000)
Q2-19 Q3-19Q3-18 Q4-18 Q1-19
Revenues EBITDA
24.425.8
20.2 19.6 20.2
0.71.4 1.1 0.42.4
Gaming OperatorsRevenue & EBITDA (MEUR)
Deposits Actives
137
Q2-19 Q3-19Q3-18 Q4-18 Q1-19
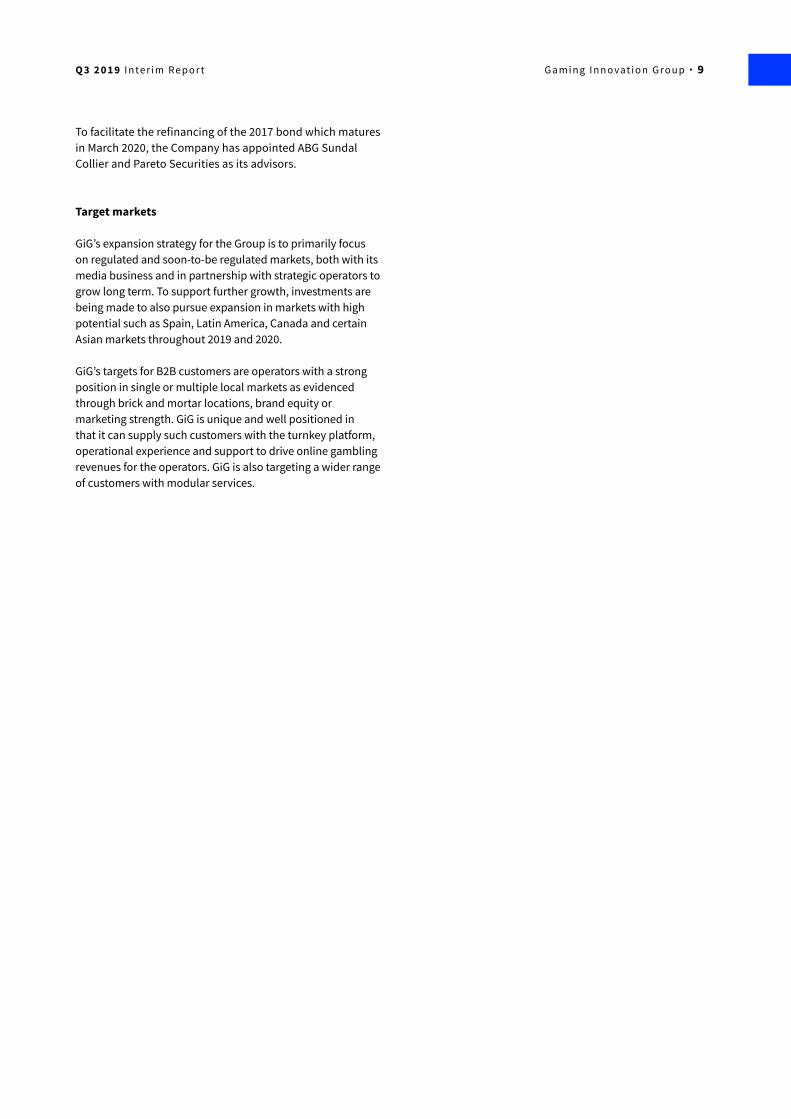
Q2-19 Q3-19Q1-19
69 77 55 59 62
101
101
104
96
Rizk OnlyDeposits (MEUR) & Actives (1000)
Deposits Actives
102
Q3-18 Q4-18
Q 3 2 0 1 9 I n te r i m Re p o r t G a m i n g I n n o vat i o n G r o u p · 10
Cost of sales for the B2C gaming segment were €7.3 (7.3) million, whereof betting duties were €1.8 (1.2) million or 9.1% (4.8%) of B2C revenues. This resulted in a gross profit margin of 64% (70%), where the margin decline was mainly an effect of the increase in betting duties.
Marketing expenses
B2C marketing expenses were €6.6 million in the third quarter 2019, a reduction from €10.2 million in the third quarter 2018 and a reduction from €8.2 million compared to the second quarter 2019. The reduction in marketing expenses is a result of initiatives taken from the second half of 2018 to change the mix in marketing from TV advertising to affiliate marketing and social media and the focus on fewer brands. Of the total B2C marketing expense in the third quarter 2019, €2.5 (3.4) million or 38% (32%), was related to revenue share agreements, with the balance attributable to up-front payments.
Gross deposits
Gross deposits were €80.8 (107.4) million in the third quarter 2019, down by 25%, mainly due to lower activity in the Nordics and especially in Sweden. The number of active users for the B2C segment was 136,922 (190,875). For the Rizk brand, gross deposits were €62.1 (68.7) million and active users was 101,712 (100,545) in the third quarter 2019.
Casino and sports betting margins
The casino margin in the operator business was 3.53% (3.47%) in the third quarter 2019. The sports betting margin was 7.2% (6.5) in the quarter. Betting duties represented 9.2% (4.8%) of gaming operators’ revenues in the third quarter 2019.
Strategy
The strategic initiatives taken in 2018 to focus on fewer B2C brands and building the Rizk brand in high potential markets continue, making the business vertical more efficient and more profitable for the long term. In 2018, GiG operated seven own brands, by August 2019, this was reduced to four in-house brands.
Q2-19 Q3-19Q3-18 Q4-18 Q1-19
Revenues EBITDA
15.214.7
17.9
14.3 14.3
2.62.13.4
2.0 1.5
RizkMEUR
Q2-19 Q3-19Q3-18 Q4-18 Q1-19
Revenues EBITDA
5.4 5.0
9.7
7.9
5.9
-1.1-0.2-0.8
-2.7
-0.9
Other brands combinedMEUR
Q 3 2 0 1 9 I n te r i m Re p o r t G a m i n g I n n o vat i o n G r o u p · 11
Q2-19 Q3-19Q3-18 Q4-18 Q1-19
Media ServicesRevenue & EBITDA (MEUR)
Revenue EBITDA
8.4
4.3
8.7
4.9
9.1
5.2
8.6
4.7
8.0
4.2
Q2-19 Q3-19Q3-18 Q4-18 Q1-19
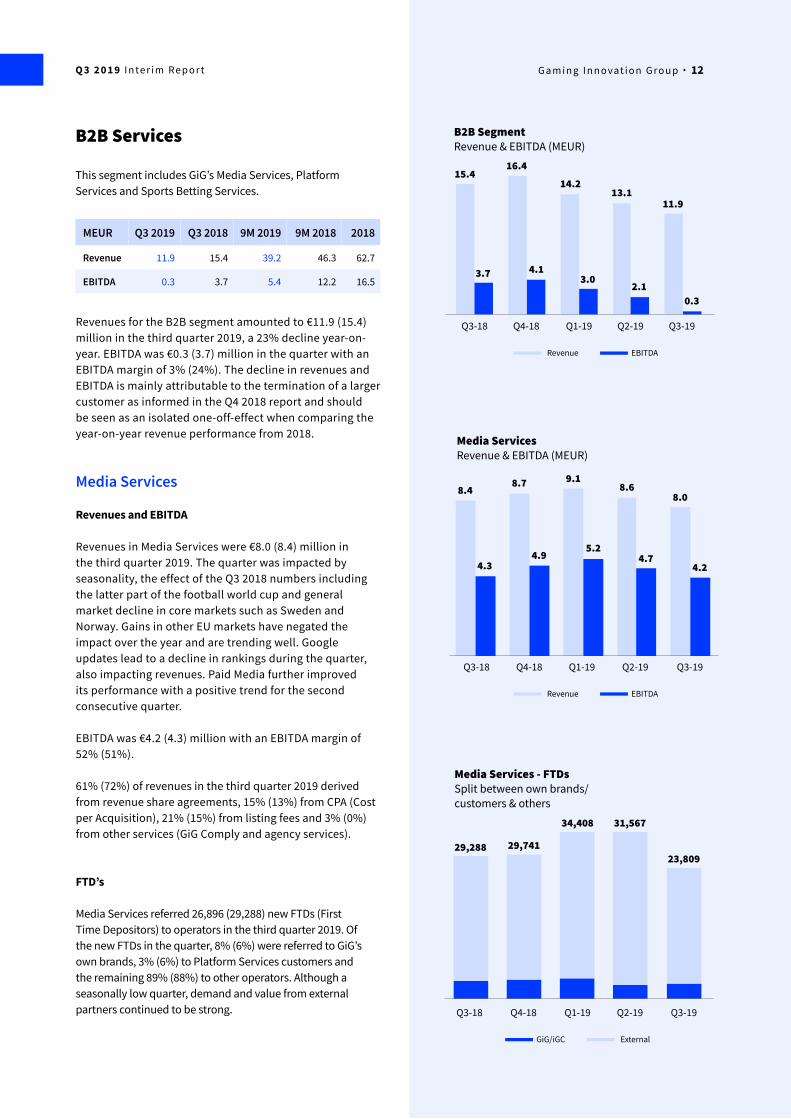
Media Services - FTDsSplit between own brands/customers & others
ExternalGiG/iGC
31,567
23,80929,288 29,741
34,408
Q2-19 Q3-19Q3-18 Q4-18 Q1-19
B2B SegmentRevenue & EBITDA (MEUR)
Revenue EBITDA
15.4
3.7
16.4
4.1
14.2
3.0
13.1
2.1
11.9
0.3
B2B Services
This segment includes GiG’s Media Services, Platform Services and Sports Betting Services.
Revenues for the B2B segment amounted to €11.9 (15.4) million in the third quarter 2019, a 23% decline year-on-year. EBITDA was €0.3 (3.7) million in the quarter with an EBITDA margin of 3% (24%). The decline in revenues and EBITDA is mainly attributable to the termination of a larger customer as informed in the Q4 2018 report and should be seen as an isolated one-off-effect when comparing the year-on-year revenue performance from 2018.
Media Services
Revenues and EBITDA
Revenues in Media Services were €8.0 (8.4) million in the third quarter 2019. The quarter was impacted by seasonality, the effect of the Q3 2018 numbers including the latter part of the football world cup and general market decline in core markets such as Sweden and Norway. Gains in other EU markets have negated the impact over the year and are trending well. Google updates lead to a decline in rankings during the quarter, also impacting revenues. Paid Media further improved its performance with a positive trend for the second consecutive quarter.
EBITDA was €4.2 (4.3) million with an EBITDA margin of 52% (51%).
61% (72%) of revenues in the third quarter 2019 derived from revenue share agreements, 15% (13%) from CPA (Cost per Acquisition), 21% (15%) from listing fees and 3% (0%) from other services (GiG Comply and agency services).
FTD’s
Media Services referred 26,896 (29,288) new FTDs (First Time Depositors) to operators in the third quarter 2019. Of the new FTDs in the quarter, 8% (6%) were referred to GiG’s own brands, 3% (6%) to Platform Services customers and the remaining 89% (88%) to other operators. Although a seasonally low quarter, demand and value from external partners continued to be strong.
MEUR Q3 2019 Q3 2018 9M 2019 9M 2018 2018
Revenue 11.9 15.4 39.2 46.3 62.7
EBITDA 0.3 3.7 5.4 12.2 16.5
Q 3 2 0 1 9 I n te r i m Re p o r t G a m i n g I n n o vat i o n G r o u p · 12

Trends
For publishing, the Google update impacted a decline in rankings in Q3, this is normal fluctuation of the business and GiG expects this trend to turn positive again for the Company as Google frequently changes its algorithm.
Headwinds in the Nordic market with declining player values due to regulation in Sweden and the Norwegian government blocking payment methods to and from internationally licensed operators in, remain for the foreseeable future and hamper the performance of both GiG and its customers as well as other market participants.
The paid model represented 20% (17%) of Media Services revenues and continued a positive trend in Q3 compared to the second half of 2018 when performance was hampered due to regulatory issues, mainly in the UK. Preparations and investments are being made to ensure that further opportunities can be realised when new markets regulate, and channels open up.
Strategy
A new management structure is from Q4 in place to bring enhanced focus and skill set into the business area and to align the strategy and target areas for growth with the rest of the business.
To support the expansion strategy into regulated markets, GiG was in July granted a Class II licence in Romania. This will allow GiG’s Media Services to enter the regulated Romanian market with affiliate marketing services to refer traffic to licensed online casinos and sportsbooks in Romania. Further licence applications and growth opportunities will be considered on a world-wide basis, with particular emphasis on countries in North America, Latin America and certain parts of Asia and North America as they open up for the opportunity. GiG’s approach for its media services to the US involves building powerful domains organically through which the Company is able to target all regulated states and those which are yet to become regulated. GiG is currently present in New Jersey and Pennsylvania US, with its affiliate sports betting site wsn.com and casinotopsonline.com, which were launched during Q2 and Q3 2019. In October, GiG got approval for paid media via Google Ads in New Jersey, which will further strengthen the marketing proposition.
Modular compliance services, such as the compliance monitoring and screening tool GiG Comply, also form part of the key focus areas for the Company.
Q2-19 Q3-19Q3-18 Q4-18 Q1-19
PaidPublishing
7,6915,732
9,408 6,594
7,486
21,850 21,16219,880
23,147
26,922
Media Services - FTDsSplit between publishing and paid
Q 3 2 0 1 9 I n te r i m Re p o r t G a m i n g I n n o vat i o n G r o u p · 13
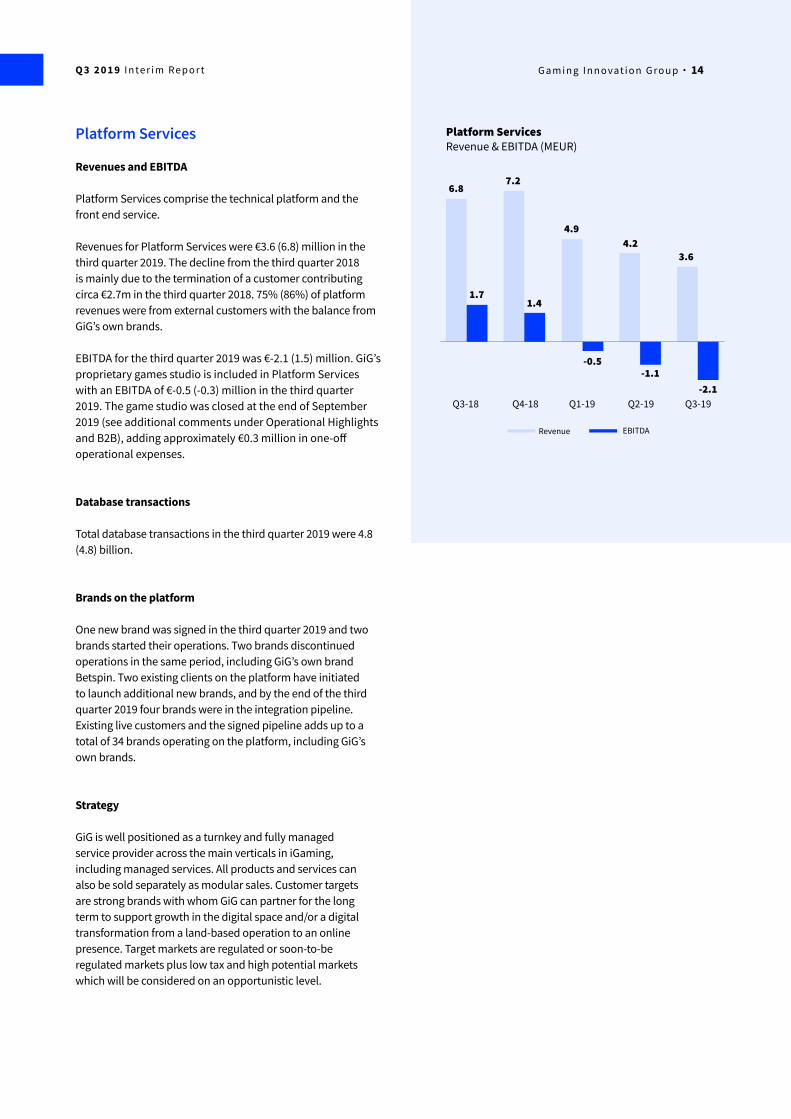
Platform ServicesRevenue & EBITDA (MEUR)
3.6
6.87.2
4.94.2
-1.1-0.5
1.41.7
Q2-19 Q3-19Q3-18 Q4-18 Q1-19
EBITDARevenue
Platform Services
Revenues and EBITDA
Platform Services comprise the technical platform and the front end service.
Revenues for Platform Services were €3.6 (6.8) million in the third quarter 2019. The decline from the third quarter 2018 is mainly due to the termination of a customer contributing circa €2.7m in the third quarter 2018. 75% (86%) of platform revenues were from external customers with the balance from GiG’s own brands.
EBITDA for the third quarter 2019 was €-2.1 (1.5) million. GiG’s proprietary games studio is included in Platform Services with an EBITDA of €-0.5 (-0.3) million in the third quarter 2019. The game studio was closed at the end of September 2019 (see additional comments under Operational Highlights and B2B), adding approximately €0.3 million in one-off operational expenses.
Database transactions
Total database transactions in the third quarter 2019 were 4.8 (4.8) billion.
Brands on the platform
One new brand was signed in the third quarter 2019 and two brands started their operations. Two brands discontinued operations in the same period, including GiG’s own brand Betspin. Two existing clients on the platform have initiated to launch additional new brands, and by the end of the third quarter 2019 four brands were in the integration pipeline. Existing live customers and the signed pipeline adds up to a total of 34 brands operating on the platform, including GiG’s own brands.
Strategy
GiG is well positioned as a turnkey and fully managed service provider across the main verticals in iGaming, including managed services. All products and services can also be sold separately as modular sales. Customer targets are strong brands with whom GiG can partner for the long term to support growth in the digital space and/or a digital transformation from a land-based operation to an online presence. Target markets are regulated or soon-to-be regulated markets plus low tax and high potential markets which will be considered on an opportunistic level.
-2.1
Q 3 2 0 1 9 I n te r i m Re p o r t G a m i n g I n n o vat i o n G r o u p · 14

Sports Betting Services
Revenues and EBITDA
Revenues from Sports Betting Services were €0.2 (0.2) million in the third quarter 2019. The sports betting margin was 7.2% (6.5) in the quarter.
EBITDA was €-1.8 (-2.1) million, a decline from €-1.5 million in Q2 2019. The negative EBITDA relates to the investments in technology and people to build the sports betting services in-house.
Strategy
The strategy of the sports betting services vertical is to build a ‘Tier 1 sportsbook operations team’ to manage our B2C brands. A key priority of development is to employ a bespoke standout pricing model from our Odds Model team in Norway.
GiG is continuing to optimise its sports betting product for the US marketplace, while improving our European operation to drive B2C Sports NGR and to grow the B2B sportsbook pipeline.
Break even in this vertical is expected in the first half of 2020. This will be achieved by strengthening the sportsbook with in-house brand Guts, by the developments in the new sportsbook and a focused market approach, initially on smaller markets where GiG has specific expertise such as in Norway and Finland. The investments in building the sportsbook will contribute both to the B2C and B2B revenues generated by the Company.
Sports Betting ServicesRevenue & EBITDA (MEUR)
-1.5
-1.9 -1.8-2.1
-1.8
0.3 0.30.5
0.2 0.2
Q2-19 Q3-19Q3-18 Q4-18 Q1-19
EBITDARevenue
Q 3 2 0 1 9 I n te r i m Re p o r t G a m i n g I n n o vat i o n G r o u p · 15
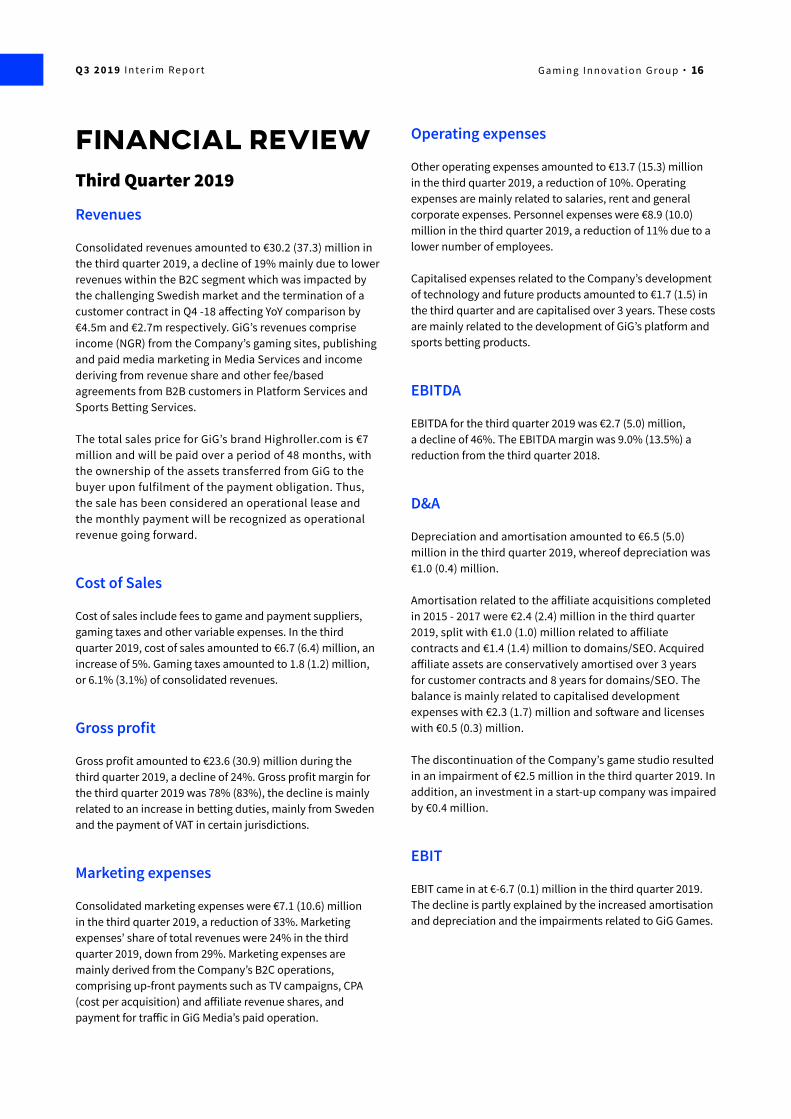
Operating expenses
Other operating expenses amounted to €13.7 (15.3) million in the third quarter 2019, a reduction of 10%. Operating expenses are mainly related to salaries, rent and general corporate expenses. Personnel expenses were €8.9 (10.0) million in the third quarter 2019, a reduction of 11% due to a lower number of employees.
Capitalised expenses related to the Company’s development of technology and future products amounted to €1.7 (1.5) in the third quarter and are capitalised over 3 years. These costs are mainly related to the development of GiG’s platform and sports betting products.
EBITDA
EBITDA for the third quarter 2019 was €2.7 (5.0) million, a decline of 46%. The EBITDA margin was 9.0% (13.5%) a reduction from the third quarter 2018.
D&A
Depreciation and amortisation amounted to €6.5 (5.0) million in the third quarter 2019, whereof depreciation was €1.0 (0.4) million.
Amortisation related to the affiliate acquisitions completed in 2015 - 2017 were €2.4 (2.4) million in the third quarter 2019, split with €1.0 (1.0) million related to affiliate contracts and €1.4 (1.4) million to domains/SEO. Acquired affiliate assets are conservatively amortised over 3 years for customer contracts and 8 years for domains/SEO. The balance is mainly related to capitalised development expenses with €2.3 (1.7) million and software and licenses with €0.5 (0.3) million.
The discontinuation of the Company’s game studio resulted in an impairment of €2.5 million in the third quarter 2019. In addition, an investment in a start-up company was impaired by €0.4 million.
EBIT
EBIT came in at €-6.7 (0.1) million in the third quarter 2019. The decline is partly explained by the increased amortisation and depreciation and the impairments related to GiG Games.
Financial ReviewThird Quarter 2019
Revenues
Consolidated revenues amounted to €30.2 (37.3) million in the third quarter 2019, a decline of 19% mainly due to lower revenues within the B2C segment which was impacted by the challenging Swedish market and the termination of a customer contract in Q4 -18 affecting YoY comparison by €4.5m and €2.7m respectively. GiG’s revenues comprise income (NGR) from the Company’s gaming sites, publishing and paid media marketing in Media Services and income deriving from revenue share and other fee/based agreements from B2B customers in Platform Services and Sports Betting Services.
The total sales price for GiG’s brand Highroller.com is €7 million and will be paid over a period of 48 months, with the ownership of the assets transferred from GiG to the buyer upon fulfilment of the payment obligation. Thus, the sale has been considered an operational lease and the monthly payment will be recognized as operational revenue going forward.
Cost of Sales
Cost of sales include fees to game and payment suppliers, gaming taxes and other variable expenses. In the third quarter 2019, cost of sales amounted to €6.7 (6.4) million, an increase of 5%. Gaming taxes amounted to 1.8 (1.2) million, or 6.1% (3.1%) of consolidated revenues.
Gross profit
Gross profit amounted to €23.6 (30.9) million during the third quarter 2019, a decline of 24%. Gross profit margin for the third quarter 2019 was 78% (83%), the decline is mainly related to an increase in betting duties, mainly from Sweden and the payment of VAT in certain jurisdictions.
Marketing expenses
Consolidated marketing expenses were €7.1 (10.6) million in the third quarter 2019, a reduction of 33%. Marketing expenses’ share of total revenues were 24% in the third quarter 2019, down from 29%. Marketing expenses are mainly derived from the Company’s B2C operations, comprising up-front payments such as TV campaigns, CPA (cost per acquisition) and affiliate revenue shares, and payment for traffic in GiG Media’s paid operation.
Q 3 2 0 1 9 I n te r i m Re p o r t G a m i n g I n n o vat i o n G r o u p · 16

Net result
Net other income was €-1.5 (-2.6) million in the third quarter 2019. Interest expense on the Company’s bond amounted to €1.5 (1.2) million, and a net gain of €0.7 million related to the bond due to the weakening of the SEK towards the EUR during the quarter. Interest related to IFRS 16 was €-0.3 million. The net result for the third quarter 2019 was €-8.4 (-2.6) million.
Cash flow
The consolidated net cash flow from operational activities amounted to €2.4 (0.4) million for the third quarter 2019. Included in the net cash flow from operational activities are changes in operating assets and liabilities, mainly consisting of release of rolling reserves, marketing prepayments and payments of receivables.
The net cash flow used on investments was €2.0 (2.6) million in the third quarter 2019, whereof €1.7 (1.5) million were capitalised development expenses.
The net cash flow from financing activities was €-4.4 (0.0) million in the third quarter 2019 and relates to interest payments on the bond and the repayment of loan facilities in July after the Company’s new bond issued in June. Cash and cash equivalents decreased by €4.3 (2.2) million in the third quarter 2019.
Financial position
As at 30 September 2019, holdings of cash and cash equivalents amounted to €10.9 (13.9) million. In addition, cash in transit from payment processors amounted to €5.5 million. Customer monies, that are held in fiduciary capacity, amounted to €8.4 (7.6) million, which are partly secured by balances with payment providers and partly by cash balances.
As at 30 September 2019, GiG held total assets of €180.1 (197.8) million and shareholders’ equity was €69.5 (104.2) with an equity ratio of 38% (53%). The interest-bearing debt as at 30 September 2019 was €64.7 (62.7) million. The Company’s lease liability is included with €13.9 million under long-term liabilities according to IFRS 16.
January to September 2019
Revenues
Consolidated revenues amounted to €93.6 (111.5) million in the first nine months of 2019, a decline of 16% mainly due to
lower revenues within the B2C segment which was impacted by the challenging Swedish market and the termination of a customer contract in Q4 -18 affecting YoY comparison by €14.6 and €6.0 million respectively.
Cost of Sales
In the first nine months of 2019, cost of sales amounted to €19.7 (19.6) million, an increase of 1%. Gaming taxes amounted to €5.5 (3.5) million, or 5.8% (3.1%) of consolidated revenues.
Gross profit
Gross profit amounted to €73.9 (91.9) million during the first nine months of 2019, a decline of 20%. Gross profit margin for the first nine months of 2019 was 79% (82%), the decline in the gross profit margin is mainly related to an increase in betting duties, mainly from Sweden and the addition of VAT in certain jurisdictions.
Marketing expenses
Consolidated marketing expenses were €24.6 (35.7) million in the first nine months of 2019, a reduction of 31%. Marketing expenses’ share of total revenues were 26% in the first nine months of 2019, down from 32%.
Operating expenses
Other operating expenses amounted to €40.0 (45.2) million in the first nine months of 2019, a reduction of 12%. Operating expenses are mainly related to salaries, rent and general corporate expenses. Personnel expenses were €26.6 (29.7) million in the first nine months of 2019, a reduction of 10% due to a lower number of employees. Capitalised expenses related to the Company’s development of technology and future products amounted to €4.9 (4.1) in the first nine months of 2019 and are capitalised over 3 years. These costs are mainly related to the development of GiG’s platform, sports betting products and games (closed in September).
EBITDA
EBITDA for the first nine months of 2019 was €9.3 (11.0) million, a decline of 16%. The EBITDA margin was 9.9% (9.9%) in line with the first nine months of 2018.
Q 3 2 0 1 9 I n te r i m Re p o r t G a m i n g I n n o vat i o n G r o u p · 17
D&A
Depreciation and amortisation amounted to €19.6 (14.6) million in the first nine months of 2019, whereof depreciation was €3.3 (1.4) million.
Amortisation related to the affiliate acquisitions completed in 2015 - 2017 were €7.1 (7.3) million in the first nine months of 2019, split with €2.8 (3.1) million related to affiliate contracts and €4.2 (4.3) million to domains/SEO. Acquired affiliate assets are amortised over 3 years for customer contracts and 8 years for domains/SEO. The balance is mainly related to capitalised development expenses with €4.4 (3.1) million.
The discontinuation of the Company’s game studio resulted in an impairment of €2.5 million in the third quarter 2019. In addition, an investment in a start-up company was impaired by €0.4 million.
EBIT
EBIT came in at €-13.2 (-3.5) million in the first nine months of 2019. The decline is mainly due to increased amortisation and depreciation and the impairment of Games assets.
Net result
Net other income was €-3.8 (-2.3) million in the first nine months of 2019. Interest on the Company’s bond was included with €3.9 (3.7) million. The balance is net foreign exchange losses included an unrealised gain of €2.4 million on the bond due to the weakening of the SEK towards the EUR during the first nine months of 2019.
The net result for the first nine months of 2019 was €-17.4 (-6.2) million.
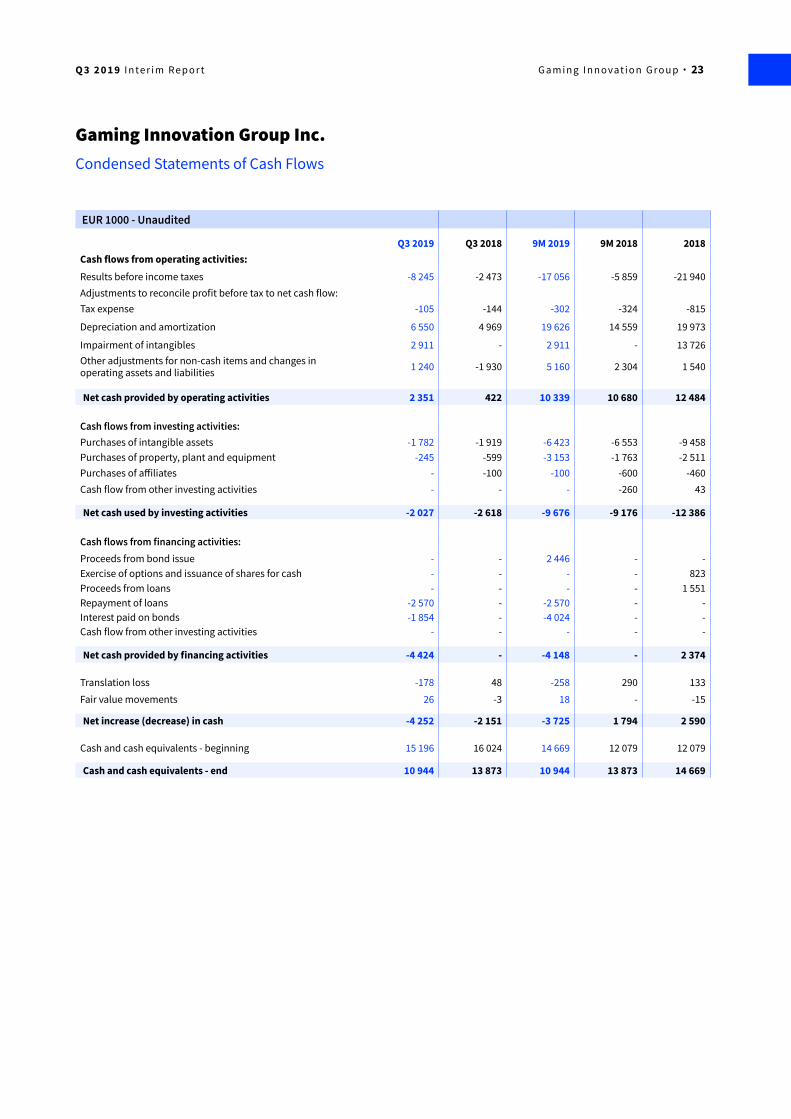
Cash flow
The consolidated net cash flow from operational activities amounted to €10.3 (10.7) million for the first nine months of 2019. Included in the net cash flow from operational activities are changes in operating assets and liabilities, mainly consisting of release of rolling reserves, marketing prepayments and payments of receivables.
The net cash flow used on investments was €9.7 (9.2) million in the first nine months of 2019, whereof €5.0 million were capitalised development expenses and €1.4 million one-off investments in leasehold improvements plus investments into GiG’s new office in Malta – ‘GiG Sky’. The net cash flow
from financing activities was €-4.1 (0.0) million in the first nine months of 2019 mainly due to the repayment of short term loan facilities in July.
Cash and cash equivalents decreased by €-3.7 (1.8) million in the first nine months of 2019.
Cash and cash equivalents decreased by €-3.7 (1.8) million in the first nine months of 2019.
Personnel
By the end of the third quarter 2019, 656 (733) employees were spread throughout Malta, Spain, Gibraltar, Denmark, Norway and some satellite offices at other locations.
Approximately 150 people are working in Gaming Operators, 200 in Platform Services (Core), 70 in Sports Betting Services, 5 in Games and 105 in Media Services, with the balance in corporate functions.
Shareholder matters
GiG was listed on the main list at Nasdaq Stockholm on Tuesday 26 March 2019. From this date the share is dual-listed on Nasdaq Stockholm and Oslo Børs with the same ISIN code: US36467X2062.
As at 30 September 2019, the total number of shares outstanding in GiG was 90,005,626 (par value USD 1.00). The number of authorised shares is 100,000,000.
In May 2019, 500,000 options were granted with an exercise price of NOK 30.00 per share. The options are exercisable with 20% after 1 April 2020, 30% after 1 April 2021 and 50% after 1 April 2022. All options expire on 31 March 2025 and are conditional upon employment at the time of exercise. In 2019, 80,000 options have been exercised and GiG borrowed shares for the immediate transfer of the option shares. GiG will issue new shares later and the number of shares outstanding will then increase to 90,085,626. During the third quarter 2019, 395,000 options were cancelled, and 1,111,000 options were outstanding as at 30 September 2019.
Gaming Innovation Group Plc. issued a new SEK400 million senior secured bond with a SEK1,000 million borrowing limit on 28 June 2019. SEK350 million of the net proceeds were used to refinance part of the existing GIGLTD01 bond, reducing the outstanding amount from SEK650 to SEK300 million. The balance of the new bond was used to pay down the parent Company’s working capital facility and short-term loans in July. The bond has a floating coupon of 3 months STIBOR + 9% per annum and maturity on 28 June 2022. The
Q 3 2 0 1 9 I n te r i m Re p o r t G a m i n g I n n o vat i o n G r o u p · 18
issue strengthened the longer-term financing of the business and increases GiG’s capacity and flexibility for growth opportunities. To facilitate the refinancing of the 2017 bond which matures in March 2020, the Company has appointed ABG Sundal Collier and Pareto Securities as its advisors.
Nomination Committee
The Nomination Committee of GiG shall consist of not less than three and not more than four members, of which one shall be the Chairman of the Board of Directors, to represent all shareholders and be appointed by the largest shareholders at 31 August 2019. New members of the committee are: Petter Nylander, Chairman of the Board, Robin Eirik Reed, Mikael Riese Harstad (nominated by Andre Lavold) and Petter Moldenius (nominated by Henrik Persson Ekdahl).
SustainabilityGiG’s sustainability priority areas are: • Fair and safe iGaming • Responsible marketing and advertising • Encourage employees to thrive
Sustainable and long-term profitable growth is at the core of all aspects of GiG’s corporate strategy. GiG focuses its sustainability strategy on areas most relevant to its business, at the heart of which is responsible gambling. This means offering customers and end users a full suite of solutions across the iGaming value chain while upholding strict rules to minimise harm caused by gambling; to prevent gambling from being a source of crime; and to ensure it is conducted in a fair and safe way. GiG supports end users to comply with technical, legislative and responsible marketing demands, both as an online operator and software supplier providing online gambling platform and services.
GiG invests in its employees’ knowledge and skills to understand their individual and organisational responsibility towards responsible gambling, to understand how to identify problem gambling, and to have the knowledge to be able to conduct brief interventions and signpost for further support. Tailor-made sustainability and responsible gambling training is provided for each department within the Organisation. During the third quarter 2019, GiG improved transaction monitoring and AML controls through the integration of tools into its systems which continuously monitor transactions and risk evaluation of customers. Furthermore, cutting edge technology is being introduced to facilitate ID validation, facial biometrics and address proofing, which will positively contribute to a smooth KYC protocol and an enhanced
customer journey throughout the whole customer lifecycle.GiG works with several research institutions and charities, using its knowledge of the iGaming industry to support research projects for the benefit of all parties. One of the most recent collaborations is with Bournemouth University, where GiG has participated in working on the GamInnovate project ‘Participatory Design of Interactive Persuasive Gambling Awareness: Enabling Gambler-Centered Innovation’. Sponsored by the National Center for Responsible Gaming (NCRG) US organisation.
GiG is committed to progressively working towards its sustainability goals and to report on progress and development in annual sustainability reporting. The Sustainability Report 2018 is available on the Company website: www.gig.com/ir
About Gaming Innovation Group
Gaming Innovation Group Inc. is a technology company providing products and services throughout the entire value chain in the iGaming industry. Founded in 2012, Gaming Innovation Group’s vision is ‘To open up iGaming and make it fair and fun for all’. Through its ecosystem of products and services, GiG is connecting operators, suppliers and users, to create the best iGaming experiences in the world. The headquarters are based in Malta and the Company is listed on the Oslo Stock Exchange under the ticker symbol GiG and on Nasdaq Stockholm under the ticker symbol GIGSEK.
Legal disclaimer
Gaming Innovation Group Inc. gives forecasts. Certain statements in this report are forward-looking and the actual outcomes may be materially different. In addition to the factors discussed, other factors could have an impact on actual outcomes. Such factors include developments for customers, competitors, the impact of economic and market conditions, national and international legislation and regulations, fiscal regulations, the effectiveness of copyright for computer systems, technological developments, fluctuation in exchange rates, interest rates and political risks.
Q 3 2 0 1 9 I n te r i m Re p o r t G a m i n g I n n o vat i o n G r o u p · 19
Financial calendar
Q4 2019 Interim Report: 18 February 2020 Q1 2020 Interim Report: 5 May 20202020 Annual Shareholder Meeting: 19 May 2020Q2 2020 Interim Report: 11 August 2020
Contacts
CEO Richard Brown [email protected]
Group CFO Tore [email protected]
Head of IR & Corporate Communications Anna-Lena Åströ[email protected]
GAMING INNOVATION GROUPGiG Beach Office,Triq id-Dragunara c/w Triq San Gorg,St. Julians, STJ 3148 Malta
This information is information that Gaming Innovation Group Inc. (GiG) is obliged to make public pursuant to the EU Market Abuse Regulation. The information was submitted for publication, at 08:00 CET on 6 November 2019.
Q 3 2 0 1 9 I n te r i m Re p o r t G a m i n g I n n o vat i o n G r o u p · 20

Gaming Innovation Group Inc.Condensed Statements of Operations
EUR 1000 - Unaudited
Q3 2019 Q3 2018 9M 2019 9M 2018 2018
Revenues 30 226 37 283 93 621 111 507 151 372 Cost of sales 6 672 6 348 19 693 19 562 27 358
Gross profit 23 554 30 935 73 928 91 945 124 014
Operating expensesMarketing expenses - revenue share 2 536 3 380 8 123 11 206 14 659 Marketing expenses - other 4 567 7 255 16 472 24 448 32 588 Non-recurring expenses - - - - 2 619 Other operating expenses 13 730 15 252 40 020 45 248 58 066
Total operating expenses 20 833 25 887 64 615 80 902 107 932
EBITDA 2 721 5 048 9 313 11 043 16 082
Depreciation & amortization 6 550 4 969 19 626 14 559 19 973 Impairment of intangibles 2 911 - 2 911 - 13 726
EBIT -6 740 79 -13 224 -3 516 -17 617
Financial income (expense) -1 496 -2 502 -3 790 -2 149 -4 210 Other income (expense) -9 -50 -42 -194 -113
Result before income taxes -8 245 -2 473 -17 056 -5 859 -21 940
Tax income/(expense) -105 -144 -302 -324 -815
Net results -8 350 -2 617 -17 358 -6 183 -22 755
Exchange differences on translation of foreign operations -178 48 -258 290 133 Fair value movement in available for sale investment 26 -3 18 - -15
Total comprehensive income (loss) -8 502 -2 572 -17 598 -5 893 -22 637
Total Comprehensive income (loss) attributable to:Owners of the Company -8 511 -2 582 -17 595 -5 916 -22 639
Non-controlling interests 9 10 -3 23 2
Total comprehensive income (loss) -8 502 -2 572 -17 598 -5 893 -22 637
Earnings per share attributable to GiG Inc:
Basic earnings (losses) per share -0,09 -0,03 -0,19 -0,07 -0,25Diluted earnings (losses) per share -0,09 -0,03 -0,19 -0,07 -0,25Weighted average shares outstanding (1000) 90 006 89 565 90 006 89 566 89 567 Diluted weighted average shares outstanding (1000) 90 006 89 565 90 006 89 566 89 567
Q 3 2 0 1 9 I n te r i m Re p o r t G a m i n g I n n o vat i o n G r o u p · 21

EUR 1000 - Unaudited
30 SEP 2019 30 SEP 2018 31 DEC 2018ASSETSNon-current assets:Goodwill 69 396 69 681 69 570 Intangible assets 57 084 85 580 69 253 Deposits and other non-current assets 22 265 8 385 8 061 Total non-current assets 148 745 163 646 146 884
Current assets:Prepaid and other current assets 24 25 5 Trade and other receivables 20 442 20 305 28 473 Cash and cash equivalents 10 944 13 873 14 669 Total current assets 31 410 34 203 43 147
TOTAL ASSETS 180 155 197 849 190 031
LIabilities and shareholders’ equityShareholders’ equity: Share capital 78 858 78 483 78 858 Share premium/reserves 120 881 32 102 121 942 Retained earnings (deficit) -130 231 -6 439 -112 753Total equity attributable to GiG Inc. 69 508 104 146 88 047 Non-controlling interests 22 46 25 Total shareholders’ equity 69 530 104 192 88 072
LIabilities:Trade payables and accrued expenses 32 606 28 686 34 204 Short term loans - - 617 Bond payable 31 462 - - Total current liabilities 64 068 28 686 34 821
Bond payable 33 277 62 684 64 230 Deferred tax liability 1 135 1 230 955 Other long term liabilities 12 145 1 057 1 953
Total long term liabilities 46 557 64 971 67 138
Total liabilities 110 625 93 657 101 959
TOTAL LIABILITIES AND SHAREHOLDERS’ EQUITY 180 155 197 849 190 031
CONDENSED STATEMENTS OF CHANGES IN EQUITY:
Equity at beginning of period 88 072 108 783 108 783 Issuance of shares for cash, in repayment of debt and purchase of subsidiary and affilates - 24 26
Adjustment in prior period -265 - - Exercise of options - - 822 Fair value movement in available for sale investments 18 - -15 Share compensation expense -679 1 278 1 078 Non-controlling interests -3 23 2 Exchange differences on translation of foreign operations -258 290 133 Net results -17 355 -6 206 -22 757
Equity at end of period 69 530 104 192 88 072
Gaming Innovation Group Inc.Condensed Statements of Financial Position
Q 3 2 0 1 9 I n te r i m Re p o r t G a m i n g I n n o vat i o n G r o u p · 22
EUR 1000 - Unaudited
Q3 2019 Q3 2018 9M 2019 9M 2018 2018Cash flows from operating activities:Results before income taxes -8 245 -2 473 -17 056 -5 859 -21 940Adjustments to reconcile profit before tax to net cash flow:Tax expense -105 -144 -302 -324 -815
Depreciation and amortization 6 550 4 969 19 626 14 559 19 973
Impairment of intangibles 2 911 - 2 911 - 13 726 Other adjustments for non-cash items and changes in operating assets and liabilities 1 240 -1 930 5 160 2 304 1 540
Net cash provided by operating activities 2 351 422 10 339 10 680 12 484
Cash flows from investing activities:Purchases of intangible assets -1 782 -1 919 -6 423 -6 553 -9 458Purchases of property, plant and equipment -245 -599 -3 153 -1 763 -2 511Purchases of affiliates - -100 -100 -600 -460Cash flow from other investing activities - - - -260 43
Net cash used by investing activities -2 027 -2 618 -9 676 -9 176 -12 386
Cash flows from financing activities:Proceeds from bond issue - - 2 446 - - Exercise of options and issuance of shares for cash - - - - 823 Proceeds from loans - - - - 1 551 Repayment of loans -2 570 - -2 570 - - Interest paid on bonds -1 854 - -4 024 - - Cash flow from other investing activities - - - - -
Net cash provided by financing activities -4 424 - -4 148 - 2 374
Translation loss -178 48 -258 290 133
Fair value movements 26 -3 18 - -15
Net increase (decrease) in cash -4 252 -2 151 -3 725 1 794 2 590
Cash and cash equivalents - beginning 15 196 16 024 14 669 12 079 12 079
Cash and cash equivalents - end 10 944 13 873 10 944 13 873 14 669
Gaming Innovation Group Inc.Condensed Statements of Cash Flows
Q 3 2 0 1 9 I n te r i m Re p o r t G a m i n g I n n o vat i o n G r o u p · 23

Gaming Innovation Group Inc.Notes to Condensed Consolidated Financial Statements as at and for the Periods Ending 30 September 2019 and 2018
1. General information
Gaming Innovation Group Inc. (“GiG.” or the “Company”) is a US corporation incorporated in the state of Delaware and traded on the Oslo Stock Exchange with the ticker symbol “GIG” and on Nasdaq Stockholm from 26 March 2019 with the ticker symbol “GIGSEK” (dual listing). Gaming Innovation Group Plc. (“Plc”) is incorporated and domiciled in Malta, having a registered office at @GiG Beach, The Golden Mile, Trig Id-Dragunara, St. Julian’s STJ 3148, Malta.
The Company’s principal activity is to provide a platform for and facilitate internet gambling, gaming and sports betting.
The condensed consolidated financial statements of the Company as at and for the periods ended 30 September 2019 and 2018 are comprised of Plc and its accounting basis subsidiaries.
2. Basis of preparation
The condensed consolidated financial statements have been prepared in conformity with IAS 34 and do not include all of the information required for full annual financial statements. The condensed consolidated interim financial statements for the periods ended 30 September 2019 and 2018 have not been audited by the Company’s auditors.
These unaudited interim condensed financial statements are prepared in accordance with International Financial Reporting Standards (“IFRS”) as adopted by the European Union. The condensed consolidated financial statements report the nine months of operations of both 2019 and 2018 of Gaming Innovation Group Inc. and subsidiaries.
The Company’s condensed consolidated financial statements are presented in Euros (EUR), which is the presentation and functional currency of the Company. The functional currencies of its subsidiaries are the United States dollar, the Euro and Norwegian and Danish Kroners which are translated into EUR at monthly average rates for revenues and expenses and at month end rates for assets and liabilities. Equity accounts are translated at historical rates. Exchange differences on translation of foreign operations are shown as a separate component of stockholders’ equity (deficit) and reflected as other comprehensive income (loss) on the condensed consolidated statement of comprehensive income (loss).
Going concern
The Company has incurred a net loss of €17.6 million during the nine months period ended 30 September 2019 and as of that date, the Company’s current liabilities exceed its current assets by €32.7 million due to the €31.5 million current portion of the Company’s bond. To rectify this situation, the Company has initiated a strategic review including appointing advisors to facilitate the refinancing of the 2017 bond which matures in March 2020. No assurance can be provided that such plans will be successful, and material uncertainty remains as of the date of this report.
3. Summary of significant accounting policies
Accounting Policies
The accounting policies adopted and used in preparing the condensed consolidated financial statements as at and for the periods ended 30 September 2019 and 2018 are consistent with those used in preparing the Company’s consolidated financial statements as at and for the year ended 31 December 2018.
Revenue Recognition Policy
Revenue comprises the fair value of the consideration received or receivable for the supply of services in the ordinary course of the Company’s activities. The Company recognizes revenue, including other operating revenue, when the amount of revenue can be reliably measured, it is probable that future economic benefits will flow to the Company and when specific criteria have been met as described below.
GiG Gaming Operators
Gaming transactions that are not deemed to be financial instruments, where the Company revenues stem from commissions. The revenue recognised in this manner relates to Poker. Such revenue represents the commission charged at the conclusion of each poker hand in cash games (i.e. rake). The Company’s performance obligation in this service is the provision of the poker game to the individual players.
Q 3 2 0 1 9 I n te r i m Re p o r t G a m i n g I n n o vat i o n G r o u p · 24
The performance obligation is satisfied and the Company is entitled to its share of the pot (i.e. the rake) once each poker hand is complete. In this respect, revenue recognition under IFRS 15 should remain consistent with that under IAS 18 (i.e. to recognise revenue as each hand is complete). Revenue from gaming transactions that are deemed to be financial instruments, where the Company takes open positions against players, are recognised as a net fair value gain or loss after the deduction of players’ winnings, bonuses and gaming taxes. The revenue recognised in this manner relates to sports betting and casino. These are governed by IFRS 9 and thus out of the scope of IFRS 15. Revenue from transactions where the Company is taking positions against players, such as sports betting and online casino, is recognised when the outcome of an event is known. Revenue from commission arising on transactions where the Company does not take open position against players, such as poker, is recognised when players place wagers in a pool.
GiG Platform Services
In contracting with white label operators, the Company considers that it is acting as an intermediary between the third party platform and the related service providers. On this basis revenue is recognised net of payments made to service providers.
Costs that are not reported as part of the net gain or loss within revenue include inter alia bank charges, fees paid to platform and payment providers and certain gaming taxes. In contracting with own license operators, the Company generates revenue by entering into a revenue share deal or a fixed deal where such revenue is apportioned on an accrual basis over the whole term of the contract. The consideration for such services is generally split between an initial setup to configure the software as per the customer’s requirements and on-going charge invoiced monthly.
The uncertainty on the amount of revenue to be received is resolved at each calendar month end since the contracts are such that the amounts reset to zero on a monthly basis. Accordingly, it is appropriate for the Company to recognise the monthly amounts invoiced in the P&L.
The only difference between accounting for such arrangements under the previous revenue standard and IFRS 15 pertains to the set-up fees. Under IAS 18, the set-up fees were deferred over a period of (generally) six months until the go-live date. In accordance with IFRS 15, the set-up is not seen as a distinct PO as the customer cannot benefit from the set-up itself but for the agreement as a whole. Accordingly, the set-up fee is simply seen as being
part of the consideration receivable for the software as a service (SAAS) agreement and should therefore be deferred over the period of the agreement.
Management performed a detailed analysis of such impact and concluded that this has an immaterial affect for the Company.
GiG Media Services
For a revenue share deal, the Company receives a share of the revenues that the gaming operator has generated as a result of a player playing on their iGaming site. Revenue is recognised in the month that it is earned by the respective gaming operator. For a cost acquisition deal, a client pays a one-time fee for each player who deposits money on the client’s site. Cost per acquisition contracts consist of a pre-agreed rate with the client. Revenue from such contracts is recognised in the month in which the deposits are made. For a listing deal, a client pays a fixed fee to be listed and critically reviewed on the Company’s websites. Such revenue is apportioned on an accrual basis over the term of the contract.
The Company’s performance obligation in this respect can be viewed as a series of distinct performance obligations to stand ready to redirect players on a constant basis. Such contacts give rise to variable consideration from an IFRS 15 point of view since the revenues are not fixed at the outset. In view of the nature of the service provided as a monthly stand-ready obligation, the Company recognises the income in the month in which it has a contractual right to bill the iGaming operators. This results in a consistent approach to revenue recognition under IAS 18.
Other
Interest income is recognised in profit or loss for interest-bearing instruments as it accrues, on a time proportion basis using the effective interest method, unless collectability is in doubt.
Dividend income is recognised when the right to receive payment is established.
Standards, Interpretations and Amendments to Published Standards Effective in 2019
In 2019, the Company adopted new standards, amendments and interpretations to existing standards that are mandatory for the Company’s accounting periods beginning 1 January
Q 3 2 0 1 9 I n te r i m Re p o r t G a m i n g I n n o vat i o n G r o u p · 25
2019. The adoption of these revisions to the requirements of IFRSs as adopted by the EU did not result in substantial changes to the Company’s accounting policies.
IFRS 16 Leasing arrangement
IFRS 16 Leasing agreements replaced the previous IAS 17 Leasing agreements and IFRIC 4 determining whether an arrangement contains a Lease and related agreements. The standard is mandatory from 1 January 2019. The new standard requires that all contracts which fulfil the definition of a leasing agreement, except contracts of less than 12 months duration and those with low values, as an asset and liability in the financial statements. The accounting according to IFRS 16 are based upon the approach that the lessee has the right to use the assets under a specific time period and simultaneously have an obligation to pay for the rights. The assets and liabilities are accounted for as a discounted present value of the future leasing payments. The cost regarding the leased assets consist of amortization of the assets and interest cost towards the leasing liability. Contracts that earlier have been classified as operating leases will thereby be accounted for in the balance sheet with the effect that the current operating costs, leasing cost for the period, will be replaced with amortization of the right-to-use asset and interest expense in the income statement.
Transitional method
The Company has implemented IFRS 16 by using the simplified transitional method, which means that the prior periods have not been restated.
Transition effects
As an operational lessee, the effect relates primarily to office premises contracts with the effect that total assets, operating profit and financial costs increases as well as the related cash flows move from the operational activities to financing activities. The opening effect on the Group’s balance sheet as of 1 January 2019 is estimated to € 9.93 million, consisting of a leasing asset as well as a leasing liability in the balance sheet. Equity has not been affected. At 30 September 2019 the total leasing asset amounted to €13.93 million as well as a leasing liability. The effect on the Groups income statement during the first nine months of 2019 amounted to €1.93 million and €0.66 million for depreciation and interest cost respectively. The effect on the Groups income statement during the third quarter of 2019 amounted to €0.68 million and €0.25 million for depreciation and interest cost respectively. The average marginal interest rate of 7 percent has been used as a discounting rate when calculating the transitional effects. For the Groups alternative KPI, there were no significant effects after the implementation of IFRS16.
In the opinion of management, there are no other standards that are not yet effective and that would be expected to have a material impact on the Company in the current or future reporting periods and on foreseeable future transactions.
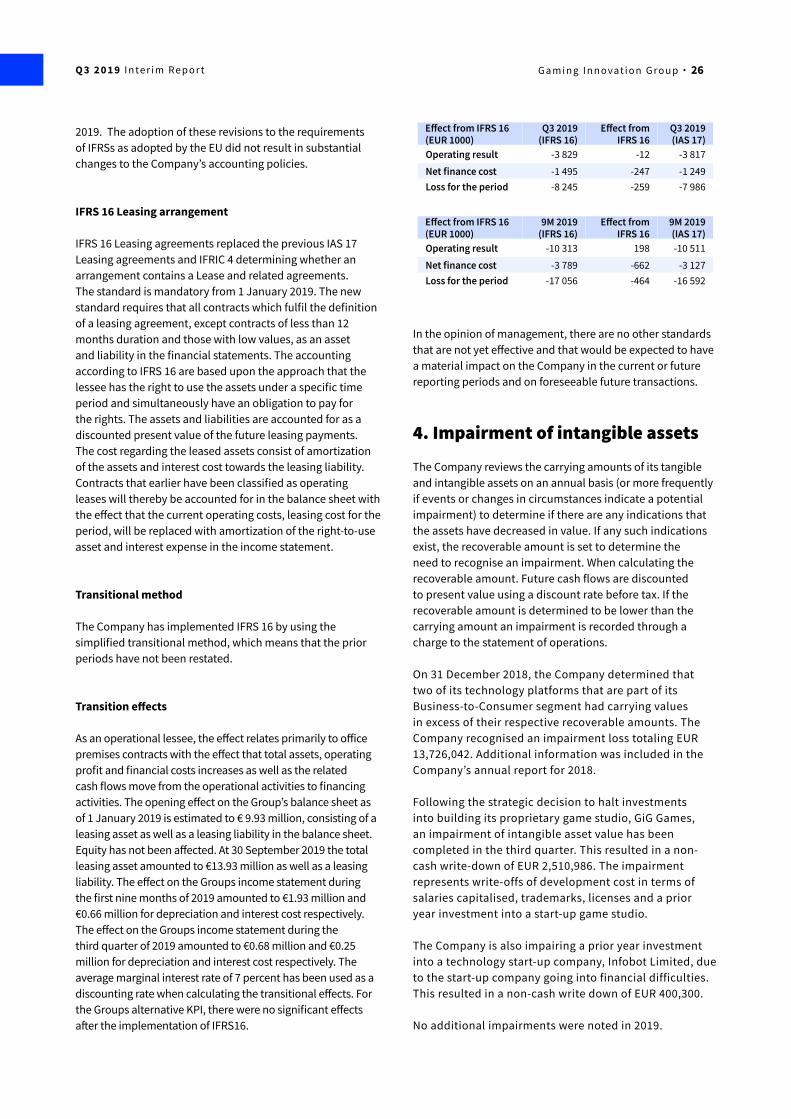
4. Impairment of intangible assets
The Company reviews the carrying amounts of its tangible and intangible assets on an annual basis (or more frequently if events or changes in circumstances indicate a potential impairment) to determine if there are any indications that the assets have decreased in value. If any such indications exist, the recoverable amount is set to determine the need to recognise an impairment. When calculating the recoverable amount. Future cash flows are discounted to present value using a discount rate before tax. If the recoverable amount is determined to be lower than the carrying amount an impairment is recorded through a charge to the statement of operations.
On 31 December 2018, the Company determined that two of its technology platforms that are part of its Business-to-Consumer segment had carrying values in excess of their respective recoverable amounts. The Company recognised an impairment loss totaling EUR 13,726,042. Additional information was included in the Company’s annual report for 2018.
Following the strategic decision to halt investments into building its proprietary game studio, GiG Games, an impairment of intangible asset value has been completed in the third quarter. This resulted in a non-cash write-down of EUR 2,510,986. The impairment represents write-offs of development cost in terms of salaries capitalised, trademarks, licenses and a prior year investment into a start-up game studio.
The Company is also impairing a prior year investment into a technology start-up company, Infobot Limited, due to the start-up company going into financial difficulties. This resulted in a non-cash write down of EUR 400,300.
No additional impairments were noted in 2019.
Effect from IFRS 16 (EUR 1000)
Q3 2019 (IFRS 16)
Effect from IFRS 16
Q3 2019 (IAS 17)
Operating result -3 829 -12 -3 817
Net finance cost -1 495 -247 -1 249Loss for the period -8 245 -259 -7 986
Effect from IFRS 16 (EUR 1000)
9M 2019 (IFRS 16)
Effect from IFRS 16
9M 2019 (IAS 17)
Operating result -10 313 198 -10 511
Net finance cost -3 789 -662 -3 127Loss for the period -17 056 -464 -16 592
Q 3 2 0 1 9 I n te r i m Re p o r t G a m i n g I n n o vat i o n G r o u p · 26
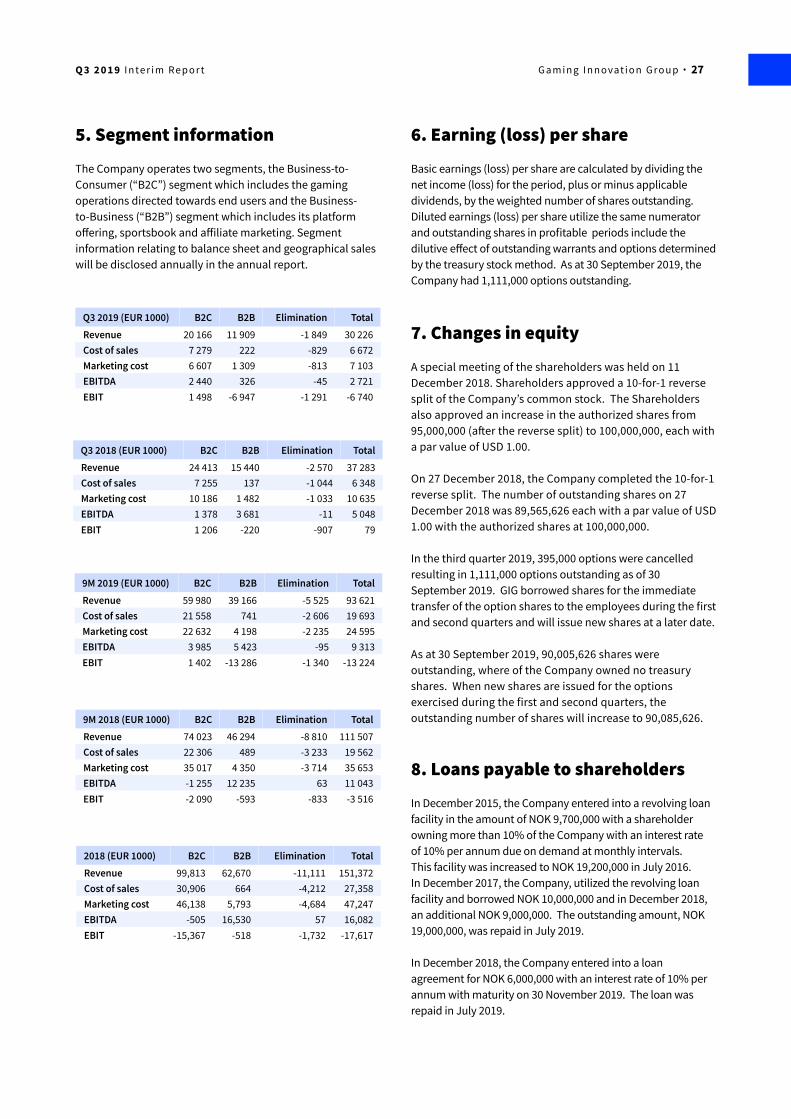
Q3 2019 (EUR 1000) B2C B2B Elimination TotalRevenue 20 166 11 909 -1 849 30 226Cost of sales 7 279 222 -829 6 672Marketing cost 6 607 1 309 -813 7 103EBITDA 2 440 326 -45 2 721EBIT 1 498 -6 947 -1 291 -6 740
Q3 2018 (EUR 1000) B2C B2B Elimination TotalRevenue 24 413 15 440 -2 570 37 283Cost of sales 7 255 137 -1 044 6 348Marketing cost 10 186 1 482 -1 033 10 635EBITDA 1 378 3 681 -11 5 048EBIT 1 206 -220 -907 79
2018 (EUR 1000) B2C B2B Elimination TotalRevenue 99,813 62,670 -11,111 151,372Cost of sales 30,906 664 -4,212 27,358Marketing cost 46,138 5,793 -4,684 47,247EBITDA -505 16,530 57 16,082EBIT -15,367 -518 -1,732 -17,617
9M 2018 (EUR 1000) B2C B2B Elimination TotalRevenue 74 023 46 294 -8 810 111 507Cost of sales 22 306 489 -3 233 19 562Marketing cost 35 017 4 350 -3 714 35 653EBITDA -1 255 12 235 63 11 043EBIT -2 090 -593 -833 -3 516
6. Earning (loss) per share
Basic earnings (loss) per share are calculated by dividing the net income (loss) for the period, plus or minus applicable dividends, by the weighted number of shares outstanding. Diluted earnings (loss) per share utilize the same numerator and outstanding shares in profitable periods include the dilutive effect of outstanding warrants and options determined by the treasury stock method. As at 30 September 2019, the Company had 1,111,000 options outstanding.
7. Changes in equity
A special meeting of the shareholders was held on 11 December 2018. Shareholders approved a 10-for-1 reverse split of the Company’s common stock. The Shareholders also approved an increase in the authorized shares from 95,000,000 (after the reverse split) to 100,000,000, each with a par value of USD 1.00.
On 27 December 2018, the Company completed the 10-for-1 reverse split. The number of outstanding shares on 27 December 2018 was 89,565,626 each with a par value of USD 1.00 with the authorized shares at 100,000,000.
In the third quarter 2019, 395,000 options were cancelled resulting in 1,111,000 options outstanding as of 30 September 2019. GIG borrowed shares for the immediate transfer of the option shares to the employees during the first and second quarters and will issue new shares at a later date.
As at 30 September 2019, 90,005,626 shares were outstanding, where of the Company owned no treasury shares. When new shares are issued for the options exercised during the first and second quarters, the outstanding number of shares will increase to 90,085,626.
8. Loans payable to shareholders
In December 2015, the Company entered into a revolving loan facility in the amount of NOK 9,700,000 with a shareholder owning more than 10% of the Company with an interest rate of 10% per annum due on demand at monthly intervals. This facility was increased to NOK 19,200,000 in July 2016. In December 2017, the Company, utilized the revolving loan facility and borrowed NOK 10,000,000 and in December 2018, an additional NOK 9,000,000. The outstanding amount, NOK 19,000,000, was repaid in July 2019.
In December 2018, the Company entered into a loan agreement for NOK 6,000,000 with an interest rate of 10% per annum with maturity on 30 November 2019. The loan was repaid in July 2019.
9M 2019 (EUR 1000) B2C B2B Elimination TotalRevenue 59 980 39 166 -5 525 93 621Cost of sales 21 558 741 -2 606 19 693Marketing cost 22 632 4 198 -2 235 24 595EBITDA 3 985 5 423 -95 9 313EBIT 1 402 -13 286 -1 340 -13 224
5. Segment information
The Company operates two segments, the Business-to-Consumer (“B2C”) segment which includes the gaming operations directed towards end users and the Business-to-Business (“B2B”) segment which includes its platform offering, sportsbook and affiliate marketing. Segment information relating to balance sheet and geographical sales will be disclosed annually in the annual report.
Q 3 2 0 1 9 I n te r i m Re p o r t G a m i n g I n n o vat i o n G r o u p · 27

Short-term loans outstanding balances at 30 September 2019 and 2018 were EUR 0 for both periods with accrued interest of EUR 0 for both periods. Long term loans outstanding balances at 30 September 2019 and 2018 were EUR 0 and EUR 1,056,980, respectively with accrued interest of EUR 0 and EUR 17,665, respectively.
9. Senior secured bonds
In March 2017, GIG issued a SEK 400 million senior secured bond in the Nordic bond market, with a SEK 1,000 million borrowing limit and fixed interest of 7% per annum with maturity in March 2020. Net proceeds from the bond issue were used for acquisition of affiliate markets, paying off existing debt in full, as well as towards general corporation purposes. The bond was initially drawn on 6 March 2017 with a subsequent issue of SEK 250 million on 14 September 2017 for a total of SEK 650 million.
In June 2019, the Company issued a new SEK 400 million senior secured bond with a SEK 1,000 million borrowing limit and fixed interest of 9% per annum with maturity on 28 June 2022. SEK 350 million of the net proceeds were used to refinance part of the existing SEK 650 million bond for a new bonds total of SEK 700 million (SEK 300 million due March 2020 and SEK 400 due June 2022). The balance of the new issue was used to pay down the Company loans in July 2019.
The outstanding balance of the March 2020 bond at 30 September 2019 was EUR 31,461,883 with accrued interest of EUR 328,785. The outstanding, balance of the June 2022 bond at 30 September 2019 was EUR 33,277,257, with accrued interest of EUR 781,860. The bonds are registered in the Norway Central Securities Depository. The 2017-20 bond is listed on the Oslo Stock Exchange (GIGLTD01) and the 2019-22 bond will be listed on Nasdaq Stockholm in Q4-2019.
10. Acquisitions
There were no acquisitions in the third quarter 2019.
11. Litigation
From time to time, the Company is involved in litigation brought by previous employees or other persons. The Company and its legal counsel believe that these claims are without merit.
In December 2018, the Company was notified of the ruling by Bergen City Court in the dispute against Euro TV AS.
The court concluded that GiG shall transfer 340,000 shares to Euro TV AS on the basis of an alleged oral agreement between the parties. GiG disagreed with the court's ruling and appealed the judgement. In Q4 2018 the Company accrued an expense of EUR 200,000. Please see note 30 in GiG’s 2018 annual report for further information about the dispute. In May 2019, the Company agreed to and paid in full, a settlement with Euro TV of NOK 1,750,000.
12. Related party transactions
There were no material related party transactions in the third quarter 2019 other than the loans mentioned in Note 8.
13. Subsequent events
There have been no material subsequent events after 30 September 2019.
14. Alternative performance measures
Certain financial measures and ratios related thereto in this interim report are not specifically defined under IFRS or any other generally accepted accounting principles. These measures are presented in this report because they are the measures used by management and they are frequently used by other interested parties for valuation purposes. In addition, the Company provides information on certain costs in the income statement, as these are deemed to be significant from an industry perspective.
Active customers: A customer having played with money deposited or with winnings from free spins or bonuses during the three month period
Casino margin: Customers’ total bets less winnings and jackpot contribution, divided by customers’ total bets
Deposits: Money deposited in the customer accounts
EBIT: Operating profit
EBITDA: Operating profit less depreciation, amortization and impairments
First Time Depositor (FTD): A first time depositor is a person who places wagers or deposits an amount of money for the very first time.
Q 3 2 0 1 9 I n te r i m Re p o r t G a m i n g I n n o vat i o n G r o u p · 28

Gaming tax: Taxes paid on revenues in regulated markets
Gross profit: Operating revenue less cost of sales
Gross margin: Gross profit in percent of revenues
Interest bearing debt: Other long-term debt and short-term borrowings
Organic growth: Growth excluding acquisitions.
Net Gaming Revenue (NGR): Total cash deposits less all wins payable to customers after bonus costs and external jackpot contributions
Sports Betting Margin: Customers’ total bets less winnings, divided by customers’ total bets
Report on review of Interim Financial information
To the Directors of Gaming Innovation Group Inc.
IntroductionWe have reviewed the accompanying condensed interim statement of financial position of Gaming Innovation Group Inc. as of September 30, 2019 and the related condensed interim statements of operations, changes in equity and cash flows for the nine-month period then ended and the explanatory notes. The directors are responsible for the preparation and presentation of these condensed interim financial statements in accordance with International Financial Reporting Standards as adopted by the European Union applicable to interim reporting (International Accounting Standards 34 “Interim Financial Reporting”). Our responsibility is to express a conclusion on these condensed interim financial statements based on our review.
Scope of ReviewWe conducted our review in accordance with International Standards on Review Engagements 2410 “Review of Interim Financial Information performed by the Independent auditor of the entity”. A review of interim financial statements consists of making inquiries, primarily of persons responsible for financial reporting and accounting matters, and applying analytical and other review procedures. A review is substantially less in scope than an audit conducted in accordance with International Standards on Auditing and consequently does not enable us to obtain assurance that we would become aware of all significant matters that might be identified in an audit. Accordingly, we do not express an audit opinion.
UncertaintyAs stated in Note 2, the Company faces a material uncertainty due to the maturity of its bonds.
Other MattersThe condensed financial statements include comparative financial information for the nine months ended September 30, 2018 that were not audited or reviewed. Accordingly, we do not express an opinion or a conclusion on such condensed interim financial information.
ConclusionBased on our review, nothing has come to our attention that causes us to believe that the accompanying condensed interim financial statements are not prepared in all material respects in accordance with International Accounting Standards 34 “Interim Financial Reporting”.
5 November 2019
Israeloff Trattner & Co PC, Garden City, New York, USA
Q 3 2 0 1 9 I n te r i m Re p o r t G a m i n g I n n o vat i o n G r o u p · 29

Gaming Innovation Group plc.Condensed statement of operations
EUR 1000 - Unaudited
Q3 2019 Q3 2018 9M 2019 9M 2018 2018
Revenues 30 226 37 283 93 621 111 507 151 372 Cost of sales 6 672 6 348 19 693 19 562 27 358
Gross profit 23 554 30 935 73 928 91 945 124 014
Operating expensesMarketing expenses - revenue share 2 536 3 380 8 123 11 206 14 659 Marketing expenses - other 4 567 7 255 16 472 24 448 32 588 Other operating expenses 13 358 15 026 38 865 44 320 59 133
Total operating expenses 20 461 25 661 63 460 79 974 106 380
EBITDA 3 093 5 274 10 468 11 971 17 634
Depreciation & amortization 6 550 4 959 19 626 14 531 19 973 Impairment of intangibles 2 911 - 2 911 - 13 726
EBIT -6 368 315 -12 069 -2 560 -16 065
Financial income (expense) -1 496 -2 502 -3 662 -2 149 -4 096Other income (expense) -10 -18 -38 -79 -114
Result before income taxes -7 874 -2 205 -15 769 -4 788 -20 275
Tax income/(expense) -105 -144 -302 -324 -815
Net results -7 979 -2 349 -16 071 -5 112 -21 090
Exchange differences on translation of foreign operations -178 48 -258 290 133Fair value movement in available for sale investment 26 -3 18 0 -15
Total comprehensive income (loss) -8 131 -2 304 -16 311 -4 822 -20 972
Total Comprehensive income (LOSS) attributable to:Owners of the Company -8 140 -2 314 -16 308 -4 845 -20 974
Non-controlling interests 9 10 -3 23 2
Total comprehensive income (loss) -8 131 -2 304 -16 311 -4 822 -20 972
Gaming Innovation Group Plc issued a SEK 650 million senior secured bond with a SEK 1,250 million borrowing limit in 2017. The bond has a fixed coupon of 7.0% p.a. with maturity in March 2020. The bond is listed on the Oslo Stock Exchange with ISIN NO0010787120.
In June 2019, Gaming Innovation Group Plc issued a new SEK 400 million senior secured bond with a SEK 1,000 million borrowing limit. The new bond has a coupon of STIBOR +
9.0% p.a. with maturity in June 2022. The new bond was used to repay SEK 350 million of the old bond, reducing the balance to SEK 300 million.
As per the bond terms, the interim condensed consolidated accounts for the issuer for the third quarter 2019 are stated below. Please refer to the selected notes to condensed consolidated financial statements for the parent Gaming Innovation Group Inc. for more information.
Q 3 2 0 1 9 I n te r i m Re p o r t G a m i n g I n n o vat i o n G r o u p · 30

EUR 1000 - Unaudited
30 SEP 2019 30 SEP 2018 31 DEC 2018ASSETSNon-current assets:Goodwill 53 708 53 993 53 882 Intangible assets 57 084 79 164 69 253 Deposits and other non-current assets 21 924 8 252 7 948 Total non-current assets 132 716 141 409 131 083
Current assets:Trade and other receivables 20 442 20 305 28 473 Inter-co GiG Inc. 4 235 - - Cash and cash equivalents 10 835 13 830 14 596 Total current assets 35 512 34 135 43 069
TOTAL ASSETS 168 228 175 544 174 152
LIABILITIES AND SHAREHOLDERS’ EQUITYShareholders’ equity:Share capital 51 54 51 Share premium/reserves 93 017 1 151 94 077 Retained earnings (deficit) -35 122 -5 884 -18 930Total equity attributable to GiG plc. 57 946 -4 679 75 198 Non-controlling interests 22 46 25 Total shareholders’ equity 57 968 -4 633 75 223
Liabilities:Trade payables and accrued expenses 32 241 27 720 33 744 Inter-co GiG Inc. - 88 543 - Bond payable 31 462 - - Total current liabilities 63 703 116 263 33 744
Bond payable 33 277 62 684 65 185 Deferred tax liability 1 135 1 230 -
Other long term liabilities 12 145 - -
Total long term liabilities 46 557 63 914 65 185
Total liabilities 110 260 180 177 98 929
TOTAL LIABILITIES AND SHAREHOLDERS’ EQUITY 168 228 175 544 174 152
CONDENSED STATEMENTS OF CHANGES IN EQUITY:
Equity at beginning of period 75 223 -1 089 -1 089 Adjustment in prior periods -265 - - Reclassification of capital contribution of merged companies - - 6 446 GIG Inc loans converted into capital contribution - - 89 760 Fair value movement in available for sale investments 18 - -15 Share compensation expense -679 1 278 1 078 Non-controlling interests -3 23 2 Exchange differences on translation of foreign operations -258 290 133 Net results -16 068 -5 135 -21 092
Equity at end of period 57 968 -4 633 75 223
Gaming Innovation Group plc.Condensed statements of financial position
Q 3 2 0 1 9 I n te r i m Re p o r t G a m i n g I n n o vat i o n G r o u p · 31
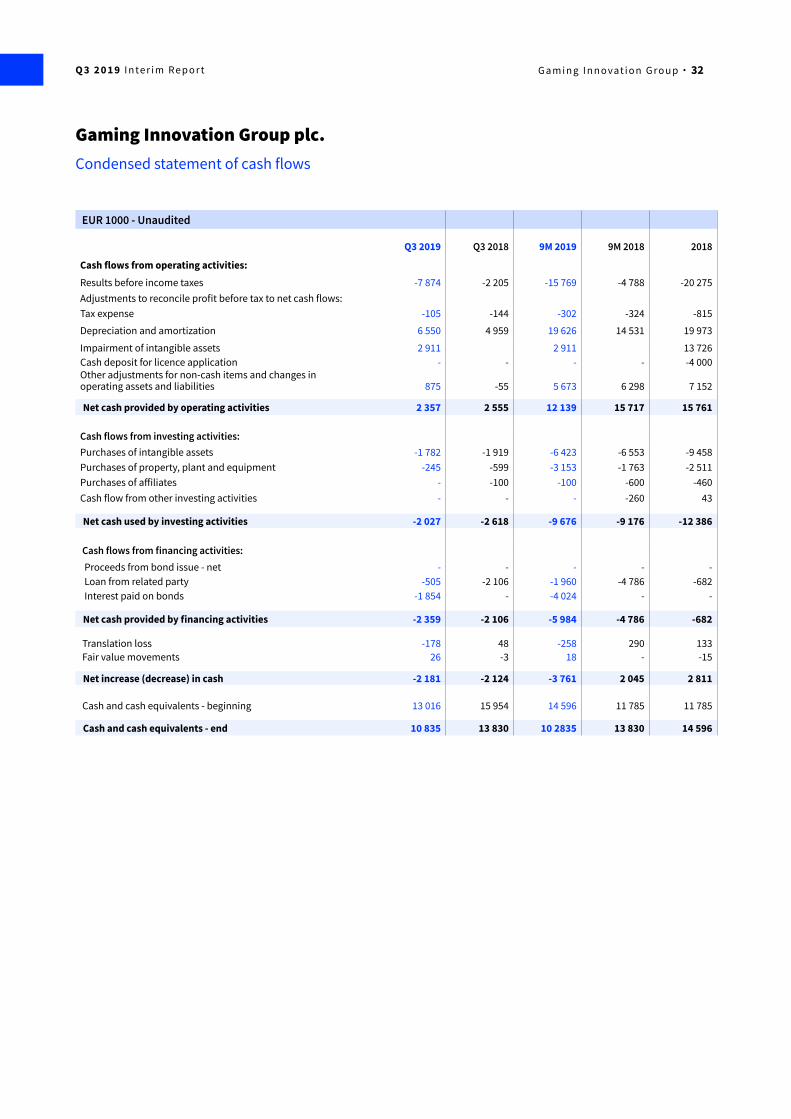
EUR 1000 - Unaudited
Q3 2019 Q3 2018 9M 2019 9M 2018 2018
Cash flows from operating activities:Results before income taxes -7 874 -2 205 -15 769 -4 788 -20 275Adjustments to reconcile profit before tax to net cash flows:Tax expense -105 -144 -302 -324 -815
Depreciation and amortization 6 550 4 959 19 626 14 531 19 973
Impairment of intangible assets 2 911 2 911 13 726 Cash deposit for licence application - - - - -4 000Other adjustments for non-cash items and changes inoperating assets and liabilities 875 -55 5 673 6 298 7 152
Net cash provided by operating activities 2 357 2 555 12 139 15 717 15 761
Cash flows from investing activities:Purchases of intangible assets -1 782 -1 919 -6 423 -6 553 -9 458Purchases of property, plant and equipment -245 -599 -3 153 -1 763 -2 511Purchases of affiliates - -100 -100 -600 -460Cash flow from other investing activities - - - -260 43
Net cash used by investing activities -2 027 -2 618 -9 676 -9 176 -12 386
Cash flows from financing activities: Proceeds from bond issue - net - - - - - Loan from related party -505 -2 106 -1 960 -4 786 -682 Interest paid on bonds -1 854 - -4 024 - -
Net cash provided by financing activities -2 359 -2 106 -5 984 -4 786 -682
Translation loss -178 48 -258 290 133 Fair value movements 26 -3 18 - -15
Net increase (decrease) in cash -2 181 -2 124 -3 761 2 045 2 811
Cash and cash equivalents - beginning 13 016 15 954 14 596 11 785 11 785
Cash and cash equivalents - end 10 835 13 830 10 2835 13 830 14 596
Gaming Innovation Group plc.Condensed statement of cash flows
Q 3 2 0 1 9 I n te r i m Re p o r t G a m i n g I n n o vat i o n G r o u p · 32

GiG founded Listed on the Oslo Stock Exchange
Dual-listing on Nasdaq Stockholm
2012 2015 2019
GiG Overview
VISION
“Opening up iGaming to make it fair and fun for all”
Mission
“Have a stake in every fair online bet”
~700 Employees Offices in Malta, Denmark, Gibraltar, Norway, Spain, US
Licences n Malta, UK, New Jersey, Germany S-H, Sweden, Spain & Romania
Company profile
GiG’s portfolio also consists of a B2C business with four consumer-facing casino brands focused on regulated and soon-to-be regulated markets, offering gaming experiences in the form of casino games, sports betting and poker tables: Rizk, Guts, Thrills and Kaboo.
B2C Casino Brands
B2B Solutions
Cloud-based platform providing a technical foundation to create a stable and secure iGaming solution, offering a variety of tools. All other solutions can be integrated and accessed through the platform, including third-party games and payment suppliers.
Game-developing studio offering direct integration onto the platform. Our in-house team of experts focuses on all aspects connected with game development and production, and is continually building games with improved user experience.
360-degree lead generation and digital marketing provider with global reach for the iGaming industry. Media makes use of betting and casino guide publishing, online media buy channels, proprietary ad-tech and digital agency work.
Fully hosted and managed sportsbook solution delivering a seamless omni-channel betting experience tailored for offline and/or online channels.
Managed services offering expertise and operational infrastructure to provide customers with everything they need to run an online casino or sportsbook.
“We are committed to developing products that are fair and fun for all.”
Q 3 2 0 1 9 I n te r i m Re p o r t G a m i n g I n n o vat i o n G r o u p · 33

B2B B2B
B2B
B2B B2C
Technical Platform
Platform Services Marketing OperatorsContent & Ancillary
Services
The iGamingvalue chain
Managed Services
Sports Betting,Games & Ancillary
Services
MediaServices
In-house GamingOperators
We are GiGGaming Innovation Group Inc. (“GiG” or “the Company”) is a technology company providing innovative and connected products and solutions throughout the entire value chain of the iGaming industry.
Founded in 2012, Gaming Innovation Group’s vision is “Opening up iGaming to make it fair and fun for all”. Throughout its ecosystem of products, services and solutions, GiG is connecting operators, suppliers and end users with the ambition of creating the best iGaming experiences in the world.
GiG's in-house- developed products and services are present in the entire iGaming value chain:
GiG’s Business model:
��������������
����������
�����������������
�������������������
������ ��������
������������
������������
���������������
������������������������
��������������
������ ��������
�����������������������������������������
���� ����� ��������������������
���������������������
�� ��������������
������������������������
���������� ��
�������������������������
������������������������
���������������
���������������
�������� ���������������
������������������������������������
��������������
�������������� ��� ��� ���
Q 3 2 0 1 9 I n te r i m Re p o r t G a m i n g I n n o vat i o n G r o u p · 34

UNITED STATES8359 Stringfellow Rd St James City, FL 33956
MALTA (Headquarters)@GiG BeachGolden Mile Business Centre Triq Id-DragunaraSt Julian’s STJ 3148
NORWAYFridjtof Nansens Plass 6 0160 Oslo
NORWAYTangen 76 4608 Kristiansand
GIBRALTARMavrix Services Limited 11A Cornwall’s Lane Gibraltar GX1 1AA
DENMARKNannasgade 28 2200 Copenhagen N
OUR OFFICES
SPAINAvenida Ricardo Soriano 21 MarbellaMalaga 29601
MALTA@GiG Sky Pendergardens Business Centre - Level 4St Andrew's RoadSt Julian's STJ 1902

gig.com