Gamification of ERP Systems - Exploring Gamification ... · (gamification) is a promising trend to...
12
Gamification of ERP Systems - Exploring Gamification Effects on User Acceptance Constructs Philipp Herzig SAP Research Dresden, 01187 Dresden, [email protected] Prof. Dr. Susanne Strahringer Technische Universität Dresden, Chair for Information Systems, esp. Information Systems in Manufacturing and Commerce, 01069 Dresden, [email protected] Dr. Michael Ameling SAP Research Dresden, 01187 Dresden, [email protected] Abstract The adoption of game mechanics into serious contexts such as business applications (gamification) is a promising trend to improve the user’s participation and engagement with the software in question and on the job. However, this topic is mainly driven by practitioners. A theoretical model for gamification with appropriate empirical validation is missing. In this paper, we introduce a prototype for gamification using SAP ERP as example. Moreover, we have evaluated the concept within a comprehensive user study with 112 participants based on the technology acceptance model (TAM) using partial least squares (PLS) for analysis. Finally, we show that this gamification approach yields significant improvements in latent variables such as enjoyment, flow or perceived ease of use. Moreover, we outline further research requirements in the domain of gamification. 1 Introduction The process of introducing game mechanics to business software is called Gamification and is defined, e.g., as “[applying] the mechanics of gaming to non-game activities to change people’s behavior. When used in a business context, gamification is the process of integrating game dynamics (and new game mechanics) into a website, business service, online community, or marketing campaign in order to drive participation and engagement” [2]. According to [13] today’s gamers can be characterized as follows:
Transcript of Gamification of ERP Systems - Exploring Gamification ... · (gamification) is a promising trend to...
Gamification of ERP Systems - Exploring Gamification Effects on User Acceptance Constructs
Philipp Herzig
SAP Research Dresden, 01187 Dresden, [email protected]
Prof. Dr. Susanne Strahringer
Technische Universität Dresden, Chair for Information Systems, esp. Information Systems in
Manufacturing and Commerce, 01069 Dresden, [email protected]
Dr. Michael Ameling
SAP Research Dresden, 01187 Dresden, [email protected]
Abstract
The adoption of game mechanics into serious contexts such as business applications
(gamification) is a promising trend to improve the user’s participation and engagement with
the software in question and on the job. However, this topic is mainly driven by practitioners.
A theoretical model for gamification with appropriate empirical validation is missing. In this
paper, we introduce a prototype for gamification using SAP ERP as example. Moreover, we
have evaluated the concept within a comprehensive user study with 112 participants based
on the technology acceptance model (TAM) using partial least squares (PLS) for analysis.
Finally, we show that this gamification approach yields significant improvements in latent
variables such as enjoyment, flow or perceived ease of use. Moreover, we outline further
research requirements in the domain of gamification.
1 Introduction
The process of introducing game mechanics to business software is called Gamification and
is defined, e.g., as “[applying] the mechanics of gaming to non-game activities to change
people’s behavior. When used in a business context, gamification is the process of
integrating game dynamics (and new game mechanics) into a website, business service,
online community, or marketing campaign in order to drive participation and engagement” [2].
According to [13] today’s gamers can be characterized as follows:
2 Philipp Herzig, Susanne Strahringer, Michael Ameling
Sixty-five percent of American households play computer or video games.
The average game player is 35 years old and has been playing games for 13 years.
The average age of the most frequent game purchaser is 40 years.
Forty percent of all game players are women.
Additionally, more than five million people in the USA play games for 40 hours a week [12]
and gamers have collectively spent 5.93 million years playing World of Warcraft [17].
Obviously, the group of people who are working and intensively playing games is relatively
large. This leads to the question, if enterprise software can provide the same motivation for
people as games do? More recently, researchers have begun to discuss this so called
gamification of non-gaming contexts on conference workshops (e.g., [11]). The
argumentation is further supported by, e.g., [30] stating that: “In the past decade, virtual
worlds have demonstrated the potential to be the next generation of interface for
entertainment, interaction, content and e-commerce. [...] virtual worlds [...] become a huge
business [...]”.
Thus, the intention of this and future research is to develop and evaluate a gamification
approach for one pervasive business application, e.g., Enterprise Resource Planning (ERP).
The idea is to compare two different ERP concepts with each other. Hereby, the first
approach is the traditional, hierarchical ordered and form based graphical user interface of
SAP ERP (SAPGUI). The second concept is our gamification prototype in the style of real-
time strategy games, such as SimCity, Anno or Age of Empires, augmented with game
concepts, such as rewards. The general goal of this research is to find out, whether the
gamification approach is better suited regarding ease of use, usefulness, efficiency,
productivity, motivation, or enjoyment and thus may enhance usage intentions. Based on a
theoretical model derived out of a broad literature review we have conducted a study to
evaluate the user’s acceptance toward both technological visualization approaches.
Hereby, our findings give answers to the following research questions:
RQ1: Which theoretical framework is suitable to explain usage intentions of applications with
game mechanics?
RQ2: Does gamification yield improvements in latent variables of software usage, e.g.,
enjoyment, perceived ease of use, or perceived usefulness?
The rest of the paper is structured as follows. First, the research model is presented by
outlining assumptions and limitations. Second, the prototype is described shortly. Third, the
user study is characterized and evaluation results are presented. Fourth, a short discussion
summarizes our findings. The paper closes with an outlook on further research.
2 Research Model and Hypotheses
The research model for this paper is based on the technology acceptance model (TAM)
[6],[7], the DeLone & McLean information system success model [9] and flow theory [5].
The model itself was derived under the following pragmatic limitations. First, the entire study
must not take more than half an hour for an experienced SAP user. Thus, the time to work
with the game prototype was limited to fifteen minutes. More importantly, answering the
Multikonferenz Wirtschaftsinformatik 2012 3
questionnaire must not take more than ten minutes. Second, the participants are mainly from
academic institutions, e.g., students, professors or researchers, most of them with an SAP
ERP background. Third, the prototype cannot cover the entire functionality of SAPGUI, thus,
it is possible that participants underestimate the effect of usefulness. Fourth, the prototype
decreases much of the complexity of SAPGUI, which again can lead to bias in the evaluation
results.
Given these limitations, only an ex ante perspective to measure usage intentions seemed to
be appropriate. Hence, TAM was used as the base model [28].This mainly results from the
observation, that the prototype in question is compared with a generally available product
(SAPGUI). In TAM the behavioral intention (BI) to use a particular software is determined by
its perceived usefulness (PU) and its perceived ease of use (PEOU).
Besides the limitations illustrated above, further assumptions were taken into account while
deriving the model. First, functionality was assumed to be identical between both solutions,
thus, no further antecedents of perceived usefulness are considered in the final model.
Second, due to the large amount of possible antecedents of PEOU and flow (e.g., [14]), only
first-level antecedents were considered. Third, the impact of both visualizations on the user is
measured on the individual’s level according to the levels introduced in the D&M IS Success
Model [8].
Since the first version of the model resulted in far too many constructs and questionnaire
items (162 items) respectively, a more parsimonious model had to be created using
additional assumptions. First, all system quality constructs that act as antecedents to PEOU
from the IS Success model were omitted because the prototype could not fulfill non-
functional requirements such as reliability, flexibility or accessibility [28]. Second, the
remaining constructs from the TAM domain were classified into two classes: user- and user-
system dependent.
Within the first class only constructs are subsumed that represent general information
individuals rely on regarding software that has nothing to do with the software system itself.
The latter class covers constructs that represent the direct experience with the system.
These variables are formed when “additional information becomes available” [23]. In order to
omit further constructs, only the user-system dependent constructs, that is, enjoyment,
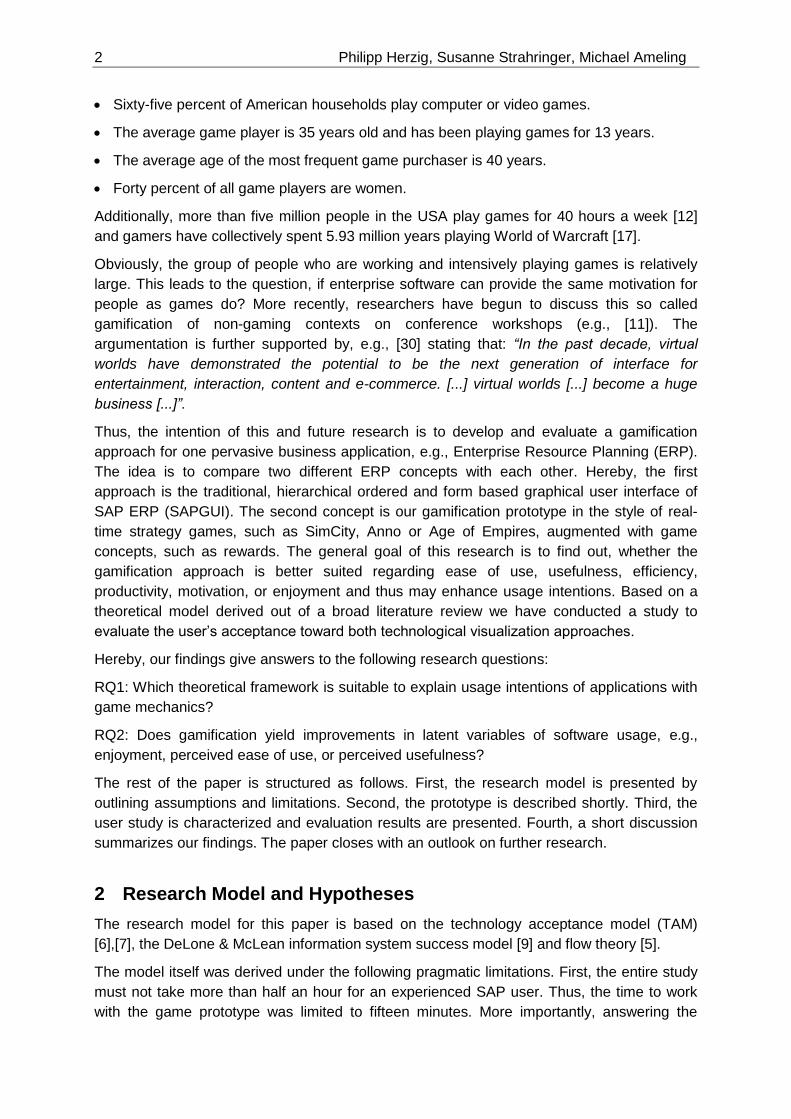
content/interface, telepresence and interactivity were retained. This led to the final research
model depicted in Figure 1. For a more detailed description of how the final model was
constructed see [14]. Overall, a set of twenty hypotheses has been declared as presented in
Table 1. In this table, V1 represents SAPGUI and V2 the game prototype. The a-hypotheses
were derived out of an extensive literature review and are to be tested for each system
separately while the b-hypotheses are used to test whether the constructs in question are
significantly improved by V2 in order to answer RQ2.
The measurement model of the structural equation model (SEM) is derived, in turn, out of
prior work. First, all items on interactivity are taken from, e.g., [4][14][18], questions on
interface are from, e.g., [4][14][27]. Items for telepresence are derived from, e.g., [18] and
flow from, e.g., [18][14]. Enjoyment items are from [23][24]. Question of PU, PEOU and BI
are used from the TAM model authors, that is, e.g., [6][7][23]. All items are measured on a 5-
point Likert scale.
4 Philipp Herzig, Susanne Strahringer, Michael Ameling
The German translation of the questionnaire has been checked in a previous peer-review
with five potential respondents. After this review, wording and translation changes were
included into the questionnaire (the questionnaire can be requested from the first author).
Figure 1: The final research model
Number Hypothesis
H1a Telepresence has a positive effect on flow. (e.g., [18])
H1b Telepresence is higher in V2 than in V1.
H2a Speed of interaction has a positive effect on flow. (e.g., [18])
H2b No difference in speed of interaction between V1 and V2 exists.
H3a The perceived quality of the interface has a positive effect on flow experience. (e.g., [4])
H3b The perceived quality of the interface in V2 is greater than in V1.
H4a Flow has a positive effect on perceived ease of use. (e.g., [1])
H4b Iff flow is significantly higher in V2 than in V1 AND hypothesis H4a is true, then PEOU is higher in V2 than in V1.
H5a Flow has a positive effect on perceived usefulness. (e.g., [1])
H5b Iff flow is significantly higher in V2 than in V1 AND hypothesis H5a is true, then PU is higher in V2 than in V1.
H6a Flow has a positive effect on behavioral intention. (e.g., [16])
H6b Iff flow is significantly higher in V2 than in V1 AND hypothesis H6a is true, then behavioral intention to use V2 is higher than for V1.
H7a Perceived enjoyment has a positive effect on PEOU. (e.g., [23])
H7b Perceived enjoyment is higher in V2 than in V1.
H8a PEOU has a positive effect on BI. (e.g. [16] [24])
H8b Iff PEOU is significantly higher in V2 than in V1 AND hypothesis H8a is true, then BI is higher in V2 than in V1.
H9a PEOU has a positive effect on PU. (e.g., [16],[24])
H9b Iff PEOU is significantly higher in V2 than in V1 AND hypothesis H9a is true, then PU is higher in V2 than in V1.
H10a PU has a positive effect on BI. (e.g., [16],[24])
H10b Iff PU is significantly higher in V2 than in V1 AND hypothesis H10a is true, then BI is higher in V2 than in V1.
Table 1: Hypotheses for structural equation model
Multikonferenz Wirtschaftsinformatik 2012 5
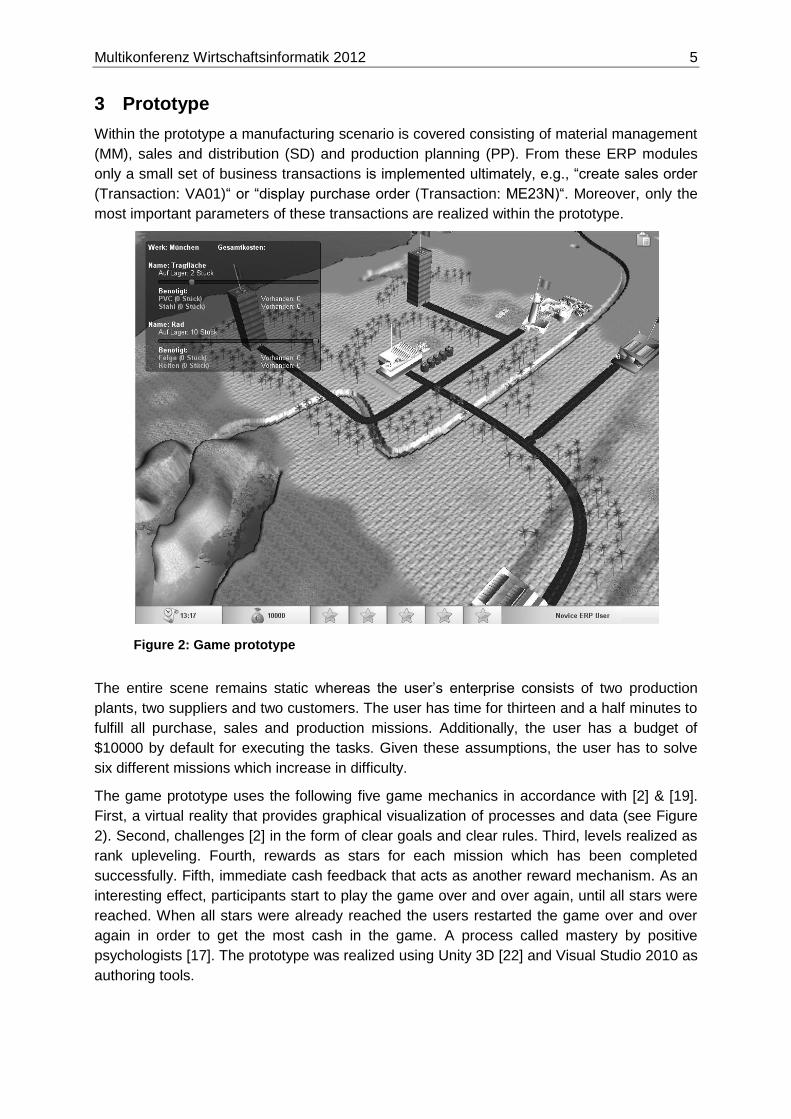
3 Prototype
Within the prototype a manufacturing scenario is covered consisting of material management
(MM), sales and distribution (SD) and production planning (PP). From these ERP modules
only a small set of business transactions is implemented ultimately, e.g., “create sales order
(Transaction: VA01)“ or “display purchase order (Transaction: ME23N)“. Moreover, only the
most important parameters of these transactions are realized within the prototype.
Figure 2: Game prototype
The entire scene remains static whereas the user’s enterprise consists of two production
plants, two suppliers and two customers. The user has time for thirteen and a half minutes to
fulfill all purchase, sales and production missions. Additionally, the user has a budget of
$10000 by default for executing the tasks. Given these assumptions, the user has to solve
six different missions which increase in difficulty.
The game prototype uses the following five game mechanics in accordance with [2] & [19].
First, a virtual reality that provides graphical visualization of processes and data (see Figure
2). Second, challenges [2] in the form of clear goals and clear rules. Third, levels realized as
rank upleveling. Fourth, rewards as stars for each mission which has been completed
successfully. Fifth, immediate cash feedback that acts as another reward mechanism. As an
interesting effect, participants start to play the game over and over again, until all stars were
reached. When all stars were already reached the users restarted the game over and over
again in order to get the most cash in the game. A process called mastery by positive
psychologists [17]. The prototype was realized using Unity 3D [22] and Visual Studio 2010 as
authoring tools.
6 Philipp Herzig, Susanne Strahringer, Michael Ameling
4 Empirical Evaluation
The following section characterizes the user study and presents the research results.
4.1 General Setup
The user study lasted two months from 15.05.2011 until 15.07.2011. Within this time frame
112 responses were collected.
Participants were mainly academic personnel, but also novice ERP users, SAP employees
and long-term SAP users were interviewed. The questionnaire was realized via online-
Fragebogen [21] and was administered directly after using the game prototype and SAPGUI.
The following settings were used in SmartPLS [20] for evaluation. First, the PLS algorithm
was applied with path weighting scheme, 1000 maximal iterations and as quit criterion.
The output of this procedure are path weights, quality measures, such as average variance
extracted (AVE), Cronbach’s alpha (CR), , Stone-Geisser’s , inner/outer loadings, item
cross loadings and construct correlations. Second, bootstrapping was applied to retrieve
significance values by running the algorithm with 112 cases and 1000 randomly selected
subsamples. The output of this procedure are t-values which are comparable against a
student’s t-distribution on a 5%(one-side)/10%(two-side) level. The critical value of the t-
distribution with 112 degrees of freedom on one side is 1.659 which must be exceeded by
the t-value of the respective path weight in order to be significant. Third, a blindfolding
procedure was applied to determine Stone-Geisser’s measures with an omission distance
of seven.
4.2 Descriptive Statistics
In order to characterize the sample we provide the exogenous variables age (AGE), SAP
experience (SAPEXP), Game experience (GEXP) and Count of rewards (COR). The average
respondent in the sample is 25.45 years old, has slightly more experience in strategy games
(3.018) than in SAP ERP (2.786) and achieved 3.786 stars in the game prototype.
There are also significant correlations (Pearson’s correlation: ) between these variables
leading to the following observations. First, the older the participant the lower is the
experience with strategy games, such as Anno ( ). Second, the older the
participant is the higher is the experience with SAP ( ). Third, men have much
higher experience in strategy games than women ( ). Fourth, the higher the
experience in games the more stars does one achieve in the prototype ( ).
Consequently, a positive correlation between gender and rewards exists, that is, men
achieve more stars than women ( )
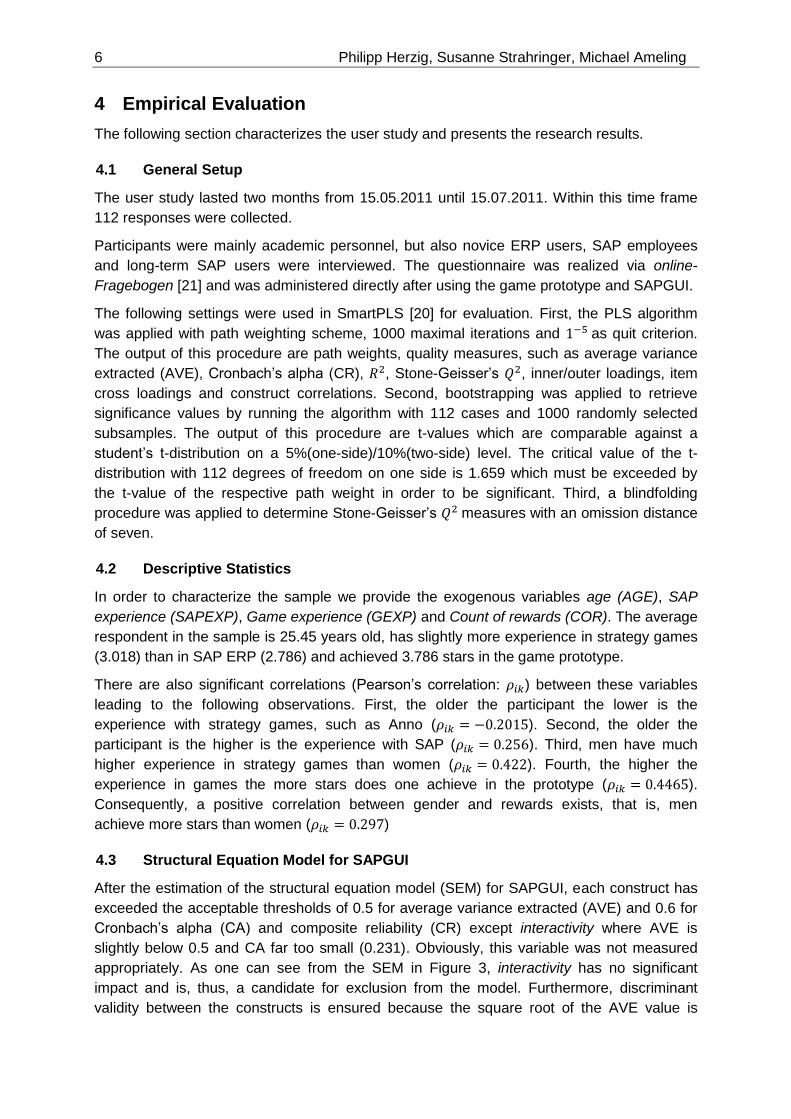
4.3 Structural Equation Model for SAPGUI
After the estimation of the structural equation model (SEM) for SAPGUI, each construct has
exceeded the acceptable thresholds of 0.5 for average variance extracted (AVE) and 0.6 for
Cronbach’s alpha (CA) and composite reliability (CR) except interactivity where AVE is
slightly below 0.5 and CA far too small (0.231). Obviously, this variable was not measured
appropriately. As one can see from the SEM in Figure 3, interactivity has no significant
impact and is, thus, a candidate for exclusion from the model. Furthermore, discriminant
validity between the constructs is ensured because the square root of the AVE value is
Multikonferenz Wirtschaftsinformatik 2012 7
substantially higher than each inter-construct correlation. Additionally, each item loads on its
intended factor within a confirmatory factor analysis (CFA).
Figure 3: Estimated SEM for SAPGUI1
Moreover, FL, PEOU and BI are showing an acceptable fit value. However, the of PU is
rather low. Nevertheless, this is acceptable for further considerations since PU is only
determined by FL effects directly which is, on the one hand, usually a weak predictor and, on
the other hand, other important antecedents of PU, such as image or job relevance, were
omitted from the research model. More importantly, the prediction quality is above zero and
over 20% better than simple mean predictions. Predicting BI shows even an improvement of
37,2%. Hence, the predictive power is acceptable according to the literature.
The relationships IA-FL and FL-PU are not significantly different from zero, thus, they are
omitted from further considerations. Consequently, also hypotheses H2a and H5a have to be
rejected. Moreover, telepresence is the strongest predictor of FL in SAPGUI (0.461) besides
interface which explains 19.9% of flow’s variance. Thus, hypotheses H1a and H3a are
confirmed within this study. Furthermore, enjoyment is the strongest antecedent of PEOU
(63.1%) and, therefore, confirms hypothesis H7a. Also flow has a positive impact on PEOU
(17.7%) whereby H4a can be confirmed. In accordance with the TAM literature, PU explains
around 50% of the variance in BI and PEOU explains around 25% which gives support to
H8a and H10a. Additionally, PEOU positively impacts PU (0.309) too, confirming hypothesis
H9a. This is an important observation, because under the assumption that the prototype
improves PEOU only, the improvement must be very strong to improve BI finally. Besides PU
and PEOU, also FL shows a small but significant direct effect on BI (15.5%). Therefore, also
H6a is confirmed.
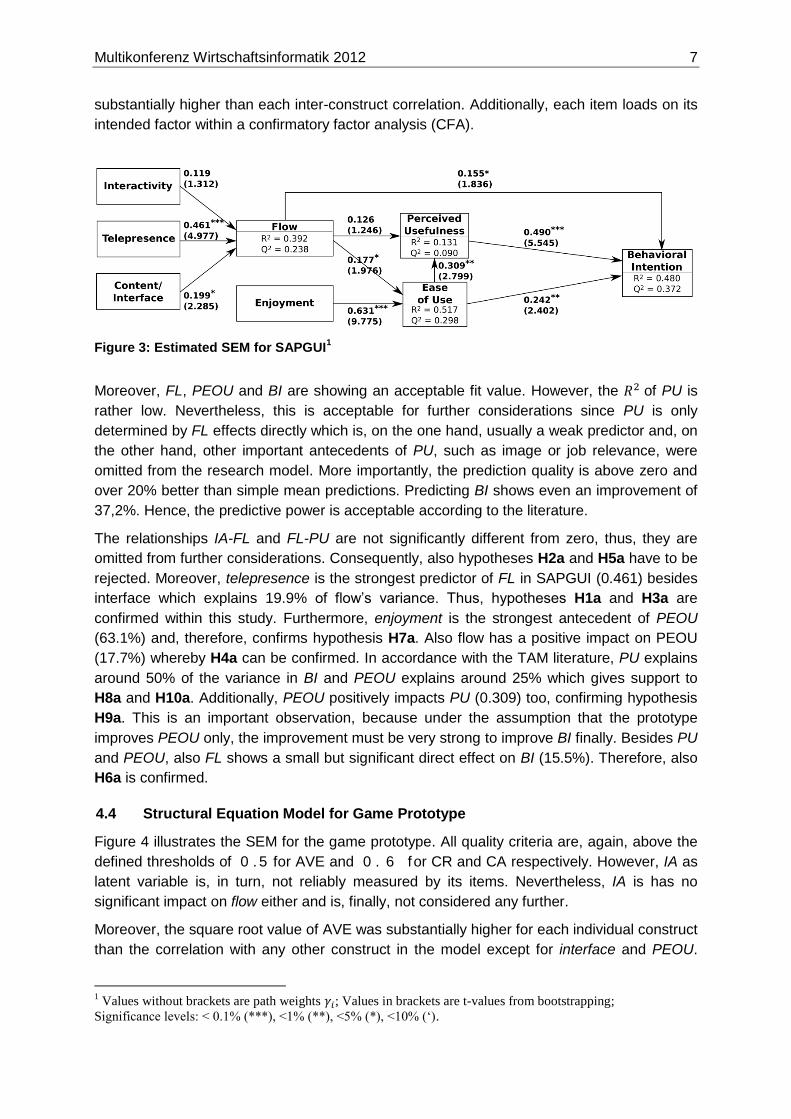
4.4 Structural Equation Model for Game Prototype
Figure 4 illustrates the SEM for the game prototype. All quality criteria are, again, above the
defined thresholds of 0 . 5 for AVE and 0 . 6 for CR and CA respectively. However, IA as
latent variable is, in turn, not reliably measured by its items. Nevertheless, IA is has no
significant impact on flow either and is, finally, not considered any further.
Moreover, the square root value of AVE was substantially higher for each individual construct
than the correlation with any other construct in the model except for interface and PEOU.
1 Values without brackets are path weights ; Values in brackets are t-values from bootstrapping;
Significance levels: < 0.1% (***), <1% (**), <5% (*), <10% (‘).
8 Philipp Herzig, Susanne Strahringer, Michael Ameling
Obviously, the items are very similar and we, thus, argue that in the game prototype both
constructs are influencing each other mutually. However, the rest of the constructs are
accounting for good discriminant validity.
Furthermore, all items are loading on their intended factors, except IA. Only one item loads
on the IA component leading to a one item scale. However, as mentioned before, IA will be
excluded from the model ultimately because the effect on FL is not significant in the
structural equation model.
Figure 4: Estimated SEM for Game Prototype
As for SAPGUI, values are above moderate and strong explanatory power. Moreover, the
predictive power of the model can be considered as very good because, e.g., BI is 42.3%
better predicted than with mean prediction.
One can see that the relationships IA-FL, FL-PEOU and FL-BI are not significant in the
model and are, thus, omitted from further considerations. Hence, the hypotheses H2a, H4a
and H6a are rejected. As well as for SAPGUI, TP is the strongest predictor of FL (0.432)
besides IF with 24.8%. Thus, hypotheses H1a and H3a are confirmed. Furthermore, ENJ is
the strongest predictor of PEOU which supports hypothesis H7a. Additionally, PU (0.462)
nearly doubles the effect of PEOU (0.286) on BI. Therefore, also hypotheses H8a and H10a
are true. Finally, PEOU explains 33.9% of PU’s variance because of PEOU’s instrumental
value, thus, supporting H9a. It is interesting to note, that FL has a strong impact on PU
(0.408) leading to a confirmation of H5a and a substantially higher of PU.
4.5 Analysis of Variance
Ultimately, the latent variables should be compared in order to show if the game prototype
yields improvements. Therefore, Table 2 presents means and standard deviations of the final
factor scores. In addition the p-value of the Jarque-Bera test is given to show that not all
variables are normally distributed. Although the assumption of normality is rejected, ANOVA
provides a robust test decision when compared with the outcome of the Wilcoxon-Whitney-
Mann test (U-test) which has no distributional assumptions. Both tests are rejecting the null-
hypothesis of equal means.
Factor Mean S.D. Jarque-Bera (p-value) ANOVA (p-value) U-Test (p-value)
IASAPGUI
IAGame
IFSAPGUI
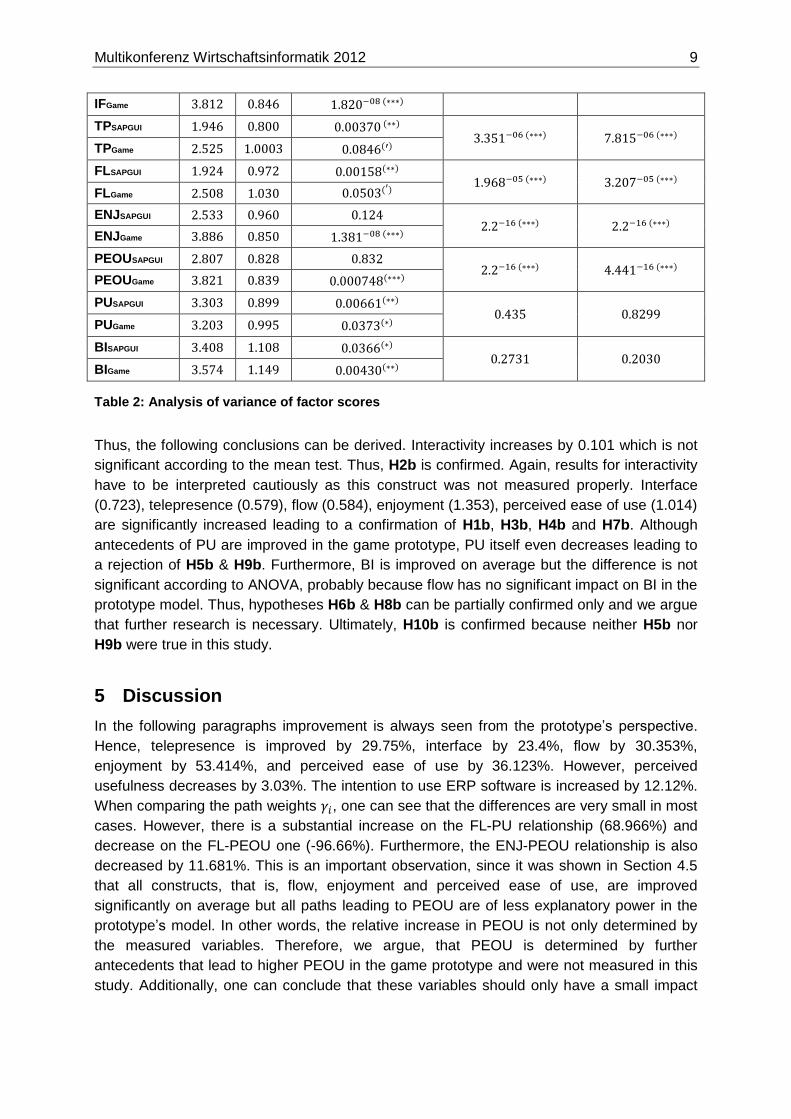
Multikonferenz Wirtschaftsinformatik 2012 9
IFGame
TPSAPGUI
TPGame
FLSAPGUI
FLGame
ENJSAPGUI
ENJGame
PEOUSAPGUI
PEOUGame
PUSAPGUI
PUGame
BISAPGUI
BIGame
Table 2: Analysis of variance of factor scores
Thus, the following conclusions can be derived. Interactivity increases by 0.101 which is not
significant according to the mean test. Thus, H2b is confirmed. Again, results for interactivity
have to be interpreted cautiously as this construct was not measured properly. Interface
(0.723), telepresence (0.579), flow (0.584), enjoyment (1.353), perceived ease of use (1.014)
are significantly increased leading to a confirmation of H1b, H3b, H4b and H7b. Although
antecedents of PU are improved in the game prototype, PU itself even decreases leading to
a rejection of H5b & H9b. Furthermore, BI is improved on average but the difference is not
significant according to ANOVA, probably because flow has no significant impact on BI in the
prototype model. Thus, hypotheses H6b & H8b can be partially confirmed only and we argue
that further research is necessary. Ultimately, H10b is confirmed because neither H5b nor
H9b were true in this study.
5 Discussion
In the following paragraphs improvement is always seen from the prototype’s perspective.
Hence, telepresence is improved by 29.75%, interface by 23.4%, flow by 30.353%,
enjoyment by 53.414%, and perceived ease of use by 36.123%. However, perceived
usefulness decreases by 3.03%. The intention to use ERP software is increased by 12.12%.
When comparing the path weights , one can see that the differences are very small in most
cases. However, there is a substantial increase on the FL-PU relationship (68.966%) and
decrease on the FL-PEOU one (-96.66%). Furthermore, the ENJ-PEOU relationship is also
decreased by 11.681%. This is an important observation, since it was shown in Section 4.5
that all constructs, that is, flow, enjoyment and perceived ease of use, are improved
significantly on average but all paths leading to PEOU are of less explanatory power in the
prototype’s model. In other words, the relative increase in PEOU is not only determined by
the measured variables. Therefore, we argue, that PEOU is determined by further
antecedents that lead to higher PEOU in the game prototype and were not measured in this
study. Additionally, one can conclude that these variables should only have a small impact
10 Philipp Herzig, Susanne Strahringer, Michael Ameling
on PEOU in SAPGUI. Thus, future research needs to identify additional possible antecedents
of PEOU when TAM-based models are applied to applications with game mechanics.
On the other side, all path weights leading to PU are improved (8.85% for PEOU-PU and
68.966% for FL-PU) in the prototype’s model. In addition, also the antecedents of PU are
increased as shown above. However, as illustrated in Section 4.5, PU decreases slightly on
the construct level when both solutions are compared with each other. Hence, there exists an
obvious contradiction. Therefore, we argue, that other factors which were not measured in
this study possibly have a strong negative impact on PU in the prototype’s model.
Besides the quantitative feedback from the questionnaire, individual qualitative feedback was
collected. Especially, participants were asked why they have diminished or augmented PU
and PEOU respectively. The following list gives an overview of qualitative feedback why
perceived usefulness was reduced. First, participants cannot imagine that an entire ERP
solution or parts of it are realized with such a gamification approach. Second, participants did
not understand how gamification should improve their performance because the evaluation
period was too short, the given scenario not appropriate/understandable or participants were
not fully concentrated on their tasks due to the time limitations of the study. Third,
participants, especially from the areas of finance and accounting, were afraid of the three
dimensional virtual reality because they would expect a spreadsheet format as graphical
frontend. It is interesting to denote that these reasons can be derived mainly out of the
assumptions and limitations of the study. It seems obvious, that a longer study, based on a
sample closer to the target group with an improved prototype in a real business context
should circumvent the negative points outlined above. Moreover, a parallel with antecedents
of PU from the TAM3 model can be drawn. In this model, antecedents of perceived
usefulness are subjective norm, image, job relevance, output quality and result
demonstrability [24]. We argue, that job relevance which is defined as “the degree to which
an individual believes that the target system is applicable to his or her job” [25] and output
quality which is defined as “the degree to which an individual believes that the system
performs his or her job tasks well” [25] might have the strongest negative impact on PU
within the prototype’s model according to the qualitative feedback given above. Of course,
other factors that are not validated in TAM3 or any other model may have a negative
influence as well.
Regarding the explanatory gap in PEOU, TAM3 can be used again to propose further
research questions. Perceived ease of use is not only determined by enjoyment or flow as
system dependent antecedents but also by user dependent constructs, such as computer
self-efficacy, perception of external control, computer anxiety or computer playfulness [24].
We argue, that especially factors like computer self-efficacy or computer playfulness which
are intrinsic motivators for using any kind of new system are very likely high in our sample
since the average age of the participants is relatively low (25.45).
Overall, we showed that the presented model provides a good start to explain usage
intentions, but it needs enhancements as argued above when applied to applications with
game mechanics (RQ1). Due to the exploratory nature of our research and the application of
the proposed model in order to identify differences while comparing two systems this
drawback does not pose threats to the validity of our answers to RQ2. We clearly showed
that all of the constructs improved through gamification, most of them significantly. Therefore
our study strongly encourages further investigation of ERP gamification and its outcomes.
Multikonferenz Wirtschaftsinformatik 2012 11
6 Outlook
In this paper we have presented a theoretical model for the evaluation of our ERP
gamification prototype. We have shown that gamification objectively yields improvements in
factors, such as software enjoyment, flow experience or perceived ease of use. However, the
behavioral intention to use the prototype has not increased significantly because perceived
usefulness decreases due to the presented limitations of the user study. Hence, we argue
that the same effects should be estimated with an improved prototype evaluated in a larger
work setting. Moreover, we propose to investigate the effects within a larger theoretical
framework, such as the job-demands resource model (e.g., [2],[10]) because flow and
enjoyment which are substantially increased by gamification have a strong positive effect on
work engagement. Hence, we hypothesize that gamification can increase quality on the job
and improve even organizational outcomes, such as job performance or organizational
commitment.
7 References
[1] Argawal, R., & Karahanna, E. (2000). Time Flies When You’re Having Fun: Cognitive
Absorption and Beliefs About Information Technology Usage. MIS Quarterly 24(4):665–
694.
[2] Bakker, A. B., & Demerouti, E. (2007). The Job Demand-Resource Model: State of the
Art. Journal of Managerial Psychology 22:309–328.
[3] Bunchball Inc. (2010). Gamification 101: An Introduction to the Use of Game Dynamics
to Influence Behavior. http://www.bunchball.com/gamification/ gamification101.pdf.
Retrieved on 24.07.2011.
[4] Choi, D., Kim, H., & Kim, J. (2007). ERP Training With a Web-Based Electronic Learning
System: The Flow Theory Perspective. International Journal of Human-Computer
Studies 65:223–243.
[5] Csikszentmihalyi, M. (2008). Flow: The Psychology of Optimal Experience. Harper
Perennial Modern Classics, New York.
[6] Davis, F. D. (1989). Perceived Usefulness, Perceived Ease of Use, and User
Acceptance of Information Technology. MIS Quarterly 13:319–339.
[7] Davis, F. D., Bagozzi, R. P., & Warshaw, P. R. (1989). User Acceptance of Computer
Technology: A Comparison of Two Theoretical Models. Management Science
35(8):982–1003.
[8] DeLone, W. H., & McLean, E. R. (1992). Information System Success: The Quest for the
Dependent Variable. Information Systems Research 3(1):60–95.
[9] DeLone, W. H., & McLean, E. R. (2003). The DeLone and McLean Model of IS Success:
A Ten-Year Update. Journal of Mngt. Information Systems 19(4):9–30.
[10] Demerouti, E., Bakker, A. B., Nachreiner, F., & Schaufeli, W. B. (2001). The Job
Demands-Resource Model of Burnout. Journal of Applied Psychology 86:499–512.
[11] Deterding, S., Sicart, M., Nacke, L., O’Hara, K., & Dixon, D. (2011, May). Gamification:
Using Game Design Elements in Non-Gaming Contexts. ACM, Vancouver, Canada.
12 Philipp Herzig, Susanne Strahringer, Michael Ameling
[12] Dromgoole, S. (2011). http://www.scribd.com/doc/13714815/Sean-Dromgoole-CEO-
Some-Research-Gamevision; Retrieved on 27.07.2011.
[13] Fang, X., & Zhao, F. (2010). Personality and enjoyment of computer game play.
Computer in Industry 61:342–349.
[14] Herzig, P. (2011): Toward a Theoretical Model for Evaluation and Explanation of ERP
User Experience: Gamification versus Tradition. Research Seminar, Chair of Information
Systems, esp. IS in Manufacturing and Commerce, Technische Universität Dresden.
[15] Hoffman, D. L., & Novak, T. P. (2009). Flow online: Lessons Learned and Future
Prospects. Journal of Interactive Marketing 23(1):23–34.
[16] Hsu, C.-L., & Lu, H.-P. (2003). Why Do People Play On-Line Games? An Extended TAM
with Social Influences and Flow Experience. Information & Management 41:853–868.
[17] McGonigal, J. (2011). Reality is Broken: Why Games Make Us Better and How They
Can Change the World. New York: The Penguin Press.
[18] Novak, T., Hoffmann, D., & Yung, Y. (2000). Measuring the Customer Experience in On-
line Environments: A Structural Modeling Approach. Marketing Science 19(1):22–42.
[19] Reeves, B., & Read, J. L. (2009). Total Engagement: Using Games and Virtual Worlds
to Change the Way People Work and Businesses Compete. Boston, MA: H. B. Press.
[20] Ringle, C. M., Wende, S., & Will, S. (2011). SmartPLS 2.0 (M3) Beta. Available from
http://www.smartpls.de.
[21] SoSciSurvey (2011). oFb – der onlineFragebogen. Available from https://www.sosci-
survey.de; Retrieved on 15.05.2011.
[22] Unity Technologies. (2011). Unity 3.1. http://unity3d.com/. Retrieved on 08.08.2011.
[23] Venkatesh, V. (2000). Determinants of Perceived Ease of Use: Integrating Control,
Intrinsic Motivation, and Emotion into the Technology Acceptance Model. Information
Systems Research 11(4):342–365.
[24] Venkatesh, V., & Bala, H. (2008). Technology Acceptance Model 3 and a Research
Agenda on Interventions. Decision Sciences 39(2):273–315.
[25] Venkatesh, V., & Davis, F. D. (2000). A Theoretical Extension of the Technology
Acceptance Model: Four Longitudinal Field Studies. Mngt. Science 46(2):186–204.
[26] Venkatesh, V., Morris, M. G., Davis, G. B., & Davis, F. D. (2003). User Acceptance of
Information Technology: Toward a Unified View. MIS Quarterly 27(3):425–478.
[27] Wang, Y. S. (2003). Assessment of Learner Satisfaction With Asynchronous Electronic
Learning Systems. Information & Management 41:75–86.
[28] Wang, Y.-S. (2008). Assessing E-Commerce Systems Success: A Respecification and
Validation of the DeLone and McLean Model of IS Success. IS Journal 18:529–557.
[29] Wixom, B. H., & Todd, P. A. (2005). A Theoretical Integration of User Satisfaction and
Technology Acceptance. Information Systems Research 16(1): 85–102.
[30] Wu, J., Li, P., & Rao, S. (2008). Why They Enjoy Virtual Game Worlds? An Empirical
Investigation. Journal of Electronic Commerce Research 9( 3):219–230.