GAMIFICATION IN SURVEY RESEARCH - c.ymcdn.com · The concepts presented in this presentation are...
23
The concepts presented in this presentation are the property of the presenters. Duplication or dissemination of the information without the express written consent of the presenters is prohibited. GAMIFICATION IN SURVEY RESEARCH: Do The Results Support The Evangelists? KARTIK PASHUPATI, Ph.D. Research Director, Research Now LISA WEBER-RALEY Research Director, Greenwald & Associates
Transcript of GAMIFICATION IN SURVEY RESEARCH - c.ymcdn.com · The concepts presented in this presentation are...

The concepts presented in this presentation are the property of the presenters.
Duplication or dissemination of the information without the express written
consent of the presenters is prohibited.
GAMIFICATION IN SURVEY RESEARCH: Do The Results Support The Evangelists?
KARTIK PASHUPATI, Ph.D. Research Director, Research Now
LISA WEBER-RALEY Research Director, Greenwald & Associates

Recap: Ongoing concerns about survey research
Declining response rates
Higher abandonment rates
Disengaged respondents
Poor quality open-ended responses
Dissatisfied panelists
Data quality concerns

Some more emerging concerns
OVERALL DECLINE IN ATTENTION
SPAN
INCREASING USE OF MOBILE DEVICES
POOR DATA QUALITY

Proposed solution: GAMIFICATION G
amif
icat
ion
Greater volume of open-ended feedback
Richer responses
Engagement/ Enjoyment
Lower abandonment rates
Time spent on survey
Greater Attentiveness Better data quality

What is gamification?
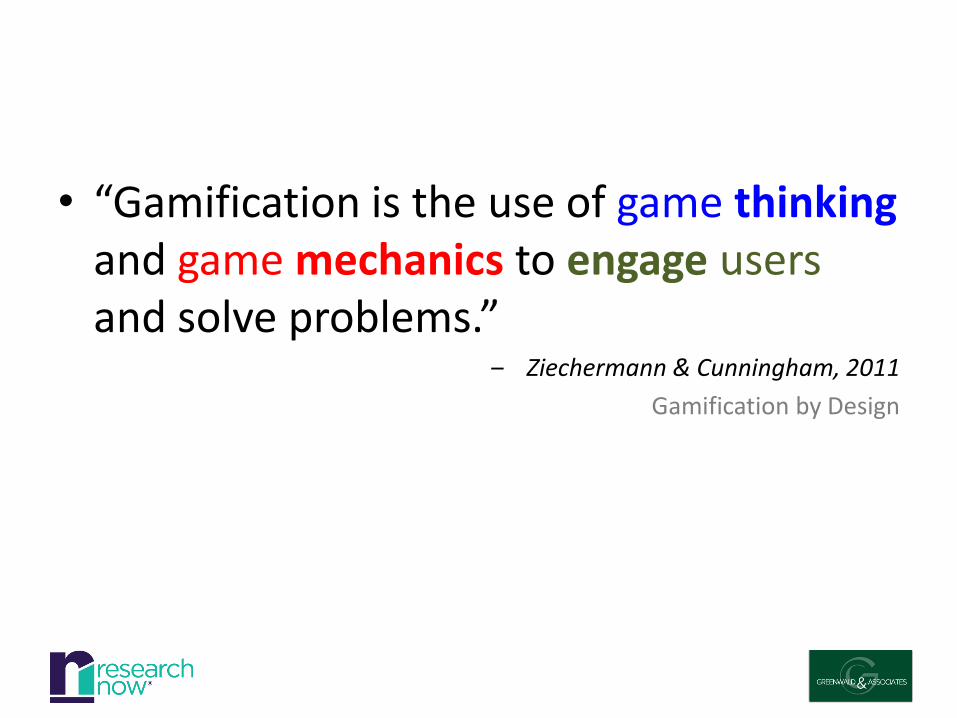
• “Gamification is the use of game thinking and game mechanics to engage users and solve problems.”
‒ Ziechermann & Cunningham, 2011
Gamification by Design

The elements of game mechanics
1. A back story
2. A game-like aesthetic
3. Rules for play and advancement
4. A challenge
5. Rewards
Sources: Schell (2008), McGonigall (2011), Downes-LeGuin et al. (2012)

“I think people sometimes are under the impression that we’re talking about creating video games, like Farmville or Modern Warfare 3, or that the process is complicated and requires a lot of software development.
On the contrary, gamification can be as simple as
changing the way questions are worded.” ‒ Jon Puleston, 2012
What It Is and What It Is Not: 8 Things Everyone is Asking about Gamification

Improving questions through game elements (Puleston)
• Questions should be framed in a way that makes respondents want to answer them.
1. Question style
• Rules can be used to transform almost any task into a game.
2. Rules
• Even ordinary questions can have an element of competition added to them, such as “What are your favorite restaurants? List as many as you can in 60 seconds.”
3. Competition and reward
• Simply replacing words with images and graphics where possible can result in better participation rates.
4. Interactive elements

So… does it work?

Evidence from the literature-1
Gam
ific
atio
n
Volume of feedback Supported
Time spent on survey Supported
Enjoyment Supported
Character of data Supported
Perceived Ease of use Rejected
Perceived control Rejected
Concentration focus Rejected
Completion rate Rejected
‒ Koenig-Lewis, Marquet &Palmer (2013) The effects of gamification on market research engagement and response.

Evidence from the literature-2
Text only survey
Decoratively visual survey
Functionally visual survey
Gamified survey
Total
Interesting 5.2 5.4 5.7 6.0 5.6
Easy to read 6.1 6.3 6.4 6.2 6.2
Easy to answer 5.99 6.0 6.3 6.3 6.1
How fast? (Self-perceived speed)
5.3 5.3 5.4 5.0 5.4
Enjoyment 5.0 5.3 5.4 5.7 5.4
Minutes spent in survey 12.7 13.0 13.8 15.1 13.7
Inconsistent response (%) 18 22 22 20 20
Trap failure (%) 13 12 10 13 12
Straight-lined 2 or more grids (%)
17 20 17 20 18
‒ Downes-Le Guin, Baker, Mechling & Ruyle (2012) Myths and realities of respondent engagement in online surveys

Should we trash gamification completely?

• “The keys to greater survey engagement lie not in graphical enhancements or greater interactivity, but… in dealing more effectively with the
fundamental components of respondent burden.
• Nevertheless, creating a more enjoyable survey
experience is still a worthwhile goal even if it does not lead to all the benefits sometimes claimed.”
‒ Downes-Le Guin, Baker, Mechling & Ruyle (2012) Myths and realities of respondent engagement in online surveys

The College Experiences Survey
Conducted by Greenwald & Associates
Sample from Research Now
Sample size n=3547 respondents
Randomly assigned to one of four types of survey.
• Proposed questionnaire was long (estimated at 25 minutes) and wanted to keep respondents engaged
• Believed gamification elements would appeal to college students
• Client was open to the experiment
Survey chosen for gamification because:

The four survey types
1. Text only
• Standard text-based survey questions
2. Photo breaks
• Not really a game, but an effort to provide visual breaks in-between survey sections. Calm photographs were shown between sections.
3. Letter Finding Game
• Letter hunt game: Find letters at various stages in survey, unscramble at the end to reveal answer.
4. Avatar
• Choose your avatar, customize him/her. Static avatar will accompany respondent through survey.

Respondents assigned to the photo breaks saw 4 photos between sections of the survey.

Those in the letter game unscrambled 6 letters for the phrase “you win”.

Respondents chose one of four avatars to accompany them through the survey

Results from the college experiences survey
Plain text (n=885) Avatar (n=887) Letter find game (n=892)
Photo breaks (n=883)
Time spent in seconds (mean) 5176.7 5538.8 7335.1 8289.3
Time spent in seconds (median) 1347.0 1431.0 1573.0 1329.0
Percent of respondents who straight-lined 3 sets of questions
4.0% 3.8% 3.3% 3.5%
Ability to maintain concentration on survey questions (1=Not at all well; 5=Extremely well)
3.7a 3.7a 3.8b 3.7a,b
Overall enjoyability of survey (1=Not at all enjoyable; 5=Extremely enjoyable)
4.0a,b 4.0a,b 4.0a 4.1b
Control variables (scores on 14 personality and attitude variables were compared to see if there were differences across methods due to measurement artifacts). No significant differences were found.

Comments on results
No apparent differences in data quality
• Longest median interview length
• Rated ability to concentrate slightly higher
Letter-find game:
• Longest mean interview length, but comparatively short median length. Perhaps some used this as a true break to step away.
• Survey was slightly more enjoyable than for the letter-find respondents.
Picture breaks:

Conclusions and directions for future research
Representativeness?
Interest level of topic?
Mobile devices pose challenges implementing gamification
• Data usage concerns for images
• Inability to jot down letters for letter find game

Q&A