GAME 1 • AUGUST 31, 2013 • 9 P.M. ET (7 P.M. MT ...€¦ · Spruce Pine WPWT-AM 870 ... ........
39
AT No. 12 APPALACHIAN STATE (8-4, 6-2 SoCon in ‘12) Location: Boone, N.C. Nickname: Mountaineers Conference: Southern Head Coach: Scott Satterfield (Appalachian State, 1996) No. 20 MONTANA (5-6, 3-5 Big Sky in ‘12) Location: Missoula, Mont. Nickname: Grizzlies Conference: Big Sky Head Coach: Mick Delaney (Western Montana, 1964) 2013 APPALACHIAN STATE FOOTBALL GAME 1 • AUGUST 31, 2013 • 9 P.M. ET (7 P.M. MT) • MISSOULA, MONT. • WASHINGTON-GRIZZLY STADIUM (25,217) ON THE AIR TV: Max Media (Montana) Chris Byers (play-by-play) John Edwards (analyst) Shaun Rainey (sideline reporter) Radio: Appalachian IMG Sports Network David Jackson (play-by-play) Steve Brown (analyst) Randy Jackson (sideline reporter) Steve Zushin (network engineer) Aaron Brunk (scoreboard host) Appalachian IMG Sports Network Affiliates Carrying This Week’s Game WKBC-FM 97.3 ..............................North Wilkesboro, Charlotte, Winston-Salem, Hickory, High Country Flagship Station of the Appalachian IMG Sports Network WATA-AM 1450........................................... Boone, Blowing Rock WCOG-AM 1320 ........................... Greensboro, Winston-Salem WMFR-AM 1230 .................................... High Point, Greensboro WSML-AM 1200..................................... Burlington, Greensboro WCMC-FM 99.9 HD-3 ................ Raleigh, Durham, Chapel HIll WZGM-AM 1350................................ Black Mountain, Asheville WTOE-AM 1470 ............................................................Spruce Pine WPWT-AM 870 ................ Bristol, Tenn./Va., Johnson City, Tenn. WZGV-AM 730....................Charlotte, Rock Hill, S.C., Salisbury WDNC-AM 620.....................................................Durham, Raleigh WHKP-AM 1450...................................................... Hendersonville WAZZ-AM 1490 ............................................................. Fayetteville WLON-AM 1050...............................................................Lincolnton Live Internet Streaming............................. appstatesports.com ONLINE Live Video: ESPN3 Live Audio: appstatesports.com Live Stats: gogriz.com SERIES HISTORY Series Record: .................................. Montana leads, 2-1 In Boone: .......................... Appalachian State leads, 1-0 In Missoula: ....................................... Montana leads, 2-0 Last Meeting: ......................App State 35, Montana 27 Sept. 8, 2012 (Boone, N.C.) APPALACHIAN STATE’S LAST TIME OUT Vs. Illinois State:........................................... L, 38-37 (OT) NCAA Division I Football Championship 2nd Round Date: ................................................................... Dec. 1, 2012 Location:.............. Boone, N.C. (Kidd Brewer Stadium) Total Offense: .................................................................. 434 Rushing: .................................................................... 51 Passing: ................................................................... 383 Turnovers: ................................................................... 1 Total Defense: ................................................................. 418 Rushing: .................................................................... 96 Passing: ................................................................... 322 Takeaways: ................................................................. 0 Passing Leader: J. Londry-Jackson............. 33-45-1, 373 yds., 2 TD Rushing Leaders: Steven Miller...................................... 17 att., 61 yds. Rod Chisholm................................ 2 att., 1 yd., 1 TD Receiving Leaders: Sean Price ............................. 13 rec., 167 yds., 2 TD Andrew Peacock ...................11 rec., 79 yds., 1 TD Defensive Leaders: Jeremy Kimbrough ............. 15 TT, 3.5 TFL, 1 sack Troy Sanders .............................. 11 TT, 1 TFL, 2 PBU MATCHUP AT A GLANCE APPALACHIAN STATE vs. MONTANA 1899.........................................................................................Founded ........................................................................................ 1893 17,589 .................................................................................. Enrollment ...................................................................................15,642 Black and Gold....................................................................... Colors ...................................................... Copper, Silver and Gold Kidd Brewer (24,050) .............................................. Stadium (Capacity)................................Washington-Grizzly (25,217) Scott Satterfield (Appalachian, 1996) ......................Head Coach ................ Mick Delaney (Western Montana, 1964) First season .......................................................... Coach’s Record at School.......................................... 5-6 (Second season) Same ........................................................................ Coach’s Overall Record.................................... 10-17-1 (Fourth season) 8-4 ................................................................................2012 Overall Record ................................................................................5-6 6-2 (t-1st) .................................................. 2012 Conference Record (Standing) .................................................. 3-5 (t-8th) No. 9 (The Sports Network), No. 8 (coaches) .. 2012 Final National Ranking................................................................... None Multiple Spread.............................................................. Basic Offense................................................................................ Pro Set 32.9 (2nd/23rd)........................ 2012 Points Per Game (Conference/National Rank) ..................... 31.6 (6th/t-27th) 170.2 (4th/39th) ............. 2012 Rushing Yards Per Game (Conference/National Rank) .............235.7 (2nd/11th) 293.7 (2nd/14th) ............. 2012 Passing Yards Per Game (Conference/National Rank)............ 216.5 (11th/55th) 464.0 (2nd/9th)................... 2012 Total Yards Per Game (Conference/National Rank).................. 452.2 (1st/11th) 3-4 ...................................................................................... Basic Defense .......................................................................................4-3 29.3 (6th/77th)............... 2012 Points Allowed Per Game (Conference/National Rank) ............... 26.7 (5th/60th) 190.5 (6th/94th) .... 2012 Rushing Yards Allowed Per Game (Conference/National Rank)......... 92.5 (1st/2nd) 222.5 (8th/73rd) .... 2012 Passing Yards Allowed Per Game (Conference/National Rank) 288.3 (13th/120th) 413.1 (8th/90th) ........2012 Total Yards Allowed Per Game (Conference/National Rank) ........380.9 (4th/66th) 2013 SCHEDULE/RESULTS Sept. 7 North Carolina A&T 6 p.m. Appalachian State is 61-19-2 all-time in home openers, including wins in 10 of last 11 Sept. 21 at Elon* 6 p.m. Mountaineers’ SoCon/FCS farewell tour begins against Elon, who it has not lost to since 1964 Sept. 28 Charleston Southern 3:30 p.m. Appalachian State is 42-15-1 all-time versus current members of Big South Conference Oct. 5 at The Citadel* 2 p.m. The Citadel stunned Appalachian, 52-28, last season but Apps have won 17 of last 19 in series Oct. 12 Samford* 3:30 p.m. Appalachian State is the only SoCon team Samford has not beaten since joining league in ‘08 Aug. 31 at Montana (ESPN3) 9 p.m. ET Longtime NCAA Division I FCS powers square off for the third time in five seasons Oct. 26 Georgia Southern* (ESPN3) 3:30 p.m. Nation’s No. 1 team has been upset the last three times these future Sun Belt rivals have squared off Nov. 2 Chattanooga* 3:30 p.m. App State has won 25 of last 28 over Mocs, including 14-straight in Boone (last UTC win at KBS - 1983) Nov. 9 at Georgia (TV TBA) TBA Apps boast seven wins over FBS/I-A opponents since 1983 (most recent: 34-32 at No. 5 Michigan, ‘07) Nov. 16 at Wofford* 1:30 p.m. Wofford is only SoCon team since 2002-03 to post consecutive wins over App State (‘02-03 & ‘11-12) Nov. 23 Western Carolina* 3:30 p.m. Appalachian State has won eight-straight and 26 of last 28 Battles for the Old Mountain Jug Oct. 19 at Furman* 1:30 p.m. Appalachian has won 10 of the last 12 meetings versus longtime rival Furman
Transcript of GAME 1 • AUGUST 31, 2013 • 9 P.M. ET (7 P.M. MT ...€¦ · Spruce Pine WPWT-AM 870 ... ........
AT
No. 12 APPALACHIAN STATE (8-4, 6-2 SoCon in ‘12)Location: Boone, N.C. Nickname: Mountaineers Conference: SouthernHead Coach: Scott Satterfield (Appalachian State, 1996)
No. 20 MONTANA (5-6, 3-5 Big Sky in ‘12)Location: Missoula, Mont. Nickname: Grizzlies Conference: Big SkyHead Coach: Mick Delaney (Western Montana, 1964)
2013 APPALACHIAN STATE FOOTBALLGAME 1 • AUGUST 31, 2013 • 9 P.M. ET (7 P.M. MT) • MISSOULA, MONT. • WASHINGTON-GRIZZLY STADIUM (25,217)
ON THE AIRTV: Max Media (Montana) Chris Byers (play-by-play) John Edwards (analyst) Shaun Rainey (sideline reporter)Radio: Appalachian IMG Sports Network David Jackson (play-by-play) Steve Brown (analyst) Randy Jackson (sideline reporter) Steve Zushin (network engineer) Aaron Brunk (scoreboard host)
Appalachian IMG Sports Network AffiliatesCarrying This Week’s Game
WKBC-FM 97.3 ..............................North Wilkesboro, Charlotte, Winston-Salem, Hickory, High Country
Flagship Station of the Appalachian IMG Sports NetworkWATA-AM 1450 ........................................... Boone, Blowing Rock WCOG-AM 1320 ........................... Greensboro, Winston-SalemWMFR-AM 1230 .................................... High Point, GreensboroWSML-AM 1200 ..................................... Burlington, GreensboroWCMC-FM 99.9 HD-3 ................Raleigh, Durham, Chapel HIllWZGM-AM 1350 ................................Black Mountain, AshevilleWTOE-AM 1470 ............................................................Spruce PineWPWT-AM 870 ................ Bristol, Tenn./Va., Johnson City, Tenn.WZGV-AM 730....................Charlotte, Rock Hill, S.C., SalisburyWDNC-AM 620 .....................................................Durham, RaleighWHKP-AM 1450 ......................................................HendersonvilleWAZZ-AM 1490 ............................................................. FayettevilleWLON-AM 1050 ...............................................................LincolntonLive Internet Streaming .............................appstatesports.com
ONLINELive Video: ESPN3Live Audio: appstatesports.comLive Stats: gogriz.com
SERIES HISTORYSeries Record: .................................. Montana leads, 2-1In Boone: ..........................Appalachian State leads, 1-0In Missoula: ....................................... Montana leads, 2-0Last Meeting: ......................App State 35, Montana 27 Sept. 8, 2012 (Boone, N.C.)
APPALACHIAN STATE’S LAST TIME OUTVs. Illinois State: ........................................... L, 38-37 (OT) NCAA Division I Football Championship 2nd RoundDate: ................................................................... Dec. 1, 2012Location: .............. Boone, N.C. (Kidd Brewer Stadium)Total Offense: ..................................................................434 Rushing: .................................................................... 51 Passing: ...................................................................383 Turnovers: ...................................................................1Total Defense: .................................................................418 Rushing: .................................................................... 96 Passing: ...................................................................322 Takeaways: .................................................................0Passing Leader: J. Londry-Jackson.............33-45-1, 373 yds., 2 TDRushing Leaders: Steven Miller ...................................... 17 att., 61 yds. Rod Chisholm ................................2 att., 1 yd., 1 TDReceiving Leaders: Sean Price ............................. 13 rec., 167 yds., 2 TD Andrew Peacock ...................11 rec., 79 yds., 1 TDDefensive Leaders: Jeremy Kimbrough .............15 TT, 3.5 TFL, 1 sack Troy Sanders ..............................11 TT, 1 TFL, 2 PBU
MATCHUP AT A GLANCEAPPALACHIAN STATE vs. MONTANA1899 .........................................................................................Founded ........................................................................................1893
17,589 .................................................................................. Enrollment ...................................................................................15,642
Black and Gold ....................................................................... Colors ......................................................Copper, Silver and Gold
Kidd Brewer (24,050) ..............................................Stadium (Capacity)................................Washington-Grizzly (25,217)
Scott Satterfield (Appalachian, 1996) ......................Head Coach ................ Mick Delaney (Western Montana, 1964)
First season ..........................................................Coach’s Record at School..........................................5-6 (Second season)
Same ........................................................................Coach’s Overall Record .................................... 10-17-1 (Fourth season)
8-4 ................................................................................2012 Overall Record ................................................................................5-6
6-2 (t-1st) .................................................. 2012 Conference Record (Standing) ..................................................3-5 (t-8th)
No. 9 (The Sports Network), No. 8 (coaches) ..2012 Final National Ranking ...................................................................None
Multiple Spread ..............................................................Basic Offense................................................................................Pro Set
32.9 (2nd/23rd) ........................2012 Points Per Game (Conference/National Rank) .....................31.6 (6th/t-27th)
170.2 (4th/39th) ............. 2012 Rushing Yards Per Game (Conference/National Rank) .............235.7 (2nd/11th)
293.7 (2nd/14th) .............2012 Passing Yards Per Game (Conference/National Rank) ............ 216.5 (11th/55th)
464.0 (2nd/9th) ...................2012 Total Yards Per Game (Conference/National Rank).................. 452.2 (1st/11th)
3-4 ...................................................................................... Basic Defense .......................................................................................4-3
29.3 (6th/77th) ............... 2012 Points Allowed Per Game (Conference/National Rank) ............... 26.7 (5th/60th)
190.5 (6th/94th) .... 2012 Rushing Yards Allowed Per Game (Conference/National Rank) ......... 92.5 (1st/2nd)
222.5 (8th/73rd) .... 2012 Passing Yards Allowed Per Game (Conference/National Rank) 288.3 (13th/120th)
413.1 (8th/90th) ........2012 Total Yards Allowed Per Game (Conference/National Rank) ........380.9 (4th/66th)
2013 SCHEDULE/RESULTS
Sept. 7 North Carolina A&T 6 p.m. Appalachian State is 61-19-2 all-time in home openers, including wins in 10 of last 11
Sept. 21 at Elon* 6 p.m. Mountaineers’ SoCon/FCS farewell tour begins against Elon, who it has not lost to since 1964
Sept. 28 Charleston Southern 3:30 p.m. Appalachian State is 42-15-1 all-time versus current members of Big South Conference
Oct. 5 at The Citadel* 2 p.m. The Citadel stunned Appalachian, 52-28, last season but Apps have won 17 of last 19 in series
Oct. 12 Samford* 3:30 p.m. Appalachian State is the only SoCon team Samford has not beaten since joining league in ‘08
Aug. 31 at Montana (ESPN3) 9 p.m. ET Longtime NCAA Division I FCS powers square off for the third time in five seasons
Oct. 26 Georgia Southern* (ESPN3) 3:30 p.m. Nation’s No. 1 team has been upset the last three times these future Sun Belt rivals have squared off
Nov. 2 Chattanooga* 3:30 p.m. App State has won 25 of last 28 over Mocs, including 14-straight in Boone (last UTC win at KBS - 1983)
Nov. 9 at Georgia (TV TBA) TBA Apps boast seven wins over FBS/I-A opponents since 1983 (most recent: 34-32 at No. 5 Michigan, ‘07)
Nov. 16 at Wofford* 1:30 p.m. Wofford is only SoCon team since 2002-03 to post consecutive wins over App State (‘02-03 & ‘11-12)
Nov. 23 Western Carolina* 3:30 p.m. Appalachian State has won eight-straight and 26 of last 28 Battles for the Old Mountain Jug
Oct. 19 at Furman* 1:30 p.m. Appalachian has won 10 of the last 12 meetings versus longtime rival Furman

@AppState_FB
GAME 1 • AUGUST 31 at MONTANAw
ww
.ap
pst
ates
po
rts.
com
• w
ww
.Pla
yAtT
heR
ock
.co
m
2013
App
alac
hian
Sta
te F
OO
TB
AL
L
2@appstate_sports
26 • MONDAY 27 • TUESDAY 28 • WEDNESDAY 29 • THURSDAY 30 • FRIDAY 31 • SATURDAY 1 • SUNDAYCoach SatterfieldBrief interviewsfollowing practice
Assistant CoachesBrief interviews following practice
QB Jamal Londry-Jackson/DL Ronald BlairMedia teleconference — 11 a.m. ET/9 a.m. MT
Other student-athletesBrief interviewsfollowing practice
Coach SatterfieldSoCon Media Teleconference — 10 a.m. ET/8 a.m. MT
Assistant CoachesBrief interviews following practice
Student-athletesNo media availability
Coach SatterfieldBrief interviews following practice
Assistant CoachesBrief interviews following practice
Student-athletesBrief interviews following practice
No media availability except for game broadcast crews.
Appalachian State walkthrough closed.
No media availability except for game broadcast crews.
Postgame InterviewsCoach Satterfield and selected App State players will be available for postgame interviews following 10-minute cooling-off period (location TBA).
Coaches and players are not available for on-field interviews except with live broadcast crews.
App State’s locker room is CLOSED to media at all times.
Coach SatterfieldTBA
Assistant CoachesNo media availability
Student-athletesNo media availability
MEDIA AVAILABILITY• Below is a breakdown of this week’s media availability for Appalachian State coaches and student-athletes.
• ALL interviews with Appalachian State coaches and student-athletes MUST be arranged through Appalachian State’s sports information office. Interview requests can be made to assistant A.D./sports information Mike Flynn (828-262-2845 or [email protected]). Media members/outlets that attempt to conduct interviews not arranged through the sports information office (including contacting student-athletes via social media) are subject to loss of media privileges, including revocation of credentials.
• To participate in media teleconferences, contact Mike Flynn for call-in number and passcode.
• Appalachian State’s full media guidelines can be found on p. 205 of the 2013 Appalachian State football media guide.
TALE OF THE TAPEAverage heights and weights of players listed on
the depth chart for each team:Appalachian State Montana
6-3, 280. ............. Offensive Line/Tight Ends ............ 6-4, 281
6-0, 199 ............ Offensive Backs (QB and RB) .......... 6-0, 208
5-10, 184 ............................Receivers...............................5-9,176
6-2, 255 ......................... Defensive Line ....................... 6-2, 265
6-0, 215 ............................ Linebackers .......................... 6-1, 222
5-10, 190 .....................Defensive Backs ...................... 6-0, 188
TOP RETURNING PERFORMERS AT A GLANCEPASSING CMP. ATT. INT. YDS. TDAppalachian StateJamal Londry-Jackson 268 406 8 3,278 21Montana Trent McKinney 134 205 8 1,350 8 RUSHING ATT. YDS. AVG. TDAppalachian StateJamal Londry-Jackson 114 328 2.9 6MontanaJordan Canada 118 586 5.0 4 RECEIVING NO. YDS. AVG. TDAppalachian StateSean Price 81 1,196 14.8 8MontanaEllis Henderson 23 360 15.7 2
TACKLES UT AT TT TFL SACKSAppalachian State Patrick Blalock 37 36 63 3.0 -MontanaBrock Coyle 35 72 107 6.5 2.0
TOP STORYLINES• A new era begins for Appalachian State football on Saturday when the 12th-ranked Mountaineers open the 2013 season at No. 20 Montana.
• Most notably, Saturday’s season-opener marks the debut for Appalachian State head coach Scott Satterfield. Satterfield was named Appalachian’s 20th head coach Dec. 14, 2012. Satterfield replaces legendary head coach Jerry Moore, whose 24-year run at the helm of the Mountaineers came to an end following the 2012 campaign. For more on Scott Satterfield, see p. 5.
• Saturday’s game also marks the beginning of the end of an era for Appalachian State football, as the Mountaineers open their final season in NCAA Division I FCS. On March 27, 2013, Appalachian officially accepted an invitation to join the NCAA Division I FBS Sun Belt Conference on July 1, 2014. For more on the transition to FBS, see p. 4.
• Saturday’s game also wraps up perhaps the most anticipated regular-season series in FCS history, when Appalachian and Montana play the final game of a home-and-home series.
• The series began last Sept. 8 in Boone, N.C., when Appalachian scored its first-ever win over Montana with a 35-27 triumph in front of 30,856 at jam-packed Kidd Brewer Stadium.
• Despite last year’s victory over the Griz, the Mountaineers still trail in the all-time series versus Montana, 2-1.
• Montana has won both previous meetings played in Missoula, Mont.
• Both of the previous App State-Montana matchups played at Washington-Grizzly Stadium came in the semifinals of the NCAA Division I-AA/FCS playoffs. The Griz topped the Apps in overtime, 19-16, in the 2000 national semifinals and eeked out a heart-stopping 24-17 victory in the 2009 semis.
• Appalachian State and Montana have combined to win five NCAA Division I-AA/FCS national championships, make 10 I-AA/FCS championship-game appearances and earn 41 I-AA/FCS postseason berths.
• Appalachian State is opening the season versus an FCS opponent for only the fifth time in the last 20 seasons. Appalachian has not lost an opener to an FCS opponent since a 22-10 loss at North Carolina A&T in 1993.
AN APPALACHIAN STATE WIN WOULD ...• be its first in three attempts at Washing-ton-Grizzly Stadium.
• even the all-time series between Appala-chian State and Montana at 2-2.
• be the program’s first in 10 games played west of the Mississippi River.
• be its first in a season opener since 2010 and only its fourth in its last 12 openers.
AN APPALACHIAN STATE LOSS WOULD ...• drop it to 0-3 all-time at Montana and 1-3 overall versus the Griz.
• drop it to 0-10 all-time in games played west of the Mississippi River.
• be its third-straight season-opening set-back and ninth in its last 12 openers.
• mark the first time it lost a season opener to an NCAA Division I FCS opponent since it dropped a 22-10 decision at N.C. A&T in 1993.
GAME 1 • AUGUST 31 at MONTANA 2013 A
ppalachian State FO
OT
BA
LL
w
ww
.app
statespo
rts.com
• ww
w.P
layAtTh
eRo
ck.com
@AppState_FB3@appstate_sports
NOTING MONTANA• Montana is coming off an uncharacteristic 5-6 campaign in 2012 that snapped a string of 25-consecutive winning seasons. Prior to last season, the Griz hadn’t had a losing season since it went 3-8 in 1985.
• Last year also marked just the second time in 20 seasons that Montana did not earn a berth in the NCAA Division I-AA/FCS playoffs. The Griz made 17-straight postseason appear-ances from 1993-2009 before the streak was snapped with a 7-4 campaign in 2010.
• The Griz earned a spot in the 2011 NCAA Division I Football Championship field and advanced to the national semifinals but that playoff berth, along with five victories from that season, were vacated as part of sanctions for NCAA rules violations that were announced this past summer.
• Montana is poised to make a return to the postseason this year with 19 full-time starters back from last year’s squad.
• The Griz are especially loaded on defense, where they return 10 starters from a year ago. Montana’s projected starting lineup on defense features six seniors and just two underclassmen (both sophomores).
• On offense Montana returns seven full-time starters and is also buoyed by the return of junior quarterback Jordan Johnson, who red-shirted last season. Johnson threw for 2,400 yards and 21 touchdowns as a sophomore in 2011, helping lead the Griz to the national semifinals.
• Montana’s Washington-Grizzly Stadium is one of the most difficult venues for a visiting team in all of college football. The Griz have won a whopping 88 percent (176-24) of their games at WGS since it opened in 1986 (including five wins from 2011 that were later vacated due to NCAA sanctions).
• Montana has lost consecutive home games just once in this millenium — when it dropped back-to-back home contests to Northern Arizona (41-31) and Southern Utah (30-20) on Sept. 22 and Oct. 13 of last season. The Griz also lost their home finale last year (a 16-7 loss to archrival Montana State), mean-ing that an Appalachian State victory would give Montana consecutive home losses for only the second time since 2000.
• Appalachian is looking to become just the second Southern Conference team to ever win at Washington-Grizzly Stadium. Wofford topped the Griz, 23-22, in the opening round of the 2007 NCAA Division I Football Champi-onship. SoCon teams are 1-4 all-time at WGS (App State - 0-2, ETSU - 0-1, Georgia Southern - 0-1, Wofford - 1-0).
APPALACHIAN-MONTANA SERIES HISTORY• Longtime NCAA Division I FCS powers Appalachian State and Montana are squaring off for the second-straight season and fourth time overall.
• Montana leads the all-time series, 2-1.
• Appalachian downed UM, 35-27, on Sept. 8 of last season in the programs’ first-ever regu-lar-season meeting at Kidd Brewer Stadium in Boone, N.C. (see more in next column).
• Prior to last season, the Mountaineers and Griz had only met in the postseason, staging epic battles in the 2000 and 2009 NCAA Divi-sion I-AA/FCS national semifinals at Washing-ton-Grizzly Stadium.
• In 2000, Montana’s Drew Miller threw a 15-yard touchdown pass to Jimmy Farris in overtime that lifted the Griz to a 19-16 victory over the Mountaineers. Appalachian, which trailed 13-3 in the fourth quarter, rallied to send the contest to overtime on a Mark Wright 27-yard field goal as time expired. Wright hit a 36-yarder on the first series of overtime before Miller and Farris’ game-win-ning connection.
• In 2009, Appalachian returned to Missoula, Mont. for the national semifinals and once again lost in heartbreaking fashion, 24-17. The Mountaineers led, 17-14, going into the fourth quarter but Montana took a 24-17 lead on a 25-yard pass from Andrew Selle to Jabin Sambrano with 1:37 to go. In his final collegiate game, Armanti Edwards led Appalachian all the way to the three yard line but on the final play of the game, a would-be game-tying touchdown pass slipped through the hands of Brian Quick to seal the win for the Griz. Edwards racked up 407 yards of total offense (353 passing, 54 rushing) and Quick caught 10 passes for 135 yards in the loss.
• Appalachian and Montana have combined to win five NCAA Division I-AA/FCS national championships, make 10 I-AA/FCS championship-game appearances and earn 40* I-AA/FCS postseason berths.
• Since 2005, App State and Montana are FCS’s winningest programs with 87 and 77* victories, respectively.
* Montana also had five victories and a postseason appear-ance in 2011 that were vacated this summer due to NCAA sanctions.
APP STATE-MONTANA ALL-TIME RESULTSYEAR DATE SITE SCORE 2000 Dec. 9 Missoula, Mont. L, 16-19 (OT)*2009 Dec. 12 Missoula, Mont. L, 17-24*2012 Sept. 8 Boone, N.C. W, 35-27
* NCAA Division I-AA/FCS national semifinals
APP ST.-MONTANA SERIES INFORMATIONMost Appalachian State Points: ..................................35, 2012Most Montana Points: ......................................................27, 2012Fewest Appalachian State Points: ..............................16, 2000Fewest Montana Points:..................................................19, 2000Largest App State Margin of Victory: ..........8 (35-27), 2012Largest Montana Margin of Victory: ............7 (24-17), 2009Longest App State Winning Streak: ............... 1 (2012-pres.)Longest Montana Winning Streak: ......................2 (2000-09)Appalachian State vs. Montana in Boone: ....................... 1-0 at Conrad/Kidd Brewer Stadium: ............................. 1-0Appalachian State vs. Montana in Missoula: .................. 0-2 at Washington-Grizzly Stadium: .............................. 0-2
NOTING LAST YEAR’S WIN OVER MONTANA• Perhaps the most anticipated regular-sea-son matchup in NCAA Division I FCS history certainly lived up to the hype on Sept. 8, 2012 when No. 11/8 Appalachian State topped No. 12/9 Montana in an epic battle at The Rock.
• A raucous crowd of 30,856, the third-larg-est in Kidd Brewer Stadium history, saw the FCS powerhouses combine for 900 yards of offense and 19 third- and fourth-down conversions in a contest that, like the two Appalachian State-Montana matchups before it, came down to the wire.
• Appalachian forced two of Montana’s four turnovers in the first quarter and turned both miscues into touchdowns to jump out to a 21-7 lead after just one period. The Griz roared back with 14 points in the second quarter to send the game to halftime tied at 21-21 and the score remained deadlocked until a heart-stopping fourth quarter.
• The Mountaineers regained a 28-21 advan-tage early in the final period when it marched 67 yards in just 1:44. A 32-yard pass from Jamal Londry-Jackson to Sean Price on the drive’s first play and a 25-yard touchdown strike from Jackson to Andrew Peacock ac-counted for 57 of the 67 yards but the biggest play of the possession when Jackson scram-bled for a first down on fourth-and-one to keep the series alive and set up the go-ahead touchdown pass to Peacock.
• Later in the fourth quarter, Montana drew within a point on an 87-yard touchdown re-ception by running back Dan Moore but App State maintained a 28-27 advantage when Griz kicker Chris Lider missed the extra point.
• On the ensuing possession, Appalachian put together a vintage 11-play, 78-yard touch-down drive to stretch its lead to 35-27. Facing third-and-16 from the UM 46 midway through the series, Jackson found true freshman Mal-achi Jones for a 17-yard first-down pass to keep the drive alive. Steven Miller (now with the Detroit Lions) picked up the final 29 yards from there, capped by his second touchdown of the game with 5:05 to play.
• Thanks to a third-down conversion and two fourth-down conversions, Montana marched

@AppState_FB
GAME 1 • AUGUST 31 at MONTANAw
ww
.ap
pst
ates
po
rts.
com
• w
ww
.Pla
yAtT
heR
ock
.co
m
2013
App
alac
hian
Sta
te F
OO
TB
AL
L
4@appstate_sports
into Appalachian territory on its final posses-sion. However, with 18 seconds left to play, all-America cornerback Demetrius McCray made his second interception of the day at the goal line to seal the 35-27 triumph.
APPALACHIAN IN SEARCH OF FIRST WIN WEST OF THE MISSISSIPPI RIVER• Appalachian State is 0-9 all-time in games played west of the Mississippi River.
• Saturday’s game is Appalachian’s first on the other side of the Mississippi since it fell to Montana in the semifinals of the 2009 NCAA Division I Football Championship.
APPALACHIAN ALL-TIME GAMES PLAYED WEST OF THE MISSISSIPPI RIVER
Date Opponent ResultNov. 2, 1963 at Northwestern St. L, 33-20Dec. 3, 1994 at Boise State* L, 17-14Dec. 5, 1998 at Northwestern St.* L, 31-20Dec. 9, 2000 at Montana* L, 19-16OT
Aug. 30, 2003 at Hawaii L, 40-17Sept. 4, 2004 at Wyoming L, 53-7Sept. 25, 2004 at Northwestern St. L, 40-35Sept. 10, 2005 at Kansas L, 36-8Dec. 12, 2009 at Montana* L, 24-17
* NCAA I-AA/FCS playoff game
APPALACHIAN vs. BIG SKY CONFERENCE• Appalachian State is 4-3 all-time versus opponents from the Big Sky Conference.
• Five of the previous seven meetings have come in the postseason.
• After squaring off with Big Sky foes just twice in its first 822 all-time games, Saturday’s matchup versus Montana is Appalachian’s seventh against a Big Sky opponent in its last 84 games.
APP STATE VERSUS CURRENT BIG SKY MEMBERSCal Poly ............................................................................................... 0-0Eastern Washington....................................................................... 1-0Idaho State ........................................................................................ 0-0Montana ........................................................................ 1-2Montana State ................................................................................. 1-0North Dakota ................................................................................... 0-0Northern Arizona ............................................................................ 1-0Northern Colorado ......................................................................... 0-0Portland State .................................................................................. 0-0Sacramento State ........................................................................... 0-0Southern Utah ................................................................................. 0-0UC Davis ............................................................................................. 0-0Weber State ...................................................................................... 0-0
APP STATE vs. BIG SKY OPPONENTS ALL-TIMEYear Opponent ResultDec. 3, 1994 at Boise State^* L, 17-14Dec. 9, 2000 at Montana ! L, 19-16 (OT)Dec. 2, 2006 Montana State^ W, 38-17Sept. 15, 2007 Northern Arizona W, 34-21Dec. 1, 2007 Eastern Washington ^ W, 38-35Dec. 9, 2009 at Montana ! L, 24-17Sept. 8, 2012 Montana W, 35-27
^ NCAA Division I-AA/FCS quarterfinal! NCAA Division I-AA/FCS semifinal* no longer a member of the Big Sky
SEASON OPENERS• Appalachian State is 47-33-3 all-time in season openers (.584).
• Appalachian has won just three of its last 11 and seven of its last 21 openers, dating back to 1992. However, that mark is a bit deceiving considering that 16 of those 21 contests have come against NCAA Division I-A/FBS opponents.
• The Mountaineers have not lost a season opener to a I-AA/FCS opponent since a 22-10 setback at North Carolina A&T on Sept. 4, 1993.
• This year also marks the 12th-straight season that Appalachian State opens the campaign on the road. Appalachian has not played a season opener at home since it defeated Liberty, 46-26, to open the 2001 campaign.
TRANSITIONING TO FBS, SUN BELT• On March 27, 2013, Appalachian State University announced that it would join the Sun Belt Conference on July 1, 2014.
• With the move to the Sun Belt, Appala-chian State football will transition to college football’s highest level, the NCAA Division I Football Bowl Subdivision (FBS — formerly known as Division I-A).
• Appalachian State football must complete a two-year reclassification process from FCS to FBS. Among other requirements, Appala-chian State must raise the number of football scholarships it offers from 63 to 85 during the reclassification period.
• In the first year of the reclassification pro-cess (2013), Appalachian State will play a full Southern Conference schedule but will be in-eligible for participation in the NCAA Division I Football Championship. Appalachian will also be ineligible to officially win the South-ern Conference title, as the league would forfeit its automatic berth in the Division I Football Championship if its champion were ineligible to participate in the postseason.
• The SoCon originally ruled that Appala-chian State and Georgia Southern (which is also in the first year of transition to FBS and the Sun Belt) would be listed in the league’s regular-season standings in 2013, much like Chattanooga was in 2009 when it was ineli-gible to participate in the NCAA postseason and, therefore, could not officially win the SoCon title.
• However, on Aug. 12, four-and-a-half months after App State and Georgia Southern accepted their invitations to join the Sun Belt and move to FBS and nearly three weeks after the SoCon reiterated on its media day that
Appalachian and GSU would be listed in the conference standings, the SoCon abruptly changed course and bucked precedent by announcing that the Mountaineers and Ea-gles would be listed below the league’s other seven teams in the 2013 standings, regardless of their records in conference play.
• In the second year of the reclassification process (2014), Appalachian State will play a full Sun Belt Conference schedule and be eligible to win the Sun Belt championship but will not be eligible to participate in a postsea-son bowl game.
• Appalachian State becomes bowl-eligible in 2015.
SoCon SUPREMACY — PART I• In what turned out to be its final chance to win the Southern Conference, Appalachian State claimed its record-tying 12th SoCon championship in 2012.
• Since the SoCon began crowning a cham-pion in 1933, only Furman, which won 12 titles in its first 73 years in the conference, has claimed more championships than the 11 that Appalachian won in its first 41 seasons in the league.
MOST SoCon CHAMPIONSHIPS(since the SoCon began officially crowning a football champion in 1933)
No. Team First Last 12 Furman 1978 2004 12 Appalachian State 1986 2012 10 Duke 1933 1952 10 Georgia Southern 1993 2012 8 West Virginia 1953 1967 7 VMI 1951 1977
• Last year’s SoCon title was Appalachian State’s seventh in eight years. In the SoCon’s championship era (1933-present), Georgia Southern (1997-2002, 2004) is the only other program to win seven titles in an eight-year span.
• Appalachian also matched a SoCon record with its six-consecutive conference champi-onships from 2005-10, matching the mark originally set by Georgia Southern from 1997-2002.
MOST CONSECUTIVE SoCon CHAMPIONSHIPS(since the SoCon began officially crowning a football champion in 1933)
6 APPALACHIAN STATE ..... 2005-10 6 Georgia Southern .............1997-2002 4 West Virginia ............................1953-56 4 Furman ......................................1980-83
SoCon SUPREMACY — PART II• Appalachian State is 39-5 (.886) in its last 44 SoCon games and 53-8 (.869) in conference action since the beginning of the 2005 cam-paign.
• Appalachian State is by far the SoCon’s winningest program since 2000, with a gaudy

GAME 1 • AUGUST 31 at MONTANA 2013 A
ppalachian State FO
OT
BA
LL
w
ww
.app
statespo
rts.com
• ww
w.P
layAtTh
eRo
ck.com
@AppState_FB5@appstate_sports
81-19 record in conference play, 12 wins more than the next-closest competitor, Georgia Southern.
SoCon RECORDS SINCE 2000 (SoCon games only)School Record Pct.Appalachian State 81-19 .810Georgia Southern 69-31 .690Wofford 67-33 .670Furman 63-37 .630Samford (2008-pres.) 18-22 .450Elon (2003-pres.) 31-45 .408East Tennessee St. (2000-03) 12-20 .375Chattanooga 35-65 .350 The Citadel 32-68 .320Western Carolina 23-77 .230VMI (2000-02) 5-19 .208
• Since the beginning of the 2005 campaign, Appalachian is 36-1 against SoCon foes be-sides Georgia Southern, Wofford and Furman (and a still-impressive 17-7 against the Eagles, Terriers and Paladins). The Mountaineers’ loss to The Citadel on Sept. 15 of last season marked the first time since a 30-27 setback at Western Carolina on Nov. 13, 2004 that App State lost to a conference opponent outside of the GSU-Wofford-Furman trio.
CARoLInAS’ BEST• Prior to winning its first national champi-onship in 2005, a quantitative study by the Charlotte Observer tabbed Appalachian State as the Carolinas’ most successful Division I football program over the previous two decades (1985-2004).
• A look at the numbers since the turn of the millenium seem to vaildate the Observer’s findings. Since 2000, Appalachian easily has the best winning percentage of any Division I program in North or South Carolina.
CAROLINAS’ WINNINGEST DIVISION I FOOTBALL PROGRAMS (since 2000)
School (Conference) Record Pct.Appalachian State (SoCon) 127-44 .747Wofford (SoCon) 101-53 .656South Carolina State (MEAC) 95-52 .646Clemson (ACC) 105-60 .636Furman (SoCon) 96-59 .619Coastal Carolina* (Big South) 71-44 .617South Carolina (SEC) 98-62 .613NC State (ACC) 88-73 .547Gardner-Webb (Big South) 74-67 .525
* Coastal Carolina has fielded a football team since 2003
In THE nATIonAL PoLLS• Appalachian State is ranked No. 12 nation-ally in The Sports Network’s NCAA Division I FCS preseason top-25 poll.
• However, the Mountaineers’ ranking is very likely not an actual indication of where prognosticators truly feel Appalachian stacks up nationally in its final FCS season. The Mountaineers’ No. 12 ranking came despite some voters leaving Appalachian off their ballots altogether in response to the Apps’
impending move to the Sun Belt Conference and NCAA Division I FBS ranks in 2014.
• Appalachian State has been ranked in The Sports Network poll for 109-straight weeks, dating back to the Sept. 19, 2005 rankings.
• Appalachian is 203-79-1 (.721) all-time in games in which they are nationally ranked.
• Appalachian is 5-0 all-time when playing as the No. 12 team in The Sports Network poll. Most recently the 12th-ranked Mountaineers defeated Furman, 33-28, to claim its 12th Southern Conference title in last year’s regu-lar-season finale (Nov. 12, 2012).
TRACKING APPALACHIAN STATE IN THE 2013 NATIONAL RANKINGS
Preseason ...............................................12 Sept. 2 Sept. 9 Sept. 16 Sept. 23 Sept. 30 Oct. 7 Oct. 14 Oct. 21 Oct. 28 Nov. 4 Nov. 11 Nov. 18
• Much like the Southern Conference did with regards to its regular-season standings, the FCS coaches’ poll (which is administered by the SoCon) bucked precedent by making Appalachian State ineligible for its rankings in the Mountaineers’ first year of transition from FCS to FBS. The policy represents a change of course from 2011 when Massachusetts and Texas State were eligible for the poll during their initial year of transition.
THE SPORTS NETWORK NCAA DIVISION I FCS TOP-25 POLL (PRESEASON)Team (1st-place votes) Record Pts. Prev.1. North Dakota State (127) 14-1 3340 12. Montana State (1) 11-2 3079 53. Sam Houston State (5) 11-4 2941 24. Eastern Washington 11-3 2873 45. Villanova 8-4 2334 156. South Dakota State 9-4 2268 147. Central Arkansas 9-3 2244 108. Wofford 9-4 2089 79. Georgia Southern (1) 10-4 2002 310. New Hampshire 8-4 1920 1311. Towson 7-4 1871 1712. Appalachian State 8-4 1696 913. Illinois State 9-4 1657 814. Cal Poly 9-3 1646 1215. Richmond 8-3 1384 1816. Stony Brook 10-3 1178 1117. Northern Iowa 5-6 1106 NR18. Northern Arizona 8-3 988 2019. James Madison 7-4 964 1920. Montana 5-6 813 NR21. Eastern Illinois 7-5 686 NR22. Lehigh Mountain 10-1 587 1623. Bethune-Cookman 9-3 514 2224. Chattanooga 6-5 505 NR25. Coastal Carolina 8-5 489 24Italics denote 2013 Appalachian State opponents
SATTERFIELD ERA BEGInS• Saturday’s season opener at Montana will mark the first time since Nov. 19, 1988 (a span of 9,052 days) that a head coach other than Jerry Moore will roam the Appalachian State sideline.
• Scott Satterfield will lead the Mountain-eers into the opener at Montana after being named Appalachian State’s 20th head coach on Dec. 14, 2012.
• Satterfield, 40, has been a part of the col-lege-football landscape for more than half his life, most notably for his 17 previous seasons as a player (1991-95) and assistant coach (1998-2008, 2012) at Appalachian State.
• As a player and coach, he has helped lead the Mountaineers to three national titles and eight Southern Conference championships.
• Satterfield is the sixth Appalachian State alumnus to serve as the Mountaineers’ head coach and the first in 43 years.
ALUMNI TO SERVE AS APPALACHIAN STATE’S HEAD FOOTBALL COACHCoach ....................Graduation ...........Head CoachGraydon Eggers ..............1924 ............................ 1928Francis Hoover ................1940 ............................ 1945Press Mull .........................1947 ............................ 1951Bob Broome .....................1940 .........................1956-58Carl Messere ....................1961 .........................1965-70Scott Satterfield ......... 1996......................2013-
• Satterfield is looking to become the 12th person to win in his debut as Appalachian State’s head coach.
HEAD COACHES IN THEIR APP STATE DEBUTSHead Coach Date Opponent ResultGraydon Eggers 9/29/28 Mountain City L, 26-0C.B. Johnson 9/30/29 at Carson-Newman T, 0-0Eugene Garbee 9/22/33 Erskine L, 13-7Kidd Brewer 9/27/35 at Lenoir-Rhyne T, 0-0Flucie Stewart 9/15/39 Rollins L, 14-7R.W. “Red” Watkins 9/13/40 at Tampa W, 13-6Beattie Feathers 9/18/42 at Navy Apprentice W, 16-14Francis Hoover 9/29/45 Milligan L, 26-7E.C. Duggins 9/19/47 at Guilford W, 23-12Press Mull 9/15/51 at Guilford W, 20-0Bob Broome 9/15/56 Western Carolina W, 19-7Bob Breitenstein 9/19/59 at Emory & Henry W, 21-0Jim Duncan 9/17/60 Emory & Henry W, 7-0Carl Messere 9/18/65 Newberry W, 10-7Jim Brakefield 9/11/71 at Furman T, 0-0Mike Working 9/6/80 at James Madison W, 34-6Mack Brown 9/3/83 at Wake Forest W, 27-25Sparky Woods 9/1/84 at Clemson L, 40-7Jerry Moore 9/2/89 Gardner-Webb W, 43-7Scott Satterfield 8/31/13 at Montana —
SATTERFIELD AT A GLAnCE (@winthegame)PLAYING ExPERIENCE1991-95:...................Appalachian State (QB)
COACHING ExPERIENCE1998: .............................. Appalachian State (WR)1999-2002: ................. Appalachian State (RB)2003-08: ....................... Appalachian State (QB)2009: .............................. Toledo (pass game coordinator/QB)2010-11: ....................... Florida International (off. coord./QB)2012: .............................. Appalachian State (asst. HC/OC/QB)2013: .............................. Appalachian State (head coach)

@AppState_FB
GAME 1 • AUGUST 31 at MONTANAw
ww
.ap
pst
ates
po
rts.
com
• w
ww
.Pla
yAtT
heR
ock
.co
m
2013
App
alac
hian
Sta
te F
OO
TB
AL
L
6@appstate_sports
TEAM• Appalachian State returns 10 starters from last season’s high-powered offense. The 10 returning offensive starters are the Mountain-eers’ most since Appalachian began tracking starters returning/lost in 1983.
• With a relatively inexperienced offensive unit a year ago, Appalachian State ranked among the nation’s top 25 in total offense (ninth - 464.0 ypg), passing efficiency (ninth -152.03 rating), passing yardage (14th - 293.8 ypg) and scoring (23rd - 32.92 ypg).
• Appalachian also ranked 39th in rushing yardage a season ago (170.3 ypg), making it one of only four FCS programs to rank among the nation’s top 40 in all five major offensive statistical categories — scoring, rushing, passing, passing efficiency and total offense. Coastal Carolina, Harvard and Northern Arizo-na were the only other squads to accomplish the feat.
• Since installing its patented spread offense in 2004, Appalachian State has finished among the nation’s top 25 in the five major offensive statistical categories 30 out of a possible 45 times. That impressive percentage includes an 0-for-5 in 2011, when it did not finish higher than 37th in any category.
APPALACHIAN STATE IN THE NCAA DIVISION I FCS OFFENSIVE RANKINGS (2004-12)
SCORING 2004: 33.3 (19th) 2005: 30.3 (31st) 2006: 35.2 (3rd)2007: 42.7 (2nd) 2008: 37.3 (5th)2009: 33.2 (12th)2010: 34.3 (7th)2011: 28.7 (38th)2012: 32.9 (23rd)
PASSING 2004: 322.6 (5th) 2005: 229.3 (35th)2006: 176.4 (70th)2007: 200.9 (59th) 2008: 234.4 (36th)2009: 258.6 (15th)2010: 213.5 (45th)2011: 234.4 (37th)2012: 293.8 (14th)
TOTAL OFFENSE 2004: 425.6 (15th) 2005: 423.1 (17th) 2006: 417.7 (3rd) 2007: 488.3 (1st) 2008: 463.4 (4th)2009: 465.1 (3rd)2010: 430.9 (10th)2011: 390.2 (38th)2012: 464.0 (9th)
• Appalachian’s 464 yards of total offense per game last season was the second-highest average in program history, behind only the 488.3 that the Mountaineers averaged in 2007, when it won its last of three-straight
OFFENSE
RUSHING2004: 102.9 (104th)2005: 193.9 (29th)2006: 241.3 (4th)2007: 287.4 (3rd)2008: 229.3 (8th)2009: 206.4 (10th)2010: 217.4 (8th)2011: 155.8 (55th)2012: 170.3 (39th)
PASSING EFFICIENCY 2004: 154.73 (6th) 2005: 148.88 (14th)2006: 132.97 (26th)2007: 161.29 (6th) 2008: 165.84 (3rd)2009: 141.76 (18th)2010: 141.52 (15th)2011: 133.08 (44th)2012: 152.03 (8th)
national championships, and the 465.1 that they averaged in 2009, the senior season of two-time Walter Payton Award-winning quar-terback Armanti Edwards.
• Appalachian State set a school record by amassing at least 400 yards of total offense 10 times in 11 regular-season games last season. The previous record for 400-yard games during the regular season was eight, also set in 2007.
• In each of their final 11 games of the season, the Mountaineers gained more yards than their opponent’s season average for yards allowed going into the ballgame.
APPALACHIAN STATE 2012 TOTAL OFFENSE vs.
OPPONENT’S DEFENSIVE AVERAGE Avg. Allowed Appalachian by Opp. Def. App St. Opp. Total Offense Before Game +/-MONT 417 233.0 +184.0CIT 417 313.5 +103.5UTC 401 272.3 +128.7CCU 684 397.5 +286.5ELON 499 361.8 +137.2SAM 413 338.5 +74.5WOF 363 306.8 +56.2WCU 580 513.8 +66.2GSU 453 279.9 +173.1FUR 488 393.0 +95.0ISU 434 310.6 +123.4
• For the first time in school history, Appa-lachian State produced a 3,000-yard passer (Jamal Londry-Jackson - 3,278 yds.), a 1,000-yard rusher (Steven Miller - 1,368 yds.) and a 1,000-yard receiver (Sean Price - 1,196 yds.) in 2012.
• Despite fielding a total of nine first-time starters on offense over the course of last season, Appalachian’s increased its offensive output by 18.9 percent over 2011, when cur-rent NFL players Brian Quick, Travaris Cadet and DeAndre Presley all played prominent roles in the unit (464.0 ypg in 2012, 390.2 ypg in 2011).
• Since the beginning of the 2004 (when Appalachian State started running its spread offense), the Mountaineers have scored 30 points or more 82 times in 121 games (67.8 percent of all games) and have scored 40 points or more 43 times (35.5 percent of all games).
• Also since the beginning of the 2004 cam-paign, Appalachian has gained 20 yards or more on 7.4 percent of its offensive plays (580 times in 7,791 plays).
• Last season, the Mountaineers gained 20 yards or more on 6.8 percent of their offensive plays (60-of-877).
APP STATE’S PLAYS OF 20-PLUS YARDS IN 2012 Yds. Play (* denotes touchdown) Opp.75 Steven Miller rush* CCU69 Jamal Jackson to Sean Price pass* CCU67 Jamal Jackson to Sean Price pass GSU56 Jamal Jackson to Sean Price pass* GSU56 Steven Miller rush WCU54 Jamal Jackson to Tony Washington pass* ELON48 Jamal Jackson to Malachi Jones pass* ISU48 Jamal Jackson to Steven Miller pass* SAM48 Jamal Jackson to Steven Miller pass ELON46 Jamal Jackson to Sean Price pass GSU44 Jamal Jackson to Simms McElfresh pass ISU37 Jamal Jackson to Sean Price pass ISU37 Steven Miller rush ELON37 Jamal Jackson to Tony Washington pass ECU36 Jamal Jackson to Andrew Peacock pass GSU36 Logan Hallock to Sean Price pass WCU36 Jamal Jackson to Sean Price pass* UTC35 Jamal Jackson to Steven Miller pass* UTC34 Jamal Jackson to Sean Price pass ISU33 Steven Miller rush FUR32 Jamal Jackson to Tony Washington pass* WCU32 Jamal Jackson to Sean Price pass* MONT32 Jamal Jackson to Sean Price pass MONT31 Logan Hallock to Sean Price pass WCU30 Jamal Jackson to Steven Miller pass SAM30 Jamal Jackson to Malachi Jones pass UTC30 Steven Miller rush CIT29 Steven Miller rush CIT28 Steve Miller rush CCU27 Michael Frazier rush CCU27 Jamal Jackson to Michael Frazier pass CCU27 Jamal Jackson to Malachi Jones pass ECU26 Steven Miller rush GSU25 Jamal Jackson to Sean Price pass GSU25 Steven Miller rush SAM25 Jamal Jackson to Andrew Peacock pass* ELON25 Jamal Jackson to Andrew Peacock pass* MONT24 Steven Miller rush CIT23 Jamal Jackson to Tony Washington pass* GSU23 Steven Miller rush WCU23 Jamal Jackson to Sean Price pass SAM23 Jamal Jackson to Steven Miller pass* ELON23 Jamal Jackson to Drew Bailey pass* CCU22 Jamal Jackson to Sean Price pass FUR22 Jamal Jackson to Sean Price pass GSU22 Jamal Jackson to Sean Price pass* SAM22 Jamal Jackson to Tony Washington pass UTC22 Jamal Jackson to Sean Price pass UTC22 Tony Washington rush* CIT21 Jamal Jackson to Andrew Peacock pass ISU21 Jamal Jackson to Drew Bailey pass FUR21 Jamal Jackson to Sean Price pass WCU21 Jamal Jackson to Andrew Peacock pass SAM21 Jamal Jackson to Tony Washington pass ECU20 Jamal Jackson to Sean Price pass SAM20 Rod Chisholm rush* SAM20 Rod Chisholm rush ELON20 Jamal Jackson rush ELON20 Rod Chisholm rush CCU20 Jamal Jackson to Tony Washington pass ECU
QUARTERBACKS• Senior quarterback Jamal Londry-Jackson returns for his third and final season as Appa-lachian State’s starting signal-caller in 2013.
• Londry-Jackson is coming off one of the best seasons by a passer in Appalachian histo-ry. He set school records for single-season completions (268) and pass attempts (406) last season and threw for 3,278 yards, just 13 yards shy of the school record of 3,291 set by Armanti Edwards as a senior in 2009.
• Londry-Jackson owns six school records and ranks among the program’s all-time lead-ers in virtually every category for a QB.

GAME 1 • AUGUST 31 at MONTANA 2013 A
ppalachian State FO
OT
BA
LL
w
ww
.app
statespo
rts.com
• ww
w.P
layAtTh
eRo
ck.com
@AppState_FB7@appstate_sports
OFFENSE
PASSING YARDS — GAmE
433 Armanti Edwards (29-41) South Carolina St. 2008415 Armanti Edwards (27-34) Wofford 2009413 Richie Williams (40-45) Furman 2004410 Richie Williams (21-37) Chattanooga 2004408 Richie Williams (29-43) Elon 2004408 Steve Brown (26-38) E. Tenn. State 1980405 Richie Williams (31-40) Wofford 2004383 J. Londry-Jackson (21-34) Georgia Southern 2012379 Joe Burchette (25-37) W. Carolina 2000373 J. Londry-Jackson (33-45) Illinois State 2012
PASSING YARDS — SEASon
3,291 Armanti Edwards 257-378 20093,278 Jamal Londry-Jackson 268-406 20123,109 Richie Williams 234-350 20042,902 Armanti Edwards 196-306 20082,809 Richie Williams 211-338 2005
PASSING YARDS — CAREER
10,392 Armanti Edwards 768-1,180 2006-097,759 Richie Williams 589-947 2002-056,533 Steve Brown 437-848 1977-805,427 Joe Burchette 446-796 1999-20025,423 Jamal Londry-Jackson 436-682 2010-pres.
PASS ATTEMPTS — GAmE
57 Bake Baker (37 comp.) Liberty 199756 DeAndre Presley (31 comp.) Villanova 201054 Armanti Edwards (28 comp.) Montana 200952 Randy Joyce (27 comp.) Virginia Tech 198150 Bake Baker (29 comp.) Clemson 199750 Randy Joyce (24 comp.) W. Kentucky 198449 Joe Burchette (23 comp.) Montana 200046 J. Londry-Jackson (32 comp.) Furman 201246 J. Londry-Jackson (29 comp.) Wofford 201245 J. Londry-Jackson (33 comp.) Illinois State 2012
PASS ATTEMPTS — SEASon
406 Jamal Londry-Jackson 268 comp. 2012378 Armanti Edwards 257 comp. 2009352 Steve Brown 175 comp. 1980350 Richie Williams 234 comp. 2004347 Bake Baker 207 comp. 1997
PASS ATTEMPTS — CAREER
1,180 Armanti Edwards 768 comp. 2006-09947 Richie Williams 589 comp. 2002-05904 D.J. Campbell 476 comp. 1989-92848 Steve Brown 437 comp. 1977-80845 Randy Joyce 449 comp. 1981-84796 Joe Burchette 466 comp. 1999-2002694 Pat Murphy 338 comp. 1965-68682 Jamal Londry-Jackson 436 comp. 2010-pres.611 Todd Payton 308 comp. 1984-87522 DeAndre Presley 318 comp. 2008-11491 Scott Satterfield 275 comp. 1992-95
PASS COMPLETIONS — GAmE
40 Richie Williams (45 att.) Furman 200437 Bake Baker (57 att.) Liberty 199733 J. Londry-Jackson (45 att.) Illinois State 201232 J. Londry-Jackson (46 att.) Furman 201231 DeAndre Presley (56 att.) Villanova 201031 Richie Williams (40 att.) Wofford 200429 J. Londry-Jackson (46 att.) Wofford 201229 J. Londry-Jackson (44 att.) Furman 201129 Armanti Edwards (41 att.) South Carolina St. 200829 Richie Williams (43 att.) Elon 200429 Joe Burchette (45 att.) The Citadel 200229 Bake Baker (50 att.) Clemson 1997
PASS COMPLETIONS — SEASon
268 Jamal Londry-Jackson 406 att. 2012257 Armanti Edwards 378 att. 2009234 Richie Williams 350 att. 2004211 Richie Williams 338 att. 2005210 DeAndre Presley 343 att. 2010
PASS COMPLETIONS — CAREER
768 Armanti Edwards 1,180 att. 2006-09589 Richie Williams 947 att. 2002-05476 D.J. Campbell 904 att. 1989-92466 Joe Burchette 796 att. 1999-2002449 Randy Joyce 845 att. 1981-84437 Steve Brown 848 att. 1977-80436 Jamal Londry-Jackson 682 att. 2010-pres.338 Pat Murphy 694 att. 1965-68318 DeAndre Presley 522 att. 2008-11289 Todd Payton 575 att. 1984-87
COMPLETION PERCENTAGE — SEASon (mIn. 100 ComP.).680 Armanti Edwards 257-378 2009.669 Richie Williams 234-350 2004.667 Armanti Edwards 148-222 2007.660 Jamal Londry-Jackson 268-406 2012.641 Armanti Edwards 196-306 2008
COMPLETION PERCENTAGE — CAREER (mIn. 250 ComP.).651 Armanti Edwards 768-1,180 2006-09.639 Jamal Londry-Jackson 436-682 2010-pres..622 Richie Williams 589-947 2002-05.609 DeAndre Presley 318-522 2008-11.598 Bake Baker 275-460 1994-97
TOUCHDOWN PASSES — GAmE
5 DeAndre Presley The Citadel 20105 Armanti Edwards Wofford 20085 Richie Williams N’Western St. 20045 Pat Murphy Wofford 19685 Pat Murphy Presbyterian 19674 Jamal Londry-Jackson Elon 20124 Jamal Londry-Jackson Elon 20114 DeAndre Presley Jacksonville 20104 Armanti Edwards South Carolina St. 20084 Armanti Edwards The Citadel 20084 Richie Williams Chattanooga 20044 Richie Williams E. Kentucky 20044 Richie Williams Elon 20034 Joe Burchette VMI 20024 Joe Burchette W. Carolina 2000
TOUCHDOWN PASSES — SEASon
30 Armanti Edwards 200824 Richie Williams 200423 Pat Murphy 196821 Jamal Londry-Jackson 201221 DeAndre Presley 201020 Richie Williams 200518 Bake Baker 199717 Armanti Edwards 200716 Joe Burchette 200116 Bobby Fuller 1988
PASSING YARDS PER GAME — SEASon
310.9 Richie Williams 3,109/10g 2004274.2 Armanti Edwards 3,291/12g 2009273.2 J. Londry-Jackson 3,278/12g 2012233.0 Pat Murphy 2,330/10g 1968231.8 Bake Baker 2,550/11g 1997
PASSING YARDS PER GAME — CAREER
203.8 Armanti Edwards 10,392/51g 2006-09198.0 Steve Brown 6,533/33g 1977-80180.4 Richie Williams 7,759/43g 2002-05174.9 J. Londry-Jackson 5,423/31g 2010-pres.168.5 Bake Baker 3,538/21g 1994-97
200-YARD PASSING GAMES — SEASon
10 Jamal Londry-Jackson 201210 Armanti Edwards 20099 Richie Williams 20048 Steve Brown 19807 Jamal Londry-Jackson 20117 Pat Murphy 19686 DeAndre Presley 20106 Armanti Edwards 20086 Richie Williams 20056 Bake Baker 19976 Steve Brown 1979
200-YARD PASSING GAMES — CAREER
24 Armanti Edwards 2006-0918 Richie Williams 2002-0517 Jamal Londry-Jackson 2010-pres.17 Steve Brown 1977-8013 Joe Burchette 1999-2002
CONSECUTIVE 200-YARD PASSING GAMES — SEASon
7 Jamal Londry-Jackson CIT-UM 20115 Jamal Londry-Jackson UTC-WOF 20125 Armanti Edwards CIT-FUR 20095 Richie Williams WYO-FUR 2004
300-YARD PASSING GAMES — SEASon
6 Richie Williams 20045 Jamal Londry-Jackson 20125 Armanti Edwards 20094 Armanti Edwards 2008
300-YARD PASSING GAMES — CAREER
10 Armanti Edwards 2006-098 Richie Williams 2002-056 Jamal Londry-Jackson 2010-pres.
PASSING YARDS IN A SEASON BY CLASSSophomore2,001 Jamal Londry-Jackson 168-276 2011Junior3,278 Jamal Londry-Jackson 268-406 2012
TOTAL OFFENSE — SEASon
3,970 Armanti Edwards 515 att. 20093,843 Armanti Edwards 499 att. 20083,745 Richie Williams 502 att. 20053,670 DeAndre Presley 505 att. 20103,606 Jamal Londry-Jackson 520 att. 2012
TOTAL OFFENSE — CAREER
14,753 Armanti Edwards 1,935 att. 2006-09 9,370 Richie Williams 1,411 att. 2002-057,129 Steve Brown 1,160 att. 1977-806,182 D.J. Campbell 1,335 att. 1989-926,147 Jamal Londry-Jackson 908 att. 2010-pres.
TOTAL OFFENSE PER GAME — SEASon
339.3 Richie Williams 3,393/10 g 2004330.8 Armanti Edwards 3,970/12g 2009321.5 Armanti Edwards 3,536/11g 2007300.5 Jamal Londry-Jackson 3,606/12g 2012295.6 Armanti Edwards 3,843/13g 2008
TOTAL OFFENSE PER GAME — CAREER
289.3 Armanti Edwards 14,753/51g 2006-09217.9 Richie Williams 9,370/43g 2002-05216.0 Steve Brown 7,129/33g 1977-80198.3 Jamal Londry-Jackson 6,147/31g 2010-pres.162.0 Scott Satterfield 4,861/30g 1992-95
250-YARD TOTAL OFFENSE GAMES — SEASon
10 Jamal Londry-Jackson 201210 Armanti Edwards 20089 DeAndre Presley 20109 Armanti Edwards 20099 Armanti Edwards 20077 Jamal Londry-Jackson 20117 Armanti Edwards 20067 Richie Williams 20057 Richie Williams 2004
250-YARD TOTAL OFFENSE GAMES — CAREER
35 Armanti Edwards 2006-0917 Jamal Londry-Jackson 2010-pre.14 Richie Williams 2002-0511 Steve Brown 1977-8010 DeAndre Presley 2008-11
300-YARD TOTAL OFFENSE GAMES — SEASon
8 Armanti Edwards 20097 Armanti Edwards 20087 Richie Williams 20046 Jamal Londry-Jackson 20126 Armanti Edwards 20076 Richie Williams 2005
300-YARD TOTAL OFFENSE GAMES — CAREER
24 Armanti Edwards 2006-0913 Richie Williams 2002-0510 Jamal Londry-Jackson 2010-pres.6 Steve Brown 1977-806 DeAndre Presley 2008-11
RECORD STREAKS — Oct. 15, 2011-Sept. 8, 2012Consecutive 200-Yard Passing Games: 9Prev. Record: 5 (Armanti Edwards, 2009; Richie Williams, 2004)
Consecutive Games with 250 Yards of Total Offense: 9Previous Record: 5 (Edwards, three times)
Consecutive 200-Yard Passing Games to Begin a Career as a Starter: 9Previous Record: 2 (Joe Burchette, 2000)
Consecutive Games with 250 Yards of Total Offense to Begin a Career as a Starter: 9Previous Record: 3 (Edwards, 2006)
JAMAL LONDRY-JACKSON IN THE APPALACHIAN STATE RECORD BOOK

@AppState_FB
GAME 1 • AUGUST 31 at MONTANAw
ww
.ap
pst
ates
po
rts.
com
• w
ww
.Pla
yAtT
heR
ock
.co
m
2013
App
alac
hian
Sta
te F
OO
TB
AL
L
8@appstate_sports
• Last season, Londry-Jackson became the third player in Appalachian State history with 3,000 passing yards in a season (Edwards - 2009, Richie Williams - 2004), the fourth with 3,000 yards of total offense in a season (Edwards - 2006-09, Williams - 2004-05 and DeAndre Presley - 2010) and the fifth with 20 touchdown passes in a season (Edwards - 2008, Williams - 2004-05, Presley - 2010 and Pat Murphy - 1968).
• For his career, Londry-Jackson is one of five players in Appalachian State history with 6,000 yards of total offense (Edwards, Wil-liams, Steve Brown - 1977-80 and D.J. Camp-bell - 1989-92), seven with 400 completions (Edwards, Williams, Campbell, Joe Burchette - 1999-2002, Randy Joyce - 1981-84 and Brown) and eight with 5,000 passing yards (Edwards, Williams, Brown, Burchette, Murphy and Joyce).
• In 19 career starts, Londry-Jackson has passed for at least 200 yards and amassed at least 250 yards of total offense 17 times.
• Londry-Jackson has also completed at least 57.5 percent of his passes in 17 of his 19 starts. He has never completed less than half of his passes as a starter.
• Despite throwing 28 more passes than any Mountaineer has ever thrown, Londry-Jack-son completed 66.0 percent of his attempts in 2012, good for fourth in single-season school history.
• Londry-Jackson has completed 63.9 percent of his 628 career pass attempts (436 completions), good for second in school history behind Edwards (768-1,180 - 65.1 percent).
• With 300 passing yards on Saturday at Montana, Londry-Jackson would become the first player in Appalachian State history with four-straight 300-yard passing games. He is currently tied with Edwards for the school record of three-consecutive 300-yard games.
THREE-CONSECUTIVE 300-YD PASSING GAMES APPALACHIAN STATE HISTORY
Jamal Londry-Jackson• 383 vs. Georgia Southern, Nov. 3, 2012• 332 vs. Furman, Nov. 10, 2012• 373 vs. Illinois State, Dec. 1, 2012
Armanti Edwards• 415 vs. Wofford, Oct. 17, 2009• 320 vs. Georgia Southern, Oct. 24, 2009• 355 vs. Furman, Oct. 31, 2009
• Since Londry-Jackson took over as Appa-lachian’s starting quarterback six games into the 2011 season, the Mountaineers have scored touchdowns on 71-of-237 offensive
OFFENSEpossessions with him behind center (30 percent). For comparison’s sake, in its previ-ous 23 possessions before Londry-Jackson took over as starting quarterback on Oct. 15, 2011 at The Citadel, Appalachian’s offense had reached the end zone only twice (8.7 percent).
• Although they’re inexperienced at the position, the Mountaineers enjoy great depth behind Londry-Jackson at quarterback.
• Sophomore Kameron Bryant put together a terrific fall camp to solidify his standing as Londry-Jackson’s top backup.
• Bryant made his collegiate debut in a 55-14 rout over Coastal Carolina on Sept. 29 of last season but just 13 snaps in, he sustained a season-ending knee injury.
• Also adding depth at QB is junior Logan Hallock, who turned in one of Appalachian State’s most memorable performances of the 2012 campaign in a 38-27 win at Western Carolina on Oct. 27.
• After Londry-Jackson went down with a knee injury that would eventually require offseason surgery just 10 minutes in to the win over WCU, Hallock entered the game and completed 20-of-21 passes for 230 yards and two touchdowns.
• Hallock’s .952 completion percentage was a single-game school record and ranked fourth in Southern Conference history (min. 10 com-pletions).
• Hallock, whose only two previous plays as a college quarterback came when he handed off twice to close out Appalachian’s 55-14 win over Coastal Carolina on Sept. 29, completed the first 20 passes he threw against WCU (the first 20 passes of his collegiate career). The 20-consecutive completions were good for a tie for second in SoCon history, behind only the NCAA all-divisions record of 28 set by former Mountaineer Richie Williams versus Furman in 2004.
RUNNING BACKS• The only offensive position where Appa-lachian State does not return a starter this season is running back.
• Most notably, Appalachian must fill the shoes left by the departure of Steven Miller, who rushed for 1,368 yards last season, good for seventh in school history, and amassed 377 receiving yards and 15 total touchdowns (11 rushing, four receiving).
• In addition to Miller, the only other running backs to receive double-digit carries last
year are also no longer at the position. Rod Chisholm (41 att., 154 yds., 2 TD) graduated and Michael Frazier (17 att., 93 yds., 1 TD) returned to his natural position at outside linebacker during the offseason.
• The Mountaineers’ only running back that saw any game action last year is sophomore Ricky Fergerson, who had five carries for one yard as a true freshman in 2012.
• Despite the inexperience, Fergerson has earned the starting assignment at running back with strong performances during spring practice and fall camp.
• Among those expected to back Fergerson up are redshirt freshman Paul Magloire, true freshman Marcus Cox and sophomore Eric Davidson, a transfer from the University of Utah.
WIDE RECEIVERS• Appalachian State boasts what many prog-nosticators consider to be the nation’s top corps of wide receivers.
• Appalachian wideouts combined for 242 receptions for 2,966 yards and 17 touch-downs a year ago and all six players that contributed to that production — seniors Andrew Peacock and Tony Washington and sophomores Sean Price, Malachi Jones, Simms McElfresh and Tacoi Sumler are back in 2013.
• Price, Peacock, Washington and Jones all ranked among the Southern Conference’s top 20 in receiving yards and receptions per game.
APPALACHIAN STATE RECEIVERS IN THE 2012 SoCon RANKINGS
Player Receiving Yards ReceptionsSean Price 2nd - 1,196 (138.7 ypg) 2nd - 81 (8.1 pg)Andrew Peacock 3rd - 795 (66.3 ypg) 3rd - 79 (6.2 pg)Tony Washington 10th - 472 (39.3 ypg) 11th - 39 (3.5 pg)Malachi Jones 16th - 370 (30.8 ypg) 18th - 32 (2.7 pg)
• Over the last 19 games (which coincide with classmate Jamal Londry-Jackson’s 19 starts at quarterback), Peacock and Washing-ton have combined for 166 receptions, 1,844 receiving yards and 10 touchdown catches.
GAME 1 • AUGUST 31 at MONTANA 2013 A
ppalachian State FO
OT
BA
LL
w
ww
.app
statespo
rts.com
• ww
w.P
layAtTh
eRo
ck.com
@AppState_FB9@appstate_sports
ANDREW PEACOCK & TONY WASHINGTONWITH JAMAL LONDRY-JACKSON AS STARTING QB PEACOCK WASHINGTON Rec. Yds. TD Rec. Yds. TDThe Citadel ‘11 5 39 0 1 28 1*Samford ‘11 3 55 0 6 78 1*Ga. Southern ‘11 2 50 1* 3 32 0Furman ‘11 8 79 0 7* 59 0W. Carolina ‘11 6 56 0 5 33 0Elon ‘11 5 47 0 2 21 0Maine ‘11 6 75 1* 1 16 0E. Carolina ‘12 5 77 0 7* 102* 0Montana ‘12 5 57 1* 2 22 0The Citadel ‘12 5 43 0 2 12 0UTC ‘12 5 44 0 2 29 0Coastal Car. ‘12 3 39 0 2 9 0Elon ‘12 7 71 1* 2 61 1*Samford ‘12 7 60 0 2 21 0Wofford ‘12 7 55 0 7* 75 0W. Carolina, ‘12 7 68 0 4 57 1*Ga. Southern, ‘12 6 72 0 2 35 1*Furman, ‘12 11* 130* 1* 6 37 0Illinois State, ‘12 11* 79 1* 1 12 0Last 19 Games 114 1,196 6 64 739 52012 79* 795* 4* 39* 472* 3*
* career highs
• Peacock has had no fewer than six recep-tions and 55 receiving yards in seven-straight games. He is averaging eight receptions and 76.4 yards per game (56 receptions for 535 yards total) over the seven-game stretch, which began on Oct. 6 of last season vs. Elon.
• Peacock also threw touchdown passes in each of the final two games of last season (Nov. 10 vs. Furman and Dec. 1 vs. Illinois State). He is a perfect 2-for-2 for 17 yards and two touchdowns passes in his career (both to tight end Drew Bailey).
• While Peacock ranked second on the squad behind Price in both receptions and receiv-ing yards last season as one of the nation’s top possession receivers, it’s Washington that has drawn the attention of preseason prognosticators in 2013. Washington was named preseason all-America as a receiver (third-team), kickoff returner (third-team) and punt returner (fourth-team) by Phil Steele. The speedster was also tabbed third-team preseason all-America as a return specialist by The Sports Network.
• Washington established himself as one of the nation’s premier playmakers with 1,316 all-purpose yards (472 receiving, 71 rush-ing, 635 on kickoff returns and 144 on punt returns) as a junior last season. For more on Washington as a return specialist, see p. 11.
• Appalachian State will be without the services of Price for an undetermined number of games due to a violation of team rules.
• Last season, Price needed just 10 games to set NCAA Division I FCS freshman records with 81 receptions and 1,196 receiving yards, shattering the previous records of 71 receptions (set by Cal State Northridge’s Drew
OFFENSEAmerson in 1999) and 1,073 yards (set by Marshall’s Randy Moss in 1996).
TIGHT ENDS• Appalachian State also returns its entire slate of tight ends from a season ago, head-lined by junior Drew Bailey and senior Josh Anding.
• Bailey started 10 games and played in all 12 for the Mountaineers last season. He was the only tight end on the squad with any receptions (nine for 123 yards and four touch-downs).
• Bailey’s four touchdown catches were the most by an Appalachian tight end since Ben Jorden hauled in six touchdown receptions in 2010.
• Bailey was the only Mountaineer in 2012 to catch touchdowns from three different pass-ers. Jamal Londry-Jackson threw Bailey’s touchdown catch versus Coastal Carolina on Sept. 29, backup QB Logan Hallock tossed a 16-yarder scoring strike to Bailey on Oct. 27 at Western Carolina and WR Andrew Peacock connected with Bailey on a reverse option in the regular-season finale versus Furman and out of the wildcat formation in the sea-son-ending loss to Illinois State.
OFFENSIVE LINE• Appalachian State’s veteran offense is rounded out by returning all five primary starting offensive linemen from a season ago — LT Kendall Lamm, LG Shaq Counts, C Graham Fisher, RG Alex Acey and RT Will Corbin.
• Due to a wide array of injuries and other factors, Appalachian used five different com-binations of starting offensive linemen during the regular season.
• After a terrific start to the season, the depleted personnel took its toll on the young offensive line over the second half of the regular season.
• Through the first six games of 2012, the Mountaineers surrendered just five sacks (.83 per game) but over the final six ballgames, they allowed 20 (3.3 per game).
• Despite not being able to maintain the ultra-strong start to the campaign through-out the year, Appalachian’s offensive line remained one of the nation’s best in terms of sacks allowed per pass attempt. Of the 61 NCAA Division I FCS teams that allowed 25 sacks or less last season, only five (Stephen F. Austin, Drake, Illinois State, Richmond and Central Arkansas) attempted more passes than the Mountaineers’ 430.
• Last season’s spate of injuries caused Appa-lachian State to have to juggle offensive-line personnel for the second-straight year. In all, Appalachian has used 10 different starting combinations across the offensive front over the past two seasons.
• Prior to 2011, consistency across the offensive front was commonplace for the Mountaineers, who utilized the same starting five on the offensive line for 12-of-13 games in 2010 and put the same starting five on the field for all 14 games in 2009 and all 14 contests in 2008. To put that unprecedented stretch of consistency in perspective, prior to 2008, it had been 19 years (1989 — Jerry Moore’s first season as Appalachian’s head coach) since the Mountaineers featured the same five starting offensive lineman for every game in a campaign.
• When center Graham Fisher caught a deflected pass and rumbled 13 yards for a first down in the third quarter of the Moun-taineers’ win over Montana on Sept. 8 of last season, he became the first Appalachian offensive lineman to catch a pass since center Scott Suttle hauled in a batted pass for no yardage at Kansas in 2005.
@AppState_FB
GAME 1 • AUGUST 31 at MONTANAw
ww
.ap
pst
ates
po
rts.
com
• w
ww
.Pla
yAtT
heR
ock
.co
m
2013
App
alac
hian
Sta
te F
OO
TB
AL
L
10@appstate_sports
DEFENSE• Appalachian State is transitioning to a true 3-4 defense under new defensive coordinator Nate Woody in 2012.
• Woody came to Appalachian from South-ern Conference rival Wofford, where he coor-dinated the league’s top defense three times in 13 years, including 2010 and 2012.
• Woody inherits a high-octane defense that ranked among the SoCon leaders in tackles for loss, sacks and interceptions last season.
• The Mountaineers led the Southern Confer-ence and ranked 37th nationally with 77 stops behind the line of scrimmage in 2012 (6.4 pg).
• Appalachian opened the 2012 campaign with four-consecutive games with seven or more tackles for loss, marking the first time since 2007 that the Mountaineers registered seven or more stops behind the line of scrim-mage in four-straight games. App State had eight-straight games with at least seven TFL from Sept. 8-Nov. 3, 2007.
2012 APPALACHIAn STATE GAmE-BY-GAmE TFLOpponent TFL-YardsEast Carolina .....................................................................7-11Montana ............................................................................8-24The Citadel ........................................................................9-21Chattanooga ....................................................................7-24Coastal Carolina ................................................................2-6Elon ......................................................................................8-24Samford..............................................................................8-60Wofford ................................................................................4-8Western Carolina ............................................................9-50Georgia Southern ...........................................................5-17Furman ...............................................................................5-15Illinois State ......................................................................5-17Total ............................................................. 77-277
• After recording only two sacks over the first three games of the season (0.7 per game), Appalachian’s pass rush was tenacious for the rest of the 2012 season with 24 sacks over the final nine games (2.7 per game).
• The Mountaineers’ sack attack over the last nine games of last season was even more impressive considering that they did not record any sacks in games against Wofford’s and Georgia Southern’s triple-option offenses. Those two contests notwithstanding, the Apps averaged 3.4 sacks per game over the other seven contests of the final nine-game stretch.
2012 APPALACHIAn STATE GAmE-BY-GAmE SACKSOpponent Sacks-YardsEast Carolina .......................................................................0-0Montana ............................................................................2-10The Citadel ..........................................................................0-0Chattanooga ....................................................................4-17Coastal Carolina ................................................................1-5Elon ......................................................................................4-14Samford..............................................................................6-55Wofford ................................................................................0-0Western Carolina ............................................................7-48Georgia Southern .............................................................0-0Furman .................................................................................1-6Illinois State ........................................................................1-5Total ............................................................. 26-160
• Appalachian State finished tied atop the Southern Conference and tied for 15th na-tionally with 14 interceptions last season.
• Since 2008, Appalachian’s 82 interceptions are 15 more than the next-closest SoCon team during that same span (Samford — 67).
SoCon INTERCEPTIONS (2008-12) 2012 2011 2010 2009 2008 TotalApp State 14 17 14 18 19 82Samford 14 13 15 7 18 67Furman 6 13 14 9 13 55Ga. Southern 8 16 15 11 5 55Wofford 11 9 16 6 13 55Elon 8 8 13 14 10 53Chattanooga 8 12 13 11 8 52The Citadel 6 6 10 11 3 36W. Carolina 5 5 11 2 12 35
• Despite an inflated yards-per-game aver-age due in large part to playing three teams that ranked among the top four nationally in rushing yardage last season (Georgia South-erm, Wofford and The Citadel), Appalachian State was also strong against the run for the most part in 2012. The Mountaineers held five opponents to less than 100 rushing yards and surrendered an average of just 116.1 rushing yards per game against their nine non-tri-ple-option opponents.
• The Mountaineers limited 3-of-4 oppo-nents from Sept. 22-Oct. 13 to less than 100 rushing yards (87 at Chattanooga, 96 vs. Elon, 82 at Samford), marking the first time since Nov. 14-28, 2009 (58 at Elon, 70 vs. Western Carolina, 33 vs. South Carolina State) that App State held 3-of-4 opponents under the century mark for rushing.
DEFENSIVE LINE• Appalachian State’s most experienced group on defense is its defensive line, where the nine players listed on this week’s depth chart have combined for 58 career starts.
• The Mountaineers’ depth across the defen-sive front is so good that Appalachian was able to move Davante Harris, who earned freshman all-America recognition as a defen-sive end last season, to the offensive line.
• Leading the way is junior Ronald Blair, who has started all 24 games of his career at defensive end. Blair’s streak 24-consecutive starts is the longest on the team (Jamal Lon-dry-Jackson ranks second with 19-straight starts at quarterback).
• Blair ranked among the Southern Con-ference’s top 25 in both tackles for loss (8.5 - 14th) and sacks (3.0 - t-21st) last season.
• Senior Adam Scott is one of two Appala-chian State defenders (linebacker Karl Ander-son being the other) that originally elected to forego his final season of eligibility after earning his bachelor’s degree last Decem-ber. However, he decided this past spring to return to the squad while pursuing an MBA as a graduate student at Appalachian.
• Scott made six starts and recorded six tack-les for loss and five sacks as fourth-year junior last season.
LINEBACKERS• Perhaps the two biggest sets of shoes to fill for Appalachian State in 2013 are those left behind by the graduation of linebackers Jeremy Kimbrough and Brandon Grier.
• The duo combined for 217 tackles, 20.5 tackles for loss and 10.5 sacks last season and 557 tackles, 50 tackles for loss and 18 sacks during their brilliant four-year careers.
• Last season, Kimbrough ranked fifth nationally with 143 total tackles last season, good for seventh in school history.
• This week’s depth chart at linebacker includes five freshmen and just three players that have previously logged any significant minutes at App State — senior Michael Frazier (three career starts), senior Karl Anderson (two starts) and junior Brandon McGowan (one start).
• Frazier, who began his collegiate career as a linebacker before moving to running back the past two seasons, is back at his natural position and has earned a starting nod at one of the outside linebacker positions.
• Frazier is the only player on the Appala-chian State roster that played in the 2009 NCAA Division I Football Championship semi-final between Appalachian and Montana at Washington-Grizzly Stadium. Frazier came off the bench to record six tackles (one shy of his career high) during the Mountaineers’ 24-17 loss.
• Anderson is one of two Appalachian State defenders (defensive end Adam Scott being the other) that originally elected to forego

GAME 1 • AUGUST 31 at MONTANA 2013 A
ppalachian State FO
OT
BA
LL
w
ww
.app
statespo
rts.com
• ww
w.P
layAtTh
eRo
ck.com
@AppState_FB11@appstate_sports
DEFENSEhis final season of eligibility after earning his bachelor’s degree last December. However, he decided this past spring to return to the squad while pursuing an MBA as a graduate student at Appalachian.
• Anderson made 39 stops and started two games as a fourth-year junior last season.
DEFENSIVE BACKS• Another area where Appalachian State is stocked with young talent is in its secondary.
• With the graduation of all-America corner-back Demetrius McCray and four-year starter Troy Sanders and the move of starting safety Patrick Blalock to outside linebacker, Appala-chian returns only one starter to its secondary in 2013 — junior Joel Ross, who spent last season at the “star” position before transition-ing to cornerback this year.
• Despite the reshuffling, the Mountaineers still boast 25 combined starts among their defensive backs — 12 by senior cornerback Rodger Walker, 10 by Ross and three by sophomore Doug Middleton, who is coming off a foot injury that cost him all but one game of the 2012 campaign.
SPECIAL TEAMS• Tony Washington is a consensus presea-son all-American as a return specialist, having earned third-team honors from The Sports Network, as well as third- (kickoff returner) and fourth-team (punt returner) recognition from Phil Steele.
• As a junior in 2012, Washington ranked 11th nationally with a 27.3-yard kickoff-return average and 21st with a 9.0-yard punt-return average.
• On Oct. 20 of last season, Washington recorded Appalachian State’s first kickoff return for a touchdown in five years versus Wofford. Washington’s 99-yard return, which gave Appalachian a 28-24 lead in the third quarter of the 38-28 loss to the Terriers, was the Mountaineers’ first kickoff return for a touchdown since CoCo Hillary’s 95-yarder at Wofford in 2007.
• Washington’s 99-yard return was the sec-ond-longest in Appalachian State history and the longest since Keith Nash’s school-record 100-yarder at Lenoir-Rhyne in 1968.
• With the graduation of All-American Sam Martin (now the starting punter for the Detroit Lions), senior Drew Stewart has re-emerged as Appalachian State’s primary place kicker.
• Stewart served as the Mountaineers’ prima-ry place kicker for the final six games of the 2011 campaign and the first eight games of last season.
• Known for his accuracy, Stewart has made 70 percent of his field-goal attempts in his career (14-of-20) and 96.2 percent of his extra-point attempts (51-of-53).
• As a sophomore, Stewart etched his name in the school and Southern Conference record books when he kicked six field goals and accounted for 21 points in the Mountaineers’ 46-14 rout over Western Carolina on Nov. 12, 2011.
APPALACHIAN ST. SINGLE-GAME FIELD GOALS1) 6 Drew Stewart Western Carolina 20112) 4 Sam Martin Furman 2012 4 Jay Millson Furman (3 OT) 1991 4 Bjorn Nittmo Gardner-Webb 1988 4 Bjorn Nittmo Wake Forest 1987 4 Bjorn Nittmo The Citadel 1986
APPALACHIAN ST. SINGLE-GAME KICK SCORING1) 21 Drew Stewart Western Carolina 20112) 15 Sam Martin Furman 2012 15 Bjorn Nittmo Gardner-Webb 1988 15 Bjorn Nittmo The Citadel 1986
SoCon SINGLE-GAME FIELD GOALS1) 6 Drew Stewart (ASU) Western Carolina 2011 6 Josh Jones (WCU) Samford 1999
SoCon SINGLE-GAME KICK SCORING1) 21 Drew Stewart (ASU) Western Carolina 2011 20 Josh Jones (WCU) Samford 1999
• Stewart’s 21 points against WCU in 2011 fell just three points shy of the NCAA Division I FCS record of 24, set by Northern Arizona’s Goran Lingmerth versus Idaho in 1986.
• With his 21 points, Stewart outscored 32 of the 116 FCS teams that played on Nov. 12, 2011 and matched the scoring output of six others.
• Two youngsters — sophomore Zach Matics and walk-on true freshman Bentlee Critcher — are vying to fill the void left behind by the graduation of Martin, a first-team Associated Press All-American last season, at both punter and on kickoffs.
• Neither Matics nor Critcher have seen game action during their collegiate careers.
• Martin ranked third nationally last season with a 45.9-yard punting average (second-highest in school history). He set a school record with 25 punts downed inside the 20 yard line and helped Appalachian rank second nationally with a 40.8-yard net average.
• Martin also averaged 63.1 yards with 45 touchbacks on 71 kickoffs in 2012.
APPALACHIAn STATE CoACHES on GAmEDAYON THE FIELDHead Coach:Scott Satterfield — First season (Appalachian State, 1996)Defensive Coordinator/Inside Linebackers: Nate Woody — First season (Wofford, 1984)Co-Offensive Coordinator (Running Game)/OL: Dwayne Ledford — Second season (East Carolina, 1999)Cornerbacks: Bryan Brown — Second season (Mississippi, 2006)Running Backs: Chris Foster — Second season (Gardner-Webb, 2004)Outside Linebackers/Special Teams: Mark Ivey — Second season (Appalachian State, 1996)Wide Receivers: Justin Stepp — Second season (Furman, 2007)Graduate Assistant (Tight Ends): Nic Cardwell — Fourth season (Appalachian State, 2008)Graduate Assistant (Special Teams): B.J. Frazier — First season (Appalachian State, 2010)Graduate Assistant (Offense): Tyler McEntire — First season (Appalachian State, 2013)
IN THE BOOTHCo-Offensive Coordinator (Passing Game)/QB:Frank Ponce — First season (Florida International, 1997)Defensive Line: Dale Jones — 18th season (Tennessee, 1988)Secondary/Recruiting Coordinator: Scot Sloan — Fourth season (Clemson, 1992)Graduate Assistant (Defense): Greg Gasparato — First season (Wofford, 2009)

@AppState_FB
GAME 1 • AUGUST 31 at MONTANAw
ww
.ap
pst
ates
po
rts.
com
• w
ww
.Pla
yAtT
heR
ock
.co
m
2013
App
alac
hian
Sta
te F
OO
TB
AL
L
12@appstate_sports
MISCELLANEOUSYOUTH MOVEMENT• Appalachian State is likely fielding one of the youngest squads at any level of college football this season with just 11 seniors and a whopping 52 freshmen on its current 108-player roster.
• All told, just 30 of the team’s 108 current players are upperclassmen (27.8 percent).
2013 APPALACHIAn STATE RoSTER BY CLASSClass No.True Freshmen ....................................................................36Redshirt Freshmen ............................................................16Sophomores ........................................................................26Juniors ...................................................................................19Seniors ...................................................................................11
• Appalachian’s depth chart is similarly skewed with upperclassmen holding down just 21 of the 55 spots on this week’s two-deep (38.2 percent).
THIS WEEK’S APPALACHIAn STATE DEPTH CHART BY CLASS
Class No.True Freshmen ...................................................................... 9Redshirt Freshmen .............................................................. 8Sophomores ........................................................................17Juniors ...................................................................................13Seniors ..................................................................................... 8
ROAD WARRIORS• Since going winless on the road in 2004, Appalachian State is 32-7 versus NCAA Divi-sion I FCS competition and 33-13 overall away from Kidd Brewer Stadium.
• Since sustaining a four-game road losing streak from Nov. 6, 2010-Oct. 1, 2011, Appa-lachian has won six of its last eight road tilts, including 6-of-7 versus FCS opponents.
• The Mountaineers went 4-0 in Southern Conference road games last season, marking only the eighth time in 41 seasons in the SoCon that Appalachian went undefeated on the road in league play.
WELCOME TO THE ROCK• Appalachian State has won 65 of its last 73 games at Kidd Brewer Stadium, dating back to the beginning of the 2003 season.
• For the sixth-straight season, Appalachian State led NCAA Division I FCS in regular-sea-son attendance this season with an average attendance of 27,964 over its six home games in 2012.
• The crowd of 30,856 for the Sept. 8 home opener versus Montana was the third-largest in Kidd Brewer Stadium history and the sec-ond-largest on-campus crowd for an NCAA Division I FCS game last season (behind only the 31,123 that attended the Harvard-Yale game at Harvard Stadium).
KIDD BREWER STADIUMREGULAR-SEASON ATTENDANCE AVERAGES
Year Avg. Attend. FCS Rank Pct. of Capacity2012 27,964 1st 116&
2011 28,031 1st% 121$
2010 29,449 1st 136*2009 25,969 1st 120*2008 28,727 1st 143^ 2007 27,140 1st 163# 2006 22,589 2nd 136# 2005 23,169 2nd 139#
% Texas-San Antonio averaged 35,521 over six home games but was not eligible for official NCAA statistics as a reclassify-ing/provisional team in its first season of football.& 24,050-seat capacity$ 23,150-seat capacity* 21,650-seat capacity^ 20,150-seat capacity# 16,650-seat capacity
• Appalachian State has played in front of over-capacity crowds for 46-straight regu-lar-season games at Kidd Brewer Stadium, dating back to the beginning of the 2005 campaign.
MOUNTAINEERS IN THE NFL• As of Monday, Aug. 26, 13 former Appala-chian State players are on active NFL rosters.
FORMER MOUNTAINEERS IN THE NFLName Pos. Year Pro TeamTravaris Cadet RB 2nd New Orleans SaintsArmanti Edwards WR 4th Carolina PanthersJabari Fletcher DL 1st Dallas CowboysJason Hunter DL 8th Oakland RaidersDaniel Kilgore OL 3rd San Francisco 49ersJeremy Kimbrough* LB 1st Washington RedskinsCorey Lynch DB 6th Tennessee TitansSam Martin P 1st Detroit LionsDemetrius McCray DB 1st Jacksonville JaguarsSteven Miller RB 1st Detroit LionsDeAndre Presley DB 2nd Miami DolphinsBrian Quick WR 2nd St. Louis RamsD.J. Smith LB 3rd San Diego Chargers* injured reserve — will miss remainder of 2013 season
• Earlier this month, 15 former Mountaineers were on NFL rosters, which was as many or more than: • 10 BCS/Power 5 conference programs (Colorado, Duke, Indiana, Iowa State, Kansas, Minnesota, Northwestern, Wake Forest, Wash-ington State and Vanderbilt) • 58 of 125 FBS programs • every Sun Belt Conference program • all non-FBS programs
• The record for former Appalachian State players on active NFL regular-season rosters is eight, originally set in 1987 and matched last season.
INJURY REPORTOutILB Osvaldo Sombo (upper body)DB Chris Starks (lower body)WR Andy Shuler (lower body)
QuestionableTE Josh Anding (upper body)OL Ian Barnard (upper body)DB Treyon Garnett (lower body)
PRESEASON POLLS, HONORS2013 PRESEASON SoCon COACHES POLL Team Pts. (1st-place votes)1) Georgia Southern .............................................................57 (6)2) Appalachian State ............................................ 51 (2)3) Chattanooga ......................................................................47 (1)4) Samford ..................................................................................... 435) Wofford ...................................................................................... 406) The Citadel ................................................................................ 337) Furman ....................................................................................... 258) Elon.............................................................................................. 169) Western Carolina .................................................................... 12
2013 PRESEASON SoCon MEDIA POLL Team Pts. (1st-place votes)1) Georgia Southern ........................................................210 (15)2) Wofford ............................................................................. 194 (4)2) Appalachian State .......................................... 190 (6)4) Chattanooga ................................................................... 176 (2)5) Samford ...................................................................................1496) The Citadel ..............................................................................1267) Furman .............................................................................. 107 (1)8) Elon.............................................................................................. 619) Western Carolina .................................................................... 47
PRESEASON ALL-SoConFirst TeamQB Jamal Londry-Jackson (Offensive Player of the Year)OL Kendall LammWR Andrew PeacockWR Sean PriceDL Ronald BlairRS Tony Washington
Second TeamDB Joel RossPK Drew Stewart
PRESEASON ALL-AmERICAFirst TeamWR Sean Price (The Sports Network, Phil Steele)
Third TeamRS Tony Washington (The Sports Network)WR Tony Washington (Phil Steele)KR Tony Washington (Phil Steele)
Fourth TeamPR Tony Washington (Phil Steele)
WALTER PAYTON AWARD WATCH LISTQB Jamal Londry-JacksonWR Sean Price
SENIOR BOWL WATCH LISTQB Jamal Londry-JacksonWR/RS Tony Washington

GAME 1 • AUGUST 31 at MONTANA 2013 A
ppalachian State FO
OT
BA
LL
w
ww
.app
statespo
rts.com
• ww
w.P
layAtTh
eRo
ck.com
@AppState_FB13@appstate_sports
SIMMS McELFRESHReceptions: ...................................... 2 (ECU - 12, MONT - 12)Receiving Yards: ....................................................44 (ISU - 12)TD Receptions: .......................................................................N/A
BRANDON McGOWANTackles: .................................................... 4 (VT - 11, WOF - 11)Tackles for Loss: ...........................................................1.0 (SSU)Sacks: ..............................................................................1.0 (SSU)
DOUG MIDDLETONTackles: ..................................................................... 6 (UTC - 11)Tackles for Loss: ............................................... 0.5 (NCAT - 11)Sacks: ........................................................................................N/A
GREG MILHOUSETackles: .....2 (ECU - 12, CIT - 12, UTC - 12, CCU - 12, SAM - 12, ISU - 12)Tackles for Loss: ...........0.5 (ECU - 12, CCU - 12, SAM - 12)Sacks: ....................................................................0.5 (SAM - 12)
ANDREW PEACOCKReceptions: ..........................................11 (FUR - 12, ISU - 12)Receiving Yards: ................................................130 (FUR - 12)TD Receptions: . 1 (WOF - 11, GSU - 11, MAINE - 11, MONT - 12, ELON - 12, FUR- 12, ISU - 12)Rushes: ......................................................................3 (FUR - 12)Rushing Yards: ........................................................26 (CIT - 11)Rushing TDs: ...........................................................................N/ACompletions .......................................... 1 (FUR - 12, ISU - 12)Passing Yards ..........................................................10 (ISU - 12)Passing TDs ........................................... 2 (FUR - 12, ISU - 12)
SEAN PRICEReceptions: .............................................................13 (ISU - 12)Receiving Yards: ............................................... 231 (GSU - 12)TD Receptions: .................................... 2 (UTC - 12, CCU - 12)
DEUCE ROBINSONTackles: .................................................................8 (MONT - 12)Tackles for Loss: .................................................. 2.5 (SSU - 11)Sacks: ..................................................................... 2.0 (SSU - 11)
JOEL ROSSTackles: ..................................................................... 7 (UTC - 12)Tackles for Loss: ............................................. 2.0 (MONT - 12)Sacks: ........................................................................................N/A
ADAM SCOTTTackles: .................................................................... 7 (SAM - 12)Tackles for Loss: .............................. 3.0 (UTC - 12, SAM - 12)Sacks: ....................................................................3.0 (SAM - 12)
TACOI SUMLERReceptions: ............................................................... 3 (CIT - 12)Receiving Yards: ..................................................31 (CCU - 12)TD Receptions: .......................................................................N/A
RODGER WALKERTackles: ...................................................................8 (ELON - 11)Tackles for Loss: .....................................................................N/ASacks: ........................................................................................N/A
KEVIN WALTONTackles: ..................................................................... 3 (GSU - 12)Tackles for Loss: .....................................................................N/ASacks: ........................................................................................N/A
TONY WASHINGTONReceptions: .......................7 (FUR - 11, ECU - 12, WOF - 12)Receiving Yards: ............................................... 102 (ECU - 12)TD Receptions: ... 1 (CIT - 11, SAM - 11, ELON - 12, WCU - 12, GSU - 12)Rushes: .................................................2 (CCU - 12, WCU - 12)Rushing Yards: ........................................................22 (CIT - 12)Rushing TDs: .........................................1 (CIT - 12, WCU - 12)
CAREER HIGHSKARL ANDERSONCareerTackles: ..........................10 (WOF - 12, WCU - 12, GSU - 12)Tackles for Loss: .................................................0.5 (SAM - 11)Sacks: ........................................................................................N/A
DREW BAILEYReceptions: ..............................................................2 (FUR - 12)Receiving Yards: .................................................. 28 (FUR - 12)TD Receptions: ...... 1 (CCU - 12, WCU - 12, FUR - 12, ISU - 12)
HENRY BARNESTackles: ..................................................................... 3 (CCU - 12)Tackles for Loss: .....................................................................N/ASacks: ........................................................................................N/A
RONALD BLAIRTackles: ................................................................. 10 (WOF - 12)Tackles for Loss: .. 2.0 (GSU - 11, ELON - 11, ELON - 12, WCU - 12)Sacks: ...........................................................................2.0 (ELON)
PATRICK BLALOCKTackles: .....................................................................10 (CIT - 12)Tackles for Loss: ...1.0 (CIT - 12, UTC - 12, GSU - 12, FUR - 12)Sacks: ........................................................................................N/A
THOMAS BRONSONTackles: ..................................................................... 5 (GSU - 12)Tackles for Loss: ................................................0.5 (WCU - 12)Sacks: ...................................................................0.5 (WCU - 12)
KAmERon BRYAnTCompletions ........................................................... 1 (CCU - 12)Passing Yards ..........................................................................N/APassing TDs ............................................................................ N/ARushes ...................................................................... 5 (CCU - 12)Rushing Yards .......................................................24 (CCU - 12)Rushing TDs ............................................................................N/A
STEPHEN BURNSTackles: ....................................................................7 (WOF - 12)Tackles for Loss: .....1.0 (CIT - 12, UTC - 12, WCU - 12, GSU - 12)Sacks: ........................................................................................N/A
RICKY FERGERSONRushes: ..................................................................... 2 (ECU - 12)Rushing Yards: ........................................................ 3 (CCU - 12)Rushing TDs: ...........................................................................N/AReceptions: .......................................... 1 (ECU - 12, CCU - 12)Receiving Yards: .................................................... 4 (ECU - 12)Receiving TDs: ........................................................................N/A
MICHAEL FRAZIERTackles ...................................................................... 7 (GSU - 09)Tackles for Loss: .....................................................................N/ASacks: ........................................................................................N/A
MALACHI JONESReceptions: ............................................................... 6 (CIT - 12)Receiving Yards: ..................................................69 (ECU - 12)TD Receptions: ......................................1 (GSU - 12, ISU - 12)
AARON KRAHTackles: .................................................. 2 (ECU - 12, CCU - 12)Tackles for Loss: .....................................................................N/ASacks: ........................................................................................N/A
JOHN LAWTackles: .....................................................1 (ECU - 12, CIT - 12)Tackles for Loss: .....................................................................N/ASacks: ........................................................................................N/A
JAmAL LonDRY-JACKSonCompletions ...........................................................33 (ISU - 12)Passing Yards ..................................................... 383 (GSU - 12)Passing TDs .................................... 4 (ELON - 11, ELON - 12)Rushes ................................................................. 17 (ELON - 12)Rushing Yards .................................................... 94 (ELON - 12)Rushing TDs ..................................... 2 (NCAT - 11, WCU - 11)
@AppState_FB
GAME 1 • AUGUST 31 at MONTANAw
ww
.ap
pst
ates
po
rts.
com
• w
ww
.Pla
yAtT
heR
ock
.co
m
2013
App
alac
hian
Sta
te F
OO
TB
AL
L
14@appstate_sports
STARTING LINEUPSOFFENSE TE LT LG C RG RT WR WR WR QB RB
Montana
North Carolina A&T
Elon
Charleston Southern
The Citadel
Samford
Furman
Georgia Southern
Chattanooga
Georgia
Wofford
Western Carolina
DEFENSE LE NT RE OLB ILB ILB OLB SS FS LCB RCB
Montana
North Carolina A&T
Elon
Charleston Southern
The Citadel
Samford
Furman
Georgia Southern
Chattanooga
Georgia
Wofford
Western Carolina
DRIVE CHART DISPLAYED APPALACHIAN/OPPONENT
FGs FGs 80+ 3 andGame Possessions TDs Made Missed Fum. Int. Safety Punt Downs Half Game Yards Out
Montana
N.C. A&T
Elon
Charleston Sou.
The Citadel
Samford
Furman
Ga. Southern
Chattanooga
Georgia
Wofford
W. Carolina
TOTALS

GAME 1 • AUGUST 31 at MONTANA 2013 A
ppalachian State FO
OT
BA
LL
w
ww
.app
statespo
rts.com
• ww
w.P
layAtTh
eRo
ck.com
@AppState_FB15@appstate_sports
THE LAST TIME ...
TEAM Appalachian State Opponent
Scored 30-39 Points 12/1/12, vs. Illinois State (37) 12/1/12, Illinois State (38)
Scored 40-49 Points 11/12/11, vs. Western Carolina (46) 10/15/11, The Citadel (42)
Scored 50-59 Points 9/29/12, vs. Coastal Carolina (55) 9/15/12, The Citadel (52)
Scored 60-69 Points 11/17/01, vs. West Virginia Tech (64) 9/3/11, Virginia Tech (66)
Scored 70-79 Points 10/31/08, vs. Wofford (70) 10/7/78, Chattanooga (72)
Recorded a Safety 11/21/09, vs. Western Carolina 9/12/09, McNeese State
Recorded a Shutout 9/16/06, vs. Mars Hill (41-0) 11/5/05, LSU (24-0)
Rushed for 400+ Yards 12/4/10, vs. Western Illinois (417) 9/15/12, The Citadel (463)
Rushed for 300-399 Yards 9/29/12, vs. Coastal Carolina (399) 11/3/12, Georgia Southern (386)
Rushed for Less Than 50 Yards 12/3/11, vs. Maine (3) 11/19/11, Elon (40)
Passed for 400+ Yards 10/17/09, at Wofford (415) 10/6/12, Elon (419)
Passed for 300-399 Yards 12/1/12, vs. Illinois State (383) 12/1/12, Illinois State (322)
Passed for Less Than 50 Yards 12/4/10, vs. Western Illinois (47) 10/20/12, Wofford (47)
Gained Over 500 Yards Total Offense 10/27/12, at Western Carolina (580) 11/3/12, Georgia Southern (552)
Gained Less Than 100 Yards Total Offense 9/7/91, at Clemson (84) 11/22/08, Western Carolina (72)
Recorded 25 or More First Downs 11/10/12, vs. Furman (27) 9/1/12, East Carolina (25)
Was Penalized 100 Yards 9/29/12, vs. Coastal Carolina (10 for 112) 12/2/06, Montana State (9 for 116)
Defense Intercepted Three Passes 10/6/12, vs. Elon (3) 9/3/11, Virginia Tech (3)
Overcame Halftime Deficit to Win 9/24/11, vs. Chattanooga 11/6/10, Georgia Southern
(Trailed 6-0 before winning 14-12) (Appalachian led 14-7 at half, GSU won 21-14 in OT)
Trailed After Three Quarters, Rallied to Win 11/3/12, at Georgia Southern 10/20/12, Wofford
(Trailed 28-24 before winning 31-28) (Appalachian led 28-24 before losing 38-28)
Won Game on Final Offensive Play 10/13/12, at Samford 12/1/12, Illinois State
(Jamal Londry-Jackson 22-yd TD pass to Sean Price, :22 left) (James O’Shaughnessy 25-yd TD pass from Matt Brown in OT)
Won Game on Final Defensive Play 10/12/02, vs. Furman Never Accomplished
(Josh Jeffries PAT Interception, Derrick Black 96-Yd Return)
INDIVIDUAL Appalachian State Opponent
75+ Yard Run 9/29/12, Steven Miller vs. Coastal Carolina (75) 10/19/02, Mark Myers, Georgia Southern (92)
100-199 Yards Rushing, Game 11/10/12, Steven Miller (170) vs. Furman 11/3/12, W. Banks (129) and J. McKinnon (121), Ga. Southern
200+ Yards Rushing, Game 10/27/12, Steven Miller at Western Carolina (245) 10/29/05, Eldra Buckley, Chattanooga (210)
Three Rushing TDs, Game 9/15/12, Steven Miller vs. The Citadel (3) 11/3/12, William Banks, Georgia Southern (3)
Four Rushing TDs, Game 10/30/09, Armanti Edwards at Furman (4) 10/2/04, Terrell Harris, Texas State (4)
80+ Yard Pass Completion 9/3/05, R. Williams to J. Little vs. E. Kentucky (88) 9/8/12, Trent McKinney to Dan Moore, Montana (87)
300+ Yards Passing, Game 12/1/12, Jamal Londry-Jackson vs. Illinois State (332) 12/1/12, Matt Brown, Illinois State (322)
20 Pass Completions, Game 12/1/12, Jamal Londry-Jackson vs. Illinois State (33) 12/1/12, Matt Brown, Illinois State (20)
Four TD Passes, Game 10/6/12, Jamal Londry-Jackson vs. Elon (4) 12/1/12, Matt Brown, Illinois State (5)
300+ Yards Total Offense, Game 12/1/12, Jamal Londry-Jackson vs. Illinois State (367) 12/1/12, Matt Brown, Illinois State (349)
Scored Five TDs, Game 10/4/86, John Settle vs. Davidson (5) 10/13/84, Robert Surratt, Marshall (5)
10 Receptions, Game 12/1/12, Sean Price (13) and Andrew Peacock (11) vs. Illinois St. 12/1/12, Tyrone Walker, Illinois State (10)
100-149 Receiving Yards, Game 11/10/12, Andrew Peracock (130) and Sean Price (115) vs. Furman 10/13/12, Fabian Truss, Samford (113)
150+ Receiving Yards, Game 12/1/12, Sean Price vs. Illinois State (167) 12/1/12, Tyrone Walker, Illinois State (176)
Three Receiving TDs, Game 9/11/10, Brian Quick vs. Jacksonville (3) 10/6/12, Aaron Mellette, Elon (3)
50+ Yard Field Goal 9/17/11, Sam Martin vs. Savannah State (51) 12/16/05, Brian Wingert, Northern Iowa (50)
Made Three Field Goals, Game 11/10/12, Sam Martin vs. Furman (4) 12/16/05, Brian Wingert, Northern Iowa (3)
70+ Yard Punt 10/17/09, Sam Martin at Wofford (74) 11/3/07, Mark Kaspar, The Citadel (72)
Returned Kickoff for TD 10/20/12, Tony Washington vs. Wofford (99) 11/10/12, Jerodis Williams, Furman (100)
Returned Punt for TD 9/23/06, Dexter Jackson at Gardner-Webb (86 and 68) 10/29/11, Darrieon Robinson, Georgia Southern (46)
Returned Blocked Punt for TD 10/27/01, Scott Cornatzer vs. Chattanooga (0) 9/15/12, Carson Smith, The Citadel (8)
Blocked a Punt 10/22/11, Trevor Sawyer vs. Samford 9/15/12, Domonic Jones, The Citadel
Returned Interception for TD 10/13/12, Joel Ross at Samford (17) 11/28/09, Rafael Bush, South Carolina State (46)
Returned Fumble for TD 10/20/12, Joel Ross vs. Wofford (47) 11/10/12, Gary Wilkins (0) and Carl Rider (27), Furman
Blocked a Field Goal 11/3/12, Adam Scott at Georgia Southern 10/27/07, Clifton Dortch, Furman
Returned Blocked FG for TD 10/28/06, Corey Lynch vs. Furman (79) Never Accomplished
PAT Returned for Two Points 11/13/10, Troy Sanders vs. Wofford 11/25/00, Chris Archie, Troy State
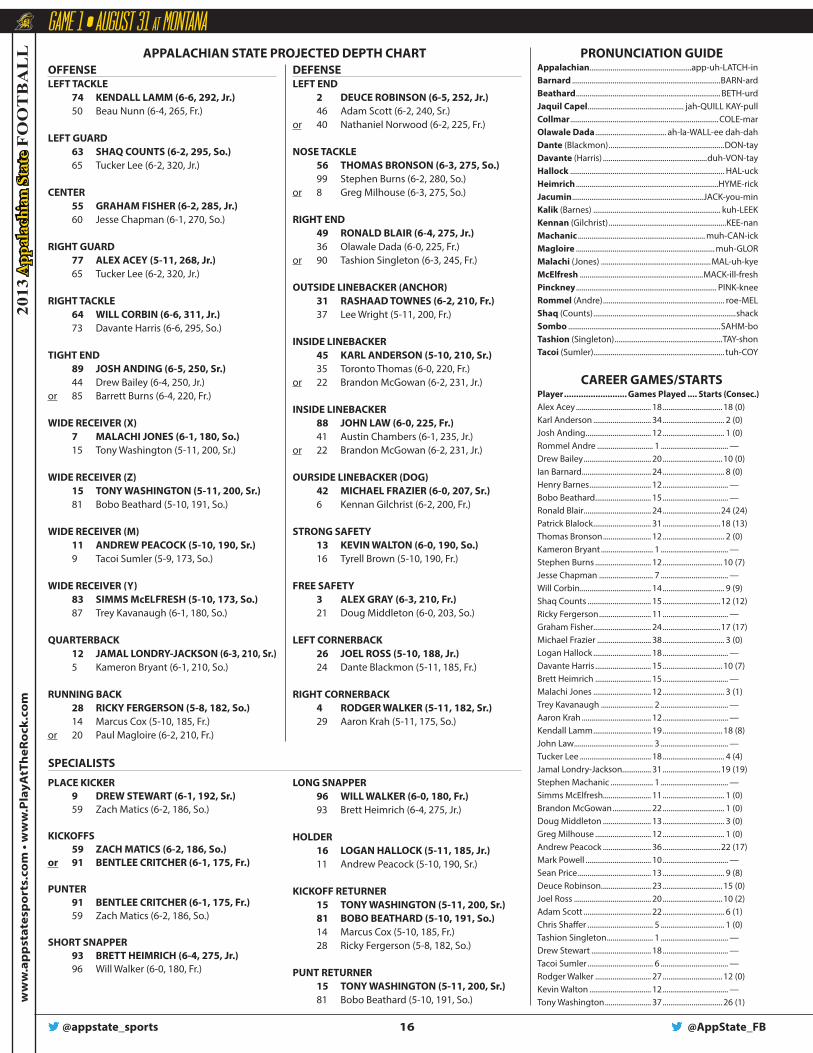
@AppState_FB
GAME 1 • AUGUST 31 at MONTANAw
ww
.ap
pst
ates
po
rts.
com
• w
ww
.Pla
yAtT
heR
ock
.co
m
2013
App
alac
hian
Sta
te F
OO
TB
AL
L
16@appstate_sports
OFFENSELEFT TACKLE 74 KENDALL LAMM (6-6, 292, Jr.) 50 Beau Nunn (6-4, 265, Fr.)
LEFT GUARD 63 SHAQ COUNTS (6-2, 295, So.) 65 Tucker Lee (6-2, 320, Jr.)
CENTER 55 GRAHAM FISHER (6-2, 285, Jr.) 60 Jesse Chapman (6-1, 270, So.)
RIGHT GUARD 77 ALEx ACEY (5-11, 268, Jr.) 65 Tucker Lee (6-2, 320, Jr.) RIGHT TACKLE 64 WILL CORBIN (6-6, 311, Jr.) 73 Davante Harris (6-6, 295, So.)
TIGHT END 89 JOSH ANDING (6-5, 250, Sr.) 44 Drew Bailey (6-4, 250, Jr.)or 85 Barrett Burns (6-4, 220, Fr.)
WIDE RECEIVER (x) 7 MALACHI JONES (6-1, 180, So.) 15 Tony Washington (5-11, 200, Sr.) WIDE RECEIVER (Z) 15 TONY WASHINGTON (5-11, 200, Sr.) 81 Bobo Beathard (5-10, 191, So.)
WIDE RECEIVER (M) 11 ANDREW PEACOCK (5-10, 190, Sr.) 9 Tacoi Sumler (5-9, 173, So.)
WIDE RECEIVER (Y) 83 SIMMS McELFRESH (5-10, 173, So.) 87 Trey Kavanaugh (6-1, 180, So.)
QUARTERBACK 12 JAMAL LONDRY-JACKSON (6-3, 210, Sr.) 5 Kameron Bryant (6-1, 210, So.)
RUNNING BACK 28 RICKY FERGERSON (5-8, 182, So.) 14 Marcus Cox (5-10, 185, Fr.)or 20 Paul Magloire (6-2, 210, Fr.)
DEFENSELEFT END 2 DEUCE ROBINSON (6-5, 252, Jr.) 46 Adam Scott (6-2, 240, Sr.)or 40 Nathaniel Norwood (6-2, 225, Fr.) NOSE TACKLE 56 THOMAS BRONSON (6-3, 275, So.) 99 Stephen Burns (6-2, 280, So.)or 8 Greg Milhouse (6-3, 275, So.)
RIGHT END 49 RONALD BLAIR (6-4, 275, Jr.) 36 Olawale Dada (6-0, 225, Fr.)or 90 Tashion Singleton (6-3, 245, Fr.)
OUTSIDE LINEBACKER (ANCHOR) 31 RASHAAD TOWNES (6-2, 210, Fr.) 37 Lee Wright (5-11, 200, Fr.) INSIDE LINEBACKER 45 KARL ANDERSON (5-10, 210, Sr.) 35 Toronto Thomas (6-0, 220, Fr.)or 22 Brandon McGowan (6-2, 231, Jr.)
INSIDE LINEBACKER 88 JOHN LAW (6-0, 225, Fr.) 41 Austin Chambers (6-1, 235, Jr.)or 22 Brandon McGowan (6-2, 231, Jr.)
OURSIDE LINEBACKER (DOG) 42 MICHAEL FRAZIER (6-0, 207, Sr.) 6 Kennan Gilchrist (6-2, 200, Fr.) STRONG SAFETY 13 KEVIN WALTON (6-0, 190, So.) 16 Tyrell Brown (5-10, 190, Fr.)
FREE SAFETY 3 ALEx GRAY (6-3, 210, Fr.) 21 Doug Middleton (6-0, 203, So.)
LEFT CORNERBACK 26 JOEL ROSS (5-10, 188, Jr.) 24 Dante Blackmon (5-11, 185, Fr.)
RIGHT CORNERBACK 4 RODGER WALKER (5-11, 182, Sr.) 29 Aaron Krah (5-11, 175, So.)
SPECIALISTS
PLACE KICKER 9 DREW STEWART (6-1, 192, Sr.) 59 Zach Matics (6-2, 186, So.)
KICKOFFS 59 ZACH MATICS (6-2, 186, So.)or 91 BENTLEE CRITCHER (6-1, 175, Fr.)
PUNTER 91 BENTLEE CRITCHER (6-1, 175, Fr.) 59 Zach Matics (6-2, 186, So.)
SHORT SNAPPER 93 BRETT HEIMRICH (6-4, 275, Jr.) 96 Will Walker (6-0, 180, Fr.)
LONG SNAPPER 96 WILL WALKER (6-0, 180, Fr.) 93 Brett Heimrich (6-4, 275, Jr.)
HOLDER 16 LOGAN HALLOCK (5-11, 185, Jr.) 11 Andrew Peacock (5-10, 190, Sr.) KICKOFF RETURNER 15 TONY WASHINGTON (5-11, 200, Sr.) 81 BOBO BEATHARD (5-10, 191, So.) 14 Marcus Cox (5-10, 185, Fr.) 28 Ricky Fergerson (5-8, 182, So.)
PUNT RETURNER 15 TONY WASHINGTON (5-11, 200, Sr.) 81 Bobo Beathard (5-10, 191, So.)
PRONUNCIATION GUIDEAppalachian.....................................................app-uh-LATCH-inBarnard .............................................................................BARN-ardBeathard ........................................................................... BETH-urdJaquil Capel .................................................. jah-QUILL KAY-pullCollmar .............................................................................COLE-marOlawale Dada ..................................... ah-la-WALL-ee dah-dahDante (Blackmon) ............................................................DON-tayDavante (Harris) ......................................................duh-VON-tayHallock ................................................................................ HAL-uckHeimrich ..........................................................................HYME-rickJacumin ....................................................................JACK-you-minKalik (Barnes) .................................................................. kuh-LEEKKennan (Gilchrist) .............................................................KEE-nanMachanic .................................................................. muh-CAN-ickMagloire ........................................................................muh-GLORMalachi (Jones) .........................................................MAL-uh-kyeMcElfresh ................................................................MACK-ill-freshPinckney ......................................................................... PINK-kneeRommel (Andre) ............................................................... roe-MELShaq (Counts) ..........................................................................shackSombo ...............................................................................SAHM-boTashion (Singleton) ........................................................TAY-shonTacoi (Sumler).................................................................... tuh-COY
CAREER GAMES/STARTSPlayer .......................... Games Played .... Starts (Consec.)Alex Acey ....................................... 18 ............................... 18 (0)Karl Anderson .............................. 34 ................................ 2 (0)Josh Anding .................................. 12 ................................ 1 (0)Rommel Andre ............................. 1 ................................... —Drew Bailey ................................... 20 ............................... 10 (0)Ian Barnard.................................... 24 ................................ 8 (0)Henry Barnes ................................ 12 .................................. —Bobo Beathard ............................. 15 .................................. —Ronald Blair ................................... 24 ..............................24 (24)Patrick Blalock .............................. 31 ..............................18 (13)Thomas Bronson ......................... 12 ................................ 2 (0)Kameron Bryant ........................... 1 ................................... —Stephen Burns ............................. 12 ............................... 10 (7)Jesse Chapman ............................ 7 ................................... —Will Corbin..................................... 14 ................................ 9 (9)Shaq Counts ................................. 15 ..............................12 (12)Ricky Fergerson ........................... 11 .................................. —Graham Fisher.............................. 24 ..............................17 (17)Michael Frazier ............................ 38 ................................ 3 (0)Logan Hallock .............................. 18 .................................. —Davante Harris ............................. 15 ............................... 10 (7)Brett Heimrich ............................. 15 .................................. —Malachi Jones .............................. 12 ................................ 3 (1)Trey Kavanaugh ........................... 2 ................................... —Aaron Krah .................................... 12 .................................. —Kendall Lamm .............................. 19 ............................... 18 (8)John Law ......................................... 3 ................................... —Tucker Lee ..................................... 18 ................................ 4 (4)Jamal Londry-Jackson............... 31 ..............................19 (19)Stephen Machanic ...................... 1 ................................... —Simms McElfresh......................... 11 ................................ 1 (0)Brandon McGowan .................... 22 ................................ 1 (0)Doug Middleton ......................... 13 ................................ 3 (0)Greg Milhouse ............................. 12 ................................ 1 (0)Andrew Peacock ......................... 36 ..............................22 (17)Mark Powell .................................. 10 .................................. —Sean Price ...................................... 13 ................................ 9 (8)Deuce Robinson .......................... 23 ............................... 15 (0)Joel Ross ........................................ 20 ............................... 10 (2)Adam Scott ................................... 22 ................................ 6 (1)Chris Shaffer .................................. 5 ................................. 1 (0)Tashion Singleton ........................ 1 ................................... —Drew Stewart ............................... 18 .................................. —Tacoi Sumler .................................. 6 ................................... —Rodger Walker ............................. 27 ............................... 12 (0)Kevin Walton ................................ 12 .................................. —Tony Washington ........................ 37 ............................... 26 (1)
APPALACHIAN STATE PROJECTED DEPTH CHART

GAME 1 • AUGUST 31 at MONTANA 2013 A
ppalachian State FO
OT
BA
LL
w
ww
.app
statespo
rts.com
• ww
w.P
layAtTh
eRo
ck.com
@AppState_FB17@appstate_sports
APPALACHIAN STATE NUMERICAL ROSTER No. Name Pos. Ht. Wt. Class Hometown/High School (Previous School)
2 Deuce Robinson DL 6-5 252 Jr. Blythewood, S.C./Blythewood
3 Alex Gray DB 6-3 210 Fr. Suwanee, Ga./Peachtree Ridge
4 Rodger Walker DB 5-11 182 Sr. Thomasville, Ga./Brookwood
5 Kameron Bryant QB 6-1 210 So. Cary, N.C./Panther Creek
5 George Vinson ILB 6-0 205 Fr. Damascus, Md./Damascus
6 Kennan Gilchrist OLB 6-2 200 Fr. Abbeville, S.C./Abbeville
7 Malachi Jones WR 6-1 180 So. Roswell, Ga./Central Gwinnett
8 Greg Milhouse DL 6-3 275 So. Garner, N.C./Garner
9 Drew Stewart PK 6-1 192 Sr. Gastonia, N.C./North Gaston (Marshall)
9 Tacoi Sumler WR 5-9 173 So. Miami, Fla./Christopher Columbus (Oregon)
10 Sean Price WR 6-5 210 So. Reston, Va./South Lakes
11 Andrew Peacock WR 5-10 190 Sr. Durham, N.C./Northern Durham
12 Jamal Londry-Jackson QB 6-3 210 Sr. Atlanta, Ga./North Atlanta
13 Kevin Walton DB 6-0 190 So. Greensboro, N.C./Grimsley
14 Marcus Cox RB 5-10 185 Fr. Dacula, Ga./Dacula
15 Tony Washington WR 5-11 200 Sr. High Point, N.C./T.W. Andrews
16 Logan Hallock QB 5-11 185 Jr. Ferguson, N.C./West Wilkes
16 Tyrell Brown DB 5-10 190 Fr. Hampton, Ga./Lovejoy
17 Chris Shaffer OLB 6-2 200 So. Charlotte, N.C./Providence
17 Taylor Lamb QB 6-2 200 Fr. Calhoun, Ga./Calhoun
18 Brandon Pinckney DB 6-0 175 Fr. Spartanburg, S.C./Dorman
18 Kevin Saxton QB 6-3 185 Fr. Monroe, N.C./Sun Valley
19 Treyon Garnett DB 6-1 180 Fr. Miami, Fla./Miami Beach
20 Paul Magloire RB 6-2 210 Fr. Lynbrook, N.Y./Lynbrook (Milford Academy)
20 Henry Barnes DB 6-2 202 So. Newton Grove, N.C./Hobbton
21 Doug Middleton DB 6-0 203 So. Winston-Salem, N.C./Parkland
21 Justin Ruffin RB 5-10 180 Fr. Salisbury, N.C./Salisbury
22 Brandon McGowan ILB 6-2 231 Jr. Suwanee, Ga./North Gwinnett
22 Seth Sloan WR 5-8 165 So. Boone, N.C./Watauga
24 Dante Blackmon DB 5-11 185 Fr. Covington, Ga./Eastside
24 Andy Shuler WR 5-10 180 So. Rockingham, N.C./Richmond Senior
25 Terrence Upshaw RB 5-10 190 Fr. Duluth, Ga./Northview
25 T.J. Watkins DB 6-1 165 Fr. Forest City, N.C./East Rutherford
26 Joel Ross DB 5-10 188 Jr. Damascus, Md./Damascus
27 Anthony Covington DB 5-10 195 Fr. Charlotte, N.C./Mallard Creek
28 Ricky Fergerson RB 5-8 182 So. Fuquay-Varina, N.C./Fuquay-Varina
29 Aaron Krah DB 5-11 175 So. Durham, N.C./Hillside
29 Chris Simpson RB 6-1 205 Fr. Mechanicsville, Va./Lee-Davis
30 Osvaldo Sombo ILB 6-2 225 Jr. Charlotte, N.C./Butler (Bakersfield College)
30 Trey Anderson WR 5-10 185 Fr. Orlando, Fla./Bishop Moore
31 Rashaad Townes OLB 6-2 210 Fr. Macon, Ga./Howard
33 Eric Davidson RB 5-10 200 So. Greensboro, N.C./Western Guilford (Utah)
34 Patrick Blalock OLB 6-0 200 Sr. Asheville, N.C./A.C. Reynolds
35 Toronto Thomas ILB 6-0 220 Fr. Ellenwood, Ga./Air Force Prep
36 Olawale Dada DL 6-0 225 Fr. Columbus, Ga./Shaw
37 Lee Wright OLB 5-11 200 Fr. York, S.C./York Comprehensive
39 Rommel Andre RB 5-8 185 Jr. Raeford, N.C./Hoke County
40 Nathaniel Norwood DL 6-2 225 Fr. Hampton, Ga./Lovejoy
40 Mo Gore WR 5-11 170 So. Boone, N.C./Watauga
41 Austin Chambers ILB 6-1 235 Jr. Clyde, N.C./Tuscola (Western Carolina)
42 Michael Frazier OLB 6-0 207 Sr. Conway, S.C./Conway
43 Denzel Ward ILB 5-11 230 So. Elizabeth City, N.C./Northeastern (Virginia Tech)
44 Drew Bailey TE 6-4 250 Jr. Spartanburg, S.C./Dorman
44 Mike Counts DB 6-0 180 Fr. Alexandria, Va./Thomas Edison
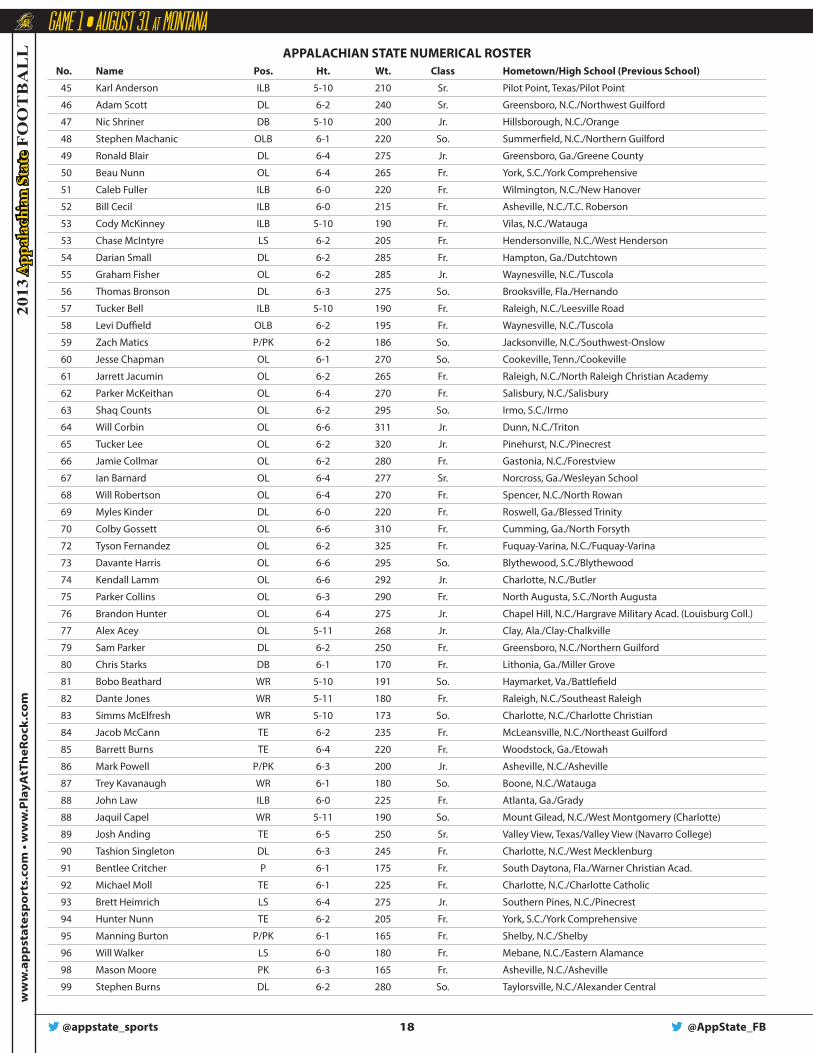
@AppState_FB
GAME 1 • AUGUST 31 at MONTANAw
ww
.ap
pst
ates
po
rts.
com
• w
ww
.Pla
yAtT
heR
ock
.co
m
2013
App
alac
hian
Sta
te F
OO
TB
AL
L
18@appstate_sports
APPALACHIAN STATE NUMERICAL ROSTER No. Name Pos. Ht. Wt. Class Hometown/High School (Previous School)
45 Karl Anderson ILB 5-10 210 Sr. Pilot Point, Texas/Pilot Point
46 Adam Scott DL 6-2 240 Sr. Greensboro, N.C./Northwest Guilford
47 Nic Shriner DB 5-10 200 Jr. Hillsborough, N.C./Orange
48 Stephen Machanic OLB 6-1 220 So. Summerfield, N.C./Northern Guilford
49 Ronald Blair DL 6-4 275 Jr. Greensboro, Ga./Greene County
50 Beau Nunn OL 6-4 265 Fr. York, S.C./York Comprehensive
51 Caleb Fuller ILB 6-0 220 Fr. Wilmington, N.C./New Hanover
52 Bill Cecil ILB 6-0 215 Fr. Asheville, N.C./T.C. Roberson
53 Cody McKinney ILB 5-10 190 Fr. Vilas, N.C./Watauga
53 Chase McIntyre LS 6-2 205 Fr. Hendersonville, N.C./West Henderson
54 Darian Small DL 6-2 285 Fr. Hampton, Ga./Dutchtown
55 Graham Fisher OL 6-2 285 Jr. Waynesville, N.C./Tuscola
56 Thomas Bronson DL 6-3 275 So. Brooksville, Fla./Hernando
57 Tucker Bell ILB 5-10 190 Fr. Raleigh, N.C./Leesville Road
58 Levi Duffield OLB 6-2 195 Fr. Waynesville, N.C./Tuscola
59 Zach Matics P/PK 6-2 186 So. Jacksonville, N.C./Southwest-Onslow
60 Jesse Chapman OL 6-1 270 So. Cookeville, Tenn./Cookeville
61 Jarrett Jacumin OL 6-2 265 Fr. Raleigh, N.C./North Raleigh Christian Academy
62 Parker McKeithan OL 6-4 270 Fr. Salisbury, N.C./Salisbury
63 Shaq Counts OL 6-2 295 So. Irmo, S.C./Irmo
64 Will Corbin OL 6-6 311 Jr. Dunn, N.C./Triton
65 Tucker Lee OL 6-2 320 Jr. Pinehurst, N.C./Pinecrest
66 Jamie Collmar OL 6-2 280 Fr. Gastonia, N.C./Forestview
67 Ian Barnard OL 6-4 277 Sr. Norcross, Ga./Wesleyan School
68 Will Robertson OL 6-4 270 Fr. Spencer, N.C./North Rowan
69 Myles Kinder DL 6-0 220 Fr. Roswell, Ga./Blessed Trinity
70 Colby Gossett OL 6-6 310 Fr. Cumming, Ga./North Forsyth
72 Tyson Fernandez OL 6-2 325 Fr. Fuquay-Varina, N.C./Fuquay-Varina
73 Davante Harris OL 6-6 295 So. Blythewood, S.C./Blythewood
74 Kendall Lamm OL 6-6 292 Jr. Charlotte, N.C./Butler
75 Parker Collins OL 6-3 290 Fr. North Augusta, S.C./North Augusta
76 Brandon Hunter OL 6-4 275 Jr. Chapel Hill, N.C./Hargrave Military Acad. (Louisburg Coll.)
77 Alex Acey OL 5-11 268 Jr. Clay, Ala./Clay-Chalkville
79 Sam Parker DL 6-2 250 Fr. Greensboro, N.C./Northern Guilford
80 Chris Starks DB 6-1 170 Fr. Lithonia, Ga./Miller Grove
81 Bobo Beathard WR 5-10 191 So. Haymarket, Va./Battlefield
82 Dante Jones WR 5-11 180 Fr. Raleigh, N.C./Southeast Raleigh
83 Simms McElfresh WR 5-10 173 So. Charlotte, N.C./Charlotte Christian
84 Jacob McCann TE 6-2 235 Fr. McLeansville, N.C./Northeast Guilford
85 Barrett Burns TE 6-4 220 Fr. Woodstock, Ga./Etowah
86 Mark Powell P/PK 6-3 200 Jr. Asheville, N.C./Asheville
87 Trey Kavanaugh WR 6-1 180 So. Boone, N.C./Watauga
88 John Law ILB 6-0 225 Fr. Atlanta, Ga./Grady
88 Jaquil Capel WR 5-11 190 So. Mount Gilead, N.C./West Montgomery (Charlotte)
89 Josh Anding TE 6-5 250 Sr. Valley View, Texas/Valley View (Navarro College)
90 Tashion Singleton DL 6-3 245 Fr. Charlotte, N.C./West Mecklenburg
91 Bentlee Critcher P 6-1 175 Fr. South Daytona, Fla./Warner Christian Acad.
92 Michael Moll TE 6-1 225 Fr. Charlotte, N.C./Charlotte Catholic
93 Brett Heimrich LS 6-4 275 Jr. Southern Pines, N.C./Pinecrest
94 Hunter Nunn TE 6-2 205 Fr. York, S.C./York Comprehensive
95 Manning Burton P/PK 6-1 165 Fr. Shelby, N.C./Shelby
96 Will Walker LS 6-0 180 Fr. Mebane, N.C./Eastern Alamance
98 Mason Moore PK 6-3 165 Fr. Asheville, N.C./Asheville
99 Stephen Burns DL 6-2 280 So. Taylorsville, N.C./Alexander Central

2012 Appalachian State FootballAppalachian State Game Results (as of Jan 03, 2013)
All games
Date Opponent Score Overall Conference Time AttendSep 01, 2012 at East Carolina L 13-35 0-1 0-0 3:33 49023Sep 08, 2012 #12 MONTANA W 35-27 1-1 0-0 3:11 30856
*Sep 15, 2012 #21 THE CITADEL L 28-52 1-2 0-1 2:44 24137*Sep 22, 2012 at Chattanooga W 34-17 2-2 1-1 2:53 13726
Sep 29, 2012 COASTAL CAROLINA W 55-14 3-2 1-1 2:52 27619*Oct 06, 2012 ELON W 35-23 4-2 2-1 3:03 29073*Oct 13, 2012 at #25 Samford W 28-25 5-2 3-1 3:06 9712*Oct 20, 2012 #8 WOFFORD L 28-38 5-3 3-2 3:05 27115*Oct 27, 2012 at Western Carolina W 38-27 6-3 4-2 3:30 13279*Nov 03, 2012 at #2 Georgia Southern W 31-28 7-3 5-2 3:09 22155*Nov 10, 2012 FURMAN W 33-28 8-3 6-2 3:10 28986^Dec 01, 2012 #16 ILLINOIS STATE L o 37-38 8-4 6-2 3:15 16719
* Southern Conference game^ 2012 NCAA Division I Football Championship

2012 Appalachian State FootballAppalachian State Overall Team Statistics (as of Jan 03, 2013)
All games
Team Statistics APP OPPSCORING 395 352 Points Per Game 32.9 29.3FIRST DOWNS 283 225 R u s h i n g 113 109 P a s s i n g 147 99 P e n a l t y 23 17RUSHING YARDAGE 2043 2287 Yards gained rushing 2362 2570 Yards lost rushing 319 283 Rushing Attempts 447 492 Average Per Rush 4.6 4.6 Average Per Game 170.2 190.6 TDs Rushing 22 21PASSING YARDAGE 3525 2671 C o m p - A t t - I n t 291-430-8 186-325-14 Average Per Pass 8.2 8.2 Average Per Catch 12.1 14.4 Average Per Game 293.8 222.6 TDs Passing 25 20TOTAL OFFENSE 5568 4958 Total Plays 877 817 Average Per Play 6.3 6.1 Average Per Game 464.0 413.2KICK RETURNS: #-Yards 41-973 23-678PUNT RETURNS: #-Yards 24-180 16-148INT RETURNS: #-Yards 14-171 8-71KICK RETURN AVERAGE 23.7 29.5PUNT RETURN AVERAGE 7.5 9.2INT RETURN AVERAGE 12.2 8.9FUMBLES-LOST 15-9 14-8PENALTIES-Yards 76-655 65-579 Average Per Game 54.6 48.2PUNTS-Yards 61-2755 71-2942 Average Per Punt 45.2 41.4 Net punt average 40.8 37.8KICKOFFS-Yards 72-4529 65-4046 Average Per Kick 62.9 62.2 Net kick average 44.9 39.2TIME OF POSSESSION/Game 2 9 : 1 7 3 0 : 4 33RD-DOWN Conversions 65/169 75/176 3rd-Down Pct 38% 43%4TH-DOWN Conversions 11/23 7/11 4th-Down Pct 48% 64%SACKS BY-Yards 26-160 25-186MISC YARDS 0 0TOUCHDOWNS SCORED 51 48FIELD GOALS-ATTEMPTS 13-20 6-14ON-SIDE KICKS 0-0 0-0RED-ZONE SCORES (40-51) 78% (34-42) 81%RED-ZONE TOUCHDOWNS (29-51) 57% (28-42) 67%PAT-ATTEMPTS (50-51) 98% (42-44) 95%ATTENDANCE 184505 107895 Games/Avg Per Game 7/26358 5/21579 Neutral Site Games 0/0
Score by Quarters 1st 2nd 3rd 4th OT TotalAppalachian State 79 137 55 118 6 395Opponents 83 107 76 79 7 352

2012 Appalachian State FootballAppalachian State Overall Individual Statistics (as of Jan 03, 2013)
All games
Rushing gp att gain loss net avg td lg avg/gSteven Miller 12 239 1438 70 1368 5.7 11 75 114.0Jamal Jackson 12 114 521 193 328 2.9 6 20 27.3Rod Chisholm 9 41 164 10 154 3.8 2 20 17.1Michael Frazier 12 17 93 0 93 5.5 1 27 7.8Tony Washington 12 8 75 4 71 8.9 2 22 5.9Kameron Bryant 1 5 29 5 24 4.8 0 12 24.0Logan Hallock 6 11 28 15 13 1.2 0 13 2.2Andrew Peacock 12 5 7 5 2 0.4 0 3 0.2Ricky Fergerson 11 5 7 6 1 0.2 0 3 0.1TEAM 3 2 0 11 -11 -5.5 0 0 -3.7Total 12 447 2362 319 2043 4.6 22 75 170.2Opponents 12 492 2570 283 2287 4.6 21 57 190.6
Passing gp effic comp-att-int pct yds td lg avg/gJamal Jackson 12 146.96 268-406-8 66.0 3278 21 69 273.2Logan Hallock 6 218.67 20-21-0 95.2 230 2 36 38.3Andrew Peacock 12 501.40 2-2-0 100.0 17 2 10 1.4Kameron Bryant 1 100.00 1-1-0 100.0 0 0 0 0.0Total 12 152.00 291-430-8 67.7 3525 25 69 293.8Opponents 12 137.96 186-325-14 57.2 2671 20 87 222.6
Receiving gp no. yds avg td lg avg/gSean Price 10 81 1196 14.8 8 69 119.6Andrew Peacock 12 79 795 10.1 4 36 66.2Tony Washington 12 39 472 12.1 3 54 39.3Steven Miller 12 34 377 11.1 4 48 31.4Malachi Jones 12 32 370 11.6 2 48 30.8Drew Bailey 12 9 123 13.7 4 23 10.2Simms McElfresh 11 6 86 14.3 0 44 7.8Tacoi Sumler 6 5 47 9.4 0 13 7.8Rod Chisholm 9 2 15 7.5 0 10 1.7Ricky Fergerson 11 2 4 2.0 0 4 0.4Michael Frazier 12 1 27 27.0 0 27 2.2Graham Fisher 12 1 13 13.0 0 13 1.1Total 12 291 3525 12.1 25 69 293.8Opponents 12 186 2671 14.4 20 87 222.6
Punt Returns no. yds avg td lgTony Washington 16 144 9.0 0 26Bobo Beathard 7 13 1.9 0 6Andrew Peacock 1 23 23.0 0 23Total 24 180 7.5 0 26Opponents 16 148 9.2 1 43
Interceptions no. yds avg td lgDemetrius McCray 4 24 6.0 0 22Troy Sanders 3 24 8.0 0 15Jamill Lott 2 0 0.0 0 0Patrick Blalock 2 0 0.0 0 0Joel Ross 1 17 17.0 1 17Brandon Grier 1 70 70.0 1 70Jeremy Kimbrough 1 36 36.0 0 36Total 14 171 12.2 2 70Opponents 8 71 8.9 0 42
Kick Returns no. yds avg td lgTony Washington 23 629 27.3 1 99Bobo Beathard 9 182 20.2 0 27Tacoi Sumler 5 97 19.4 0 26Henry Barnes 1 1 1.0 0 1Kevin Walton 1 21 21.0 0 21Steven Miller 1 14 14.0 0 14Doug Middleton 1 29 29.0 0 29Total 41 973 23.7 1 99Opponents 23 678 29.5 2 100
Fumble Returns no. yds avg td lgJoel Ross 1 47 47.0 1 47Ronald Blair 1 -3 -3.0 0 0Brandon Grier 1 40 40.0 0 40Total 3 84 28.0 1 47Opponents 4 124 31.0 4 45
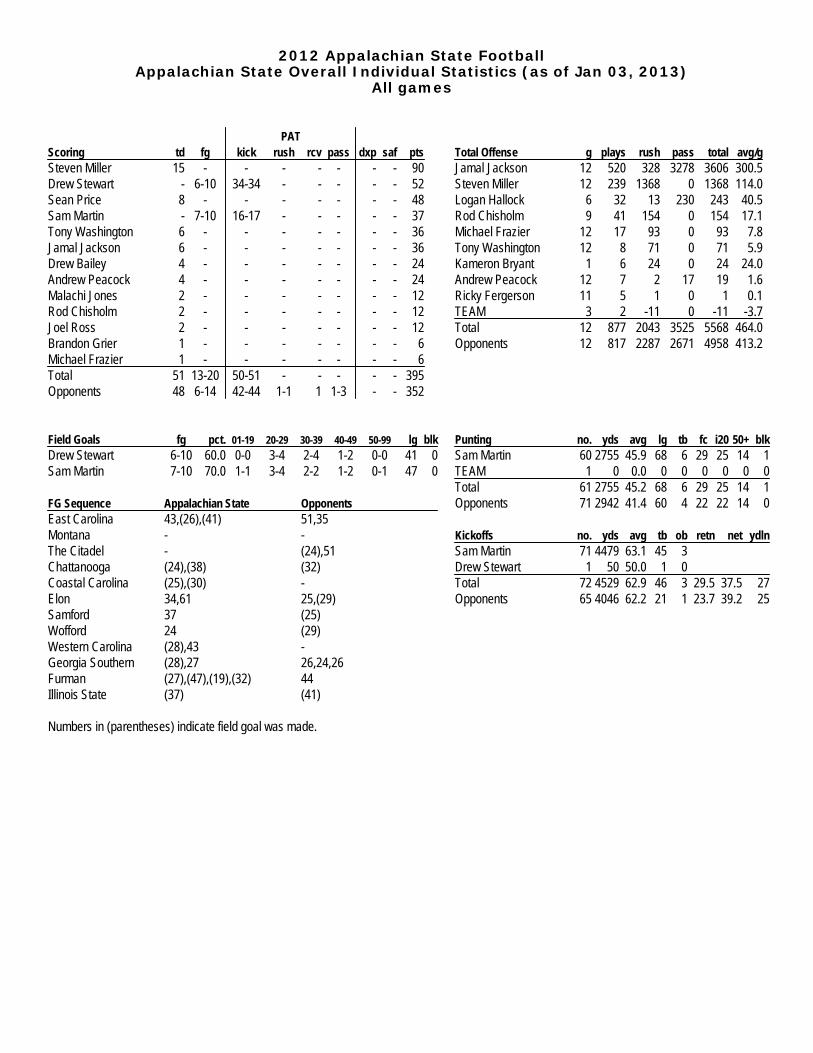
2012 Appalachian State FootballAppalachian State Overall Individual Statistics (as of Jan 03, 2013)
All games
PATScoring td fg kick rush rcv pass dxp saf ptsSteven Miller 15 - - - - - - - 90Drew Stewart - 6-10 34-34 - - - - - 52Sean Price 8 - - - - - - - 48Sam Martin - 7-10 16-17 - - - - - 37Tony Washington 6 - - - - - - - 36Jamal Jackson 6 - - - - - - - 36Drew Bailey 4 - - - - - - - 24Andrew Peacock 4 - - - - - - - 24Malachi Jones 2 - - - - - - - 12Rod Chisholm 2 - - - - - - - 12Joel Ross 2 - - - - - - - 12Brandon Grier 1 - - - - - - - 6Michael Frazier 1 - - - - - - - 6Total 51 13-20 50-51 - - - - - 395Opponents 48 6-14 42-44 1-1 1 1-3 - - 352
Total Offense g plays rush pass total avg/gJamal Jackson 12 520 328 3278 3606 300.5Steven Miller 12 239 1368 0 1368 114.0Logan Hallock 6 32 13 230 243 40.5Rod Chisholm 9 41 154 0 154 17.1Michael Frazier 12 17 93 0 93 7.8Tony Washington 12 8 71 0 71 5.9Kameron Bryant 1 6 24 0 24 24.0Andrew Peacock 12 7 2 17 19 1.6Ricky Fergerson 11 5 1 0 1 0.1TEAM 3 2 -11 0 -11 -3.7Total 12 877 2043 3525 5568 464.0Opponents 12 817 2287 2671 4958 413.2
Field Goals fg pct. 01-19 20-29 30-39 40-49 50-99 lg blkDrew Stewart 6-10 60.0 0-0 3-4 2-4 1-2 0-0 41 0Sam Martin 7-10 70.0 1-1 3-4 2-2 1-2 0-1 47 0
FG Sequence Appalachian State OpponentsEast Carolina 43,(26),(41) 51,35Montana - -The Citadel - (24),51Chattanooga (24),(38) (32)Coastal Carolina (25),(30) -Elon 34,61 25,(29)Samford 37 (25)Wofford 24 (29)Western Carolina (28),43 -Georgia Southern (28),27 26,24,26Furman (27),(47),(19),(32) 44Illinois State (37) (41)
Numbers in (parentheses) indicate field goal was made.
Punting no. yds avg lg tb fc i20 50+ blkSam Martin 60 2755 45.9 68 6 29 25 14 1TEAM 1 0 0.0 0 0 0 0 0 0Total 61 2755 45.2 68 6 29 25 14 1Opponents 71 2942 41.4 60 4 22 22 14 0
Kickoffs no. yds avg tb ob retn net ydlnSam Martin 71 4479 63.1 45 3Drew Stewart 1 50 50.0 1 0Total 72 4529 62.9 46 3 29.5 37.5 27Opponents 65 4046 62.2 21 1 23.7 39.2 25

2012 Appalachian State FootballAppalachian State Overall Individual Statistics (as of Jan 03, 2013)
All games
All Purpose g rush rcv pr kr ir total avg/gSteven Miller 12 1368 377 0 14 0 1759 146.6Tony Washingto 12 71 472 144 629 0 1316 109.7Sean Price 10 0 1196 0 0 0 1196 119.6Andrew Peacock 12 2 795 23 0 0 820 68.3Malachi Jones 12 0 370 0 0 0 370 30.8Jamal Jackson 12 328 0 0 0 0 328 27.3Bobo Beathard 12 0 0 13 182 0 195 16.2Rod Chisholm 9 154 15 0 0 0 169 18.8Tacoi Sumler 6 0 47 0 97 0 144 24.0Drew Bailey 12 0 123 0 0 0 123 10.2Michael Frazier 12 93 27 0 0 0 120 10.0Simms McElfres 11 0 86 0 0 0 86 7.8Brandon Grier 10 0 0 0 0 70 70 7.0Jeremy Kimbrou 12 0 0 0 0 36 36 3.0Doug Middleton 1 0 0 0 29 0 29 29.0Troy Sanders 12 0 0 0 0 24 24 2.0Demetrius McCr 12 0 0 0 0 24 24 2.0Kameron Bryant 1 24 0 0 0 0 24 24.0Kevin Walton 12 0 0 0 21 0 21 1.8Joel Ross 12 0 0 0 0 17 17 1.4Graham Fisher 12 0 13 0 0 0 13 1.1Logan Hallock 6 13 0 0 0 0 13 2.2Ricky Fergerson 11 1 4 0 0 0 5 0.5Henry Barnes 12 0 0 0 1 0 1 0.1TEAM 3 -11 0 0 0 0 -11 -3.7Total 12 2043 3525 180 973 171 6892 574.3Opponents 12 2287 2671 148 678 71 5855 487.9

2012 Appalachian State FootballAppalachian State Overall Defensive Statistics (as of Jan 03, 2013)
All games
Tackles Sacks Pass defense Fumbles blkd# Defensive Leaders gp ua a tot tfl/yds no-yds int-yds brup qbh rcv-yds ff kick saf33 Jeremy Kimbrough 12 69 74 143 12.5-58 4.5-34 1-36 1 1 . . . .9 Troy Sanders 12 43 40 83 6.5-19 0.5-2 3-24 4 . . 1 . .24 Brandon Grier 10 42 32 74 8.0-37 6.0-33 1-70 . 6 2-40 1 . .34 Patrick Blalock 12 37 26 63 3.0-6 . 2-0 4 . 2-0 1 . .49 Ronald Blair 12 25 35 60 8.5-26 3.0-15 . . 2 1--3 . . .10 Demetrius McCray 12 37 18 55 0.5-2 . 4-24 4 2 . 1 . .26 Joel Ross 12 27 19 46 6.0-13 . 1-17 2 5 1-47 . . .5 Jamill Lott 10 25 14 39 1.0-1 . 2-0 3 . . 1 . .2 Deuce Robinson 11 9 30 39 4.5-9 1.0-3 . 2 3 . . . .45 Karl Anderson 11 17 22 39 . . . . . 1-0 . . .99 Stephen Burns 12 18 19 37 4.5-11 . . . 3 . 1 . .92 Davante Harris 12 9 25 34 6.5-13 1.0-6 . . 4 . . . .46 Adam Scott 12 11 10 21 6.0-33 5.0-31 . 1 . . . 1 .56 Thomas Bronson 12 8 12 20 0.5-3 0.5-3 . . . . . . .13 Greg Hall 12 8 7 15 3.5-27 3.5-27 . 1 . . 1 . .18 Jamal Ware 9 6 7 13 3.0-8 . . . . . . . .8A Greg Milhouse 12 3 9 12 1.5-8 1.0-6 . . . . . . .4 Rodger Walker 7 6 5 11 . . . 1 . . . . .31 Kevin Walton 12 4 5 9 0.5-1 . . . . . . . .20 Henry Barnes 12 3 4 7 . . . . . . 1 . .29 Aaron Krah 12 5 2 7 . . . 1 . . . . .42 Michael Frazier 12 5 1 6 . . . . . . . . .21 Doug Middleton 1 2 3 5 . . . . . . . . .90 Nic Canepa 10 1 4 5 0.5-2 . . . . . . . .22 Brandon McGowan 12 2 1 3 . . . . . . . . .35 John Law 3 1 1 2 . . . . . . . . .81 Bobo Beathard 12 . 2 2 . . . . . . . . .27 Sam Martin 12 2 . 2 . . . . . . . . .15 Tony Washington 12 2 . 2 . . . . . . . . .39 Matt Watson 11 1 . 1 . . . . . 1-0 . . .53 Brett Heimrich 12 . 1 1 . . . . . . . . .89 Josh Anding 12 1 . 1 . . . . . . . . .43 Drew Davies 10 1 . 1 . . . . . . . . .91 Will Smith 4 . 1 1 . . . . . . . . .55 Graham Fisher 12 1 . 1 . . . . . . . . .14 Sean Price 10 1 . 1 . . . . . . . . .11 Andrew Peacock 12 . 1 1 . . . . . . . . .12 Jamal Jackson 12 1 . 1 . . . . . . . . .64 Will Corbin 9 1 . 1 . . . . . . . . .
Total 12 434 430 864 77-277 26-160 14-171 24 26 8-84 8 1 .Opponents 12 465 528 993 69-312 25-186 8-71 26 33 9-124 13 2 .

2012 Appalachian State FootballAppalachian State Individual Season/Career Statistics (as of Jan 03, 2013)
All games
SEASON CAREER
Rushing gp att gain loss net avg td lg avg/g gp att gain loss net avg td lg avg/gSteven Miller 12 239 1438 70 1368 5.7 11 75 114.0 23 315 1841 93 1748 5.5 14 75 76.0Jamal Jackson 12 114 521 193 328 2.9 6 20 27.3 31 226 1027 303 724 3.2 14 20 23.4Rod Chisholm 9 41 164 10 154 3.8 2 20 17.1 24 89 417 19 398 4.5 3 37 16.6Michael Frazier 12 17 93 0 93 5.5 1 27 7.8 38 17 93 0 93 5.5 1 27 2.4Tony Washington 12 8 75 4 71 8.9 2 22 5.9 37 10 82 6 76 7.6 2 22 2.1Kameron Bryant 1 5 29 5 24 4.8 0 12 24.0 1 5 29 5 24 4.8 0 12 24.0Logan Hallock 6 11 28 15 13 1.2 0 13 2.2 18 11 28 15 13 1.2 1 13 0.7Andrew Peacock 12 5 7 5 2 0.4 0 3 0.2 35 13 57 11 46 3.5 0 16 1.3Ricky Fergerson 11 5 7 6 1 0.2 0 3 0.1 11 5 7 6 1 0.2 0 3 0.1TEAM 3 2 0 11 -11 -5.5 0 0 -3.7Total 12 447 2362 319 2043 4.6 22 75 170.2Opponents 12 492 2570 283 2287 4.6 21 57 190.6
Passing gp effic comp-att-int pct yds td lg avg/g gp effic comp-att-int pct yds td lg avg/gJamal Jackson 12 146.96 268-406-8 66.0 3278 21 69 273.2 31 143.64 436-682-17 63.9 5423 37 69 174.9Logan Hallock 6 218.67 20-21-0 95.2 230 2 36 38.3 18 218.67 20-21-0 95.2 230 2 36 12.8Andrew Peacock 12 501.40 2-2-0 100.0 17 2 10 1.4 35 501.40 2-2-0 100.0 17 2 10 0.5Kameron Bryant 1 100.00 1-1-0 100.0 0 0 0 0.0 1 100.00 1-1-0 100.0 0 0 0 0.0Total 12 152.00 291-430-8 67.7 3525 25 69 293.8Opponents 12 137.96 186-325-14 57.2 2671 20 87 222.6
Receiving gp no. yds avg td lg avg/g gp no. yds avg td lg avg/gSean Price 10 81 1196 14.8 8 69 119.6 13 82 1202 14.7 8 69 92.5Andrew Peacock 12 79 795 10.1 4 36 66.2 35 130 1402 10.8 7 36 40.1Tony Washington 12 39 472 12.1 3 54 39.3 37 75 898 12.0 6 54 24.3Steven Miller 12 34 377 11.1 4 48 31.4 23 47 509 10.8 5 48 22.1Malachi Jones 12 32 370 11.6 2 48 30.8 12 32 370 11.6 2 48 30.8Drew Bailey 12 9 123 13.7 4 23 10.2 20 9 123 13.7 4 23 6.2Simms McElfresh 11 6 86 14.3 0 44 7.8 11 6 86 14.3 0 44 7.8Tacoi Sumler 6 5 47 9.4 0 13 7.8 6 5 47 9.4 0 13 7.8Rod Chisholm 9 2 15 7.5 0 10 1.7 24 2 15 7.5 0 10 0.6Ricky Fergerson 11 2 4 2.0 0 4 0.4 11 2 4 2.0 0 4 0.4Michael Frazier 12 1 27 27.0 0 27 2.2 38 1 27 27.0 0 27 0.7Graham Fisher 12 1 13 13.0 0 13 1.1 24 1 13 13.0 0 13 0.5Total 12 291 3525 12.1 25 69 293.8Opponents 12 186 2671 14.4 20 87 222.6
Total Offense g plays rush pass total avg/g g plays rush pass total avg/gJamal Jackson 12 520 328 3278 3606 300.5 31 908 724 5423 6147 198.3Steven Miller 12 239 1368 0 1368 114.0 23 315 1748 0 1748 76.0Logan Hallock 6 32 13 230 243 40.5 18 32 13 230 243 13.5Rod Chisholm 9 41 154 0 154 17.1 24 89 398 0 398 16.6Michael Frazier 12 17 93 0 93 7.8 38 17 93 0 93 2.4Tony Washington 12 8 71 0 71 5.9 37 10 76 0 76 2.1Kameron Bryant 1 6 24 0 24 24.0 1 6 24 0 24 24.0Andrew Peacock 12 7 2 17 19 1.6 35 15 46 17 63 1.8Ricky Fergerson 11 5 1 0 1 0.1 11 5 1 0 1 0.1TEAM 3 2 -11 0 -11 -3.7Total 12 877 2043 3525 5568 464.0Opponents 12 817 2287 2671 4958 413.2
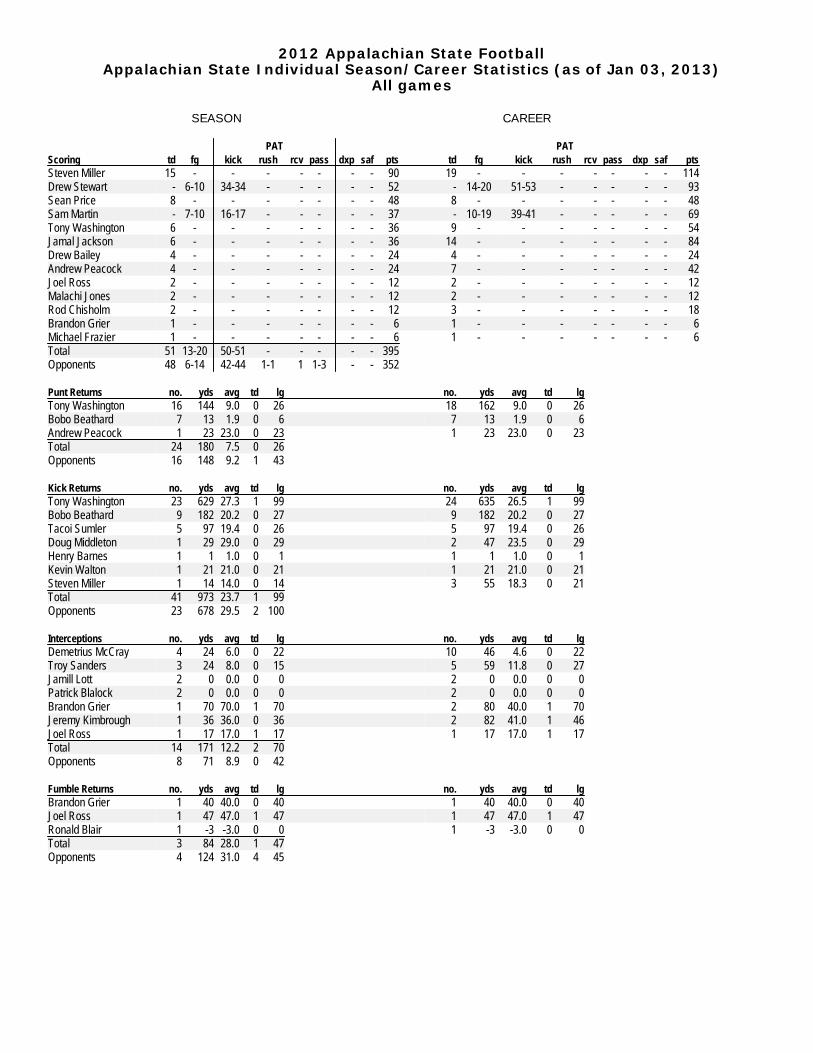
2012 Appalachian State FootballAppalachian State Individual Season/Career Statistics (as of Jan 03, 2013)
All games
SEASON CAREER
PAT PATScoring td fg kick rush rcv pass dxp saf pts td fg kick rush rcv pass dxp saf ptsSteven Miller 15 - - - - - - - 90 19 - - - - - - - 114Drew Stewart - 6-10 34-34 - - - - - 52 - 14-20 51-53 - - - - - 93Sean Price 8 - - - - - - - 48 8 - - - - - - - 48Sam Martin - 7-10 16-17 - - - - - 37 - 10-19 39-41 - - - - - 69Tony Washington 6 - - - - - - - 36 9 - - - - - - - 54Jamal Jackson 6 - - - - - - - 36 14 - - - - - - - 84Drew Bailey 4 - - - - - - - 24 4 - - - - - - - 24Andrew Peacock 4 - - - - - - - 24 7 - - - - - - - 42Joel Ross 2 - - - - - - - 12 2 - - - - - - - 12Malachi Jones 2 - - - - - - - 12 2 - - - - - - - 12Rod Chisholm 2 - - - - - - - 12 3 - - - - - - - 18Brandon Grier 1 - - - - - - - 6 1 - - - - - - - 6Michael Frazier 1 - - - - - - - 6 1 - - - - - - - 6Total 51 13-20 50-51 - - - - - 395Opponents 48 6-14 42-44 1-1 1 1-3 - - 352
Punt Returns no. yds avg td lg no. yds avg td lgTony Washington 16 144 9.0 0 26 18 162 9.0 0 26Bobo Beathard 7 13 1.9 0 6 7 13 1.9 0 6Andrew Peacock 1 23 23.0 0 23 1 23 23.0 0 23Total 24 180 7.5 0 26Opponents 16 148 9.2 1 43
Kick Returns no. yds avg td lg no. yds avg td lgTony Washington 23 629 27.3 1 99 24 635 26.5 1 99Bobo Beathard 9 182 20.2 0 27 9 182 20.2 0 27Tacoi Sumler 5 97 19.4 0 26 5 97 19.4 0 26Doug Middleton 1 29 29.0 0 29 2 47 23.5 0 29Henry Barnes 1 1 1.0 0 1 1 1 1.0 0 1Kevin Walton 1 21 21.0 0 21 1 21 21.0 0 21Steven Miller 1 14 14.0 0 14 3 55 18.3 0 21Total 41 973 23.7 1 99Opponents 23 678 29.5 2 100
Interceptions no. yds avg td lg no. yds avg td lgDemetrius McCray 4 24 6.0 0 22 10 46 4.6 0 22Troy Sanders 3 24 8.0 0 15 5 59 11.8 0 27Jamill Lott 2 0 0.0 0 0 2 0 0.0 0 0Patrick Blalock 2 0 0.0 0 0 2 0 0.0 0 0Brandon Grier 1 70 70.0 1 70 2 80 40.0 1 70Jeremy Kimbrough 1 36 36.0 0 36 2 82 41.0 1 46Joel Ross 1 17 17.0 1 17 1 17 17.0 1 17Total 14 171 12.2 2 70Opponents 8 71 8.9 0 42
Fumble Returns no. yds avg td lg no. yds avg td lgBrandon Grier 1 40 40.0 0 40 1 40 40.0 0 40Joel Ross 1 47 47.0 1 47 1 47 47.0 1 47Ronald Blair 1 -3 -3.0 0 0 1 -3 -3.0 0 0Total 3 84 28.0 1 47Opponents 4 124 31.0 4 45

2012 Appalachian State FootballAppalachian State Individual Season/Career Statistics (as of Jan 03, 2013)
All games
SEASON CAREER
All Purpose g rush rcv pr kr ir total avg/g g rush rcv pr kr ir total avg/gSteven Miller 12 1368 377 0 14 0 1759 146.6 23 1748 509 0 55 0 2312 100.5Tony Washington 12 71 472 144 629 0 1316 109.7 37 76 898 162 635 0 1771 47.9Sean Price 10 0 1196 0 0 0 1196 119.6 13 0 1202 0 0 0 1202 92.5Andrew Peacock 12 2 795 23 0 0 820 68.3 35 46 1402 23 0 0 1471 42.0Malachi Jones 12 0 370 0 0 0 370 30.8 12 0 370 0 0 0 370 30.8Jamal Jackson 12 328 0 0 0 0 328 27.3 31 724 0 0 0 0 724 23.4Bobo Beathard 12 0 0 13 182 0 195 16.2 15 0 0 13 182 0 195 13.0Rod Chisholm 9 154 15 0 0 0 169 18.8 24 398 15 0 0 0 413 17.2Tacoi Sumler 6 0 47 0 97 0 144 24.0 6 0 47 0 97 0 144 24.0Drew Bailey 12 0 123 0 0 0 123 10.2 20 0 123 0 0 0 123 6.2Michael Frazier 12 93 27 0 0 0 120 10.0 38 93 27 0 0 0 120 3.2Simms McElfresh 11 0 86 0 0 0 86 7.8 11 0 86 0 0 0 86 7.8Brandon Grier 10 0 0 0 0 70 70 7.0 46 0 0 0 0 80 80 1.7Jeremy Kimbrou 12 0 0 0 0 36 36 3.0 47 0 0 0 0 82 82 1.7Doug Middleton 1 0 0 0 29 0 29 29.0 13 0 0 0 47 120 167 12.8Kameron Bryant 1 24 0 0 0 0 24 24.0 1 24 0 0 0 0 24 24.0Troy Sanders 12 0 0 0 0 24 24 2.0 51 0 0 0 0 59 59 1.2Demetrius McCra 12 0 0 0 0 24 24 2.0 48 0 0 0 0 46 46 1.0Kevin Walton 12 0 0 0 21 0 21 1.8 12 0 0 0 21 0 21 1.8Joel Ross 12 0 0 0 0 17 17 1.4 20 0 0 0 0 17 17 0.9Graham Fisher 12 0 13 0 0 0 13 1.1 24 0 13 0 0 0 13 0.5Logan Hallock 6 13 0 0 0 0 13 2.2 18 13 0 0 0 0 13 0.7Ricky Fergerson 11 1 4 0 0 0 5 0.5 11 1 4 0 0 0 5 0.5Henry Barnes 12 0 0 0 1 0 1 0.1 13 0 0 0 1 0 1 0.1TEAM 3 -11 0 0 0 0 -11 -3.7Total 12 2043 3525 180 973 171 6892 574.3Opponents 12 2287 2671 148 678 71 5855 487.9
Field Goals att good long blkd att good long blkdSam Martin 10 7 47 0 19 10 51 0Drew Stewart 10 6 41 0 20 14 44 0Total 20 13 47 0Opponents 14 6 41 1
Punting no. yds avg lg blk no. yds avg lg blkSam Martin 60 2755 45.9 68 1 226 9397 41.6 74 2TEAM 1 0 0.0 0 0Total 61 2755 45.2 68 1Opponents 71 2942 41.4 60 0
Kickoffs no. yds avg tb ob no. yds avg tb obSam Martin 71 4479 63.1 45 3 189 12000 63.5 55 7Drew Stewart 1 50 50.0 1 0 15 951 63.4 2 1Total 72 4529 62.9 46 3Opponents 65 4046 62.2 21 1

2012 Appalachian State FootballAppalachian State Individual Season/Career Statistics (as of Jan 03, 2013)
All games
SEASON CAREER
## Defensive Leaders gp ua a total tfl sack int pbu fr ff blk gp ua a total tfl sack int pbu fr ff blk33 Jeremy Kimbrough 12 6 9 7 4 1 4 3 12.5 4 . 5 1 1 . . . 47 1 3 5 1 7 7 3 1 2 25.0 8 . 5 2 7 2 2 .9 Troy Sanders 12 4 3 4 0 8 3 6.5 0 . 5 3 4 . 1 . 51 1 3 2 1 0 1 2 3 3 13.0 1 . 5 5 1 5 1 2 224 Brandon Grier 10 4 2 3 2 7 4 8.0 6 . 0 1 . 2 1 . 46 1 1 0 1 3 5 2 4 5 25.0 9 . 5 2 3 3 3 .34 Patrick Blalock 12 3 7 2 6 6 3 3.0 . 2 4 2 1 . 31 6 3 4 4 1 0 7 3.0 . 2 8 3 1 249 Ronald Blair 12 2 5 3 5 6 0 8.5 3 . 0 . . 1 . . 24 4 3 5 7 1 0 0 20.0 6 . 5 . 1 1 1 .10 Demetrius McCray 12 3 7 1 8 5 5 0.5 . 4 4 . 1 . 48 8 3 4 0 1 2 3 3.0 2 . 0 10 1 6 . 2 .26 Joel Ross 12 2 7 1 9 4 6 6.0 . 1 2 1 . . 20 3 2 2 6 5 8 6.5 0 . 5 1 4 1 . .2 Deuce Robinson 11 9 3 0 3 9 4.5 1 . 0 . 2 . . . 23 1 2 4 3 5 5 8.0 3 . 0 . 2 . 1 .5 Jamill Lott 10 2 5 1 4 3 9 1.0 . 2 3 . 1 . 28 3 1 2 3 5 4 1.0 . 2 3 . 1 .45 Karl Anderson 11 1 7 2 2 3 9 0.0 . . . 1 . . 34 2 6 4 7 7 3 2.5 1 . 0 . . 3 . .99 Stephen Burns 12 1 8 1 9 3 7 4.5 . . . . 1 . 12 1 8 1 9 3 7 4.5 . . . . 1 .92 Davante Harris 12 9 2 5 3 4 6.5 1 . 0 . . . . . 15 9 2 6 3 5 6.5 1 . 0 . . . . .46 Adam Scott 12 1 1 1 0 2 1 6.0 5 . 0 . 1 . . 1 22 1 3 1 1 2 4 6.0 5 . 0 . 1 . . 256 Thomas Bronson 12 8 1 2 2 0 0.5 0 . 5 . . . . . 12 8 1 2 2 0 0.5 0 . 5 . . . . .13 Greg Hall 12 8 7 1 5 3.5 3 . 5 . 1 . 1 . 12 8 7 1 5 3.5 3 . 5 . 1 . 1 .18 Jamal Ware 9 6 7 1 3 3.0 . . . . . . 18 8 1 4 2 2 3.5 . . 1 . . .8A Greg Milhouse 12 3 9 1 2 1.5 1 . 0 . . . . . 12 3 9 1 2 1.5 1 . 0 . . . . .4 Rodger Walker 7 6 5 1 1 0.0 . . 1 . . . 26 2 0 1 7 3 7 0.0 . 4 3 1 . .31 Kevin Walton 12 4 5 9 0.5 . . . . . . 12 4 5 9 0.5 . . . . . .29 Aaron Krah 12 5 2 7 0.0 . . 1 . . . 12 5 2 7 0.0 . . 1 . . .20 Henry Barnes 12 3 4 7 0.0 . . . . 1 . 13 3 4 7 0.0 . . . . 1 .42 Michael Frazier 12 5 1 6 0.0 . . . . . . 38 2 5 2 5 5 0 0.0 . . 1 . 1 .21 Doug Middleton 1 2 3 5 0.0 . . . . . . 13 1 3 1 5 2 8 0.5 . 2 3 . . .90 Nic Canepa 10 1 4 5 0.5 . . . . . . 10 1 4 5 0.5 . . . . . .22 Brandon McGowan 12 2 1 3 0.0 . . . . . . 22 1 0 1 0 2 0 1.5 1 . 0 . . . . .15 Tony Washington 12 2 . 2 0.0 . . . . . . 37 9 3 1 2 0.0 . . . . 2 .27 Sam Martin 12 2 . 2 0.0 . . . . . . 51 3 . 3 0.0 . . . . . .81 Bobo Beathard 12 . 2 2 0.0 . . . . . . 15 . 3 3 0.0 . . . . . .35 John Law 3 1 1 2 0.0 . . . . . . 3 1 1 2 0.0 . . . . . .43 Drew Davies 10 1 . 1 0.0 . . . . . . 10 1 . 1 0.0 . . . . . .64 Will Corbin 9 1 . 1 0.0 . . . . . . 9 1 . 1 0.0 . . . . . .39 Matt Watson 11 1 . 1 0.0 . . . 1 . . 11 1 . 1 0.0 . . . 1 . .55 Graham Fisher 12 1 . 1 0.0 . . . . . . 24 1 . 1 0.0 . . . . . .91 Will Smith 4 . 1 1 0.0 . . . . . . 4 . 1 1 0.0 . . . . . .12 Jamal Jackson 12 1 . 1 0.0 . . . . . . 31 1 . 1 0.0 . . . . . .11 Andrew Peacock 12 . 1 1 0.0 . . . . . . 35 3 3 6 0.0 . . . . 1 .14 Sean Price 10 1 . 1 0.0 . . . . . . 13 1 . 1 0.0 . . . . . .53 Brett Heimrich 12 . 1 1 0.0 . . . . . . 15 . 1 1 0.0 . . . . . .89 Josh Anding 12 1 . 1 0.0 . . . . . . 12 1 . 1 0.0 . . . . . .
Total 12 4 3 4 4 3 0 8 6 4 77 26 14 2 4 8 8 1Opponents 12 4 6 5 5 2 8 9 9 3 69 25 8 2 6 9 1 3 2

2012 Appalachian State FootballAppalachian State Passing Game-by-Game (as of Jan 03, 2013)
All games
#12 Jamal Jackson Comp Att Int Pct Yards TD Long Sacked EfficEast Carolina 23 40 1 57.5 300 0 37 0-0 115.50Montana 24 34 0 70.6 260 2 32 1-3 154.24The Citadel 23 32 1 71.9 164 0 15 1-5 108.68Chattanooga 19 30 1 63.3 268 3 36 1-5 164.71Coastal Carolina 19 27 1 70.4 285 3 69 0-0 188.30Elon 20 29 1 69.0 304 4 54 2-14 195.64Samford 22 39 1 56.4 288 2 48 3-26 130.24Wofford 29 46 1 63.0 257 0 16 3-25 105.63Western Carolina 3 4 0 75.0 64 1 32 1-4 291.90Georgia Southern 21 34 0 61.8 383 3 67 4-43 185.51Furman 32 46 0 69.6 332 1 22 5-37 137.37Illinois State 33 45 1 73.3 373 2 48 3-17 153.18TOTALS 268 406 8 66.0 3278 21 69 24-179 146.96
#16 Logan Hallock Comp Att Int Pct Yards TD Long Sacked EfficWestern Carolina 20 21 0 95.2 230 2 36 1-7 218.67TOTALS 20 21 0 95.2 230 2 36 1-7 218.67
#11 Andrew Peacock Comp Att Int Pct Yards TD Long Sacked EfficFurman 1 1 0 100.0 7 1 7 0-0 488.80Illinois State 1 1 0 100.0 10 1 10 0-0 514.00TOTALS 2 2 0 100.0 17 2 10 0-0 501.40
#7A Kameron Bryant Comp Att Int Pct Yards TD Long Sacked EfficCoastal Carolina 1 1 0 100.0 0 0 0 0-0 100.00TOTALS 1 1 0 100.0 0 0 0 0-0 100.00
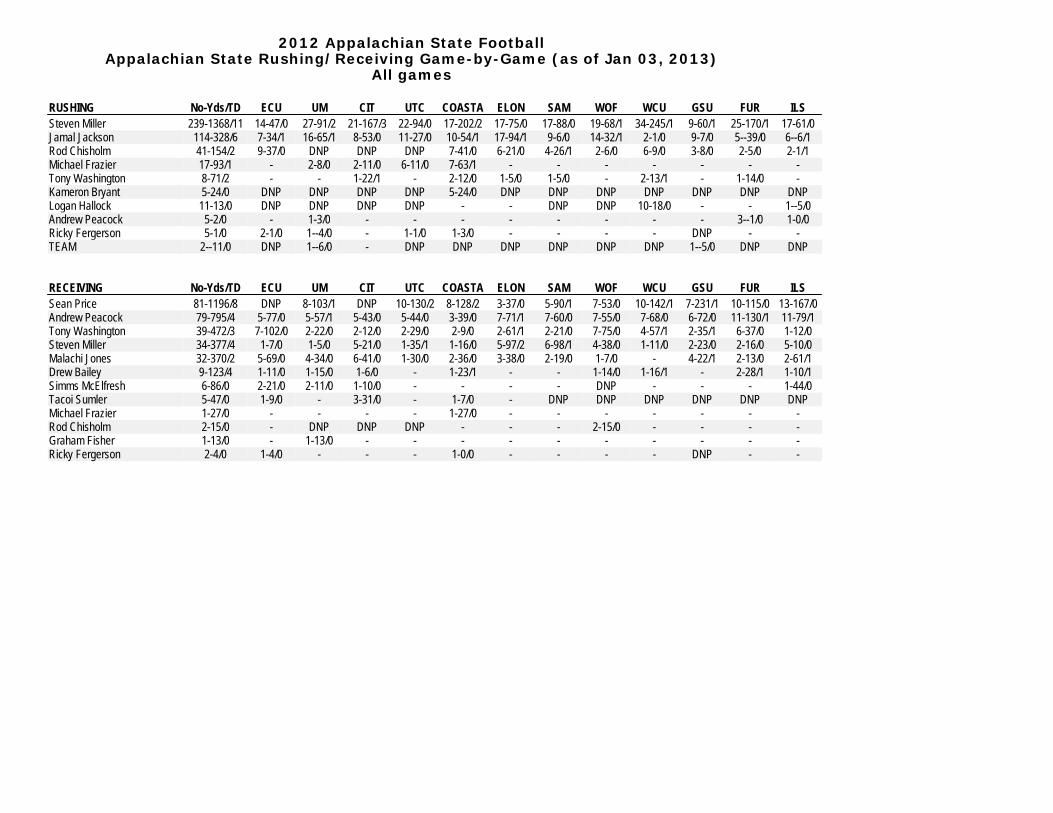
2012 Appalachian State FootballAppalachian State Rushing/Receiving Game-by-Game (as of Jan 03, 2013)
All games
RUSHING No-Yds/TD ECU UM CIT UTC COASTA ELON SAM WOF WCU GSU FUR ILSSteven Miller 239-1368/11 14-47/0 27-91/2 21-167/3 22-94/0 17-202/2 17-75/0 17-88/0 19-68/1 34-245/1 9-60/1 25-170/1 17-61/0Jamal Jackson 114-328/6 7-34/1 16-65/1 8-53/0 11-27/0 10-54/1 17-94/1 9-6/0 14-32/1 2-1/0 9-7/0 5--39/0 6--6/1Rod Chisholm 41-154/2 9-37/0 DNP DNP DNP 7-41/0 6-21/0 4-26/1 2-6/0 6-9/0 3-8/0 2-5/0 2-1/1Michael Frazier 17-93/1 - 2-8/0 2-11/0 6-11/0 7-63/1 - - - - - - -Tony Washington 8-71/2 - - 1-22/1 - 2-12/0 1-5/0 1-5/0 - 2-13/1 - 1-14/0 -Kameron Bryant 5-24/0 DNP DNP DNP DNP 5-24/0 DNP DNP DNP DNP DNP DNP DNPLogan Hallock 11-13/0 DNP DNP DNP DNP - - DNP DNP 10-18/0 - - 1--5/0Andrew Peacock 5-2/0 - 1-3/0 - - - - - - - - 3--1/0 1-0/0Ricky Fergerson 5-1/0 2-1/0 1--4/0 - 1-1/0 1-3/0 - - - - DNP - -TEAM 2--11/0 DNP 1--6/0 - DNP DNP DNP DNP DNP DNP 1--5/0 DNP DNP
RECEIVING No-Yds/TD ECU UM CIT UTC COASTA ELON SAM WOF WCU GSU FUR ILSSean Price 81-1196/8 DNP 8-103/1 DNP 10-130/2 8-128/2 3-37/0 5-90/1 7-53/0 10-142/1 7-231/1 10-115/0 13-167/0Andrew Peacock 79-795/4 5-77/0 5-57/1 5-43/0 5-44/0 3-39/0 7-71/1 7-60/0 7-55/0 7-68/0 6-72/0 11-130/1 11-79/1Tony Washington 39-472/3 7-102/0 2-22/0 2-12/0 2-29/0 2-9/0 2-61/1 2-21/0 7-75/0 4-57/1 2-35/1 6-37/0 1-12/0Steven Miller 34-377/4 1-7/0 1-5/0 5-21/0 1-35/1 1-16/0 5-97/2 6-98/1 4-38/0 1-11/0 2-23/0 2-16/0 5-10/0Malachi Jones 32-370/2 5-69/0 4-34/0 6-41/0 1-30/0 2-36/0 3-38/0 2-19/0 1-7/0 - 4-22/1 2-13/0 2-61/1Drew Bailey 9-123/4 1-11/0 1-15/0 1-6/0 - 1-23/1 - - 1-14/0 1-16/1 - 2-28/1 1-10/1Simms McElfresh 6-86/0 2-21/0 2-11/0 1-10/0 - - - - DNP - - - 1-44/0Tacoi Sumler 5-47/0 1-9/0 - 3-31/0 - 1-7/0 - DNP DNP DNP DNP DNP DNPMichael Frazier 1-27/0 - - - - 1-27/0 - - - - - - -Rod Chisholm 2-15/0 - DNP DNP DNP - - - 2-15/0 - - - -Graham Fisher 1-13/0 - 1-13/0 - - - - - - - - - -Ricky Fergerson 2-4/0 1-4/0 - - - 1-0/0 - - - - DNP - -

2012 Appalachian State FootballAppalachian State Total Tackles Game-by-Game (as of Jan 03, 2013)
All games
Total Tackles UA-A Total ECU UM CIT UTC COASTA ELON SAM WOF WCU GSU FUR ILSJ. Kimbrough 69-74 143 4 - 9 7 - 7 7 - 7 3 - 3 6 - 5 6 - 3 5 - 5 3 - 1 2 4 - 5 5 - 5 1 0 - 7 9 - 6Troy Sanders 43-40 83 4 - 6 4 - 1 4 - 2 3 - 2 1 - 4 5 - 6 4 - 0 5 - 3 0 - 1 6 - 4 3 - 4 4 - 7Brandon Grier 42-32 74 9 - 0 5 - 8 2 - 5 5 - 2 3 - 3 7 - 1 9 - 0 0 - 4 D N P D N P 2 - 3 0 - 6Patrick Blalock 37-26 63 4 - 4 4 - 1 6 - 4 3 - 2 3 - 0 2 - 2 3 - 1 2 - 1 2 - 1 3 - 3 2 - 4 3 - 3Ronald Blair 25-35 60 1 - 0 3 - 3 3 - 5 1 - 4 1 - 1 2 - 3 1 - 3 6 - 4 3 - 4 4 - 5 0 - 2 0 - 1D. McCray 37-18 55 2 - 1 2 - 1 3 - 2 3 - 0 2 - 0 7 - 1 3 - 2 2 - 3 3 - 2 5 - 2 2 - 3 3 - 1Joel Ross 27-19 46 1 - 2 3 - 1 3 - 2 2 - 5 3 - 2 2 - 2 3 - 1 3 - 2 3 - 0 - 2 - 1 2 - 1Jamill Lott 25-14 39 D N P 3 - 1 D N P 4 - 4 3 - 1 2 - 1 2 - 0 2 - 1 4 - 1 1 - 4 2 - 1 2 - 0Karl Anderson 17-22 39 2 - 2 - D N P 0 - 1 - 1 - 0 - 5 - 5 5 - 5 3 - 7 0 - 2 1 - 0Deuce Robinson 9-30 39 2 - 4 2 - 6 0 - 6 0 - 5 1 - 1 2 - 0 D N P 0 - 2 0 - 2 1 - 1 0 - 1 1 - 2Stephen Burns 18-19 37 2 - 0 1 - 4 2 - 1 1 - 0 2 - 2 0 - 1 1 - 1 1 - 6 3 - 0 3 - 1 - 2 - 3Davante Harris 9-25 34 0 - 3 0 - 2 1 - 2 0 - 1 0 - 1 1 - 2 1 - 1 2 - 3 1 - 1 1 - 3 2 - 3 0 - 3Adam Scott 11-10 21 1 - 0 - 1 - 1 3 - 0 - 0 - 1 5 - 2 0 - 1 - 1 - 3 - 0 - 2Thomas Bronson 8-12 20 2 - 1 1 - 1 1 - 0 1 - 0 0 - 1 0 - 1 - 2 - 1 0 - 2 0 - 5 1 - 0 -Greg Hall 8-7 15 1 - 0 - - 0 - 2 0 - 2 1 - 0 4 - 1 0 - 1 2 - 0 - 0 - 1 -Jamal Ware 6-7 13 D N P D N P 3 - 4 1 - 0 1 - 0 - 0 - 1 1 - 1 - - 0 - 1 D N PGreg Milhouse 3-9 12 1 - 1 - 1 - 1 1 - 1 0 - 2 - 0 - 2 - - - - 0 - 2Rodger Walker 6-5 11 D N P D N P D N P D N P 1 - 0 - 1 - 0 D N P - 3 - 2 1 - 2 0 - 1Kevin Walton 4-5 9 1 - 0 - 0 - 1 1 - 0 - 0 - 1 - - 0 - 1 1 - 2 1 - 0 -Henry Barnes 3-4 7 0 - 1 1 - 0 - - 1 - 2 - 1 - 0 - - - 0 - 1 -Aaron Krah 5-2 7 0 - 2 - 1 - 0 1 - 0 2 - 0 - - - 1 - 0 - - -Michael Frazier 5-1 6 - - - - - - 3 - 0 1 - 0 - 1 - 0 0 - 1 -Nic Canepa 1-4 5 - - 0 - 1 0 - 1 0 - 1 1 - 0 - - D N P D N P 0 - 1 -Doug Middleton 2-3 5 2 - 3 D N P D N P D N P D N P D N P D N P D N P D N P D N P D N P D N PBrandon McGowan 2-1 3 - - - - 1 - 0 - - - - 1 - 1 - -John Law 1-1 2 0 - 1 - 1 - 0 D N P D N P D N P D N P D N P D N P D N P D N P D N PSam Martin 2-0 2 - - - - 1 - 0 - - - - 1 - 0 - -Bobo Beathard 0-2 2 - - - - - 0 - 1 0 - 1 - - - - -Tony Washington 2-0 2 - - - 1 - 0 - - 1 - 0 - - - - -Sean Price 1-0 1 D N P - D N P - 1 - 0 - - - - - - -Drew Davies 1-0 1 1 - 0 - - - - - - - D N P - - D N PWill Smith 0-1 1 D N P - - 0 - 1 - D N P D N P D N P D N P D N P D N P D N PBrett Heimrich 0-1 1 - - - - - - 0 - 1 - - - - -Matt Watson 1-0 1 - - - - D N P - - - 1 - 0 - - -Josh Anding 1-0 1 - - - - - - 1 - 0 - - - - -Jamal Jackson 1-0 1 - - 1 - 0 - - - - - - - - -Andrew Peacock 0-1 1 - - - - - - - - 0 - 1 - - -Graham Fisher 1-0 1 - - 1 - 0 - - - - - - - - -Will Corbin 1-0 1 D N P D N P D N P 1 - 0 - - - - - - - -
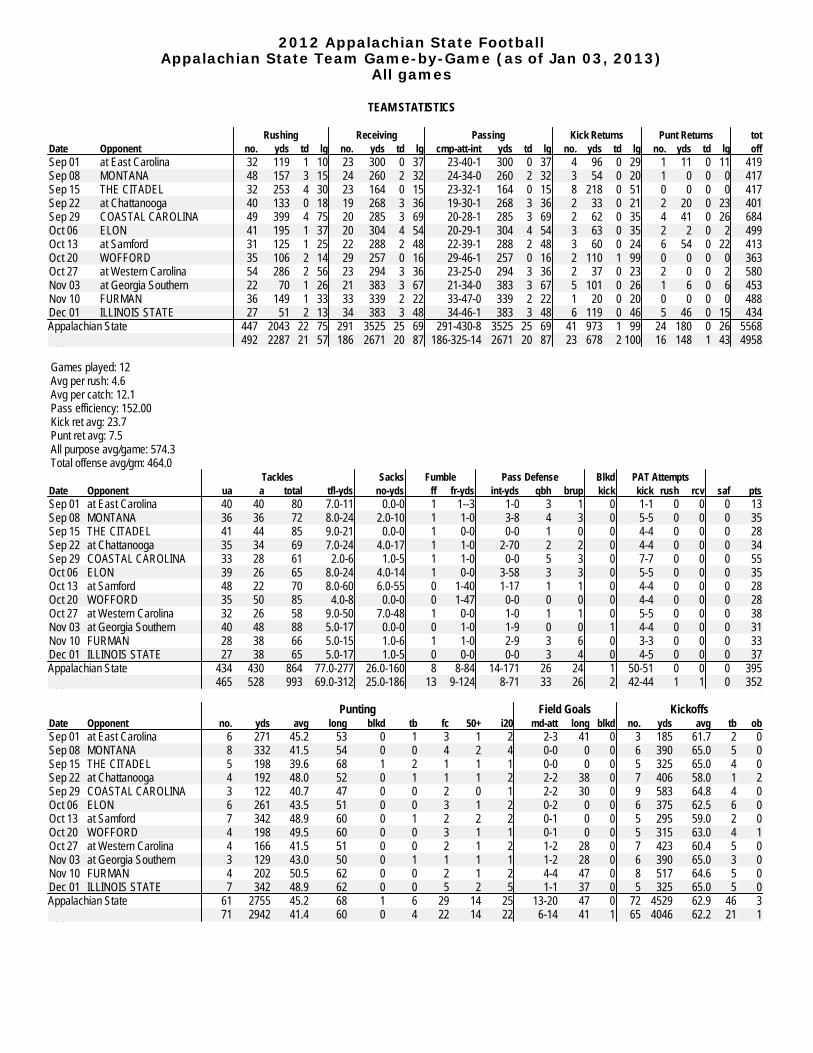
2012 Appalachian State FootballAppalachian State Team Game-by-Game (as of Jan 03, 2013)
All games
TEAM STATISTICS
Rushing Receiving Passing Kick Returns Punt Returns totDate Opponent no. yds td lg no. yds td lg cmp-att-int yds td lg no. yds td lg no. yds td lg offSep 01 at East Carolina 32 119 1 10 23 300 0 37 23-40-1 300 0 37 4 96 0 29 1 11 0 11 419Sep 08 MONTANA 48 157 3 15 24 260 2 32 24-34-0 260 2 32 3 54 0 20 1 0 0 0 417Sep 15 THE CITADEL 32 253 4 30 23 164 0 15 23-32-1 164 0 15 8 218 0 51 0 0 0 0 417Sep 22 at Chattanooga 40 133 0 18 19 268 3 36 19-30-1 268 3 36 2 33 0 21 2 20 0 23 401Sep 29 COASTAL CAROLINA 49 399 4 75 20 285 3 69 20-28-1 285 3 69 2 62 0 35 4 41 0 26 684Oct 06 ELON 41 195 1 37 20 304 4 54 20-29-1 304 4 54 3 63 0 35 2 2 0 2 499Oct 13 at Samford 31 125 1 25 22 288 2 48 22-39-1 288 2 48 3 60 0 24 6 54 0 22 413Oct 20 WOFFORD 35 106 2 14 29 257 0 16 29-46-1 257 0 16 2 110 1 99 0 0 0 0 363Oct 27 at Western Carolina 54 286 2 56 23 294 3 36 23-25-0 294 3 36 2 37 0 23 2 0 0 2 580Nov 03 at Georgia Southern 22 70 1 26 21 383 3 67 21-34-0 383 3 67 5 101 0 26 1 6 0 6 453Nov 10 FURMAN 36 149 1 33 33 339 2 22 33-47-0 339 2 22 1 20 0 20 0 0 0 0 488Dec 01 ILLINOIS STATE 27 51 2 13 34 383 3 48 34-46-1 383 3 48 6 119 0 46 5 46 0 15 434Appalachian State 447 2043 22 75 291 3525 25 69 291-430-8 3525 25 69 41 973 1 99 24 180 0 26 5568Opponents 492 2287 21 57 186 2671 20 87 186-325-14 2671 20 87 23 678 2 100 16 148 1 43 4958
Games played: 12 Avg per rush: 4.6 Avg per catch: 12.1 Pass efficiency: 152.00 Kick ret avg: 23.7 Punt ret avg: 7.5 All purpose avg/game: 574.3 Total offense avg/gm: 464.0
Tackles Sacks Fumble Pass Defense Blkd PAT AttemptsDate Opponent ua a total tfl-yds no-yds ff fr-yds int-yds qbh brup kick kick rush rcv saf ptsSep 01 at East Carolina 40 40 80 7.0-11 0.0-0 1 1--3 1-0 3 1 0 1-1 0 0 0 13Sep 08 MONTANA 36 36 72 8.0-24 2.0-10 1 1-0 3-8 4 3 0 5-5 0 0 0 35Sep 15 THE CITADEL 41 44 85 9.0-21 0.0-0 1 0-0 0-0 1 0 0 4-4 0 0 0 28Sep 22 at Chattanooga 35 34 69 7.0-24 4.0-17 1 1-0 2-70 2 2 0 4-4 0 0 0 34Sep 29 COASTAL CAROLINA 33 28 61 2.0-6 1.0-5 1 1-0 0-0 5 3 0 7-7 0 0 0 55Oct 06 ELON 39 26 65 8.0-24 4.0-14 1 0-0 3-58 3 3 0 5-5 0 0 0 35Oct 13 at Samford 48 22 70 8.0-60 6.0-55 0 1-40 1-17 1 1 0 4-4 0 0 0 28Oct 20 WOFFORD 35 50 85 4.0-8 0.0-0 0 1-47 0-0 0 0 0 4-4 0 0 0 28Oct 27 at Western Carolina 32 26 58 9.0-50 7.0-48 1 0-0 1-0 1 1 0 5-5 0 0 0 38Nov 03 at Georgia Southern 40 48 88 5.0-17 0.0-0 0 1-0 1-9 0 0 1 4-4 0 0 0 31Nov 10 FURMAN 28 38 66 5.0-15 1.0-6 1 1-0 2-9 3 6 0 3-3 0 0 0 33Dec 01 ILLINOIS STATE 27 38 65 5.0-17 1.0-5 0 0-0 0-0 3 4 0 4-5 0 0 0 37Appalachian State 434 430 864 77.0-277 26.0-160 8 8-84 14-171 26 24 1 50-51 0 0 0 395Opponents 465 528 993 69.0-312 25.0-186 13 9-124 8-71 33 26 2 42-44 1 1 0 352
Punting Field Goals KickoffsDate Opponent no. yds avg long blkd tb fc 50+ i20 md-att long blkd no. yds avg tb obSep 01 at East Carolina 6 271 45.2 53 0 1 3 1 2 2-3 41 0 3 185 61.7 2 0Sep 08 MONTANA 8 332 41.5 54 0 0 4 2 4 0-0 0 0 6 390 65.0 5 0Sep 15 THE CITADEL 5 198 39.6 68 1 2 1 1 1 0-0 0 0 5 325 65.0 4 0Sep 22 at Chattanooga 4 192 48.0 52 0 1 1 1 2 2-2 38 0 7 406 58.0 1 2Sep 29 COASTAL CAROLINA 3 122 40.7 47 0 0 2 0 1 2-2 30 0 9 583 64.8 4 0Oct 06 ELON 6 261 43.5 51 0 0 3 1 2 0-2 0 0 6 375 62.5 6 0Oct 13 at Samford 7 342 48.9 60 0 1 2 2 2 0-1 0 0 5 295 59.0 2 0Oct 20 WOFFORD 4 198 49.5 60 0 0 3 1 1 0-1 0 0 5 315 63.0 4 1Oct 27 at Western Carolina 4 166 41.5 51 0 0 2 1 2 1-2 28 0 7 423 60.4 5 0Nov 03 at Georgia Southern 3 129 43.0 50 0 1 1 1 1 1-2 28 0 6 390 65.0 3 0Nov 10 FURMAN 4 202 50.5 62 0 0 2 1 2 4-4 47 0 8 517 64.6 5 0Dec 01 ILLINOIS STATE 7 342 48.9 62 0 0 5 2 5 1-1 37 0 5 325 65.0 5 0Appalachian State 61 2755 45.2 68 1 6 29 14 25 13-20 47 0 72 4529 62.9 46 3Opponents 71 2942 41.4 60 0 4 22 14 22 6-14 41 1 65 4046 62.2 21 1

2012 Appalachian State FootballAppalachian State Opponent Game-by-Game (as of Jan 03, 2013)
All games
OPPONENT STATISTICS
Rushing Receiving Passing Kick Returns Punt Returns totDate Opponent no. yds td lg no. yds td lg cmp-att-int yds td lg no. yds td lg no. yds td lg offSep 01 at East Carolina 35 148 1 15 28 242 2 32 28-43-1 242 2 32 1 90 1 90 1 43 0 43 390Sep 08 MONTANA 45 176 1 18 15 307 3 87 15-29-3 307 3 87 1 21 0 10 1 3 0 3 483Sep 15 THE CITADEL 63 463 6 57 4 155 0 53 4-6-0 155 0 53 1 23 0 23 1 38 1 8 618Sep 22 at Chattanooga 32 87 0 18 20 183 2 28 20-35-2 183 2 28 4 70 0 21 1 0 0 0 270Sep 29 COASTAL CAROLINA 31 114 0 12 16 190 2 45 16-35-0 190 2 45 5 165 0 87 0 0 0 0 304Oct 06 ELON 31 96 0 14 25 419 3 59 25-41-3 419 3 59 0 0 0 0 3 18 0 19 515Oct 13 at Samford 38 82 2 26 18 270 1 62 18-30-1 270 1 62 3 32 0 14 4 14 0 7 352Oct 20 WOFFORD 62 393 4 57 3 47 0 38 3-5-0 47 0 38 0 0 0 0 1 8 0 8 440Oct 27 at Western Carolina 34 149 3 40 13 167 1 74 13-22-1 167 1 74 2 57 0 46 1 3 0 3 316Nov 03 at Georgia Southern 63 386 4 42 5 166 0 40 5-10-1 166 0 40 3 80 0 42 1 -3 0 0 552Nov 10 FURMAN 26 97 0 27 19 203 1 26 19-37-2 203 1 26 3 140 1 100 1 15 0 15 300Dec 01 ILLINOIS STATE 32 96 0 20 20 322 5 44 20-32-0 322 5 44 0 0 0 0 1 9 0 9 418Opponents 492 2287 21 57 186 2671 20 87 186-325-14 2671 20 87 23 678 2 100 16 148 1 43 4958Appalachian State 447 2043 22 75 291 3525 25 69 291-430-8 3525 25 69 41 973 1 99 24 180 0 26 5568
Games played: 12 Avg per rush: 4.6 Avg per catch: 14.4 Pass efficiency: 137.96 Kick ret avg: 29.5 Punt ret avg: 9.2 All purpose avg/game: 487.9 Total offense avg/gm: 413.2
Tackles Sacks Fumble Pass Defense Blkd PAT AttemptsDate Opponent ua a total tfl-yds no-yds ff fr-yds int-yds qbh brup kick kick rush rcv saf ptsSep 01 at East Carolina 34 46 80 1.0-2 0.0-0 2 2-45 1-0 5 0 0 5-5 0 0 0 35Sep 08 MONTANA 41 44 85 4.0-11 1.0-3 0 0-0 0-0 3 2 0 3-4 0 0 0 27Sep 15 THE CITADEL 40 36 76 1.0-5 1.0-5 1 1-12 1-11 1 3 1 7-7 0 0 0 52Sep 22 at Chattanooga 34 46 80 4.0-13 1.0-5 1 1-0 1-42 5 2 0 2-2 0 0 0 17Sep 29 COASTAL CAROLINA 47 36 83 2.0-3 0.0-0 0 0-0 1-0 0 1 0 2-2 0 0 0 14Oct 06 ELON 35 50 85 8.0-39 2.0-14 0 0-0 1-20 1 4 0 2-2 0 0 0 23Oct 13 at Samford 45 30 75 8.0-32 3.0-26 1 0-0 1--2 6 2 0 2-2 0 1 0 25Oct 20 WOFFORD 43 36 79 7.0-35 3.0-25 3 1-40 1-0 3 1 0 5-5 0 0 0 38Oct 27 at Western Carolina 31 78 109 9.0-29 2.0-11 1 1-0 0-0 2 0 0 1-2 1 0 0 27Nov 03 at Georgia Southern 35 20 55 5.0-46 4.0-43 1 1-0 0-0 4 2 0 4-4 0 0 0 28Nov 10 FURMAN 43 48 91 10.0-47 5.0-37 2 2-27 0-0 2 7 0 4-4 0 0 0 28Dec 01 ILLINOIS STATE 37 58 95 10.0-50 3.0-17 1 0-0 1-0 1 2 1 5-5 0 0 0 38Opponents 465 528 993 69.0-312 25.0-186 13 9-124 8-71 33 26 2 42-44 1 1 0 352Appalachian State 434 430 864 77.0-277 26.0-160 8 8-84 14-171 26 24 1 50-51 0 0 0 395
Punting Field Goals KickoffsDate Opponent no. yds avg long blkd tb fc 50+ i20 md-att long blkd no. yds avg tb obSep 01 at East Carolina 4 178 44.5 58 0 2 0 1 1 0-2 0 0 6 388 64.7 2 0Sep 08 MONTANA 6 213 35.5 43 0 0 3 0 3 0-0 0 0 5 341 68.2 2 0Sep 15 THE CITADEL 2 76 38.0 42 0 0 2 0 2 1-2 24 0 9 547 60.8 1 0Sep 22 at Chattanooga 7 299 42.7 60 0 0 0 3 2 1-1 32 0 4 263 65.8 2 0Sep 29 COASTAL CAROLINA 9 343 38.1 46 0 0 3 0 3 0-0 0 0 3 184 61.3 1 0Oct 06 ELON 5 204 40.8 45 0 0 2 0 3 1-2 29 0 5 307 61.4 2 0Oct 13 at Samford 9 420 46.7 57 0 1 2 3 2 1-1 25 0 5 324 64.8 2 0Oct 20 WOFFORD 5 199 39.8 53 0 0 2 1 3 1-1 29 0 7 437 62.4 4 1Oct 27 at Western Carolina 6 260 43.3 55 0 0 1 2 0 0-0 0 0 5 254 50.8 1 0Nov 03 at Georgia Southern 3 106 35.3 40 0 0 1 0 0 0-3 0 1 5 316 63.2 0 0Nov 10 FURMAN 7 289 41.3 51 0 1 6 1 3 0-1 0 0 5 325 65.0 4 0Dec 01 ILLINOIS STATE 8 355 44.4 54 0 0 0 3 0 1-1 41 0 6 360 60.0 0 0Opponents 71 2942 41.4 60 0 4 22 14 22 6-14 41 1 65 4046 62.2 21 1Appalachian State 61 2755 45.2 68 1 6 29 14 25 13-20 47 0 72 4529 62.9 46 3

2012 Appalachian State FootballAppalachian State By-Quarter Statistics (as of Jan 03, 2013)
All games
3rd-Down Conversions
Date Opponent Score Overall 1st Qtr 2nd Qtr 3rd Qtr 4th Qtr Overtime
Sep 01, 2012 at East Carolina L 13-35 4-15 26.7 2-3 66.7 0-3 0.0 2-6 33.3 0-3 0.0Sep 08, 2012 MONTANA W 35-27 7-18 38.9 3-4 75.0 1-5 20.0 2-5 40.0 1-4 25.0Sep 15, 2012 THE CITADEL L 28-52 1-7 14.3 0-2 0.0 1-3 33.3 0-2 0.0 0-0 0.0Sep 22, 2012 at Chattanooga W 34-17 5-15 33.3 2-4 50.0 2-6 33.3 1-4 25.0 0-1 0.0Sep 29, 2012 COASTAL CAROLINA W 55-14 7-11 63.6 0-0 0.0 3-5 60.0 1-2 50.0 3-4 75.0Oct 06, 2012 ELON W 35-23 5-15 33.3 2-5 40.0 1-2 50.0 2-4 50.0 0-4 0.0Oct 13, 2012 at Samford W 28-25 2-14 14.3 0-4 0.0 1-4 25.0 0-3 0.0 1-3 33.3Oct 20, 2012 WOFFORD L 28-38 7-16 43.8 1-3 33.3 3-5 60.0 1-3 33.3 2-5 40.0Oct 27, 2012 at Western Carolina W 38-27 8-15 53.3 3-4 75.0 2-4 50.0 2-3 66.7 1-4 25.0Nov 03, 2012 at Georgia Southern W 31-28 5-11 45.5 2-4 50.0 2-3 66.7 1-2 50.0 0-2 0.0Nov 10, 2012 FURMAN W 33-28 6-15 40.0 1-4 25.0 3-4 75.0 0-2 0.0 2-5 40.0Dec 01, 2012 ILLINOIS STATE L 37-38 8-17 47.1 0-3 0.0 1-4 25.0 2-4 50.0 4-5 80.0 1-1 100.0
Appalachian State 65-169 38.5 16-40 40.0 20-48 41.7 14-40 35.0 14-40 35.0 1-1 100.0Opponents 75-176 42.6 19-40 47.5 18-47 38.3 20-42 47.6 18-47 38.3 0-0 0.0
4th-Down Conversions
Date Opponent Score Overall 1st Qtr 2nd Qtr 3rd Qtr 4th Qtr Overtime
Sep 01, 2012 at East Carolina L 13-35 0-1 0.0 0-0 0.0 0-0 0.0 0-0 0.0 0-1 0.0Sep 08, 2012 MONTANA W 35-27 2-3 66.7 1-1 100.0 0-0 0.0 0-1 0.0 1-1 100.0Sep 15, 2012 THE CITADEL L 28-52 0-1 0.0 0-0 0.0 0-0 0.0 0-1 0.0 0-0 0.0Sep 22, 2012 at Chattanooga W 34-17 2-3 66.7 1-1 100.0 1-2 50.0 0-0 0.0 0-0 0.0Sep 29, 2012 COASTAL CAROLINA W 55-14 0-0 0.0 0-0 0.0 0-0 0.0 0-0 0.0 0-0 0.0Oct 06, 2012 ELON W 35-23 2-2 100.0 1-1 100.0 0-0 0.0 0-0 0.0 1-1 100.0Oct 13, 2012 at Samford W 28-25 1-4 25.0 0-1 0.0 1-1 100.0 0-0 0.0 0-2 0.0Oct 20, 2012 WOFFORD L 28-38 3-4 75.0 0-0 0.0 1-2 50.0 1-1 100.0 1-1 100.0Oct 27, 2012 at Western Carolina W 38-27 0-1 0.0 0-0 0.0 0-0 0.0 0-0 0.0 0-1 0.0Nov 03, 2012 at Georgia Southern W 31-28 0-1 0.0 0-1 0.0 0-0 0.0 0-0 0.0 0-0 0.0Nov 10, 2012 FURMAN W 33-28 0-1 0.0 0-1 0.0 0-0 0.0 0-0 0.0 0-0 0.0Dec 01, 2012 ILLINOIS STATE L 37-38 1-2 50.0 0-0 0.0 1-2 50.0 0-0 0.0 0-0 0.0 0-0 0.0
Appalachian State 11-23 47.8 3-6 50.0 4-7 57.1 1-3 33.3 3-7 42.9 0-0 0.0Opponents 7-11 63.6 1-1 100.0 0-0 0.0 2-3 66.7 4-7 57.1 0-0 0.0
Time of Possession
Date Opponent Score Overall 1st Qtr 2nd Qtr 3rd Qtr 4th Qtr Overtime
Sep 01, 2012 at East Carolina L 13-35 26:42 6:29 7:33 7:09 5:31Sep 08, 2012 MONTANA W 35-27 33:10 8:24 6:30 8:44 9:32Sep 15, 2012 THE CITADEL L 28-52 21:49 4:50 6:03 5:17 5:39Sep 22, 2012 at Chattanooga W 34-17 30:16 8:32 10:10 8:32 3:02Sep 29, 2012 COASTAL CAROLINA W 55-14 34:50 7:51 8:02 7:54 11:03Oct 06, 2012 ELON W 35-23 28:28 7:54 4:38 6:02 9:54Oct 13, 2012 at Samford W 28-25 28:28 5:36 7:20 8:17 7:15Oct 20, 2012 WOFFORD L 28-38 27:59 4:54 7:58 4:22 10:45Oct 27, 2012 at Western Carolina W 38-27 36:51 10:42 10:41 8:18 7:10Nov 03, 2012 at Georgia Southern W 31-28 21:28 7:31 5:42 4:28 3:47Nov 10, 2012 FURMAN W 33-28 32:58 10:12 7:53 5:11 9:42Dec 01, 2012 ILLINOIS STATE L 37-38 28:24 6:40 8:15 5:43 7:46 0:00
Appalachian State Total 351:23 89:35 90:45 79:57 91:06 0:00Avg. 29:16 7:27 7:33 6:39 7:35 0:00
Opponents Total 368:37 90:25 89:15 100:03 88:54 0:00Avg. 30:43 7:32 7:26 8:20 7:24 0:00

2012 Appalachian State FootballAppalachian State Red-Zone Results (as of Jan 03, 2013)
All games
Appalachian State Inside Opponent Red-Zone
Times Times Total Rush Pass FGs Failed to score inside RZ
Date Opponent Score In RZ Scored Pts TDs TDs TDs Made FGA Down Int Fumb Half Game
Sep 01, 2012 at East Carolina L 13-35 3 2 10 1 1 0 1 0 1 0 0 0 0Sep 08, 2012 MONTANA W 35-27 3 3 21 3 3 0 0 0 0 0 0 0 0Sep 15, 2012 THE CITADEL L 28-52 3 3 21 3 3 0 0 0 0 0 0 0 0Sep 22, 2012 at Chattanooga W 34-17 3 2 10 1 0 1 1 0 1 0 0 0 0Sep 29, 2012 COASTAL CAROLINA W 55-14 6 6 34 4 3 1 2 0 0 0 0 0 0Oct 06, 2012 ELON W 35-23 4 2 14 2 1 1 0 1 0 1 0 0 0Oct 13, 2012 at Samford W 28-25 3 1 7 1 1 0 0 1 1 0 0 0 0Oct 20, 2012 WOFFORD L 28-38 4 2 14 2 2 0 0 1 0 0 0 1 0Oct 27, 2012 at Western Carolina W 38-27 6 5 31 4 2 2 1 0 1 0 0 0 0Nov 03, 2012 at Georgia Southern W 31-28 4 3 17 2 1 1 1 1 0 0 0 0 0Nov 10, 2012 FURMAN W 33-28 7 7 33 3 1 2 4 0 0 0 0 0 0Dec 01, 2012 ILLINOIS STATE L 37-38 5 4 24 3 2 1 1 0 0 0 0 1 0
Totals 51 40 236 29 20 9 11 4 4 1 0 2 040 of 51 (78.4%)
Opponents Inside Appalachian State Red-Zone
Times Times Total Rush Pass FGs Failed to score inside RZ
Date Opponent Score In RZ Scored Pts TDs TDs TDs Made FGA Down Int Fumb Half Game
Sep 01, 2012 at East Carolina L 13-35 4 3 21 3 1 2 0 1 0 0 0 0 0Sep 08, 2012 MONTANA W 35-27 3 3 21 3 1 2 0 0 0 0 0 0 0Sep 15, 2012 THE CITADEL L 28-52 4 4 24 3 3 0 1 0 0 0 0 0 0Sep 22, 2012 at Chattanooga W 34-17 3 3 17 2 0 2 1 0 0 0 0 0 0Sep 29, 2012 COASTAL CAROLINA W 55-14 3 2 14 2 0 2 0 0 0 0 1 0 0Oct 06, 2012 ELON W 35-23 4 2 10 1 0 1 1 1 0 1 0 0 0Oct 13, 2012 at Samford W 28-25 4 4 25 3 2 1 1 0 0 0 0 0 0Oct 20, 2012 WOFFORD L 28-38 6 5 31 4 4 0 1 0 0 0 0 1 0Oct 27, 2012 at Western Carolina W 38-27 1 1 8 1 1 0 0 0 0 0 0 0 0Nov 03, 2012 at Georgia Southern W 31-28 6 3 21 3 3 0 0 3 0 0 0 0 0Nov 10, 2012 FURMAN W 33-28 1 1 7 1 0 1 0 0 0 0 0 0 0Dec 01, 2012 ILLINOIS STATE L 37-38 3 3 17 2 0 2 1 0 0 0 0 0 0
Totals 42 34 216 28 15 13 6 5 0 1 1 1 034 of 42 (81.0%)

2012 Appalachian State FootballAppalachian State Game Superlatives (as of Jan 03, 2013)
All games
INDIVIDUAL GAME HIGHS
Rushes 34 Steven Miller at Western Carolina (Oct 27, 2012)Yards Rushing 245 Steven Miller at Western Carolina (Oct 27, 2012)TD Rushes 3 Steven Miller vs The Citadel (Sep 15, 2012)Long Rush 75 Steven Miller vs Coastal Carolina (Sep 29, 2012)Pass attempts 46 Jamal Jackson vs Wofford (Oct 20, 2012)
46 Jamal Jackson vs Furman (Nov 10, 2012)Pass completions 33 Jamal Jackson vs Illinois State (Dec 01, 2012)Yards Passing 383 Jamal Jackson at Georgia Southern (Nov 03, 2012)TD Passes 4 Jamal Jackson vs Elon (Oct 06, 2012)Long Pass 69 Jamal Jackson vs Coastal Carolina (Sep 29, 2012)Receptions 13 Sean Price vs Illinois State (Dec 01, 2012)Yards Receiving 231 Sean Price at Georgia Southern (Nov 03, 2012)TD Receptions 2 Sean Price at Chattanooga (Sep 22, 2012)
2 Sean Price vs Coastal Carolina (Sep 29, 2012)2 Steven Miller vs Elon (Oct 06, 2012)
Long Reception 69 Sean Price vs Coastal Carolina (Sep 29, 2012)Field Goals 4 Sam Martin vs Furman (Nov 10, 2012)Long Field Goal 47 Sam Martin vs Furman (Nov 10, 2012)Punts 8 Sam Martin vs Montana (Sep 08, 2012)Punting Avg 50.5 Sam Martin vs Furman (Nov 10, 2012)Long Punt 68 Sam Martin vs The Citadel (Sep 15, 2012)Punts inside 20 5 Sam Martin vs Illinois State (Dec 01, 2012)Long Punt Return 26 Tony Washington vs Coastal Carolina (Sep 29, 2012)Long Kickoff Return 99 Tony Washington vs Wofford (Oct 20, 2012)Tackles 17 Jeremy Kimbrough vs Furman (Nov 10, 2012)Sacks 3.0 Adam Scott at Samford (Oct 13, 2012)
3.0 Jeremy Kimbrough at Western Carolina (Oct 27, 2012)Tackles For Loss 3.5 Jeremy Kimbrough at Western Carolina (Oct 27, 2012)
3.5 Jeremy Kimbrough vs Illinois State (Dec 01, 2012)Interceptions 2 Demetrius McCray vs Montana (Sep 08, 2012)

2012 Appalachian State FootballAppalachian State Game Superlatives (as of Jan 03, 2013)
All games
TEAM GAME HIGHS
Rushes 54 at Western Carolina (Oct 27, 2012)Yards Rushing 399 vs Coastal Carolina (Sep 29, 2012)Yards Per Rush 8.1 vs Coastal Carolina (Sep 29, 2012)TD Rushes 4 vs The Citadel (Sep 15, 2012)
4 vs Coastal Carolina (Sep 29, 2012)Pass attempts 47 vs Furman (Nov 10, 2012)Pass completions 34 vs Illinois State (Dec 01, 2012)Yards Passing 383 at Georgia Southern (Nov 03, 2012)
383 vs Illinois State (Dec 01, 2012)Yards Per Pass 11.8 at Western Carolina (Oct 27, 2012)TD Passes 4 vs Elon (Oct 06, 2012)Total Plays 83 vs Furman (Nov 10, 2012)Total Offense 684 vs Coastal Carolina (Sep 29, 2012)Yards Per Play 8.9 vs Coastal Carolina (Sep 29, 2012)Points 55 vs Coastal Carolina (Sep 29, 2012)Sacks By 7 at Western Carolina (Oct 27, 2012)First Downs 33 vs Coastal Carolina (Sep 29, 2012)Penalties 11 at East Carolina (Sep 01, 2012)Penalty Yards 112 vs Coastal Carolina (Sep 29, 2012)Turnovers 3 at East Carolina (Sep 01, 2012)Interceptions By 3 vs Montana (Sep 08, 2012)
3 vs Elon (Oct 06, 2012)Punts 8 vs Montana (Sep 08, 2012)Punting Avg 50.5 vs Furman (Nov 10, 2012)Long Punt 68 vs The Citadel (Sep 15, 2012)Punts inside 20 5 vs Illinois State (Dec 01, 2012)Long Punt Return 26 vs Coastal Carolina (Sep 29, 2012)

2012 Appalachian State FootballAppalachian State Game Superlatives (as of Jan 03, 2013)
All games
OPPONENT INDIVIDUAL GAME HIGHS
Rushes 24 E. Breitenstein, vs Wofford (Oct 20, 2012)Yards Rushing 180 Ben Dupree, vs The Citadel (Sep 15, 2012)TD Rushes 3 W. Banks, at Georgia Southern (Nov 03, 2012)Long Rush 57 Ben Dupree, vs The Citadel (Sep 15, 2012)
57 E. Breitenstein, vs Wofford (Oct 20, 2012)Pass attempts 43 JOHNSON, Rio, at East Carolina (Sep 01, 2012)Pass completions 28 JOHNSON, Rio, at East Carolina (Sep 01, 2012)Yards Passing 419 Thomas Wilson, vs Elon (Oct 06, 2012)TD Passes 5 BROWN,Matt, vs Illinois State (Dec 01, 2012)Long Pass 87 Trent McKinney, vs Montana (Sep 08, 2012)Receptions 13 Aaron Mellette, vs Elon (Oct 06, 2012)Yards Receiving 237 Aaron Mellette, vs Elon (Oct 06, 2012)TD Receptions 3 Aaron Mellette, vs Elon (Oct 06, 2012)Long Reception 87 Dan Moore, vs Montana (Sep 08, 2012)Field Goals 1 Thomas Warren, vs The Citadel (Sep 15, 2012)
1 Nick Pollard, at Chattanooga (Sep 22, 2012)1 Adam Shreiner, vs Elon (Oct 06, 2012)1 Cameron Yaw, at Samford (Oct 13, 2012)1 Kasey Redfern, vs Wofford (Oct 20, 2012)1 AUSSIEKER,Nick, vs Illinois State (Dec 01, 2012)
Long Field Goal 41 AUSSIEKER,Nick, vs Illinois State (Dec 01, 2012)Punts 9 CAIN, Austin, vs Coastal Carolina (Sep 29, 2012)
9 Greg Peranich, at Samford (Oct 13, 2012)Punting Avg 46.7 Greg Peranich, at Samford (Oct 13, 2012)Long Punt 60 Nick Pollard, at Chattanooga (Sep 22, 2012)Punts inside 20 3 Stephen Shaw, vs Montana (Sep 08, 2012)
3 CAIN, Austin, vs Coastal Carolina (Sep 29, 2012)3 Kenton Beal, vs Elon (Oct 06, 2012)3 Kasey Redfern, vs Wofford (Oct 20, 2012)3 Ray Early, vs Furman (Nov 10, 2012)
Long Punt Return 43 HARDY, Justin, at East Carolina (Sep 01, 2012)Long Kickoff Return 100 J. Williams, vs Furman (Nov 10, 2012)Tackles 23 Rock Williams, at Western Carolina (Oct 27, 2012)Sacks 2.0 Colton Keig, vs Furman (Nov 10, 2012)Tackles For Loss 3.0 Aaron Bethune, at Samford (Oct 13, 2012)Interceptions 1 IVEY, Lamar, at East Carolina (Sep 01, 2012)
1 Carson Smith, vs The Citadel (Sep 15, 2012)1 Chaz Moore, at Chattanooga (Sep 22, 2012)1 HOUSTON, J., vs Coastal Carolina (Sep 29, 2012)1 Miles Williams, vs Elon (Oct 06, 2012)1 Jaquiski Tartt, at Samford (Oct 13, 2012)1 Mike McCrimon, vs Wofford (Oct 20, 2012)1 THOMPSON,Ezra, vs Illinois State (Dec 01, 2012)
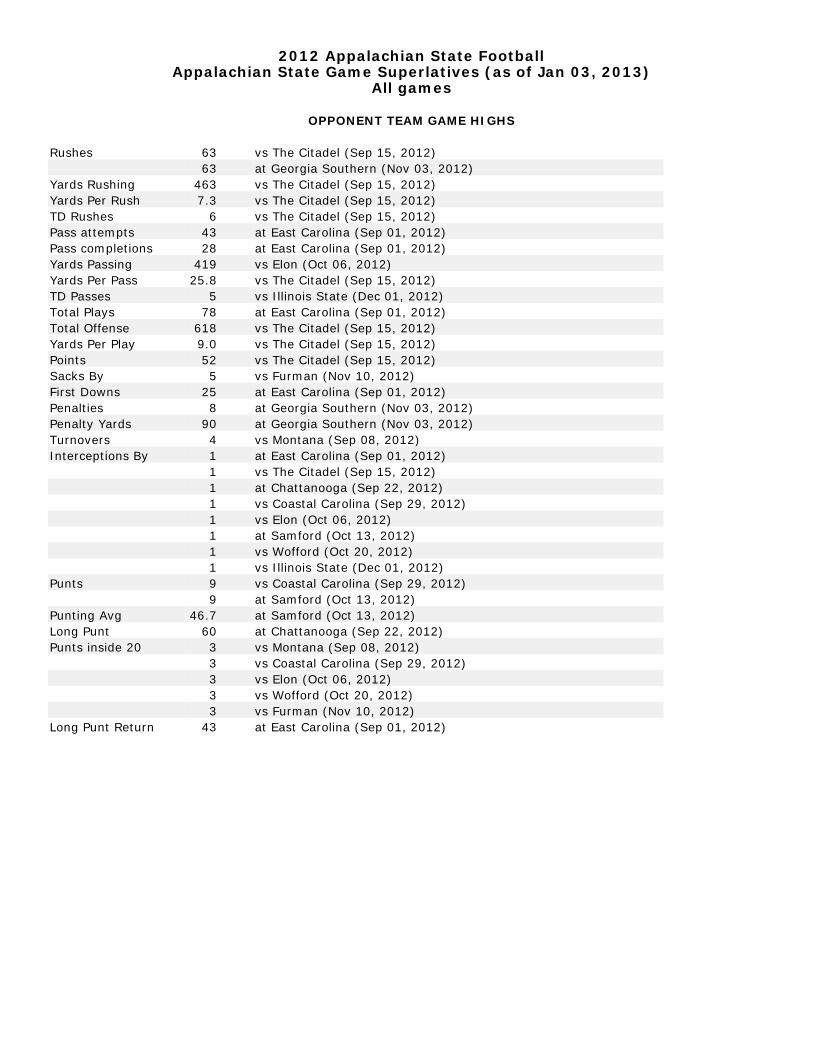
2012 Appalachian State FootballAppalachian State Game Superlatives (as of Jan 03, 2013)
All games
OPPONENT TEAM GAME HIGHS
Rushes 63 vs The Citadel (Sep 15, 2012)63 at Georgia Southern (Nov 03, 2012)
Yards Rushing 463 vs The Citadel (Sep 15, 2012)Yards Per Rush 7.3 vs The Citadel (Sep 15, 2012)TD Rushes 6 vs The Citadel (Sep 15, 2012)Pass attempts 43 at East Carolina (Sep 01, 2012)Pass completions 28 at East Carolina (Sep 01, 2012)Yards Passing 419 vs Elon (Oct 06, 2012)Yards Per Pass 25.8 vs The Citadel (Sep 15, 2012)TD Passes 5 vs Illinois State (Dec 01, 2012)Total Plays 78 at East Carolina (Sep 01, 2012)Total Offense 618 vs The Citadel (Sep 15, 2012)Yards Per Play 9.0 vs The Citadel (Sep 15, 2012)Points 52 vs The Citadel (Sep 15, 2012)Sacks By 5 vs Furman (Nov 10, 2012)First Downs 25 at East Carolina (Sep 01, 2012)Penalties 8 at Georgia Southern (Nov 03, 2012)Penalty Yards 90 at Georgia Southern (Nov 03, 2012)Turnovers 4 vs Montana (Sep 08, 2012)Interceptions By 1 at East Carolina (Sep 01, 2012)
1 vs The Citadel (Sep 15, 2012)1 at Chattanooga (Sep 22, 2012)1 vs Coastal Carolina (Sep 29, 2012)1 vs Elon (Oct 06, 2012)1 at Samford (Oct 13, 2012)1 vs Wofford (Oct 20, 2012)1 vs Illinois State (Dec 01, 2012)
Punts 9 vs Coastal Carolina (Sep 29, 2012)9 at Samford (Oct 13, 2012)
Punting Avg 46.7 at Samford (Oct 13, 2012)Long Punt 60 at Chattanooga (Sep 22, 2012)Punts inside 20 3 vs Montana (Sep 08, 2012)
3 vs Coastal Carolina (Sep 29, 2012)3 vs Elon (Oct 06, 2012)3 vs Wofford (Oct 20, 2012)3 vs Furman (Nov 10, 2012)
Long Punt Return 43 at East Carolina (Sep 01, 2012)