Galveston County Condo Townhome Sales Report
21
Bulman Real Estate 2600 South Shore Blvd #300 League City, TX. 77573 281.450.8689 [email protected] Market Report – Condos / Townhomes Galveston County, Texas 1 November 2014 JEFF BULMAN, BROKER / OWNER $200,000,000 in real estate sales Degree in Real Estate Certified Residential Specialist Corporate Relocation Specialist Member of the Institute for Luxury Home Marketing Member of the National Association of Realtors Member of the Texas Association of Realtors Member of the Houston Association of Realtors
-
Upload
jeff-bulman -
Category
Real Estate
-
view
47 -
download
0
Transcript of Galveston County Condo Townhome Sales Report

Bulman Real Estate 2600 South Shore Blvd #300 League City, TX. 77573 281.450.8689 [email protected]
Market Report – Condos / Townhomes
Galveston*County,*Texas*1*November 2014
JEFF BULMAN, BROKER / OWNER $200,000,000 in real estate sales
Degree in Real Estate Certified Residential Specialist
Corporate Relocation Specialist Member of the Institute for Luxury Home Marketing
Member of the National Association of Realtors Member of the Texas Association of Realtors
Member of the Houston Association of Realtors

1RY�����107,500
1RY�����124,350
�-14
&KDQJH-16,850
Nov-2013 vs Nov-2014: The median sold price is down -14%Median Sold Price by Month
Bulman Real Estate | 281.450.8689
Nov-2013 vs. Nov-2014
Jeff Bulman
&ODUXV�0DUNHW0HWULFV� 12/12/2014Information not guaranteed. © 2014 - 2015 Terradatum and its suppliers and licensors (www.terradatum.com/about/partners).
1/2
MLS: HAR Bedrooms:AllAll
Construction Type:All1 Year Monthly SqFt:
Bathrooms: Lot Size:All All Square FootagePeriod:All
Counties:Property Types: : Townhouse/Condo
GalvestonPrice:

Median Sold Price by MonthNov-2013 vs Nov-2014: The median sold price is down -14%
Bulman Real Estate | 281.450.8689Jeff Bulman
Sold Median Price Units Avg DOMTime Period
Nov-14 107,500 24 81
Oct-14 104,950 30 77
Sep-14 120,000 33 79
Aug-14 129,400 41 84
Jul-14 98,000 36 105
Jun-14 98,200 42 66
May-14 110,750 36 70
Apr-14 102,000 39 82
Mar-14 105,000 29 95
Feb-14 93,250 18 120
Jan-14 82,800 23 103
Dec-13 118,500 13 99
Nov-13 124,350 18 71
&ODUXV�0DUNHW0HWULFV� 12/12/2014Information not guaranteed. © 2014 - 2015 Terradatum and its suppliers and licensors (www.terradatum.com/about/partners).
22/

Nov-2013 vs Nov-2014: The median price of for sale properties is up 18% and the median price of sold properties is down -14%
Bulman Real Estate | 281.450.8689
Nov-2013 vs. Nov-2014
110,000 18
Jeff Bulman
129,9501RY�����
Median For Sale vs Median Sold
&KDQJH1RY����� �19,950
1RY����� 1RY����� �124,350 -14
Nov-2013 vs. Nov-2014
107,500&KDQJH-16,850
&ODUXV�0DUNHW0HWULFV� 12/12/2014Information not guaranteed. © 2014 - 2015 Terradatum and its suppliers and licensors (www.terradatum.com/about/partners).
1/2
MLS: HAR Bedrooms:AllAll
Construction Type:All1 Year Monthly SqFt:
Bathrooms: Lot Size:All All Square FootagePeriod:All
Counties:Property Types: : Townhouse/Condo
GalvestonPrice:
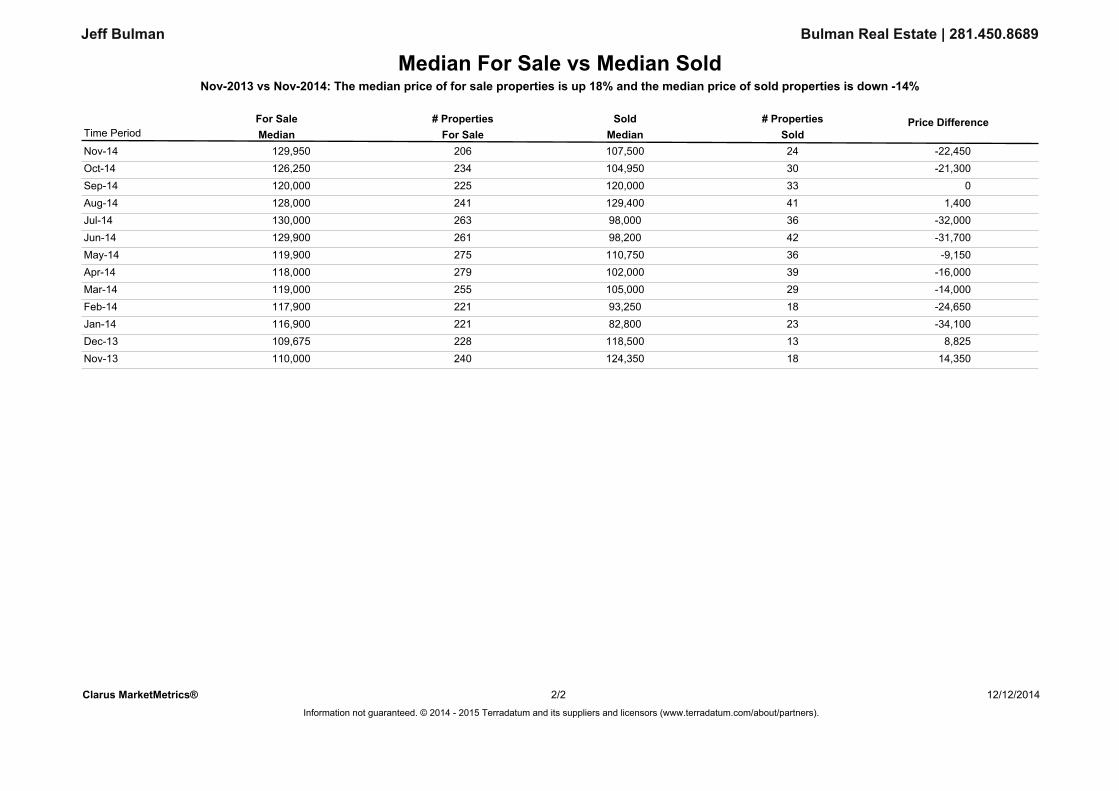
Median For Sale vs Median SoldNov-2013 vs Nov-2014: The median price of for sale properties is up 18% and the median price of sold properties is down -14%
Bulman Real Estate | 281.450.8689Jeff Bulman
For SaleMedian SoldMedianFor Sale # Properties # PropertiesSold Price Difference
Time Period
Nov-14 206 24129,950 107,500 -22,450Oct-14 234 30126,250 104,950 -21,300Sep-14 225 33120,000 120,000 0Aug-14 241 41128,000 129,400 1,400Jul-14 263 36130,000 98,000 -32,000Jun-14 261 42129,900 98,200 -31,700May-14 275 36119,900 110,750 -9,150Apr-14 279 39118,000 102,000 -16,000Mar-14 255 29119,000 105,000 -14,000Feb-14 221 18117,900 93,250 -24,650Jan-14 221 23116,900 82,800 -34,100Dec-13 228 13109,675 118,500 8,825Nov-13 240 18110,000 124,350 14,350
&ODUXV�0DUNHW0HWULFV�Information not guaranteed. © 2014 - 2015 Terradatum and its suppliers and licensors (www.terradatum.com/about/partners).
12/12/201422/

1RY�����24
1RY�����18
�33
&KDQJH6
Nov-2013 vs Nov-2014: The number of Sold properties is up 33%Sold Properties by Month
Bulman Real Estate | 281.450.8689
Nov-2013 vs. Nov-2014
Jeff Bulman
&ODUXV�0DUNHW0HWULFV� 12/12/2014Information not guaranteed. © 2014 - 2015 Terradatum and its suppliers and licensors (www.terradatum.com/about/partners).
1/2
MLS: HAR Bedrooms:AllAll
Construction Type:All1 Year Monthly SqFt:
Bathrooms: Lot Size:All All Square FootagePeriod:All
Counties:Property Types: : Townhouse/Condo
GalvestonPrice:

Sold Properties by MonthNov-2013 vs Nov-2014: The number of Sold properties is up 33%
Bulman Real Estate | 281.450.8689Jeff Bulman
Time Period
Full Market
Units Median Price Avg DOM
Bank Properties
Units % Bank Median Price
Non-Bank Properties
Units % Non-Bank Median PriceNov-14 107,50024 81 1 4.2 82,000 23 95.8 110,000
Oct-14 104,95030 77 0 0.0 30 100.0 104,950
Sep-14 120,00033 79 1 3.0 170,000 32 97.0 115,650
Aug-14 129,40041 84 1 2.4 165,000 40 97.6 125,700
Jul-14 98,00036 105 1 2.8 130,000 35 97.2 96,000
Jun-14 98,20042 66 2 4.8 73,200 40 95.2 98,200
May-14 110,75036 70 0 0.0 36 100.0 110,750
Apr-14 102,00039 82 2 5.1 114,500 37 94.9 102,000
Mar-14 105,00029 95 0 0.0 29 100.0 105,000
Feb-14 93,25018 120 1 5.6 138,500 17 94.4 93,000
Jan-14 82,80023 103 4 17.4 99,528 19 82.6 82,500
Dec-13 118,50013 99 1 7.7 85,000 12 92.3 119,200
Nov-13 124,35018 71 1 5.6 101,543 17 94.4 128,800
&ODUXV�0DUNHW0HWULFV� 12/12/2014Information not guaranteed. © 2014 - 2015 Terradatum and its suppliers and licensors (www.terradatum.com/about/partners).
22/

1RY�����26
1RY�����13
�100
&KDQJH13
Nov-2013 vs Nov-2014: The number of Under Contract properties is up 100%Under Contract Properties by Month
Bulman Real Estate | 281.450.8689
Nov-2013 vs. Nov-2014
Jeff Bulman
&ODUXV�0DUNHW0HWULFV� 12/12/2014Information not guaranteed. © 2014 - 2015 Terradatum and its suppliers and licensors (www.terradatum.com/about/partners).
1/2
AllBathrooms: SqFt:All
: Townhouse/Condo
All Square FootageConstruction Type: Lot Size:HAR
Galveston
Period: 1 Year MonthlyPrice:MLS:
All AllAll
Property Types:
Bedrooms:
Counties:

Under Contract Properties by MonthNov-2013 vs Nov-2014: The number of Under Contract properties is up 100%
Bulman Real Estate | 281.450.8689Jeff Bulman
Median Price UnitsUnits Median Price% Non-Bank
Full Market
% BankAvg DOMMedian Price
Bank Properties
Units
Non-Bank Properties
Time PeriodNov-14 131,65026 101 131,650100.0260.00Oct-14 93,50028 78 94,00096.42789,9003.61Sep-14 110,00022 91 110,000100.0220.00Aug-14 124,90031 70 124,900100.0310.00Jul-14 126,50046 87 126,500100.0460.00Jun-14 112,19536 107 111,99097.235127,9002.81May-14 89,75046 66 87,95091.342144,4508.74Apr-14 134,90040 74 134,900100.0400.00Mar-14 92,50028 69 97,50096.42746,9003.61Feb-14 133,00023 64 129,00095.722175,0004.31Jan-14 84,50027 132 84,75096.32649,9003.71Dec-13 101,20021 77 97,00090.519123,1009.52Nov-13 125,00013 119 127,00092.312120,0007.71
&ODUXV�0DUNHW0HWULFV� 12/12/2014Information not guaranteed. © 2014 - 2015 Terradatum and its suppliers and licensors (www.terradatum.com/about/partners).
22/

1RY�����27
1RY�����28
�-4
&KDQJH-1
Nov-2013 vs Nov-2014: The number of New properties is down -4%New Properties by Month
Bulman Real Estate | 281.450.8689
Nov-2013 vs. Nov-2014
Jeff Bulman
&ODUXV�0DUNHW0HWULFV� 12/12/2014Information not guaranteed. © 2014 - 2015 Terradatum and its suppliers and licensors (www.terradatum.com/about/partners).
1/2
MLS: HAR Bedrooms:AllAll
Construction Type:All1 Year Monthly SqFt:
Bathrooms: Lot Size:All All Square FootagePeriod:All
Counties:Property Types: : Townhouse/Condo
GalvestonPrice:

New Properties by MonthNov-2013 vs Nov-2014: The number of New properties is down -4%
Bulman Real Estate | 281.450.8689Jeff Bulman
Median Price UnitsUnits Median Price% Non-Bank
Full Market
% BankMedian Price
Bank Properties
Units
Non-Bank Properties
Time PeriodNov-14 119,00027 0 0.0 27 100.0 119,000Oct-14 125,00053 0 0.0 53 100.0 125,000Sep-14 109,90035 2 5.7 62,400 33 94.3 118,000Aug-14 119,50039 0 0.0 39 100.0 119,500Jul-14 100,00063 0 0.0 63 100.0 100,000Jun-14 148,99159 1 1.7 89,900 58 98.3 148,995May-14 140,33056 0 0.0 56 100.0 140,330Apr-14 108,90073 0 0.0 73 100.0 108,900Mar-14 119,90075 1 1.3 127,900 74 98.7 119,900Feb-14 90,00050 4 8.0 73,400 46 92.0 90,000Jan-14 140,00041 1 2.4 113,900 40 97.6 143,888Dec-13 116,75032 1 3.1 145,000 31 96.9 109,000Nov-13 92,50028 1 3.6 175,000 27 96.4 89,500
&ODUXV�0DUNHW0HWULFV� 12/12/2014Information not guaranteed. © 2014 - 2015 Terradatum and its suppliers and licensors (www.terradatum.com/about/partners).
22/

1RY�����206
1RY�����240
�-14
&KDQJH-34
Nov-2013 vs Nov-2014: The number of For Sale properties is down -14%For Sale Properties by Month
Bulman Real Estate | 281.450.8689
Nov-2013 vs. Nov-2014
Jeff Bulman
&ODUXV�0DUNHW0HWULFV� 12/12/2014Information not guaranteed. © 2014 - 2015 Terradatum and its suppliers and licensors (www.terradatum.com/about/partners).
1/2
MLS: HAR Bedrooms:AllAll
Construction Type:All1 Year Monthly SqFt:
Bathrooms: Lot Size:All All Square FootagePeriod:All
Counties:Property Types: : Townhouse/Condo
GalvestonPrice:
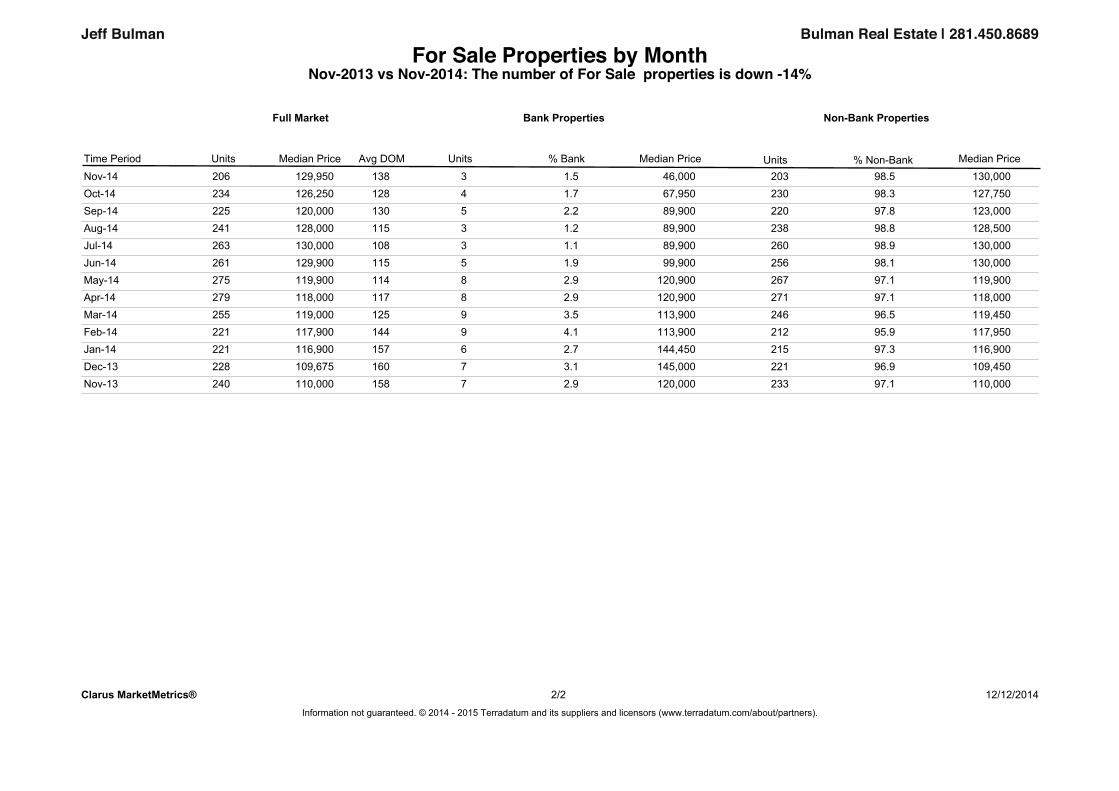
For Sale Properties by MonthNov-2013 vs Nov-2014: The number of For Sale properties is down -14%
Bulman Real Estate | 281.450.8689Jeff Bulman
Median Price UnitsUnits Median Price% Non-Bank
Full Market
% BankAvg DOMMedian Price
Bank Properties
Units
Non-Bank Properties
Time PeriodNov-14 129,950206 138 3 1.5 46,000 203 98.5 130,000Oct-14 126,250234 128 4 1.7 67,950 230 98.3 127,750Sep-14 120,000225 130 5 2.2 89,900 220 97.8 123,000Aug-14 128,000241 115 3 1.2 89,900 238 98.8 128,500Jul-14 130,000263 108 3 1.1 89,900 260 98.9 130,000Jun-14 129,900261 115 5 1.9 99,900 256 98.1 130,000May-14 119,900275 114 8 2.9 120,900 267 97.1 119,900Apr-14 118,000279 117 8 2.9 120,900 271 97.1 118,000Mar-14 119,000255 125 9 3.5 113,900 246 96.5 119,450Feb-14 117,900221 144 9 4.1 113,900 212 95.9 117,950Jan-14 116,900221 157 6 2.7 144,450 215 97.3 116,900Dec-13 109,675228 160 7 3.1 145,000 221 96.9 109,450Nov-13 110,000240 158 7 2.9 120,000 233 97.1 110,000
&ODUXV�0DUNHW0HWULFV� 12/12/2014Information not guaranteed. © 2014 - 2015 Terradatum and its suppliers and licensors (www.terradatum.com/about/partners).
22/

1RY�����15
1RY�����31
�-52
&KDQJH-16
Nov-2013 vs Nov-2014: The number of Expired properties is down -52%Expired Properties by Month
Bulman Real Estate | 281.450.8689
Nov-2013 vs. Nov-2014
Jeff Bulman
12/12/2014&ODUXV�0DUNHW0HWULFV� 1/2
MLS: HAR Bedrooms:AllAll
Construction Type:All1 Year Monthly SqFt:
Bathrooms: Lot Size:All All Square FootagePeriod:All
Counties:Property Types: : Townhouse/Condo
GalvestonPrice:

Expired Properties by MonthNov-2013 vs Nov-2014: The number of Expired properties is down -52%
Bulman Real Estate | 281.450.8689Jeff Bulman
Median Price Units% BankAvg DOMUnits Median Price
Bank Properties
Units
Non-Bank Properties
% Non-Bank Median Price
Full Market
Nov-14 134,50015 182 0 0.0 15 100.0 134,500Oct-14 89,90027 129 0 0.0 27 100.0 89,900Sep-14 81,67522 113 1 4.5 89,900 21 95.5 79,500Aug-14 128,75020 77 0 0.0 20 100.0 128,750Jul-14 152,00015 152 0 0.0 15 100.0 152,000Jun-14 93,50025 140 1 4.0 99,900 24 96.0 86,725May-14 154,90027 83 0 0.0 27 100.0 154,900Apr-14 137,50020 156 0 0.0 20 100.0 137,500Mar-14 109,00021 162 0 0.0 21 100.0 109,000Feb-14 113,00018 153 0 0.0 18 100.0 113,000Jan-14 79,90023 116 0 0.0 23 100.0 79,900Dec-13 114,90027 126 0 0.0 27 100.0 114,900Nov-13 125,00031 149 0 0.0 31 100.0 125,000
&ODUXV�0DUNHW0HWULFV� 12/12/2014Information not guaranteed. © 2014 - 2015 Terradatum and its suppliers and licensors (www.terradatum.com/about/partners).
22/

Nov-2013 vs Nov-2014: The number of for sale properties is down -14% and the number of sold properties is up 33%
Bulman Real Estate | 281.450.8689
Nov-2013 vs. Nov-2014
240 -14
Jeff Bulman
2061RY�����
Supply & Demand by Month
&KDQJH1RY����� �-34
1RY����� 1RY����� �18 33
Nov-2013 vs. Nov-2014
24&KDQJH
6
&ODUXV�0DUNHW0HWULFV� 12/12/2014Information not guaranteed. © 2014 - 2015 Terradatum and its suppliers and licensors (www.terradatum.com/about/partners).
1/2
MLS: HAR Bedrooms:AllAll
Construction Type:All1 Year Monthly SqFt:
Bathrooms: Lot Size:All All Square FootagePeriod:All
Counties:Property Types: : Townhouse/Condo
GalvestonPrice:

Supply & Demand by MonthNov-2013 vs Nov-2014: The number of for sale properties is down -14% and the number of sold properties is up 33%
Jeff Bulman Bulman Real Estate | 281.450.8689
For Sale Sold# Properties
Avg DOM Avg DOM# Properties
Time Period
Nov-14 138 81206 24Oct-14 128 77234 30Sep-14 130 79225 33Aug-14 115 84241 41Jul-14 108 105263 36Jun-14 115 66261 42May-14 114 70275 36Apr-14 117 82279 39Mar-14 125 95255 29Feb-14 144 120221 18Jan-14 157 103221 23Dec-13 160 99228 13Nov-13 158 71240 18
&ODUXV�0DUNHW0HWULFV� 12/12/2014Information not guaranteed. © 2014 - 2015 Terradatum and its suppliers and licensors (www.terradatum.com/about/partners).
22/

1RY�����101
1RY�����119
�-15
&KDQJH-18
Nov-2013 vs Nov-2014: The average days on market is down -15%The Average Days on Market by Month
Bulman Real Estate | 281.450.8689
Nov-2013 vs. Nov-2014
Jeff Bulman
GalvestonAll 1 Year Monthly
Counties:Period:Price:
Property Types: : Townhouse/Condo
12/12/20141/2&ODUXV�0DUNHW0HWULFV�
All Square FootageBedrooms: All AllSqFt:
All Lot Size:Bathrooms:AllConstruction Type:MLS: HAR

The Average Days on Market by MonthNov-2013 vs Nov-2014: The average days on market is down -15%
Bulman Real Estate | 281.450.8689Jeff Bulman
# UC UnitsAvg DOMTime PeriodNov-14 26101Oct-14 2878Sep-14 2291Aug-14 3170Jul-14 4687Jun-14 36107May-14 4666Apr-14 4074Mar-14 2869Feb-14 2364Jan-14 27132Dec-13 2177Nov-13 13119
&ODUXV�0DUNHW0HWULFV� 2/2 12/12/2014Information not guaranteed. © 2014 - 2015 Terradatum and its suppliers and licensors (www.terradatum.com/about/partners).

Nov-2013 vs Nov-2014: The average months supply of inventory is down -58.0%
Bulman Real Estate | 281.450.8689
Nov-2013 vs. Nov-2014
15.1 -58.0
Jeff Bulman
6.31RY�����
Months Supply of Inventory
&KDQJH1RY����� �-8.7
&ODUXV�0DUNHW0HWULFV� 12/12/2014Information not guaranteed. © 2014 - 2015 Terradatum and its suppliers and licensors (www.terradatum.com/about/partners).
1/2
MLS: HAR Bedrooms:AllAll
Construction Type:All1 Year Monthly SqFt:
Bathrooms: Lot Size:All All Square FootagePeriod:All
Counties:Property Types: : Townhouse/Condo
GalvestonPrice:
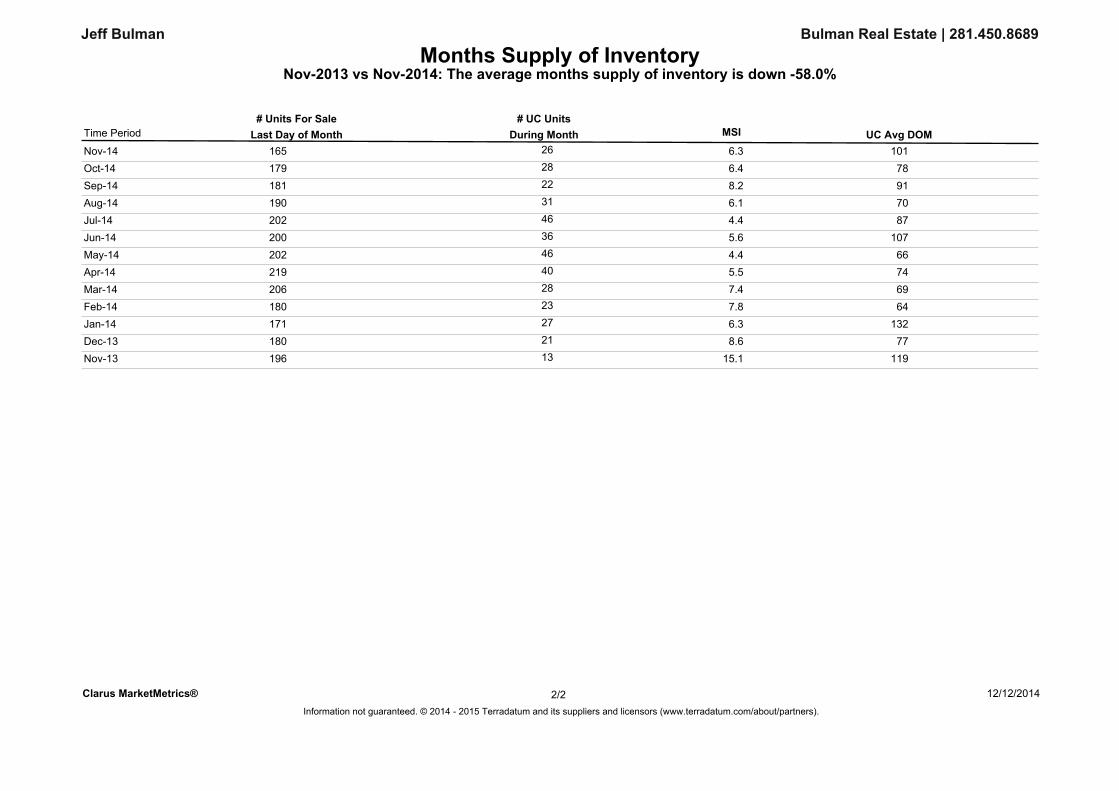
Months Supply of InventoryNov-2013 vs Nov-2014: The average months supply of inventory is down -58.0%
Jeff Bulman Bulman Real Estate | 281.450.8689
During MonthLast Day of Month MSI# Units For Sale # UC Units
UC Avg DOMTime Period
Nov-14 26 101165 6.3Oct-14 28 78179 6.4Sep-14 22 91181 8.2Aug-14 31 70190 6.1Jul-14 46 87202 4.4Jun-14 36 107200 5.6May-14 46 66202 4.4Apr-14 40 74219 5.5Mar-14 28 69206 7.4Feb-14 23 64180 7.8Jan-14 27 132171 6.3Dec-13 21 77180 8.6Nov-13 13 119196 15.1
&ODUXV�0DUNHW0HWULFV� 12/12/2014Information not guaranteed. © 2014 - 2015 Terradatum and its suppliers and licensors (www.terradatum.com/about/partners).
22/