
National wire impex show | Manufacturer and Exporter of Galvanized Stitching Wires

U.S. International Trade CommissionPublication 4234 May 2011
Washington, DC 20436
Galvanized Steel Wire from China and Mexico
Investigation Nos. 701-TA-479 and 731-TA-1183-1184 (Preliminary)

U.S. International Trade Commission
COMMISSIONERS
Deanna Tanner Okun, Chairman Irving A. Williamson, Vice Chairman
Charlotte R. Lane Daniel R. Pearson Shara L. Aranoff Dean A. Pinkert
Karen Laney
Staff assigned
Address all communications to Secretary to the Commission
United States International Trade Commission Washington, DC 20436
Acting Director of Operations
Angela M.W. Newell, Investigator Jeremy Wise, Industry Analyst
James Fetzer, Economist Samantha Warrington, Economist
Justin Jee, Accountant Michael Haldenstein, Attorney
Douglas Corkran, Supervisory InvestigatorSpecial assistance from
Darlene Smith, Statistician

U.S. International Trade CommissionWashington, DC 20436
www.usitc.gov
Publication 4234 May 2011
Galvanized Steel Wire from China and Mexico
Investigation Nos. 701-TA-479 and 731-TA-1183-1184 (Preliminary)


CONTENTS
Page
Determinations . . . . . . . . . . . . . . . . . . . . . . . . . . . . . . . . . . . . . . . . . . . . . . . . . . . . . . . . . . . . . . . . . 1Views of the Commission . . . . . . . . . . . . . . . . . . . . . . . . . . . . . . . . . . . . . . . . . . . . . . . . . . . . . . . . . 3
Part I: Introduction . . . . . . . . . . . . . . . . . . . . . . . . . . . . . . . . . . . . . . . . . . . . . . . . . . . . . . . . . . . . I-1Background . . . . . . . . . . . . . . . . . . . . . . . . . . . . . . . . . . . . . . . . . . . . . . . . . . . . . . . . . . . . . . . . . . I-1Statutory criteria and organization of the report . . . . . . . . . . . . . . . . . . . . . . . . . . . . . . . . . . . . . . I-1
Statutory criteria . . . . . . . . . . . . . . . . . . . . . . . . . . . . . . . . . . . . . . . . . . . . . . . . . . . . . . . . . . . I-1Organization of the report . . . . . . . . . . . . . . . . . . . . . . . . . . . . . . . . . . . . . . . . . . . . . . . . . . . . I-2
U.S. market summary . . . . . . . . . . . . . . . . . . . . . . . . . . . . . . . . . . . . . . . . . . . . . . . . . . . . . . . . . . I-2Summary data and data sources . . . . . . . . . . . . . . . . . . . . . . . . . . . . . . . . . . . . . . . . . . . . . . . . . . I-3Previous and related investigations . . . . . . . . . . . . . . . . . . . . . . . . . . . . . . . . . . . . . . . . . . . . . . . . I-3Nature and extent of alleged subsidies and sales at LTFV . . . . . . . . . . . . . . . . . . . . . . . . . . . . . . I-3
Alleged subsidies . . . . . . . . . . . . . . . . . . . . . . . . . . . . . . . . . . . . . . . . . . . . . . . . . . . . . . . . . . . I-3Alleged sales at LTFV . . . . . . . . . . . . . . . . . . . . . . . . . . . . . . . . . . . . . . . . . . . . . . . . . . . . . . . I-4
The subject merchandise . . . . . . . . . . . . . . . . . . . . . . . . . . . . . . . . . . . . . . . . . . . . . . . . . . . . . . . . I-4Commerce’s scope . . . . . . . . . . . . . . . . . . . . . . . . . . . . . . . . . . . . . . . . . . . . . . . . . . . . . . . . . . I-4Tariff treatment . . . . . . . . . . . . . . . . . . . . . . . . . . . . . . . . . . . . . . . . . . . . . . . . . . . . . . . . . . . . I-5
The product . . . . . . . . . . . . . . . . . . . . . . . . . . . . . . . . . . . . . . . . . . . . . . . . . . . . . . . . . . . . . . . . . . I-6Description and applications . . . . . . . . . . . . . . . . . . . . . . . . . . . . . . . . . . . . . . . . . . . . . . . . . . . . . I-6Manufacturing processes . . . . . . . . . . . . . . . . . . . . . . . . . . . . . . . . . . . . . . . . . . . . . . . . . . . . . . . . I-6
Domestic like product issues . . . . . . . . . . . . . . . . . . . . . . . . . . . . . . . . . . . . . . . . . . . . . . . . . . . . I-8
Part II: Conditions of competition in the U.S. market . . . . . . . . . . . . . . . . . . . . . . . . . . . . . . . . II-1Market characteristics . . . . . . . . . . . . . . . . . . . . . . . . . . . . . . . . . . . . . . . . . . . . . . . . . . . . . . . . . . II-1Channels of distribution . . . . . . . . . . . . . . . . . . . . . . . . . . . . . . . . . . . . . . . . . . . . . . . . . . . . . . . . II-1Supply and demand considerations . . . . . . . . . . . . . . . . . . . . . . . . . . . . . . . . . . . . . . . . . . . . . . . . II-1
U.S. supply . . . . . . . . . . . . . . . . . . . . . . . . . . . . . . . . . . . . . . . . . . . . . . . . . . . . . . . . . . . . . . . II-1U.S. demand . . . . . . . . . . . . . . . . . . . . . . . . . . . . . . . . . . . . . . . . . . . . . . . . . . . . . . . . . . . . . . II-5
Substitutability issues . . . . . . . . . . . . . . . . . . . . . . . . . . . . . . . . . . . . . . . . . . . . . . . . . . . . . . . . . . II-8Factors affecting purchasing decisions . . . . . . . . . . . . . . . . . . . . . . . . . . . . . . . . . . . . . . . . . . II-8Comparison of U.S.-produced and imported products . . . . . . . . . . . . . . . . . . . . . . . . . . . . . . II-8
i

CONTENTS
Page
Part III: U.S. producers’ production, shipments, and employment . . . . . . . . . . . . . . . . . . . . . . III-1U.S. producers . . . . . . . . . . . . . . . . . . . . . . . . . . . . . . . . . . . . . . . . . . . . . . . . . . . . . . . . . . . . . . . III-1U.S. capacity, production, and capacity utilization . . . . . . . . . . . . . . . . . . . . . . . . . . . . . . . . . . . III-3U.S. producers’ shipments . . . . . . . . . . . . . . . . . . . . . . . . . . . . . . . . . . . . . . . . . . . . . . . . . . . . . . III-3Captive consumption . . . . . . . . . . . . . . . . . . . . . . . . . . . . . . . . . . . . . . . . . . . . . . . . . . . . . . . . . . III-5
Transfer and sale of significant production of the domestic like product . . . . . . . . . . . . . . . . III-5The first statutory criterion . . . . . . . . . . . . . . . . . . . . . . . . . . . . . . . . . . . . . . . . . . . . . . . . . . . III-5The second statutory criterion . . . . . . . . . . . . . . . . . . . . . . . . . . . . . . . . . . . . . . . . . . . . . . . . . III-6The third statutory criterion . . . . . . . . . . . . . . . . . . . . . . . . . . . . . . . . . . . . . . . . . . . . . . . . . . . III-6
U.S. producers’ inventories . . . . . . . . . . . . . . . . . . . . . . . . . . . . . . . . . . . . . . . . . . . . . . . . . . . . . III-7U.S. producers’ imports and purchases . . . . . . . . . . . . . . . . . . . . . . . . . . . . . . . . . . . . . . . . . . . . . III-7U.S. employment, wages, and productivity . . . . . . . . . . . . . . . . . . . . . . . . . . . . . . . . . . . . . . . . . III-7
Part IV: U.S. imports, apparent U.S. consumption, and market shares . . . . . . . . . . . . . . . . . . IV-1U.S. importers . . . . . . . . . . . . . . . . . . . . . . . . . . . . . . . . . . . . . . . . . . . . . . . . . . . . . . . . . . . . . . . . IV-1U.S. imports . . . . . . . . . . . . . . . . . . . . . . . . . . . . . . . . . . . . . . . . . . . . . . . . . . . . . . . . . . . . . . . . . IV-2Cumulation considerations . . . . . . . . . . . . . . . . . . . . . . . . . . . . . . . . . . . . . . . . . . . . . . . . . . . . . . IV-4
Geographic markets . . . . . . . . . . . . . . . . . . . . . . . . . . . . . . . . . . . . . . . . . . . . . . . . . . . . . . . . . IV-4Presence in the market . . . . . . . . . . . . . . . . . . . . . . . . . . . . . . . . . . . . . . . . . . . . . . . . . . . . . . . IV-4
Negligibility . . . . . . . . . . . . . . . . . . . . . . . . . . . . . . . . . . . . . . . . . . . . . . . . . . . . . . . . . . . . . . . . . IV-4Apparent U.S. consumption . . . . . . . . . . . . . . . . . . . . . . . . . . . . . . . . . . . . . . . . . . . . . . . . . . . . . IV-5U.S. market shares . . . . . . . . . . . . . . . . . . . . . . . . . . . . . . . . . . . . . . . . . . . . . . . . . . . . . . . . . . . . IV-6Ratio of imports to U.S. production . . . . . . . . . . . . . . . . . . . . . . . . . . . . . . . . . . . . . . . . . . . . . . . IV-7
Part V: Pricing and related information . . . . . . . . . . . . . . . . . . . . . . . . . . . . . . . . . . . . . . . . . . . . V-1Factors affecting pricing . . . . . . . . . . . . . . . . . . . . . . . . . . . . . . . . . . . . . . . . . . . . . . . . . . . . . . . . V-1
Raw material costs . . . . . . . . . . . . . . . . . . . . . . . . . . . . . . . . . . . . . . . . . . . . . . . . . . . . . . . . . . V-1U.S. inland transportation costs . . . . . . . . . . . . . . . . . . . . . . . . . . . . . . . . . . . . . . . . . . . . . . . . V-1
Pricing practices . . . . . . . . . . . . . . . . . . . . . . . . . . . . . . . . . . . . . . . . . . . . . . . . . . . . . . . . . . . . . . V-1Price data . . . . . . . . . . . . . . . . . . . . . . . . . . . . . . . . . . . . . . . . . . . . . . . . . . . . . . . . . . . . . . . . . . . V-3
Price trends . . . . . . . . . . . . . . . . . . . . . . . . . . . . . . . . . . . . . . . . . . . . . . . . . . . . . . . . . . . . . . . V-4Price comparisons . . . . . . . . . . . . . . . . . . . . . . . . . . . . . . . . . . . . . . . . . . . . . . . . . . . . . . . . . . V-4
Lost revenues and lost sales . . . . . . . . . . . . . . . . . . . . . . . . . . . . . . . . . . . . . . . . . . . . . . . . . . . . . V-7
Part VI: Financial condition of U.S. producers . . . . . . . . . . . . . . . . . . . . . . . . . . . . . . . . . . . . . . VI-1Background . . . . . . . . . . . . . . . . . . . . . . . . . . . . . . . . . . . . . . . . . . . . . . . . . . . . . . . . . . . . . . . . . . VI-1Operations on galvanized steel wire . . . . . . . . . . . . . . . . . . . . . . . . . . . . . . . . . . . . . . . . . . . . . . . VI-1Capital expenditures and research and development expenses . . . . . . . . . . . . . . . . . . . . . . . . . . . VI-6Assets and return on investment . . . . . . . . . . . . . . . . . . . . . . . . . . . . . . . . . . . . . . . . . . . . . . . . . . VI-6Capital and investment . . . . . . . . . . . . . . . . . . . . . . . . . . . . . . . . . . . . . . . . . . . . . . . . . . . . . . . . . VI-7
ii

CONTENTS
Page
Part VII: Threat considerations and information on nonsubject countries . . . . . . . . . . . . . . . VII-1The industry in China . . . . . . . . . . . . . . . . . . . . . . . . . . . . . . . . . . . . . . . . . . . . . . . . . . . . . . . . . . VII-1
Overview . . . . . . . . . . . . . . . . . . . . . . . . . . . . . . . . . . . . . . . . . . . . . . . . . . . . . . . . . . . . . . . . . VII-1Operations on galvanized steel wire . . . . . . . . . . . . . . . . . . . . . . . . . . . . . . . . . . . . . . . . . . . . VII-1
The industry in Mexico . . . . . . . . . . . . . . . . . . . . . . . . . . . . . . . . . . . . . . . . . . . . . . . . . . . . . . . . . VII-3Overview . . . . . . . . . . . . . . . . . . . . . . . . . . . . . . . . . . . . . . . . . . . . . . . . . . . . . . . . . . . . . . . . . VII-3Operations on galvanized steel wire . . . . . . . . . . . . . . . . . . . . . . . . . . . . . . . . . . . . . . . . . . . . VII-3
U.S. inventories of product from China and Mexico . . . . . . . . . . . . . . . . . . . . . . . . . . . . . . . . . . VII-3U.S. importers’ current orders . . . . . . . . . . . . . . . . . . . . . . . . . . . . . . . . . . . . . . . . . . . . . . . . . . . VII-5Antidumping investigations in third-country markets . . . . . . . . . . . . . . . . . . . . . . . . . . . . . . . . . VII-5Information on nonsubject sources . . . . . . . . . . . . . . . . . . . . . . . . . . . . . . . . . . . . . . . . . . . . . . . VII-5
AppendixesA. Federal Register notices . . . . . . . . . . . . . . . . . . . . . . . . . . . . . . . . . . . . . . . . . . . . . . . . . . . . . . . . A-1B. Calendar of public conference . . . . . . . . . . . . . . . . . . . . . . . . . . . . . . . . . . . . . . . . . . . . . . . . . . . B-1C. Summary data . . . . . . . . . . . . . . . . . . . . . . . . . . . . . . . . . . . . . . . . . . . . . . . . . . . . . . . . . . . . . . . . C-1D. Additional price data for galvanized steel wire . . . . . . . . . . . . . . . . . . . . . . . . . . . . . . . . . . . . . . D-1E. Alleged effects of subject imports on U.S. producers’ existing development and
production efforts, growth, investment, and ability to raise capital . . . . . . . . . . . . . . . . . . . . E-1
Note.–Information that would reveal confidential operations of individual concerns may not bepublished and therefore has been deleted from this report. Such deletions are indicated byastericks.
iii


UNITED STATES INTERNATIONAL TRADE COMMISSION Investigation Nos. 701-TA-479 and 731-TA-1183-1184 (Preliminary) GALVANIZED STEEL WIRE FROM CHINA AND MEXICO DETERMINATIONS
On the basis of the record1 developed in the subject investigations, the United States International Trade Commission (Commission) determines, pursuant to sections 703(a) and 733(a) of the Tariff Act of 1930 (19 U.S.C. '' 1671b(a) and 1673b(a)) (the Act), that there is a reasonable indication that an industry in the United States is materially injured by reason of imports from China and Mexico of galvanized steel wire, provided for in subheading 7217.20.30 and 7217.20.45 of the Harmonized Tariff Schedule of the United States, that are alleged to be sold in the United States at less than fair value (LTFV) and subsidized by the Government of China.
Pursuant to section 207.18 of the Commission=s rules, the Commission also gives notice of the commencement of the final phase of its investigations. The Commission will issue a final phase notice of scheduling, which will be published in the Federal Register as provided in section 207.21 of the Commission=s rules, upon notice from the Department of Commerce (Commerce) of affirmative preliminary determinations in the investigations under sections 703(b) or 733(b) of the Act, or, if the preliminary determinations are negative, upon notice of affirmative final determinations in those investigations under sections 705(a) or 735(a) of the Act. Parties that filed entries of appearance in the preliminary phase of the investigations need not enter a separate appearance for the final phase of the investigations. Industrial users, and, if the merchandise under investigation is sold at the retail level, representative consumer organizations have the right to appear as parties in Commission antidumping and countervailing duty investigations. The Secretary will prepare a public service list containing the names and addresses of all persons, or their representatives, who are parties to the investigations. BACKGROUND
On March 31, 2011, a petition was filed with the Commission and Commerce by Davis Wire Corporation, Irwindale, CA; Johnstown Wire Technologies, Inc., Johnstown, PA; Mid-South Wire Company, Inc., Nashville, TN; National Standard, LLC/DW-National Standard-Niles, LLC, Niles, MI; and Oklahoma Steel & Wire Company, Inc., Madill, OK, alleging that an industry in the United States is materially injured by reason of LTFV and subsidized imports of galvanized steel wire from China and Mexico. Accordingly, effective March 31, 2011, the Commission instituted countervailing duty investigation No. 701-TA-479 and antidumping duty investigation Nos. 731-TA-1183-1184 (Preliminary).
Notice of the institution of the Commission=s investigations and of a public conference to be held in connection therewith was given by posting copies of the notice in the Office of the Secretary, U.S. International Trade Commission, Washington, DC, and by publishing the notice in the Federal Register of April 7, 2011 (76 FR 19382). The conference was held in Washington, DC, on April 21, 2011, and all persons who requested the opportunity were permitted to appear in person or by counsel.
1 The record is defined in sec. 207.2(f) of the Commission=s Rules of Practice and Procedure (19 CFR ' 207.2(f)).


VIEWS OF THE COMMISSION
Based on the record in the preliminary phase of these investigations, we find a reasonableindication that an industry in the United States is materially injured by reason of imports of galvanizedsteel wire from China that are allegedly subsidized and sold in the United States at less than fair value andimports of galvanized steel wire from Mexico that are allegedly sold in the United States at less than fairvalue.
I. THE LEGAL STANDARD FOR PRELIMINARY DETERMINATIONS
The legal standard for preliminary antidumping and countervailing duty determinations requiresthe Commission to determine, based upon the information available at the time of the preliminarydetermination, whether there is a reasonable indication that a domestic industry is materially injured orthreatened with material injury, or that the establishment of an industry is materially retarded, by reasonof the allegedly unfairly traded imports.1 In applying this standard, the Commission weighs the evidencebefore it and determines whether “(1) the record as a whole contains clear and convincing evidence thatthere is no material injury or threat of such injury; and (2) no likelihood exists that contrary evidence willarise in a final investigation.”2
II. BACKGROUND
Petitions in these investigations were filed on March 31, 2011, by the Davis Wire Corporation;Johnstown Wire Technologies, Inc.; Mid-South Wire Company, Inc.; National Standard, LLC; andOklahoma Steel & Wire Company, Inc. (“Petitioners”). Petitioners appeared at the staff conference andsubmitted a postconference brief.
Two groups of respondents entered appearances, participated in the staff conference, andsubmitted postconference briefs. Deacero S.A. de C.V., a Mexican producer and exporter of the subjectmerchandise and Deacero USA, Inc., an importer of the subject merchandise (collectively, “Deacero” or“Mexican Respondents”) jointly participated. The second group of respondents is the Wire ProductsAssociation Branch, China Steel Construction Society and its constituent members, (the “ChineseRespondents”).3
U.S. industry data are based on questionnaire responses of nine firms that accounted for ***percent of U.S. production of galvanized steel wire during 2010. U.S. import data are based on officialCommerce statistics.4
1 19 U.S.C. §§ 1671b(a), 1673b(a) (2000); see also American Lamb Co. v. United States, 785 F.2d 994, 1001-04(Fed. Cir. 1986); Aristech Chem. Corp. v. United States, 20 CIT 353, 354-55 (1996). No party argued that theestablishment of an industry is materially retarded by reason of the allegedly unfairly traded imports.
2 American Lamb Co., 785 F.2d at 1001; see also Texas Crushed Stone Co. v. United States, 35 F.3d 1535, 1543(Fed. Cir. 1994).
3 Mexican producer Aceros Camesa S.A. de C.V., domestic producer WireCo WorldGroup, Inc., and Chineseproducer Shanxi Yuci Broad Wire Products, Ltd. also entered appearances in these investigations.
4 Confidential Report, Memorandum INV-JJ-043 (May 9, 2011), “CR” at I-4, Public Report, Galvanized SteelWire from China and Mexico, Inv. Nos. 701-TA-479 and 731-TA-1183-1184 (Preliminary), USITC Pub 4234 (May2011) (“PR”) at I-3. None of the parties objected to using import statistics to measure imports, and the parties in factrelied on them to make their arguments. See, e.g., Transcript of Staff Conference of April 21, 2011 (“Tr.”) at 8,
continue...
3

The Commission received questionnaire responses from 18 Chinese producers of the subjectproduct. These firms’ reported exports to the United States in 2010 were equivalent to 57.7 percent ofU.S. imports of galvanized steel wire from China in that year.5 The Commission also receivedquestionnaire responses from two Mexican producers whose reported exports to the United States in 2010were equivalent to *** percent of U.S. imports of galvanized steel wire from Mexico in that year.6
III. DOMESTIC LIKE PRODUCT
A. In General
In determining whether there is a reasonable indication that an industry in the United States ismaterially injured or threatened with material injury by reason of imports of the subject merchandise, theCommission first defines the “domestic like product” and the “industry.”7 Section 771(4)(A) of the TariffAct of 1930, as amended (“the Tariff Act”), defines the relevant domestic industry as the “producers as awhole of a domestic like product, or those producers whose collective output of a domestic like productconstitutes a major proportion of the total domestic production of the product.”8 In turn, the Tariff Actdefines “domestic like product” as “a product which is like, or in the absence of like, most similar incharacteristics and uses with, the article subject to an investigation ... .”9
The decision regarding the appropriate domestic like product(s) in an investigation is a factualdetermination, and the Commission has applied the statutory standard of “like” or “most similar incharacteristics and uses” on a case-by-case basis.10 No single factor is dispositive, and the Commissionmay consider other factors it deems relevant based on the facts of a particular investigation.11 TheCommission looks for clear dividing lines among possible like products and disregards minor variations.12
4 ...continue157, 171 (Waite), 10 (Campbell), 39-44 (McGrath), 115, 143-144 (Malashevich).
5 CR at VII-1, PR at VII-1.
6 CR at VII-5, PR at VII-3.
7 19 U.S.C. § 1677(4)(A).
8 19 U.S.C. § 1677(4)(A).
9 19 U.S.C. § 1677(10).
10 See, e.g., Cleo, Inc. v. United States, 501 F.3d 1291, 1299 (Fed. Cir. 2007); NEC Corp. v. Department ofCommerce, 36 F. Supp. 2d 380, 383 (Ct. Int’l Trade 1998); Nippon Steel Corp. v. United States, 19 CIT 450, 455(1995); Torrington Co. v. United States, 747 F. Supp. 744, 749 n.3 (Ct. Int’l Trade 1990), aff’d, 938 F.2d 1278 (Fed.Cir. 1991) (“every like product determination ‘must be made on the particular record at issue’ and the ‘unique factsof each case’”). The Commission generally considers a number of factors including the following: (1) physicalcharacteristics and uses; (2) interchangeability; (3) channels of distribution; (4) customer and producer perceptionsof the products; (5) common manufacturing facilities, production processes, and production employees; and, whereappropriate, (6) price. See Nippon, 19 CIT at 455 n.4; Timken Co. v. United States, 913 F. Supp. 580, 584 (Ct. Int’lTrade 1996).
11 See, e.g., S. Rep. No. 96-249 at 90-91 (1979).
12 Nippon, 19 CIT at 455; Torrington, 747 F. Supp. at 748-49; see also S. Rep. No. 96-249 at 90-91 (1979)(Congress has indicated that the like product standard should not be interpreted in “such a narrow fashion as topermit minor differences in physical characteristics or uses to lead to the conclusion that the product and article are
continue...
4

Although the Commission must accept the determination of the U.S. Department of Commerce(“Commerce”) as to the scope of the imported merchandise that is subsidized or sold at less than fairvalue,13 the Commission determines what domestic product is like the imported articles Commerce hasidentified.14 The Commission must base its domestic like product determination on the record in theseinvestigations. The Commission is not bound by prior determinations, even those pertaining to the sameimported products, but may draw upon previous determinations in addressing pertinent domestic likeproduct issues.15
B. Product Description
In its notices of initiation, Commerce defined the imported merchandise within the scope of theseinvestigations as galvanized steel wire that is as follows:
a cold-drawn carbon quality steel product in coils, of solid, circular cross section with anactual diameter of 0.5842 mm (0.0230 inch) or more, plated or coated with zinc (whetherby hot-dipping or electroplating).
Steel products to be included in the scope of these investigations, regardless ofHarmonized Tariff Schedule of the United States (“HTSUS”) definitions, are products inwhich: (1) Iron predominates, by weight, over each of the other contained elements; (2)the carbon content is two percent or less, by weight; and (3) none of the elements listedbelow exceeds the quantity, by weight, respectively indicated:
1.80 percent of manganese, or1.50 percent of silicon, or1.00 percent of copper, or0.50 percent of aluminum, or1.25 percent of chromium, or0.30 percent of cobalt, or0.40 percent of lead, or1.25 percent of nickel, or
12 ...continuenot ‘like’ each other, nor should the definition of ‘like product’ be interpreted in such a fashion as to preventconsideration of an industry adversely affected by the imports under consideration.”).
13 See, e.g., USEC, Inc. v. United States, 34 Fed. Appx. 725, 730 (Fed. Cir. 2002) (“The ITC may not modify theclass or kind of imported merchandise examined by Commerce.”); Algoma Steel Corp. v. United States, 688 F.Supp. 639, 644 (Ct. Int’l Trade 1988), aff’d, 865 F.3d 240 (Fed. Cir.), cert. denied, 492 U.S. 919 (1989).
14 Hosiden Corp. v. Advanced Display Mfrs., 85 F.3d 1561, 1568 (Fed. Cir. 1996) (the Commission may find asingle like product corresponding to several different classes or kinds defined by Commerce); Cleo, 501 F.3d at 1298n.1 (“Commerce’s {scope} finding does not control the Commission’s {like product} determination.”); Torrington,747 F. Supp. at 748-52 (affirming the Commission’s determination defining six like products in investigations whereCommerce found five classes or kinds).
15 See, e.g., Acciai Speciali Terni S.p.A. v. United States, 118 F. Supp. 2d 1298, 1304-05 (Ct. Int’l Trade 2000);Nippon, 19 CIT at 455; Asociacion Colombiana de Exportadores de Flores v. United States, 693 F. Supp. 1165,1169 n.5 (Ct. Int’l Trade 1988); Citrosuco Paulista, S.A. v. United States, 704 F. Supp. 1075, 1087-88 (Ct. Int’lTrade 1988).
5

0.30 percent of tungsten, or0.02 percent of boron, or0.10 percent of molybdenum, or0.10 percent of niobium, or0.41 percent of titanium, or0.15 percent of vanadium, or0.15 percent of zirconium.16
Galvanized steel wire is an intermediate product used to make corrosion resistant wire products.17
The larger volume end-use applications for galvanized steel wire are chain link fence, vineyard wire, andbaling wire and bale ties.18 The finished wire products produced from galvanized steel wire, however, arenumerous and include fencing, stucco netting, woven wire mesh, filter wire mesh, wire cloth, wireshelving, wire racks, wire decking, wire rope, stranded wire and cable guy wire, armour wire, strappingwire, tie wire, stitching wire, brush wire, staple wire, paper clips, book-binding wire, bucket handles,paint-can handles, paint-roller handles, springs, nails, and hangers.19
C. Analysis and Conclusion
No party has advocated that the Commission adopt any domestic like product definition otherthan the one proposed by Petitioners, who argue that the Commission should define a single domestic likeproduct consisting of all galvanized wire described in the scope definition.20 As discussed below,although information is limited concerning one of the factors the Commission considers in defining thedomestic like product (interchangeability), we find a single domestic like product that is coterminous withthe scope of the investigations with no clear dividing lines between the different forms of galvanized steelwire.
Physical Characteristics and End Uses. Although the different galvanized wire products maydiffer somewhat in carbon content, gauge, and thickness of the zinc coating, all galvanized wire productshave similar physical characteristics and are used in the production of downstream wire products.21
Interchangeability. Given the range of available chemistries, gauges, and coatings, as well as thenumerous end uses for galvanized steel wire, the record suggests that different varieties of galvanized
16 Galvanized Steel Wire from the People’s Republic of China and Mexico: Initiation of Antidumping DutyInvestigations, 76 Fed. Reg. 23548, 23554 (Apr. 27, 2011); Galvanized Steel Wire from the People’s Republic ofChina: Initiation of Countervailing Duty Investigation, 76 Fed. Reg. 23564, 23568 (Apr. 27, 2011). Commerce’snotices explain that the products subject to these investigations are classified in subheadings 7217.20.30 and7217.20.45 of the HTSUS, which cover galvanized wire of all diameters and all carbon content. Galvanized wire isreported under statistical reporting numbers 7217.20.3000, 7217.20.4510, 7217.20.4520, 7217.20.4530,7217.20.4540, 7217.20.4550, 7217.20.4560, 7217.20.4570, and 7217.20.4580. Galvanized wire may also enterunder HTSUS subheadings 7229.20.0015, 7229.90.5008, 7229.90.5016, 7229.90.5031, and 7229.90.5051. Commerce notes that although the HTSUS subheadings are provided for convenience and Customs purposes, thewritten description of the merchandise is dispositive. Id.
17 CR at I-7, PR at I-6.
18 Petitioners’ Postconference Brief at 4.
19 CR at I-7, PR at I-6.
20 See Tr. at 123 (Campbell, Sailer).
21 See CR at I-7 to I-8, PR at I-6.
6

steel wire are not uniformly interchangeable. Rather, specific product characteristics are determined bythe downstream user and the ultimate end use of the product.22
Channels of Distribution. Channels of distribution are similar for all domestically producedgalvanized steel wire. The majority of domestic producers’ shipments, *** percent in 2010, were solddirectly to end users.23
Manufacturing Facilities, Production Processes, and Employees. Galvanized steel wire isproduced from hot-rolled carbon steel wire rod in two steps consisting of drawing and galvanizing.24
After the wire is cleaned and descaled, it is drawn through wire dies to reduce its size. For some end uses,the galvanized steel wire must be heat treated in order to impart certain properties to the wire. Thegalvanizing process is accomplished either by hot-dipping or electroplating, but both methods producecomparable products.25 The thickness of the zinc coating varies depending on the required level ofcorrosion resistance.26 Thus, the record indicates that the same production processes, facilities, andemployees are generally used for production of the different types of galvanized steel wire.
Producer and Customer Perceptions. The record indicates that producers and consumersperceive all galvanized steel wire, regardless of wire gauge, coating, or carbon content to be differentforms of the same product.27
Price. The record indicates that prices for galvanized steel wire are determined by the diameter,the zinc coating, and the length of wire.28
Conclusion. All types of galvanized steel wire within the scope of the investigations havecommon physical characteristics and similar end uses, share common channels of distribution, sharecommon production processes, facilities, and employees, and are perceived by producers and consumersas different forms of the same product. Thus, all kinds of galvanized steel wire, regardless of carboncontent, diameter or thickness of zinc coatings, are arrayed along a continuum of products without anyclear dividing line. The current record does not indicate any clear lines dividing the in-scope galvanizedwire products, and no party has suggested that such a dividing line exists. We therefore find that all thegalvanized steel wire within the scope of these investigations constitutes a single domestic like product.
IV. DOMESTIC INDUSTRY
The domestic industry is defined as the domestic “producers as a whole of a domestic likeproduct, or those producers whose collective output of a domestic like product constitutes a majorproportion of the total domestic production of the product.”29 In defining the domestic industry, theCommission’s general practice has been to include in the industry producers of all domestic production ofthe like product, whether toll-produced, captively consumed, or sold in the domestic merchant market.
22 See CR at I-7, PR at I-6 (specific product characteristics are determined by the downstream user and theultimate end use of the product).
23 CR/PR at Table II-1.
24 See CR at I-8, PR at I-7.
25 CR at I-9, I-9 n.17, PR at I-7, I-7 n.17.
26 CR at I-9, PR at I-7.
27 See Petition at 14, 14 n.28.
28 Tr. at 73 (Johnson); Petition at 14, 14 n.28.
29 19 U.S.C. § 1677(4)(A).
7

We must determine whether any producer of the domestic like product should be excluded fromthe domestic industry pursuant to 19 U.S.C. § 1677(4)(B). The statute provides that “[i]f a producer of adomestic like product and an exporter or importer of the subject merchandise are related parties, or if aproducer of the domestic like product is also an importer of the subject merchandise, the producer may, inappropriate circumstances, be excluded from the industry.”30 Exclusion of such producers is within theCommission’s discretion based upon the facts presented in each investigation.31
The record indicates that six of the nine domestic producers are subject to possible exclusionunder the related parties provision.32 Domestic producers ***33 *** are all related parties because theyimported subject merchandise during the period of investigation.34 Davis Wire and National Standard arealso related parties by virtue of being owned by Heico Holding, Inc., which has export operations inChina, and WireCo World Group is related to Aceros Camesa, a producer of subject merchandise inMexico.35 Only Petitioners briefed this issue, and they do not argue that appropriate circumstances exist
30 19 U.S.C. § 1677(4).
31 19 U.S.C. § 1677(4)(B). The primary factors the Commission has examined in deciding whether appropriatecircumstances exist to exclude a related party include:
(1) the percentage of domestic production attributable to the importing producer;
(2) the reason the U.S. producer has decided to import the product subject to investigation,i.e., whether the firm benefits from the LTFV sales or subsidies or whether the firm mustimport in order to enable it to continue production and compete in the U.S. market, and
(3) the position of the related producer vis-a-vis the rest of the industry, i.e., whetherinclusion or exclusion of the related party will skew the data for the rest of the industry.
See, e.g., Torrington Co. v. United States, 790 F. Supp. 1161 (Ct. Int’l Trade 1992), aff’d without opinion, 991 F.2d809 (Fed. Cir. 1993). The Commission has also considered the ratio of import shipments to U.S. production forrelated producers and whether the primary interest of the related producer lies in domestic production or importation. See, e.g., Open-End Spun Rayon Singles Yarn from Austria, Inv. No. 731-TA-751 (Preliminary), USITC Pub. 2999at 7 n.39 (October 1996). These latter two considerations were cited as appropriate factors as well in Allied MineralProducts, Inc. v. United States, —Fed. Supp. 2d.—, Slip Op. 04-139 (Ct. Int’l Trade November 12, 2004) at 6.
32 A tenth domestic producer, ***, did not submit a questionnaire response. See CR at III-1 n.1, PR at III-1 n.1.
33 The ***.
34 See 19 U.S.C. § 1677(4)(B)(i); CR/PR at Table III-6 (identifying source of subject imports for each producer).*** imported from China; *** imported from Mexico.
35 See 19 U.S.C. § 1677(4)(B)(ii)(III), CR at III-3, PR at III-2. *** purchased imports from China and couldpotentially be treated as a related party based on these purchases. CR/PR at Table III-6. The Commission considersa purchaser of subject imports to be a related party only if it controls large volumes of imports. This occurs whenthe domestic producer is responsible for a predominant portion of an importer’s purchases and the importer’spurchases are substantial. See, e.g. Certain Cut-to-Length Plate from the Czech Republic, France, India, Indonesia,Italy, Japan, Korea, and Macedonia, Invs. Nos. 701-TA-387 to 392 and 731-TA-815 to 822 (Preliminary), USITCPub. 3181 at 12 (Apr. 1999). ***. CR/PR at Table III-6. ***, which completed an importer’s questionnaire. ***Producer’s Questionnaire, at II-10. ***. Despite the fact that *** during the period of investigation indicate that itdid not control large volumes of subject imports. Consequently, we do not find *** to be a related party.
8

to exclude any of the related parties from the domestic industry, although they do not address relatedparty ***.36
We observe that for five of the related party producers (***), the ratio of subject imports todomestic production was quite low or declined during the period of investigation.37 The ratios of subjectimports to domestic production never exceeded *** percent for any of these producers in any year, exceptfor *** during the first year of the period of the investigation, and its ratio declined to under *** percentthereafter.38 This indicates that the principal interest of each of these related parties is domesticproduction. We further observe that none of these domestic producers opposes the petition, although***.39 There is no indication that the imports, which were minimal relative to each company’s domesticproduction, or the relationship with a subject foreign exporter in the case of *** shielded any of thesedomestic producers from subject imports or otherwise affected their performance.40 41 Accordingly, wedo not find it appropriate to exclude any of these producers from the domestic industry as a related party.
*** situation, on the other hand, presents a different set of circumstances. *** of the domesticproducers, accounting for *** percent of domestic production during 2010.42 ***, and it *** thepetition.43 Its imports of subject merchandise from Mexico were *** short tons in 2008 and *** shorttons in 2009 and 2010. Its ratio of subject imports to domestic production was *** percent in 2008, ***percent in 2009, and *** percent in 2010.44 ***.45
It also appears that *** may have been shielded from the effects of the subject imports, as itsperformance was much better than the industry average.46 47 *** ratio of operating income to net sales was
36 Petitioners’ Postconference Brief at 9-13.
37 See CR/PR at Table III-6.
38 CR/PR at Table III-6. ***.
39 CR/PR at Table III-1.
40 Consistent with her practice in past investigations and reviews, Commissioner Aranoff does not rely onindividual-company operating income margins, which reflect a domestic producer’s financial operations related toproduction of the domestic like product, in assessing whether a related party has benefitted from importation ofsubject merchandise. Rather, she determines whether to exclude a related party based principally on its ratio ofsubject imports to domestic production and whether its primary interests lie in domestic production or importation.
41 For purposes of the preliminary phase of these investigations, Commissioner Pinkert does not rely upon relatedparties' financial performance as a factor in determining whether there are appropriate circumstances to exclude themfrom the domestic industry and relies instead on other information relevant to this issue. The present record is notsufficient to link the related parties' profitability on U.S. operations to any specific benefit they derive fromimporting or from their relationships to foreign producers. See Allied Mineral Products v. United States, 28 CIT1861, 1865-67 (2004). For any final phase of these investigations, Commissioner Pinkert invites the parties toprovide any information they may have with respect to whether related parties are benefiting financially from theirstatus as related parties.
42 CR/PR at Table III-1.
43 CR/PR at Table III-1.
44 CR/PR at Table III-6. In addition, *** purchased ***. CR/PR at Table III-6.
45 CR/PR at Table III-6.
46 As noted above, Commissioner Aranoff does not rely on individual-company operating income margins, whichreflect a domestic producer’s financial operations related to production of the domestic like product, in assessing
continue...
9

*** the industry average.48 Given that its interests lie primarily in importing and that it may havebenefitted from its importations, we find that appropriate circumstances exist to exclude *** from thedefinition of the domestic industry as a related party. We therefore define the domestic industry as alldomestic producers of galvanized steel wire other than ***.
V. CUMULATION49
A. Legal Framework
For purposes of evaluating the volume and price effects for a determination of material injury byreason of the subject imports, section 771(7)(G)(i) of the Tariff Act requires the Commission to cumulatesubject imports from all countries as to which petitions were filed and/or investigations self-initiated byCommerce on the same day, if such imports compete with each other and the domestic like product in theU.S. market.50 In assessing whether subject imports compete with each other and with the domestic likeproduct, the Commission has generally considered four factors, including the following:
(1) the degree of fungibility between the subject imports from different countries andbetween imports and the domestic like product, including consideration of specificcustomer requirements and other quality related questions;51
(2) the presence of sales or offers to sell in the same geographic markets of subjectimports from different countries and the domestic like product;
(3) the existence of common or similar channels of distribution for subject importsfrom different countries and the domestic like product; and
(4) whether the subject imports are simultaneously present in the market.52
46 ...continuewhether a related party has benefitted from importation of subject merchandise.
47 As noted above, Commissioner Pinkert does not rely upon companies’ financial performance as a factor indetermining whether there are appropriate circumstances to exclude them from the domestic industry in thispreliminary phase of these investigations.
48 CR/PR at Table VI-3.
49 Negligibility under 19 U.S.C. § 1677(24) is not an issue in these investigations. During the 12-month periodprior to the filing of the petitions, subject imports from China and Mexico accounted for 19.5 percent and 39.0percent of total imports of galvanized steel wire, respectively. CR at IV-7, PR at IV-5.
50 19 U.S.C. § 1677(7)(G)(i).
51 Commissioner Lane notes that, with respect to fungibility, her analysis does not require such similarity ofproducts that a perfectly symmetrical fungibility is required, and she notes that this factor would be better describedas an analysis of whether subject imports from each country and the domestic like product could be substituted foreach other. See Separate Views of Commissioner Charlotte R. Lane, Certain Lightweight Thermal Paper fromChina, Germany, and Korea, Invs. Nos. 701-TA-451 and 731-TA-1126 to 1128 (Prelim.), USITC Pub. 3964 (Nov.2007).
52 See Certain Cast-Iron Pipe Fittings from Brazil, the Republic of Korea, and Taiwan, Invs. Nos. 731-TA-278 to280 (Final), USITC Pub. 1845 (May 1986), aff’d, Fundicao Tupy, S.A. v. United States, 678 F. Supp. 898 (Ct. Int’lTrade), aff’d, 859 F.2d 915 (Fed. Cir. 1988).
10

Although no single factor is necessarily determinative, and the list of factors is not exclusive, these factorsare intended to provide the Commission with a framework for determining whether the subject importscompete with each other and with the domestic like product.53 Only a “reasonable overlap” ofcompetition is required.54
B. Discussion
In these investigations, the threshold criterion is satisfied because petitioners filed theantidumping duty petitions with respect to China and Mexico and the countervailing duty petition withrespect to China on the same day. None of the cumulation exceptions apply.55 Subject imports fromChina and Mexico are therefore eligible for cumulation. We consequently examine whether there is areasonable overlap of competition between subject imports from China and Mexico, as well as betweensubject imports and the domestic like product.56
1. Fungibility
There is a reasonable degree of fungibility among the subject imports from each country and thedomestic like product. The questionnaire responses indicate that market participants perceive domesticgalvanized steel wire and the subject imports to be interchangeable. Eight of nine responding producers,16 of 18 of responding importers of the subject merchandise from China, and 13 of 15 respondingimporters of the subject merchandise from Mexico indicated that subject imports from each country arealways or frequently interchangeable with domestically produced galvanized steel wire.57 Eight of nineresponding producers and 11 of 14 responding importers indicated that subject imports from China arealways or frequently interchangeable with subject imports from Mexico.58
2. Geographic Overlap
The evidence in these preliminary phase investigations indicates that there is a geographicoverlap in sales. U.S. producers reported that their sales were nationwide.59 ***, reported selling
53 See, e.g., Wieland Werke, AG v. United States, 718 F. Supp. 50 (Ct. Int’l Trade 1989).
54 The Statement of Administrative Action (“SAA”) states that “the new section will not affect currentCommission practice under which the statutory requirement is satisfied if there is a reasonable overlap ofcompetition.” SAA on Uruguay Round Agreements Act (“URAA”), H.R. Rep. 103-316, Vol. I at 848 (1994) (citingFundicao Tupy, S.A. v. United States, 678 F. Supp. 898, 902 (Ct. Int’l Trade 1988)), aff’d, 859 F.2d 915 (Fed. Cir.1988). See also, e.g., Goss Graphic Sys., Inc. v. United States, 33 F. Supp. 2d 1082, 1087 (Ct. Int’l Trade 1998)(“cumulation does not require two products to be highly fungible”); Wieland Werke, AG, 718 F. Supp. at 52(“Completely overlapping markets are not required.”).
55 See 19 U.S.C. § 1677(7)(G)(ii).
56 Petitioners argue that the prerequisites for cumulation for purposes of present material injury are satisfied inthese investigations, Petitioners’ Postconference Brief at 13, and neither group of respondents has addressed theissue.
57 CR/PR at Table II-2.
58 CR/PR at Table II-2.
59 CR at IV-6, PR at IV-4; Petitioners’ Postconference Brief at 15 n.62.
11

nationally in the United States.60 Subject imports from China are marketed nationally; they entered at 28ports during the period of investigation, and importers reported selling such imports nationally.61
3. Channels of Distribution
The majority of shipments of domestically produced merchandise and subject imports from Chinaand Mexico were shipped directly to end users.62
4. Simultaneous Presence
Domestically produced galvanized steel wire was present throughout the period for whichinformation was gathered.63 Official Commerce statistics show that subject imports from China andMexico each entered the United States in every month of the period of investigation.64
C. Conclusion
Based on the record, we conclude that there is a reasonable overlap of competition among thesubject imports from China and Mexico and the domestic like product. We therefore cumulatively assessthe volume and effects of subject imports from China and Mexico for purposes of determining whetherthere is a reasonable indication of material injury to the domestic industry by reason of the subjectimports.
VI. REASONABLE INDICATION OF MATERIAL INJURY BY REASON OF CUMULATEDSUBJECT IMPORTS
A. Legal Standard
In the preliminary phase of antidumping or countervailing duty investigations, the Commissiondetermines whether there is a reasonable indication that an industry in the United States is materiallyinjured or threatened with material injury by reason of the imports under investigation.65 In making thisdetermination, the Commission must consider the volume of subject imports, their effect on prices for thedomestic like product, and their impact on domestic producers of the domestic like product, but only inthe context of U.S. production operations.66 The statute defines “material injury” as “harm which is not
60 *** and CR at IV-6, PR at IV-4.
61 Petitioners’ Postconference Brief at 16.
62 CR/PR at Table II-1.
63 See CR/PR at Table IV-2 and Table V-2 (indicating sales of domestic galvanized steel wire during each quarterof the three-year period of investigation).
64 CR at IV-7, PR at IV-4.
65 19 U.S.C. §§ 1671b(a), 1673b(a).
66 19 U.S.C. § 1677(7)(B)( i). The Commission “may consider such other economic factors as are relevant to thedetermination” but shall “identify each {such} factor ... {a}nd explain in full its relevance to the determination.” 19 U.S.C. § 1677(7)(B).
12

inconsequential, immaterial, or unimportant.”67 In assessing whether there is a reasonable indication thatthe domestic industry is materially injured by reason of subject imports, we consider all relevanteconomic factors that bear on the state of the industry in the United States.68 No single factor isdispositive, and all relevant factors are considered “within the context of the business cycle andconditions of competition that are distinctive to the affected industry.”69
Although the statute requires the Commission to determine whether there is a reasonableindication that the domestic industry is “materially injured by reason of” unfairly traded imports,70 it doesnot define the phrase “by reason of,” indicating that this aspect of the injury analysis is left to theCommission’s reasonable exercise of its discretion.71 In identifying a causal link, if any, between subjectimports and material injury to the domestic industry, the Commission examines the facts of record thatrelate to the significance of the volume and price effects of the subject imports and any impact of thoseimports on the condition of the domestic industry. This evaluation under the “by reason of” standardmust ensure that subject imports are more than a minimal or tangential cause of injury and that there is asufficient causal, not merely a temporal, nexus between subject imports and material injury.72
In many investigations, there are other economic factors at work, some or all of which may alsobe having adverse effects on the domestic industry. Such economic factors might include nonsubjectimports; changes in technology, demand, or consumer tastes; competition among domestic producers; ormanagement decisions by domestic producers. The legislative history explains that the Commission mustexamine factors other than subject imports to ensure that it is not attributing injury from other factors tothe subject imports, thereby inflating an otherwise tangential cause of injury into one that satisfies thestatutory material injury threshold.73 In performing its examination, however, the Commission need not
67 19 U.S.C. § 1677(7)(A).
68 19 U.S.C. § 1677(7)(C)(iii).
69 19 U.S.C. § 1677(7)(C)(iii).
70 19 U.S.C. §§ 1671b(a), 1673b(a).
71 Angus Chemical Co. v. United States, 140 F.3d 1478, 1484-85 (Fed. Cir. 1998) (“{T}he statute does not‘compel the commissioners’ to employ {a particular methodology}.”), aff’g 944 F. Supp. 943, 951 (Ct. Int’l Trade1996).
72 The United States Court of Appeals for the Federal Circuit (“ Federal Circuit”), in addressing the causationstandard of the statute, observed that “{a}s long as its effects are not merely incidental, tangential, or trivial, theforeign product sold at less than fair value meets the causation requirement.” Nippon Steel Corp. v. USITC, 345F.3d 1379, 1384 (Fed. Cir. 2003). This was further ratified in Mittal Steel Point Lisas Ltd. v. United States, 542F.3d 867, 873 (Fed. Cir. 2008), where the Federal Circuit, quoting Gerald Metals, Inc. v. United States, 132 F.3d716, 722 (Fed. Cir. 1997), stated that “this court requires evidence in the record ‘to show that the harm occurred “byreason of” the LTFV imports, not by reason of a minimal or tangential contribution to material harm caused byLTFV goods.’” See also Nippon Steel Corp. v. United States, 458 F.3d 1345, 1357 (Fed. Cir. 2006); TaiwanSemiconductor Industry Ass’n v. USITC, 266 F.3d 1339, 1345 (Fed. Cir. 2001).
73 Statement of Administrative Action (“SAA”) on Uruguay Round Agreements Act (“URAA”), H.R. Rep. 103-316, Vol. I at 851-52 (1994) (“{T}he Commission must examine other factors to ensure that it is not attributinginjury from other sources to the subject imports.”); S. Rep. 96-249 at 75 (1979) (the Commission “will considerinformation which indicates that harm is caused by factors other than less-than-fair-value imports.”); H.R. Rep. 96-317 at 47 (1979) (“in examining the overall injury being experienced by a domestic industry, the ITC will take intoaccount evidence presented to it which demonstrates that the harm attributed by the petitioner to the subsidized ordumped imports is attributable to such other factors;” those factors include “the volume and prices of nonsubsidized
continue...
13

isolate the injury caused by other factors from injury caused by unfairly traded imports.74 Nor does the“by reason of” standard require that unfairly traded imports be the “principal” cause of injury orcontemplate that injury from unfairly traded imports be weighed against other factors, such as nonsubjectimports, which may be contributing to overall injury to an industry.75 It is clear that the existence ofinjury caused by other factors does not compel a negative determination.76
Assessment of whether material injury to the domestic industry is “by reason of” subject imports“does not require the Commission to address the causation issue in any particular way” as long as “theinjury to the domestic industry can reasonably be attributed to the subject imports” and the Commission“ensure{s} that it is not attributing injury from other sources to the subject imports.”77 78 Indeed, the
73 ...continueimports or imports sold at fair value, contraction in demand or changes in patterns of consumption, trade restrictivepractices of and competition between the foreign and domestic producers, developments in technology and theexport performance and productivity of the domestic industry”); accord Mittal Steel, 542 F.3d at 877.
74 SAA at 851-52 (“{T}he Commission need not isolate the injury caused by other factors from injury caused byunfair imports.”); Taiwan Semiconductor Industry Ass’n v. USITC, 266 F.3d 1339, 1345 (Fed. Cir. 2001) (“{T}heCommission need not isolate the injury caused by other factors from injury caused by unfair imports ... . Rather, theCommission must examine other factors to ensure that it is not attributing injury from other sources to the subjectimports.” (emphasis in original)); Asociacion de Productores de Salmon y Trucha de Chile AG v. United States, 180F. Supp. 2d 1360, 1375 (Ct. Int’l Trade 2002) (“{t}he Commission is not required to isolate the effects of subjectimports from other factors contributing to injury” or make “bright-line distinctions” between the effects of subjectimports and other causes.); see also Softwood Lumber from Canada, Inv. Nos. 701-TA-414 and 731-TA-928(Remand), USITC Pub. 3658 at 100-01 (Dec. 2003) (Commission recognized that “{i}f an alleged other factor isfound not to have or threaten to have injurious effects to the domestic industry, i.e., it is not an ‘other causal factor,’then there is nothing to further examine regarding attribution to injury”), citing Gerald Metals, Inc. v. United States,132 F.3d 716, 722 (Fed. Cir. 1997) (the statute “does not suggest that an importer of LTFV goods can escapecountervailing duties by finding some tangential or minor cause unrelated to the LTFV goods that contributed to theharmful effects on domestic market prices.”).
75 S. Rep. 96-249 at 74-75; H.R. Rep. 96-317 at 47.
76 See Nippon Steel Corp., 345 F.3d at 1381 (“an affirmative material-injury determination under the statuterequires no more than a substantial-factor showing. That is, the ‘dumping’ need not be the sole or principal cause ofinjury.”).
77 Mittal Steel, 542 F.3d at 877-78; see also id. at 873 (“While the Commission may not enter an affirmativedetermination unless it finds that a domestic industry is materially injured ‘by reason of’ subject imports, theCommission is not required to follow a single methodology for making that determination ... . {and has} broaddiscretion with respect to its choice of methodology.”) citing United States Steel Group v. United States, 96 F.3d1352, 1362 (Fed. Cir. 1996) and S. Rep. 96-249 at 75.
78 Commissioner Pinkert does not join this paragraph or the following three paragraphs. He points out that theFederal Circuit, in Bratsk, 444 F.3d 1369, and Mittal, held that the Commission is required, in certain circumstanceswhen considering present material injury, to undertake a particular kind of analysis of nonsubject imports, albeitwithout reliance on presumptions or rigid formulas. Mittal explains as follows:
What Bratsk held is that “where commodity products are at issue and fairly traded, price-competitive,nonsubject imports are in the market,” the Commission would not fulfill its obligation to consider animportant aspect of the problem if it failed to consider whether nonsubject or non-LTFV imports wouldhave replaced LTFV subject imports during the period of investigation without a continuing benefit to thedomestic industry. 444 F.3d at 1369. Under those circumstances, Bratsk requires the Commission toconsider whether replacement of the LTFV subject imports might have occurred during the period of
continue...
14

Federal Circuit has examined and affirmed various Commission methodologies and has disavowed “rigidadherence to a specific formula.”79
The Federal Circuit’s decisions in Gerald Metals, Bratsk, and Mittal Steel all involved caseswhere the relevant “other factor” was the presence in the market of significant volumes of price-competitive nonsubject imports. The Commission interpreted the Federal Circuit’s guidance in Bratsk asrequiring it to apply a particular additional methodology following its finding of material injury in casesinvolving commodity products and a significant market presence of price-competitive nonsubjectimports.80 The additional “replacement/benefit” test looked at whether nonsubject imports might havereplaced subject imports without any benefit to the U.S. industry. The Commission applied that specificadditional test in subsequent cases, including the Carbon and Certain Alloy Steel Wire Rod from Trinidadand Tobago determination that underlies the Mittal Steel litigation.
Mittal Steel clarifies that the Commission’s interpretation of Bratsk was too rigid and makes clearthat the Federal Circuit does not require the Commission to apply an additional test nor any one specificmethodology; instead, the court requires the Commission to have “evidence in the record ‘to show thatthe harm occurred ‘by reason of’ the LTFV imports,’” and requires that the Commission not attributeinjury from nonsubject imports or other factors to subject imports.81 Accordingly, we do not considerourselves required to apply the replacement/benefit test that was included in Commission opinionssubsequent to Bratsk.
The progression of Gerald Metals, Bratsk, and Mittal Steel clarifies that, in cases involvingcommodity products where price-competitive nonsubject imports are a significant factor in the U.S.market, the Court will require the Commission to give full consideration, with adequate explanation, tonon-attribution issues when it performs its causation analysis.82 83
The question of whether the material injury threshold for subject imports is satisfiednotwithstanding any injury from other factors is factual, subject to review under the substantial evidence
78 ...continueinvestigation, and it requires the Commission to provide an explanation of its conclusion with respect tothat factor.
542 F.3d at 878.
79 Nucor Corp. v. United States, 414 F.3d 1331, 1336, 1341 (Fed. Cir. 2005); see also Mittal Steel, 542 F.3d at879 (“Bratsk did not read into the antidumping statute a Procrustean formula for determining whether a domesticinjury was ‘by reason’ of subject imports.”).
80 Mittal Steel, 542 F.3d at 875-79.
81 Mittal Steel, 542 F.3d at 873 (quoting from Gerald Metals, 132 F.3d at 722), 875-79 & n.2 (recognizing theCommission’s alternative interpretation of Bratsk as a reminder to conduct a non-attribution analysis).
82 To that end, after the Federal Circuit issued its decision in Bratsk, the Commission began to present publishedinformation or send out information requests in final phase investigations to producers in nonsubject countries thataccounted for substantial shares of U.S. imports of subject merchandise (if, in fact, there were large nonsubjectimport suppliers). In order to provide a more complete record for the Commission’s causation analysis, theserequests typically seek information on capacity, production, and shipments of the product under investigation in themajor source countries that export to the United States. The Commission plans to continue utilizing published orrequested information in final phase investigations in which there are substantial levels of nonsubject imports.
83 Commissioner Lane also refers to her dissenting views in Polyethylene Terephthalate Film, Sheet, and Stripfrom Brazil, China, Thailand, and the United Arab Emirates, Inv. Nos. 731-TA-1131-1134 (Final), USITC Pub.4040 (Oct. 2008), for further discussion of Mittal Steel.
15

standard. Congress has delegated this factual finding to the Commission because of the agency’sinstitutional expertise in resolving injury issues.84
B. Conditions of Competition and the Business Cycle
The following conditions of competition inform our analysis of whether there is a reasonableindication of material injury by reason of cumulated subject imports.
1. Captive Production85
The domestic industry consumes approximately *** of its galvanized steel wire production in themanufacture of many different downstream products. We have considered whether, in this case, thecaptive production provision requires primary focus on the merchant market when we assess market shareand factors affecting the financial performance of the domestic industry. Petitioners and the MexicanRespondents argue that the provision should not apply in these investigations because its third criterion isnot satisfied.86 We analyze the applicability of the provision below.
Threshold Criterion. Internal transfers accounted for about *** of the reported volume of U.S.producers’ domestic shipments during the period, declining from *** percent in 2008 to *** percent in2009 and *** percent in 2010.87 Commercial (merchant market) sales accounted for the balance of theirshipments. We determine that the threshold criterion has been met because a significant portion of U.S.producers’ shipments of the domestic like product is internally transferred and a significant portion of thedomestic like product is sold in the merchant market.
First Statutory Criterion. The first criterion requires examination of whether the domestic likeproduct produced that is internally transferred for processing into downstream articles does not enter the
84 Mittal Steel, 542 F.3d at 873; Nippon Steel Corp., 458 F.3d at 1350, citing U.S. Steel Group, 96 F.3d at 1357;S. Rep. 96-249 at 75 (“The determination of the ITC with respect to causation is ... complex and difficult, and is amatter for the judgment of the ITC.”).
85 As amended by the URAA, the statute contains a provision on captive production at section 19 U.S.C.§ 1677(7)(C)(iv), which provides as follows:
(iv) CAPTIVE PRODUCTION -- If domestic producers internally transfer significant productionof the domestic like product for the production of a downstream article and sell significantproduction of the domestic like product in the merchant market, and the Commission finds that –
(I) the domestic like product produced that is internally transferred for processing intothat downstream article does not enter the merchant market for the domestic like product, (II) the domestic like product is the predominant material input in the production of thatdownstream article, and(III) the production of the domestic like product sold in the merchant market is notgenerally used in the production of that downstream article,
then the Commission, in determining market share and the factors affecting financial performanceset forth in clause (iii), shall focus primarily on the merchant market for the domestic like product.
19 U.S.C. § 1677(7)(C)(iv). The SAA indicates that where a domestic like product is transferred internally for theproduction of another article coming within the definition of the domestic like product, such transfers do notconstitute internal transfers for the production of a “downstream article” for purposes of the captive productionprovision. SAA at 853.
86 Petitioners’ Postconference Brief at 23 n.99; Mexican Respondents’ Postconference Brief at 6 n.15.
87 CR at III-6, PR at III-5.
16

merchant market for the domestic like product.88 The record indicates that the vast majority of internaltransfers by current domestic producers are used in the production of downstream products and did notenter the merchant market.89 We therefore find that the first statutory criterion is satisfied.
Second Statutory Criterion. In applying the second statutory criterion, the Commission considerswhether the domestic like product is the predominant material input into a downstream product byreferring to its share of the raw material cost of the downstream product.90 Galvanized steel wirecomprises at least 66 percent of the finished cost of the various downstream products and therefore is thepredominant material input.91 Accordingly, the second criterion is also satisfied.
Third Statutory Criterion. In applying the third statutory criterion, the Commission inquires intowhether the merchant market purchasers are generally using the domestic like product in the productionof the same downstream article or articles as the integrated domestic producers.92 If the merchant marketpurchasers do not generally use the domestic like product in the production of the same downstreamarticle or articles as the integrated domestic producer, then the statutory criterion is satisfied.93
Addressing this issue at the staff conference, representatives from *** indicated that there is anoverlap between the downstream articles produced from galvanized steel wire in the merchant market andthose produced from galvanized steel wire consumed internally.94 Further, in questionnaire responses, sixdomestic producers reported ***.95 Thus, it appears that there is a substantial overlap in end uses for thedomestic product that is captively consumed and the domestic product that is sold in the merchant market. We accordingly find that the third statutory criterion is not satisfied and decline to apply the captiveproduction provision. For purposes of the preliminary phase of these investigations, however, weconsider as a condition of competition that a significant portion of domestic production is captivelyconsumed, and thus we consider merchant market data, as well as data for the total U.S. market, in ouranalysis.96
88 19 U.S.C. § 1677(7)(C)(iv)(I). See Raw Flexible Magnets from China and Taiwan, Inv. Nos. 701-TA-452(Preliminary) and 731-TA-1129-30 (Preliminary), USITC Pub. 3961 (November 2007) at 13 (“No producer reporteddiverting raw flexible magnets intended for internal consumption to the merchant market.”).
89 CR at III-7, PR at III-6. *** reported that it transferred *** short tons to a related firm that subsequently soldthe product “as is” on the merchant market. Id. Although it is unclear whether these shipments were intended forfurther processing, these shipments, which represent *** percent of non-commercial shipments, arguably do notsatisfy the first criterion. Nonetheless, the remaining non-commercial shipments were internally consumed, were notdiverted to the merchant market, and are sufficient to meet the first criterion.
90 19 U.S.C. § 1677(7)(C)(iv)(II).
91 CR at III-7 to III-8, PR at III-6.
92 19 U.S.C. § 1677(7)(C)(iv)(III).
93 See Polyvinyl Alcohol from Taiwan, Inv. No. 731-TA-1088 (Preliminary), USITC Pub. 3732 (October 2004) at16-17.
94 Tr. at 88 (Cronin, Weinand).
95 See CR at III-8 to III-9, PR at III-6.
96 As discussed, we have determined to exclude *** from the definition of the domestic industry. Thus, forpurposes of analyzing the market as a whole we relied on the staff worksheet designated table C-3. *** commercialshipments were just *** short tons for the period of investigation, and its operating income on these shipments was$***. As *** activity in the merchant market was minimal, i.e., *** percent of commercial shipments and ***percent of operating income, we have relied on table C-2 for purposes of analyzing the merchant market, although
continue...
17

2. Demand Conditions
Galvanized steel wire is used by downstream manufacturers, including several domesticproducers, in the production of a variety of products.97 Demand for galvanized steel wire is driven by itsdownstream applications. Fencing, vineyard wire, and bale ties are three of the larger volume end uses.98
All nine responding producers and 13 of 16 responding importers indicated that the galvanizedsteel wire market is subject to the general U.S. economic cycle.99 Real U.S. gross domestic product wasessentially flat in 2008, declined in 2009, and rebounded in 2010.100 Parties agree that the severeeconomic downturn of 2009 accounts for the sharp drop-off in demand for galvanized steel wire thatyear.101
Reflecting these trends, apparent U.S. consumption of galvanized steel wire by quantity fellsharply from 752,814 short tons in 2008 to 607,360 short tons in 2009, before increasing to 667,630 shorttons in 2010, a level that was nevertheless lower than in 2008.102 Apparent U.S. consumption followed asimilar trend in the merchant market.103
3. Supply Conditions
There are ten U.S. producers of galvanized steel wire, and the Commission received questionnaireresponses from nine producers, estimated to account for approximately *** percent of U.S. production.104
*** of these domestic producers accounted for over 90 percent of domestic production in 2010.105
Three firms reported shutdowns or curtailments in domestic production during the periodexamined, mostly due to a lack of business, although one firm reported a ***.106 Two firms reportedexpanding or upgrading production facilities.107 Overall, domestic production capacity increased from*** short tons in 2008 and 2009 to *** short tons in 2010, a level that exceeded apparent U.S.consumption throughout the period.108
96 ...continuethis table includes data for all U.S. producers.
97 CR at I-7, PR at I-6.
98 Tr. at 55-56 (Cronin).
99 CR at II-10, PR at II-6.
100 CR at II-8, PR at II-6; CR/PR at Figure II-1.
101 Tr. at 37-38, 165.
102 CR/PR at Table IV-2.
103 Apparent U.S. consumption in the merchant market declined from *** short tons in 2008 to *** short tons in2009, before increasing to *** short tons in 2010. CR/PR at Tables IV-4b and IV-5b.
104 CR/PR at III-1 and Table III-1.
105 CR/PR at III-1.
106 CR/PR at Table III-3.
107 CR/PR at Table III-3.
108 Staff Worksheet Table C-3.
18
As noted, about half of domestic production of galvanized steel wire was captively consumed bydomestic producers in the production of downstream products during the period. With respect togalvanized steel wire sold on the merchant market, almost two-thirds of the domestically producedproduct was sold directly to end users, with the remainder sold to distributors.109 A higher percentage ofsubject imports was sold directly to end users, but subject imports were also sold to distributors.110
The domestic industry was the largest supplier of galvanized steel wire to the U.S. marketthroughout the period examined, accounting for at least two-thirds of the market.111 The volume ofcumulated subject imports was less than that of nonsubject imports in 2008, but subject imports surpassednonsubject imports in 2009 and held the second largest share of the market during 2009 and 2010.112
4. Other Conditions
Raw materials costs accounted for over 70 percent of domestic producers’ total cost of goods sold(“COGS”) in 2010, with wire rod and zinc being the primary raw materials used in the manufacture ofgalvanized steel wire.113 Prices for wire rod and zinc fluctuated during 2008 and 2009 and tended tostabilize in 2010.114 The domestic industry’s unit COGS fell between 2008 and 2009 and rose somewhatin 2010.115
Galvanized steel wire is produced in a wide range of diameters, carbon levels, tensile strengths,and zinc coating thicknesses, depending upon the end use of the product.116 There are several differentclassifications of zinc coatings – flash or regular coating, classes 1-5 coatings, and classes A-Ccoatings.117 The most common type of galvanized steel wire is regular coated, industrial qualitygalvanized wire.118 Galvanized steel wire is shipped to purchasers in large 2,000-4,000 pound coils.119
Despite the variety of galvanized wire products, producers and importers agree that galvanizedsteel wire from various sources is highly interchangeable. Eight of nine responding producers, 16 of 18importers of the subject merchandise from China, and 13 of 15 importers of the subject merchandise from
109 CR/PR at Table II-1; Tr. at 15 (Pardo).
110 CR/PR at Table II-1.
111 CR/PR at Table IV-5a. In the merchant market, the domestic industry also was the largest supplier, withcumulated subject imports overtaking nonsubject imports in terms of market share by 2009. CR/PR at Table IV-5b.
112 See CR/PR at Table IV-3. Canada was the top import source in the U.S. market in 2008 and 2009, but wassurpassed by Mexico in 2010. CR/PR at Tables IV-2 and IV-3. Canada accounted for 29.8 percent of totalgalvanized steel wire imports in 2010, with other nonsubject sources combining to account for less than 13.0 percentof imports by quantity and value. CR at VII-10, PR at VII-5. Imports from each of the 27 other nonsubjectcountries ranged between less than 0.01 percent and 4.7 percent of total imports in 2010.
113 CR at V-1, PR at V-1.
114 See CR/PR at Fig. V-1.
115 Unit COGS fell from $1,112 in 2008 to $932 in 2009, and it then rose to $946 in 2010. Staff Worksheet TableC-3.
116 CR at I-7, PR at I-6.
117 CR at I-7, PR at I-6.
118 CR at I-7, PR at I-6.
119 CR at I-10, PR at I-8.
19

Mexico indicated that subject imports from each country are always or frequently interchangeable withdomestically produced galvanized steel wire.120 Contrary to respondents’ assertions,121 most producersand importers perceive that price differences play a significant role in purchasing decisions.122
C. Volume of Subject Imports 123
Section 771(7)(C)(i) of the Act provides that the “Commission shall consider whether the volumeof imports of the merchandise, or any increase in that volume, either in absolute terms or relative toproduction or consumption in the United States, is significant.”124
Cumulated subject imports were already present in substantial volumes and held a substantialmarket share at the beginning of the period, and they were a significant presence in the U.S. marketthroughout the period. The quantity of cumulated subject imports in the U.S. market stood at 103,811short tons in 2008. It decreased by 16.1 percent to 87,078 short tons in 2009, and then increased by 23.9percent to 107,897 short tons in 2010.125 From 2008 to 2010, subject imports increased modestly (3.9percent) even as apparent U.S. consumption declined by 11.3 percent.126
Subject imports increased their share of the U.S. market from 13.8 percent in 2008 to 14.3 percentin 2009 and 16.2 percent in 2010, while U.S. producers’ market share increased from *** percent in 2008to *** percent in 2009 and *** percent in 2010.127 Subject imports’ share of the merchant market waseven greater than their share of the overall market and also increased steadily from 2008 to 2010.128
120 CR/PR at Table II-2.
121 Respondents assert that factors other than price, such as consistent availability, are important to purchasingdecisions and that non-price differences exist between the domestic like product and the subject imports. SeeMexican Respondents’ Postconference Brief at 3-4. In any final phase investigations, we will issue purchasers’questionnaires that will seek further information both as to whether there are significant non-price differencesbetween products from different sources and as to whether any such differences play an important role in purchasingdecisions. To facilitate data collection and analysis, parties and other market participants should identify specificallythe types of products they are referencing when they assert that there are differences between the subject imports andthe domestic like product in terms of product range, availability, or quality. Similarly, they should fully describe anycircumstances in which they could not obtain products they needed from the domestic industry.
122 On the current record, we find that price is the most important factor in purchasing decisions, as producers andimporters downplayed the importance of non-price factors. In their questionnaire responses, eight of nineresponding U.S. producers and 12 of 17 responding importers reported that differences other than price were “never”or only “sometimes” a significant factor in whether to purchase the domestic like product or the subject imports. CR/PR at Table II-3. See also Tr. at 21, 28 (Cronin) (customers purchase based on price).
123 U.S. import numbers are based on official Commerce statistics, as noted earlier. CR at I-4, PR at I-3.
124 19 U.S.C. § 1677(7)(C)(i).
125 See CR/PR at Table C-1.
126 See CR/PR at Table C-1.
127 See Staff Worksheet Table C-3.
128 See CR/PR at Table IV-5b. Cumulated subject imports’ share of the merchant market increased from ***percent in 2008 to *** percent in 2009 and *** percent in 2010. Id.
20

Cumulated subject imports also increased relative to U.S. production. The ratio of subjectimports to domestic production increased from 19.4 percent in 2008 to 19.7 percent in 2009 and 21.9percent in 2010.129
For purposes of the preliminary phase of these investigations, we find that the volume of thesubject imports is significant both in absolute terms and relative to consumption and production in theUnited States. We also find the increase in overall subject import market share to be significant.
D. Price Effects of the Cumulated Subject Imports
Section 771(C)(ii) of the Act provides that, in evaluating the price effects of subject imports, the Commission shall consider whether – (I) there has been significant price undersellingby the imported merchandise as compared with the price of domestic like products of theUnited States, and (II) the effect of imports of such merchandise otherwise depressesprices to a significant degree or prevents price increases, which otherwise would haveoccurred, to a significant degree.130
In these preliminary phase investigations, the record indicates that subject imports from Chinaand Mexico and domestically produced galvanized steel wire are highly substitutable and that price is animportant factor in purchasing decisions.131
The Commission collected quarterly pricing data on two products.132 Eight U.S. producers, fiveimporters of galvanized steel wire from China, one importer of galvanized steel wire from Mexico, andthree importers of galvanized steel wire from Canada provided pricing data.133 Pricing data reported bythese firms were rather limited, accounting for approximately five percent of U.S. producers’ commercialshipments of galvanized steel wire,134 six percent of U.S. shipments of subject imports from China, and*** percent of U.S. shipments of subject imports from Mexico in 2010.135
The subject imports were priced lower than the domestic like product in 29 of 38 quarterlypricing comparisons.136 There was underselling by Chinese or Mexican galvanized steel wire, or both, inevery quarter of the three-year period. Although the data available provide only a small sample, because
129 CR/PR at Table IV-6 (includes ***).
130 19 U.S.C. § 1677(7)(C)(ii).
131 CR at II-11, PR at II-8. See also CR/PR at Table II-2 (producers and importers reporting subject imports anddomestic product to be interchangeable).
132 Product 1 is a 0.148-inch (3.76mm) diameter, low carbon galvanized wire, Class 1 (zinc) coating, for industrialuse. Product 2 is a 0.085-inch (2.16mm) diameter, low carbon galvanized wire, commercial coating, for industrialuse. CR at V-4, PR at V-3. Several producers and importers reported that the product categories did not preciselymatch the products that they were selling. See CR at V-4 n.1, PR at V-3 n.1.
133 CR at V-4, PR at V-3.
134 The domestic producer we have excluded as a related party, ***, did not report any pricing information.
135 CR at V-4, PR at V-3. In any final phase investigations, the parties are encouraged in written comments ondraft questionnaires to propose any pricing products that they believe will more fully capture competition in the U.S.market.
136 CR/PR at Table V-4.
21

price is an important consideration in purchasing decisions, we find the consistent underselling to besignificant.137
In addition, three of ten responding purchasers named in lost sales and lost revenue allegationsindicated that they had switched their purchases of galvanized steel wire rod from the domestic likeproduct to the subject imports.138 Two of these purchasers specifically cited the lower prices of thesubject imports as the reason for making this switch.139 Three of nine responding purchasers alsoindicated that U.S. producers reduced their prices to compete with low-priced subject imports.140
Prices for both of the domestically produced products for which the Commission collected datafluctuated during the period examined, increasing in 2008 before generally moving downward.141 Pricesin the fourth quarter of 2010 were slightly higher than the initial price observation in the first quarter of2008.142 Thus, we do not find evidence of significant price depression.
Domestic producers’ net sales values fell by a greater amount than their COGS during the period. Domestic producers’ unit net sales value fell by $***, or *** percent, from 2008 to 2010, while their unitCOGS decreased by $***, or *** percent.143 The domestic industry’s ratio of COGS to net salesincreased irregularly from *** percent in 2008 to *** percent in 2010.144 We find that this increase in theCOGS to net sales ratio, together with the significant underselling and the purchasers who reported thatthe domestic industry had to lower prices in competition with subject imports, provides some evidencethat subject imports suppressed domestic prices particularly between 2009-10.145 For purposes of thepreliminary phase of these investigations, we find that the significant price underselling by subjectimports had adverse effects on prices for the domestic like product.
137 CR/PR at Table V-4. For purposes of these preliminary phase investigations, we do not rely upon average unitvalues (“AUVs”) as a proxy for price comparisons, as urged by Petitioners. See Petitioners’ Postconference Brief at28-30. We invite comments on this issue in any final phase investigations.
138 CR at V-11, PR at V-8.
139 CR at V-11, PR at V-8.
140 CR at V-11, PR at V-8.
141 See CR/PR at Fig. V-2.
142 CR/PR at Table V-3. Raw material costs account for the majority of the domestic industry’s COGS, and wirerod and zinc are the principal raw materials used in producing galvanized steel wire, with wire rod being the largestcomponent. CR at V-1, PR at V-1; Petition at 7. The price trends for galvanized steel wire largely tracked wire rodprice trends. See CR/PR at Figs V-1 and V-2. In any final phase investigations we will explore the role of rawmaterial costs in price movements of galvanized steel wire.
143 Staff Worksheet Table C-3 (table C-3 excludes ***). In the merchant market, unit net sales values fell by ***percent from 2008 to 2010, or $***, while unit COGS declined by *** percent, or $***, over the same period. CR/PR at Table C-2.
144 Staff Worksheet Table C-3. In the merchant market, the domestic industry’s unit COGS to net sales ratioincreased from *** percent in 2008 to *** percent in 2009, before declining to *** percent in 2010. CR/PR TableC-2.
145 Commissioner Pinkert does not join this finding with respect to price suppression.
22

E. Impact of the Cumulated Subject Imports146
Section 771(7)(C)(iii) of the Act provides that the Commission, in examining the impact of thesubject imports on the domestic industry, “shall evaluate all relevant economic factors which have abearing on the state of the industry.”147 These factors include output, sales, inventories, capacityutilization, market share, employment, wages, productivity, profits, cash flow, return on investment,ability to raise capital, research and development, and factors affecting domestic prices. No single factoris dispositive and all relevant factors are considered “within the context of the business cycle andconditions of competition that are distinctive to the affected industry.”148
Most domestic industry performance indicators declined sharply between 2008 and 2009 and thenrose in 2010, but nevertheless ended lower in 2010 than in 2008. Between 2008 and 2010, production fellfrom *** short tons in 2008 to *** short tons in 2009, before rising to *** short tons in 2010, for anoverall decline of *** percent. The industry expanded its capacity by *** percent from 2008 to 2010;this increase in capacity, together with the decline in production, caused capacity utilization to fall from*** percent in 2008 to *** percent in 2010.149 The domestic industry’s U.S. shipment trends followedtrends in its production, declining by *** percent from 2008 to 2010.150
With respect to employment, the number of production and related workers, hours worked, andwages paid declined from 2008 to 2010, by *** percent, *** percent, and *** percent, respectively.151 Hourly wages were slightly higher in 2010 than in 2008, while worker productivity was slightly lower.152
We find that the negative impact of subject imports may well be primarily manifested in the weakfinancial performance of the domestic industry. The domestic industry’s net sales revenues declined from$*** in 2008 to $*** in 2009, but then improved to $*** in 2010, for an overall decline of *** percentfrom 2008 to 2010.153 This decline was the result both of reduced quantity and reduced unit value of netsales. The domestic industry’s operating income fell from $*** in 2008 to losses of $*** and $*** in
146 In its notice initiating an antidumping investigation on galvanized steel wire from China, Commerce reportedestimated dumping margins ranging from 171 percent to 235 percent. On galvanized steel wire from Mexico,Commerce reported estimated dumping margins ranging from 166 percent to 244 percent. 76 Fed. Reg. at 23552.
147 19 U.S.C. § 1677(7)(C)(iii); see also SAA at 851 and 885 (“In material injury determinations, the Commissionconsiders, in addition to imports, other factors that may be contributing to overall injury. While these factors, insome cases, may account for the injury to the domestic industry, they also may demonstrate that an industry is facingdifficulties from a variety of sources and is vulnerable to dumped or subsidized imports.”)
148 19 U.S.C. § 1677(7)(C)(iii); see also SAA at 851, 885; Live Cattle from Canada and Mexico, Inv. Nos. 701-TA-386, 731-TA-812-813 (Preliminary), USITC Pub. 3155 at 25 n.148 (Feb. 1999).
149 Staff Worksheet Table C-3.
150 CR/PR at Table III-4. The overwhelming majority of the domestic industry’s shipments were U.S. shipments. The domestic industry’s exports constituted no more than *** percent of total shipments at any point during theperiod examined. CR at III-4, PR at III-3. The domestic industry’s U.S. shipments fell from *** short tons in 2008to *** short tons in 2009 before recovering to *** short tons in 2010. End-of-period inventories decreased overall,falling from *** short tons in 2008 to *** short tons in 2009, before increasing to *** short tons in 2010. StaffWorksheet Table C-3. Inventories as a ratio to total shipments remained relatively low, falling from *** percent in2008 to *** percent in 2010. Staff Worksheet Table C-3.
151 ***. Staff Worksheet Table C-3.
152 Staff Worksheet Table C-3.
153 Staff Worksheet Table C-3.
23

2009 and 2010, respectively.154 Its operating margins declined from positive *** percent in 2008 tonegative *** percent in 2009 and negative *** percent in 2010.155 In 2010, four of the eight reportingdomestic producers (not including ***) sustained operating losses.156
The industry’s financial performance in merchant market operations was weak, althoughgenerally more favorable than in overall operations.157 Operating income for merchant market operationswas $*** in 2008, $*** in 2009, and $*** in 2010.158 The industry reported an operating margin of ***percent in 2008, *** percent in 2009, and *** percent in 2010.
As described above, we find significant underselling by subject imports, confirmed lost sales andinstances in which domestic producers reduced prices to compete with lower priced subject imports, andsome evidence that subject imports suppressed domestic prices of galvanized steel wire.159 The priceeffects indicate a nexus between subject imports and the poor financial performance experienced by thedomestic industry over the period examined.
We have considered the role of other factors, such as demand and nonsubject imports, so as not toattribute injury from other factors to subject imports. We recognize that the significant decline inapparent U.S. consumption during 2009 contributed to the domestic industry’s deteriorating performance,and we intend to explore the effects of declining demand further in any final phase investigations. Thefact that the domestic industry’s operating margin remained below the break-even point in 2010 despitesome recovery in demand and subject imports were at their peak level in absolute terms and relative toapparent U.S. consumption, however, suggests a link between subject imports and the industry’s weakfinancial results. Also notable is the fact that subject imports increased their market share in therecovering market of 2010 by a significant amount, whereas the domestic industry increased its shareonly marginally.160
We have also examined the role of nonsubject imports.161 Unlike the subject imports, nonsubjectimports declined in both absolute and relative terms. The quantity of nonsubject imports fell from
154 Staff Worksheet Table C-3.
155 Staff Worksheet Table C-3.
156 See CR/PR at Table VI-3. Capital expenditures increased from $*** in 2008 to $*** in 2009 and $*** in2010. See Staff Worksheet Table C-3. Research and development expenses were stable during the period.
157 In any final phase of these investigations, we will explore possible explanations for the different results in themerchant market and in the market as a whole, including competition in downstream markets, the reporting oftransfer prices, and differences in product mix.
158 Sales revenues in the merchant market followed a similar trend to those in the overall market, but theyrecovered more strongly than overall sales revenues in 2010. The value of commercial sales declined from $*** in2008 to $*** in 2009, then increased to $*** in 2010. CR/PR at Table C-2.
159 As noted above, Commissioner Pinkert does not join this finding with respect to price suppression.
160 See Staff Worksheet Table C-3 (1.9 percentage point increase for subject imports versus *** percentage pointincrease for the domestic industry from 2009-10).
161 Based on the record evidence in these investigations, Commissioner Pinkert finds that price competitive,nonsubject imports, particularly imports from Canada, were a significant factor in the U.S. market for galvanizedsteel wire during the period under examination. He notes, however, that prices for product imported from Canadawere lower than prices for product imported from the subject countries in three instances and higher in 35 instances. CR at D-3, PR at D-3. Thus, for purposes of the analysis required under Bratsk and Mittal, he finds that there isrecord evidence to suggest that, had the subject imports exited the U.S. market, any replacement of them bynonsubject imports would not have been without benefit to the domestic industry.
24

120,865 short tons in 2008 to 79,085 short tons in 2009 and 73,613 short tons in 2010.162 Nonsubjectimports’ share, by quantity, of apparent U.S. consumption likewise fell from 16.1 percent in 2008 to 13.0percent in 2009 and 11.0 percent in 2010.163 Thus, nonsubject imports do not appear to have played a rolein the weak condition of the domestic industry.
Consequently, we conclude for purposes of these preliminary phase investigations that there is acausal nexus between cumulated subject imports and the observed declines in domestic industryperformance. In light of this, we conclude that, for purposes of the preliminary phase of theseinvestigations, the subject imports are having a significant adverse impact on the domestic industry.
CONCLUSION
For the foregoing reasons, and based on the record in the preliminary phase of theseinvestigations, we find that there is a reasonable indication that an industry in the United States ismaterially injured by reason of allegedly dumped and subsidized galvanized steel wire from China andallegedly dumped galvanized steel wire from Mexico.
162 CR/PR at Table IV-3.
163 CR/PR at Table C-1. Increases in subject import market share over the period of investigation were largely atthe expense of nonsubject import market share. Furthermore, prices for nonsubject imports from Canada weregenerally higher than prices of subject imports and similar or higher than prices for the domestic product over theperiod of investigation. CR/PR at Figure D-1. In any final phase investigations, we intend to further explore the roleof nonsubject imports in the U.S. market, including the reported difficulties of the largest Canadian producer ofgalvanized steel wire, Tree Island. See CR at VII-10, PR at VII-5; Tr. at 96 (Gutierrez).
25


PART I: INTRODUCTION
BACKGROUND
These investigations result from a petition filed with the U.S. Department of Commerce(“Commerce”) and the U.S. International Trade Commission (“USITC” or “Commission”) by Davis WireCorporation (“Davis Wire”), Irwindale, CA; Johnstown Wire Technologies, Inc. (“Johnstown Wire”),Johnstown, PA; Mid-South Wire Company, Inc. (“Mid-South Wire”), Nashville, TN; National Standard,LLC/DW-National Standard-Niles, LLC (“National Standard”), Niles, MI; and Oklahoma Steel & WireCompany, Inc. (“Oklahoma Steel & Wire”), Madill, OK, on March 31, 2011, alleging that an industry inthe United States is materially injured and threatened with material injury by reason of less-than-fair-value (“LTFV”) imports of galvanized steel wire1 from China and Mexico and by reason of subsidizedimports of galvanized steel wire from China. Information relating to the background of the investigationsis provided below.2
Effective date Action
March 31, 2011Petition filed with Commerce and the Commission; institution of Commissioninvestigation (76 FR 19382, April 7, 2011)
April 13, 2011 Revised schedule (76 FR 21914, April 19, 2011)
April 21, 2011 Commission’s conference1
April 27, 2011Commerce’s notices of initiation (76 FR 23548 and 76 FR 23564, antidumpingand countervailing duty, respectively)
May 16, 2011 Commission’s vote
May 16, 2011 Commission determination transmitted to Commerce
May 23, 2011 Commission views transmitted to Commerce 1 A list of witnesses appearing at the conference is presented in app. B.
STATUTORY CRITERIA AND ORGANIZATION OF THE REPORT
Statutory Criteria
Section 771(7)(B) of the Tariff Act of 1930 (the “Act”) (19 U.S.C. § 1677(7)(B)) provides that inmaking its determinations of injury to an industry in the United States, the Commission--
shall consider (I) the volume of imports of the subject merchandise, (II)the effect of imports of that merchandise on prices in the United Statesfor domestic like products, and (III) the impact of imports of suchmerchandise on domestic producers of domestic like products, but onlyin the context of production operations within the United States; and . . .may consider such other economic factors as are relevant to thedetermination regarding whether there is material injury by reason ofimports.
Section 771(7)(C) of the Act (19 U.S.C. § 1677(7)(C)) further provides that--
1 See the section entitled “The Subject Merchandise” in Part I of this report for a complete description of themerchandise subject to these investigations.
2 Federal Register notices cited in the tabulation are presented in app. A.
I-1
In evaluating the volume of imports of merchandise, the Commissionshall consider whether the volume of imports of the merchandise, or anyincrease in that volume, either in absolute terms or relative to productionor consumption in the United States is significant.. . .In evaluating the effect of imports of such merchandise on prices, theCommission shall consider whether . . . (I) there has been significantprice underselling by the imported merchandise as compared with theprice of domestic like products of the United States, and (II) the effect ofimports of such merchandise otherwise depresses prices to a significantdegree or prevents price increases, which otherwise would haveoccurred, to a significant degree.. . .In examining the impact required to be considered under subparagraph(B)(i)(III), the Commission shall evaluate (within the context of thebusiness cycle and conditions of competition that are distinctive to theaffected industry) all relevant economic factors which have a bearing onthe state of the industry in the United States, including, but not limited to. . . (I) actual and potential declines in output, sales, market share, profits,productivity, return on investments, and utilization of capacity, (II)factors affecting domestic prices, (III) actual and potential negativeeffects on cash flow, inventories, employment, wages, growth, ability toraise capital, and investment, (IV) actual and potential negative effectson the existing development and production efforts of the domesticindustry, including efforts to develop a derivative or more advancedversion of the domestic like product, and (V) in {an antidumpinginvestigation}, the magnitude of the margin of dumping.
Organization of the Report
Part I of this report presents information on the subject merchandise, alleged subsidies andestimated dumping margins, and domestic like product. Part II of this report presents information onconditions of competition and other relevant economic factors. Part III presents information on thecondition of the U.S. industry, including data on capacity, production, shipments, inventories, andemployment. Parts IV and V present the volume of subject imports and pricing of domestic and importedproducts, respectively. Part VI presents information on the financial experience of U.S. producers. PartVII presents the statutory requirements and information obtained for use in the Commission’sconsideration of the question of threat of material injury as well as information regarding nonsubjectcountries.
U.S. MARKET SUMMARY
Galvanized steel wire generally is used to make a variety of wire products including but notlimited to fencing, vineyard wire, bale ties, and chicken coop wire.3 The leading U.S. producers ofgalvanized steel wire are Davis Wire, Keystone Consolidated Industries, Inc. (“Keystone”), andOklahoma Steel & Wire, while leading reporting producers of galvanized steel wire outside the United
3 Petition, pp. I-9-I-10 and conference transcript, pp. 55-56 (Cronin and Johnson).
I-2

States include Fasten Group Imp. & Exp., Tianjin City Guosheng Metal Products, and Tianjin HuayanMetal Wire Products of China and Deacero and Aceros Camesa of Mexico. The leading U.S. importersof galvanized steel wire from China are ***, while the leading importer of galvanized steel wire fromMexico is Deacero USA, Inc. Leading importers of galvanized steel wire from nonsubject countries(primarily Canada) include ***.
Apparent U.S. consumption of galvanized steel wire totaled approximately 667,630 short tons($670 million) in 2010. Currently, 10 firms are known to produce galvanized steel wire in the UnitedStates. U.S. producers’ U.S. shipments of galvanized steel wire totaled 486,120 short tons ($491 million)in 2010, and accounted for 72.8 percent of apparent U.S. consumption by quantity and 73.3 percent byvalue. U.S. imports from subject sources totaled 107,897 short tons ($95 million) in 2010 and accountedfor 16.2 percent of apparent U.S. consumption by quantity and 14.1 percent by value. U.S. imports fromnonsubject sources totaled 73,613 short tons ($84 million) in 2010 and accounted for 11.0 percent ofapparent U.S. consumption by quantity and 12.5 percent by value.
SUMMARY DATA AND DATA SOURCES
A summary of data collected in these investigations is presented in appendix C, tables C-1 and C-2. Except as noted, U.S. industry data are based on questionnaire responses of nine firms that accountedfor *** percent of U.S. production of galvanized steel wire during 2010. U.S. imports are based onofficial Commerce statistics except where noted.
PREVIOUS AND RELATED INVESTIGATIONS
Galvanized steel wire has not been the subject of any prior countervailing or antidumping dutyinvestigations in the United States.
NATURE AND EXTENT OF ALLEGED SUBSIDIES AND SALES AT LTFV
Alleged Subsidies
On April 27, 2011, Commerce published a notice in the Federal Register of the initiation of itscountervailing duty investigation on galvanized steel wire from China.4 Commerce identified thefollowing government programs in China:
! Preferential Loans and Interest Rates! Government Provision of Inputs for Less than Adequate Remuneration (LTAR)! Income and Other Direct Taxes! Indirect Tax and Tariff Exemption Programs! Grant Programs! Preferential Tax Subsidies for FIEs
4 Galvanized Steel Wire from the People’s Republic of China: Initiation of Countervailing Duty Investigation, 76FR 23564, April 27, 2011.
I-3

Alleged Sales at LTFV
On April 27, 2011, Commerce published a notice in the Federal Register of the initiation of itsantidumping duty investigations on galvanized steel wire from China5 and Mexico.6 Commerce hasinitiated antidumping duty investigations based on estimated dumping margins of 171 percent to 235percent for galvanized steel wire from China and 166 percent to 244 percent for galvanized steel wirefrom Mexico.
THE SUBJECT MERCHANDISE
Commerce’s Scope
Commerce has defined the scope of these investigations as follows:
The scope of these investigations covers galvanized steel wire which is a cold-drawn carbonquality steel product in coils, of solid, circular cross section with an actual diameter of 0.5842mm (0.0230 inch) or more, plated or coated with zinc (whether by hot-dipping or electroplating).
Steel products to be included in the scope of these investigations, regardless of Harmonized TariffSchedule of the United States (‘‘HTSUS’’) definitions, are products in which: (1) Ironpredominates, by weight, over each of the other contained elements; (2) the carbon content is twopercent or less, by weight; and (3) none of the elements listed below exceeds the quantity, byweight, respectively indicated:
•1.80 percent of manganese, or •1.50 percent of silicon, or •1.00 percent of copper, or •0.50 percent of aluminum, or •1.25 percent of chromium, or •0.30 percent of cobalt, or •0.40 percent of lead, or •1.25 percent of nickel, or •0.30 percent of tungsten, or •0.02 percent of boron, or •0.10 percent of molybdenum, or •0.10 percent of niobium, or •0.41 percent of titanium, or •0.15 percent of vanadium, or •0.15 percent of zirconium.7
5 Galvanized Steel Wire from the People’s Republic of China and Mexico: Initiation of Antidumping DutyInvestigations, 76 FR 23548, April 27, 2011.
6 Ibid.
7 Ibid.
I-4

Tariff Treatment
Galvanized steel wire is classifiable in the Harmonized Tariff Schedule of the United States(“HTS”) under subheadings 7217.20.30 and 7217.20.45 and reported for statistical purposes understatistical reporting numbers 7217.20.3000, 7217.20.4510, 7217.20.4520, 7217.20.4530, 7217.20.4540,7217.20.4550, 7217.20.4560, 7217.20.4570, and 7217.20.4580. Table I-1 presents current tariff rates forgalvanized steel wire.
Table I-1Galvanized steel wire: Tariff rates, 2011
HTS provision Article descriptionGeneral1 Special2
Column23
Rates (percent ad valorem)72177217.20
7217.20.3000
7217.20.45
7217.20.4510
7217.20.4520
7217.20.4530
7217.20.4540
7217.20.4550
7217.20.4560
7217.20.4570
7217.20.4580
Wire of iron or nonalloy steel:Plated or coated with zinc:
Round wire:With a diameter of 1.5 mm or more and containing by weight less than 0.25 percent of carbon..............................
Other......................................................................
With a diameter of less than 1.0 mm:Containing by weight less than 0.25 percent of carbon
Containing by weight 0.25 percent of more but less than 0.6 percent of carbon
Containing by weight 0.6 percent or more of carbon
With a diameter of 1.0 mm or more but less than 1.5 mm:
Containing by weight less than 0.25 percent of carbon
Containing by weight 0.25 percent of more but less than 0.6 percent of carbon
Containing by weight 0.6 percent or more of carbon
With a diameter of 1.5 mm or more:Containing by weight 0.25 percent ore more but less than 0.6 percent of carbon
Containing by weight 0.6 percent or more of carbon
Free
Free
(4)
7%
25%
1 Normal trade relations, formerly known as the most-favored-nation duty rate. 2 Special rates not applicable when General rate is free. 3 Applies to imports from a small number of countries that do not enjoy normal trade relations duty status. 4 General note 3(c)(i) defines the special duty program symbols enumerated for this provision.
Source: Harmonized Tariff Schedule of the United States (2011).
I-5

THE PRODUCT
Description and Applications
Galvanized steel wire is an intermediate product used to make corrosion resistant wire products.Finished products made from galvanized steel wire include fencing, stucco netting, woven wire mesh,filter wire mesh, wire cloth, wire shelving, wire racks, wire decking, wire rope, stranded wire and cableguy wire, armour wire, strapping wire, baling wire, tie wire, stitching wire, brush wire, vineyard wire,staple wire, paper clips, book binding wire, bucket handles, paint can handles, paint roller handles,springs, nails, and hangers.8
Although galvanized steel wire is available in a wide range of diameters, carbon levels, tensilestrengths, and zinc coating thicknesses, the most common type is regular coated, industrial qualitygalvanized wire. The diameters and zinc coating thicknesses are determined by the downstream user andthe ultimate end use of the product. The diameters for galvanized steel wire, also referred to as gauges,range from 0.0230 inches (24 gauge) to 0.5 inches (7/0 gauge).9 Zinc coating thicknesses vary dependingon the required level of corrosion resistence.10 There are 9 different classifications of zinc coatings: flashor regular coating,11 Classes 1-5 coatings, and Classes A-C coatings.12 These zinc designations representa certain weight of zinc per square foot or meter of surface area for different wire diameters. Forexample, 8 gauge wire with a class 4 zinc coating level has 1.20 ounces of zinc per square foot of wire.
Manufacturing Processes
Galvanized steel wire is produced from hot-rolled carbon steel wire rod through a productionprocess consisting of two distinct steps: drawing and galvanizing. The drawing stage begins byremoving dirt and mill scale from the hot-rolled steel wire rod. Cleaning and descaling can beaccomplished chemically or mechanically. Chemical descaling, also called acid pickling, is a process inwhich wire or rod is immersed in a bath of strong acid, typically hydrochloric or sulphuric, to removescale and other undesirable materials.13 Mechanical descaling, in contrast, uses methods such as reversebending, wire brushing, belt polishing or sanding, shaving, or shot blasting, to remove scale and other
8 Petition, vol. I, pp. 9-10; Conference transcript, pp. 22, 28, and 30 (Cronin, Johnson, and Weinand).
9 Galvanized steel wire that is less than 0.0230 inches in diameter, which is outside the scope of theseinvestigations, is used in specialized applications, such as for structural reinforcement products. Staff telephoneinterview with ***.
10 Zinc, in addition to creating a barrier between the wire and the environment, also has the ability to protect thewire cathodically. Zinc, which is anodic to steel, will preferentially corrode and protect the wire against rustingwhen the wire’s zinc coating is damaged. American Galvanizers Association, “Zinc Coatings,” 2006, p. 1.
11 While there is no specified minimum weight of coating for flash or regular class zinc coating, the relevantASTM specification requires that zinc-coated wire produced to these classes must have the full surface covered withzinc. See ASTM Standard A641/A641M-03, “Standard Specification for Zinc-Coated (Galvanized) Carbon SteelWire,” 2009, Section 1, vol. 01.06, pp. 209-213.
12 ASTM A641/A641M-03 covers Standard Specifications for Zinc-Coated (Galvanized) Carbon Steel Wire forall zinc classes except class 2. Class 2 was eliminated from this standard because it is generally no longer specifiedexcept for nails, staples, and wire from which nails and staples are cut and formed. The coating level for theseapplications is the same as class 1. See ASTM Standard A641/A641M-03, “Standard Specification for Zinc-Coated(Galvanized) Carbon Steel Wire,” 2009, Section 1, vol. 01.06, pp. 209-213.
13 The Wire Association International Inc (WAI),“The Pickling Process,” Ferrous Wire Handbook, 2008, pp.154-155.
I-6

materials.14 The cleaned and descaled wire rod is then coated with a lubricant and pulled through a seriesof wire drawing dies to reduce its size.
Due to the requirements of some end uses, the wire may then be annealed or undergo other heattreatments at this stage of galvanized steel wire production. Heat treatment lowers strain-hardened tensilevalues in order to increase elongation properties in the steel. Annealing occurs when a wire is heated toand held at a certain temperature for a period of time and then control cooled.15 This process relievesstrain hardening induced by cold working during wire drawing, softens the metal, and alters ductility,toughness, tensile strength, yield strength, elongation, and other physical properties.16
The wire is then galvanized by either the hot-dipped or electroplating methods.17 First, thesurface of the drawn wire is de-greased and passed through an acid bath, a water rinse, a flux bath, andthen air dried to prepare it for the zinc coating.18 The acid bath removes scale and rust while the flux bathinhibits oxidation of the steel prior to galvanizing. In hot-dipped galvanizing the wire is then submergedin a molten zinc bath where the required thickness of zinc is applied.19 When steel is submerged in themolten zinc, a chemical reaction permanently bonds the zinc to the steel through galvanizing—creating azinc-iron alloy on the surface of the wire.20 This process creates layers of zinc in which the most externallayer is all zinc, but successive layers are a mixture of zinc and iron, with an interior of steel. Thesemultiple layers allow the metal to withstand corrosion.21 Lastly, the wire passes through a scrubber toensure uniformity of the zinc coating and a water spray for cooling.
In electroplating, instead of submerging the wire in molten zinc, the wire is passed through achemical solution bath in which zinc has been dissolved. As the wire moves through the chemical
14 WAI, “Mechanical Descaling of Wire Rod,” Ferrous Wire Handbook, 2008, p. 226.
15 One method of heat treating can be accomplished by heating the wire via lead bath. ***.
16 WAI, “Annealing,” Ferrous Wire Handbook, 2008, p. 483. While wire may undergo stress relief heattreatment, annealed wire generally does not contain residual stress because the annealing process is similar to thestress relief heat treatment process. See WAI, “Stress Relief,” Ferrous Wire Handbook, 2008, p. 471.
17 The hot-dipped galvanizing process for zinc coating is the more commonly used method. WAI, “Galvanizingand Other Coatings on Steel Wire,” The Manufacture of Ferrous Wire, 1989, p. 527. According to petitioners,galvanized steel wire produced via the hot-dipped or electroplated methods are comparable products. The decisionto build hot-dipped or electroplating galvanizing lines is largely determined by economies of scale and principalproduction costs such as energy—hot-dipped lines use natural gas whereas electroplating lines use electricity. Withregard to the end use product that manufacturers target, shaped wire may be better produced via the electroplatingmethod. Conference transcript, pp. 59-60 (Cronin). Both zinc coating methods―electroplated and hot-dipped―areemployed by Mexican and Chinese producers. Conference transcript, p. 16 (Waite).
18 American Galvanizers Association, “Zinc Coatings,” 2006, p. 1; McNulty, “Cleaning Treatments,” Wire &Cable Technology International, March/April 2011, p. 130; WAI, “Galvanizing and Other Coatings on Steel Wire,”Ferrous Wire: The Manufacture of Ferrous Wire, 1989, pp. 543-545.
19 The hot-dipped galvanized coating is generally uniform on all surfaces and is the most common method ofgalvanizing. The reaction of the molten zinc with the steel during the hot-dip galvanizing process results in acoating that is metallurgically bonded to the steel. The coating is not simply a zinc coating over the steel but, rathera series of hard iron/zinc alloys that become more zinc rich towards the outer surface of the coating. The pure zinclayer and the zinc-iron alloy layers are anodic to steel, providing sacrificial protection in the event that the coating isscratched. This ensures steel exposed as a result of damage to the hot-dip coating will not rust as long as there issufficient coating on the surface of the steel. American Galvanizers Association, “Zinc Coatings,” 2006, p. 4; FrankPorter, Zinc Handbook: Properties, Processing, and Use in Design, 1991, pp. 131, 143-147.
20 WAI, “Galvanizing and Other Coatings on Steel Wire: The Formation of Hot Dip Zinc Coatings,” FerrousWire: The Manufacture of Ferrous Wire, 1989, pp. 532-53.
21 Zinc also protects the steel by acting as a “sacrificial layer.” If the galvanized wire begins to corrode the zincwill get corrode first. This allows the zinc that is spread over the breach or scratch to prevent rust from reaching thesteel. Frank Porter, Zinc Handbook: Properties, Processing, and Use in Design, 1991, pp. 130-131.
I-7

solution, the bath and the wire are electrically charged, causing the zinc to adhere to the wire, forming thezinc coating. The speed at which the wire moves through the solution determines the final weight of thezinc coating.22 The slower the speed, the thicker the zinc coating. The electroplating process provides asmooth, even dispersion of the zinc on the surface of the wire.23
The finished product is wound onto a drum or wire stand, strapped into place and packaged as a2,000-4,000 pound coil.24 The coil may be covered with a protective material, such as plastic and ispackaged such that the end user can place the coil directly onto a wire dispenser.25
Domestic galvanized steel wire is principally shipped from producers to finished productproducers via truck.26 Galvanized steel wire may also be shipped via rail depending on the destination. According to U.S. producer questionnaires, most galvanized steel wire is shipped directly to the end user;however, some shipments of galvanized steel wire are sent to distribution centers where the wire is stored.
DOMESTIC LIKE PRODUCT ISSUES
No issues with respect to domestic like product have been raised in these investigations. Thepetitioner proposes one domestic like product co-extensive with scope.27 Respondents reported that theydo not intend to make any domestic like product arguments.28
22 On wire, coating weights may range up to 3 ounces per square foot. Heat treated and electroplated wire can becold drawn to about 95 percent reduction in area, depending on the chemical composition of the wire, heat treatment,and diameter. American Galvanizers Association, “Zinc Coatings,” 2006, p. 5.
23 Petition, vol. I, p. 8. Electroplated zinc coatings are generally more uniform around the circumference of thewire and are important for end uses that require good concentricity. Wire coated to class C is unable to be producedthrough the hot-dipped method. Conference transcript, pp. 80-81 (Cronin).
24 Conference transcript, pp. 10 and 83 (Waite and Cronin).
25 Conference transcript, p. 83 (Cronin).
26 Conference transcript, p. 71 (Cronin).
27 Conference transcript, p. 152 (Waite).
28 Conference transcript, p. 123 (Campbell and Sailer).
I-8

PART II: CONDITIONS OF COMPETITION IN THE U.S. MARKET
U.S. MARKET CHARACTERISTICS
Galvanized steel wire is used in production of a wide variety of products, including (but notlimited to) chain link and barbed wire fencing materials, poultry cages, staples, paper clips, vineyard wire,baling wire, and bale ties. A significant quantity of U.S., Chinese, and Mexican production of galvanizedwire is consumed internally or transferred to related parties.
*** accounted for approximately 90 percent of U.S. production in 2010. *** accounted for about70 percent of U.S. imports from China in 2010 and *** accounted for almost *** percent of U.S. importsfrom Mexico in 2010.
Galvanized steel wire produced in the United States and imported from China and Mexico is soldnationwide.1 Three of the nine responding U.S. producers and nine of 21 responding importers reportedselling galvanized steel wire nationally. Including producers and importers that sell galvanized steel wirenationally, seven producers and 14 importers reported selling to the Northeast, eight producers and 12importers reported selling to the Midwest, eight producers and 14 importers reported selling to theSoutheast, eight producers and 15 importers reported selling to the Central Southwest, five producers and12 importers reported selling in the Mountain region, four producers and 16 importers reported selling inthe Pacific Coast region. *** reported selling nationally.
CHANNELS OF DISTRIBUTION
According to petitioners, the majority of the galvanized steel wire is sold directly to end users,although some products such as high carbon galvanized spring wire (music wire) are sold throughdistributors.2 As shown in table II-1, more than 60 percent of shipments of U.S.-produced galvanizedwire were sold directly to end users during 2008-10, as were at least 70 percent of shipments of importsfrom both subject and nonsubject sources.
SUPPLY AND DEMAND CONSIDERATIONS
Supply
U.S. Supply
Based on available information, U.S. galvanized steel wire producers have the ability to respondto changes in demand with large changes in the quantity of shipments of U.S.-produced galvanized steelwire to the U.S. market. The main contributing factor to the high degree of responsiveness of supply arethe availability of unused capacity to increase shipments; supply responsiveness is somewhat constraineddue to a somewhat limited ability to use inventories, a limited ability to ship to alternate markets, and aninability to produce alternate products.
1 Conference transcript, p. 7 (Waite).
2 Ibid., pp. 82-83 (Cronin).
II-1

Table II-1Galvanized steel wire: U.S. producers’ and importers’ U.S. shipments of galvanized steel wire, bysources and channels of distribution, 2008-10
Item
Period
2008 2009 2010
Share of reported shipment quantity (percent)
Domestic producers’ U.S. commercial shipments of galvanized steel wire to:
Distributors 35.8 33.0 36.6
End users 64.2 67.0 63.4
U.S. importers’ U.S. commercial shipments of galvanized steel wire from China:
Distributors 10.2 28.7 26.8
End users 89.8 71.3 73.7
U.S. importers’ U.S. commercial shipments of galvanized steel wire from Mexico:
Distributors *** *** ***
End users *** *** ***
U.S. importers’ U.S. commercial shipments of galvanized steel wire from all other countries to:
Distributors *** *** ***
End users *** *** ***
Source: Compiled from data submitted in response to Commission questionnaires.
Industry capacity
U.S. producers have unused capacity with which they could increase production of galvanizedsteel wire in the event of a price change. U.S. producers’ capacity utilization decreased from 66.0 percentin 2008 to 54.8 percent in 2010. The decrease in capacity utilization resulted from an increase inproduction capacity from 809,538 short tons in 2008 to 897,988 short tons in 2010, while productiondecreased.
Alternative markets
U.S. producers have a very limited ability to divert shipments to or from alternative markets inresponse to changes in the price of galvanized steel wire. Exports by the U.S. producers, as a share oftotal shipments, decreased from *** percent in 2008 to *** percent in 2010.
Inventory levels
U.S. producers have a somewhat limited ability to use inventories as a means of increasingshipments of galvanized steel wire to the U.S. market. The ratio of end-of-period inventories to totalshipments for the U.S. producers decreased from *** percent in 2008 to *** percent in 2010.
II-2

Production alternatives
All nine responding U.S. producers indicated that since 2008 only galvanized steel wire has beenproduced on the machinery and equipment used in production of galvanized steel wire. U.S. producersalso do not anticipate producing alternative products in the future.
Supply constraints
Two of nine responding U.S. producers indicated that they had refused, declined, or been unableto supply galvanized steel wire since January 1, 2008. U.S. producer *** reported when prices of scrapincreased due to the limited supply in early 2008, *** experienced a rush of orders from customersattempting to beat any future price increases, and the firm was unable to meet such high demand in thelimited time frame. *** indicates that this situation has not been repeated since October 2008. The otherU.S. producer, ***, indicated that during 2008, all production capacity was used to meet ***.
Mid-South Wire reported that its galvanizing line was down from May 2010 to November 1,2010 due to flooding in the Nashville area. The water caused the zinc tank to freeze, and the galvanizingline had to be rebuilt. While it was down, Mid-South Wire purchased galvanized steel wire from otherU.S. producers to meet customer needs.3
Subject Imports from China
Based on available information, Chinese producers have the ability to respond to changes indemand with large changes in the quantity of shipments of galvanized steel wire to the U.S. market. Themain contributing factor to the high degree of responsiveness of supply is the existence of alternatemarkets; supply responsiveness is constrained by the limited ability to use inventories, the limitedavailability of unused capacity and the absence of alternate products.
Industry capacity
Chinese producers have limited unused capacity with which they could increase production ofgalvanized steel wire in the event of a price change. Chinese producers’ capacity utilization decreasedfrom 92.8 percent in 2008 to 86.6 percent in 2010.4 The decrease in capacity utilization resulted fromproduction capacity increasing by a greater percentage than production.5 Many Chinese producersreported limited supply of power and water, shortages in working capital, labor shortages, and increasinglabor costs as constraints on production and supply of galvanized steel wire.
Alternative markets
Chinese producers have the ability to divert shipments to or from their home market andalternative markets in response to changes in the price of galvanized steel wire. Shipments of galvanizedsteel wire from China to markets other than the United States (including exports to alternative markets,shipments to the home market, and internal consumption and transfers) increased from approximately
3 Conference transcript, pp. 26-27 (Johnson).
4 Eighteen Chinese producers responded to the foreign producers’ questionnaire. These responses are believed toaccount for approximately *** of Chinese export shipments to the United States in 2010.
5 Production capacity increased by 10.6 percent (from 246,902 short tons in 2008 to 273,075 short tons in 2010)while production increased by 3.2 percent (from 229,195 short tons in 2008 to 236,619 short tons in 2010).
II-3

84.6 percent of total shipments in 2008 to 90.8 percent in 2010. Internal consumption accounted for 28.8percent of Chinese total shipments in 2010.
Inventory levels
Responding Chinese producers have a limited ability to use inventories as a means of increasingshipments of galvanized steel wire to the U.S. market. The ratio of end-of-period inventories to totalshipments for the Chinese producers decreased from 3.3 percent in 2008 to 3.1 percent in 2010.
Production alternatives
All 18 responding Chinese producers indicated that they do not produce products other thangalvanized steel wire on the equipment and machinery that is used to produce galvanized steel wire.
Supply constraints
None of the responding importers or product from China reported refusing, declining, or beingunable to supply galvanized steel wire.
Subject Imports from Mexico
Based on available information, Mexican producers have the ability to respond to changes indemand with large changes in the quantity of shipments of galvanized steel wire to the U.S. market. Themain contributing factor to the high degree of responsiveness of supply is the existence of alternatemarkets; supply responsiveness is constrained by the somewhat limited ability to use inventories, thelimited availability of unused capacity, and a limited ability to produce alternate products.
Industry capacity
Mexican producers have limited capacity with which they could increase production ofgalvanized steel wire in the event of a price change. Mexican producers’ capacity utilization increasedfrom *** percent in 2008 to *** percent in 2010.6 The increase in capacity utilization resulted from anincrease in production that was greater than the increase in production capacity.7 Mexican producers alsoprojected an increase in capacity utilization for 2011 and 2012, estimating *** percent capacity utilizationin 2012 with internal consumption increasing from *** percent of total shipments in 2010 to *** percentin 2012. Mexican producers reported internal demand, which maximizes utilization of galvanized steelwire production, as the main constraint on capacity and supply.
Alternative markets
Mexican producers have the ability to divert shipments to or from their home market andalternative markets in response to changes in the price of galvanized steel wire. Shipments of galvanizedsteel wire from Mexico to markets other than the United States (including exports to alternative markets,shipments to the home market, and internal consumption and transfers) decreased from approximately
6 Two Mexican producers responded to the foreign producers’ questionnaire. These responses are believed toaccount for approximately *** of Mexican export shipments to the United States in 2010.
7 Production increased by *** percent (from *** short tons in 2008 to *** short tons in 2010) while productioncapacity increased by *** percent (from *** short tons in 2008 to *** short tons in 2010).
II-4

*** percent of total shipments in 2008 to *** percent in 2010. For Mexican producers, internalconsumption accounts for more than *** of all Mexican shipments. Deacero reported that 60 percent ofits galvanized wire production is used in production of downstream products due to the higherprofitability in downstream products.8 Deacero also indicated that its top U.S. customer is Deaceroaffiliate Stay-Tuff, accounting for 15 percent of exports to the United States. Deacero reported thatcommercial sales decreased in 2009; however transfers to Stay-Tuff more than doubled, and resulted in a30 percent increase in sales in 2010.9
Inventory levels
Mexican producers have a somewhat limited ability to use inventories as a means of increasingshipments of galvanized steel wire to the U.S. market. The ratio of end-of-period inventories to totalshipments for the Mexican producers decreased from *** percent in 2008 to *** percent in 2010. Thisdecrease was due to total shipments increasing by a larger percentage than inventories.10
Production alternatives
Both responding Mexican producers indicated that they produce products other than galvanizedsteel wire on the equipment and machinery that is used to produce galvanized steel wire, but their abilityto shift production from alternative products to galvanized steel wire appears to be limited. Mexicanproducer *** reported that the drawing machines used in production of galvanized steel wire are alsoused for production of black wire, while its galvanizing lines are used solely for production of galvanizedsteel wire. However, even if *** were to switch drawing capacity from black wire to galvanized steelwire, it would not be able to increase production on its galvanizing line to increase production ofgalvanized steel wire. Mexican producer *** indicated that it can produce galvanized strand, componentwire for manufacturing galvanized ropes, and electro mechanical cables on the same machinery. However, since galvanized strand and galvanized ropes are downstream products produced from internalconsumption of galvanized steel wire, *** would not be able to increase production of galvanized steelwire by producing less galvanized strand and component wire for manufacturing galvanized ropes.
Supply constraints
Two responding importers of product from Mexico (***) reported refusing, declining, or beingunable to supply galvanized steel wire. Reasons for not supplying included: inability to meet customerdemand, allocations, and use of production capacity to meet internal demand.
Demand
Based on available information, it is likely that changes in the price level of galvanized steel wirewill result in a small change in the quantity of galvanized steel wire demanded. The main contributingfactor is the lack of products that can be immediately substituted for galvanized steel wire, moderated bythe high cost share of galvanized steel wire in its end uses.11
8 Conference transcript, p. 92 (Gutierrez).
9 Ibid., pp. 95-96.
10 Total shipments increased from *** short tons in 2008 to *** short tons in 2010 while inventories increasedfrom *** short tons in 2008 to *** short tons in 2010.
11 Conference transcript, p. 18 (Waite).
II-5

Demand Characteristics
As described in more detail in Part I, galvanized steel wire is used in a wide variety of end-useproducts for agricultural, automotive, construction, consumer, and industrial applications.12 Because ofthe variety of end uses for galvanized steel wire, demand for galvanized steel wire is related to overalleconomic activity. As reflected in Figure II-1, real GDP growth in United States was 0.0 in 2008, -2.6percent in 2009, and 2.9 percent in 2010.13
Changes in apparent U.S. consumption of galvanized steel wire indicates that demand decreasedbetween 2008 and 2009 and then increased in 2010, but decreased overall between 2008 and 2010. Boththe quantity and average unit value of apparent U.S. consumption decreased between 2008 and 2009 andbetween 2008 and 2010, suggesting that demand decreased between those years. However, between 2009and 2010 the quantity and average unit value of apparent U.S. consumption increased, suggesting thatdemand increased in that period.
Three of nine responding U.S. producers and eight of 18 responding importers indicated that U.S.demand had decreased since 2008. Four of nine responding U.S. producers and seven of 18 respondingimporters indicated that U.S. demand had fluctuated. The remaining two producers responded thatdemand had fluctuated and decreased, stating that demand decreased from 2008 to 2009, increased in2010, but did not reach levels as high as 2008, resulting in an overall decrease. Only one importerreported increased demand, while the remaining two importers reported that demand had not changed. Most producers and importers attributed changes in demand to changes in the overall economy. Twoimporters attributed changes in demand to changes in demand for agricultural products.
Two of four responding U.S. producers and five of 12 importers reported that demand outside theUnited States had fluctuated due to fluctuations in the economy. Only one U.S. producer and oneimporter reported that demand outside the United States decreased. Four importers and one U.S. producerreported that demand outside the United States had increased because of economic recovery ininternational markets. Two importers reported that demand outside the United States had not changed.
Business Cycles
All responding producers and importers reported that the galvanized steel wire market is subjectto some type of distinctive business cycles. In particular, all nine responding producers and 13 of 16responding importers indicated that the galvanized steel wire market is subject to the general U.S.economic cycle.
Six of nine responding producers and 10 of 17 responding importers indicated that thesedistinctive business cycles or conditions of competition for galvanized steel wire have changed sinceJanuary 2008. U.S. producers reported changes including increased imports from China and Mexico, theeffects of volatile and unpredictable markets on prices, and increased capacity of foreign producers. Importers reported changes such as increasing raw material prices, turbulence in the housing market,increased competition, and rising transportation costs.
Petitioners argue that 2008 to 2010 encapsulates an entire business cycle for galvanized wirebecause high demand in 2008 was followed by the recession in 2009 and a recovery of demand in 2010.14 Mexican respondents indicate that 2008 to 2010 cannot be considered a typical business cycle given theimpact of the 2009 recession.15
12 Petition,Vol. 1, p. 15.
13 Bureau of Economic Analysis, downloaded May 6, 2011.
14 Conference transcript, pp. 37-38 (McGrath).
15 Conference transcript, p. 165 (Campbell).
II-6

Figure II-1Real U.S. GDP growth: Percentage change, quarterly, January 2008-March 2011
Source: Bureau of Labor Statistics, http://www.bea.gov/newsreleases/national/gdp/gdpnewsrelease.htm,downloaded May 6, 2011.
Substitute Products
One of nine responding U.S. producers indicated that there are substitutes for galvanized steelwire. U.S. producer *** reported one substitute, copper coated wire for box closing staples, and alsoindicated that changes in the price of this substitute has not affected changes in the price for galvanizedsteel wire. All 17 responding importers indicated that there were no substitutes for galvanized steel wire.
Cost Share
Overall, producers and importers reported that the share of the cost of galvanized steel wire in itsend uses accounts for at least 50 percent of the price of the end-use product. Producers and importersreported that the cost of galvanized steel wire in fencing materials, stucco netting, PVC wire, wire ropeand strand, and office products is 60 to 85 percent of the cost of the final product. Responding producersalso indicated that galvanized steel wire accounts for 50 percent of the cost of the final product when usedin manufacturing poultry cages and sweeper brushes.
II-7

SUBSTITUTABILITY ISSUES
The degree of substitution between domestic and imported galvanized steel wire depends uponsuch factors as relative prices, quality (e.g., grade standards, reliability of supply, defect rates, etc.), andconditions of sale (e.g., price discounts/rebates, lead times between order and delivery dates, paymentterms, product services, etc.). Based on available data, staff believes that there is a high degree ofsubstitutability between domestically-produced galvanized steel wire and galvanized steel wire importedfrom China and Mexico.
Factors Affecting Purchasing Decisions
Petitioners indicated that price is usually the most important factor to purchasers of galvanizedsteel wire and that there are no significant quality or other non-price differences that distinguish productproduced in the United States from imports from China and Mexico.16 U.S. producer and importer DavisWire reported that galvanized steel wire is sold primarily on the basis of price and that Chinese andMexican suppliers base their prices entirely on the cost of wire rod and zinc, disregarding the diameterweight, zinc coating, and grade.17 U.S. producer Mid-South Wire indicated that quality is “a given” inthe industry, and that the number one factor in making a sale is cost, while availability or delivery alsomatters.18 U.S. producer and importer *** indicated that while factors other than price are rarelysignificant, its customers sometimes take into account lead times, the transportation network, andavailable technical support.
U.S. importer B&Z Galvanized Wire stated that quality is an important purchasing factor and thatsome imports from China are lower quality than U.S.-produced product and the imports from China thatB&Z Galvanized sells in the U.S. market.19 Mexican producer Deacero indicates that its galvanized steelwire has very reliable quality, depending on what sector and “niche” it is being sold to and that it has tomeet U.S. quality standards.20 Deacero also indicates that domestic producers prefer to sell moreprofitable galvanized steel wire products such as specialty low-carbon and high-carbon galvanized steel.21 U.S. importer *** indicated that logistics, availability of products, packaging, and requirements ofcustomers are also important in the purchasing decision.
Comparison of U.S.-Produced and Imported Galvanized Steel Wire
As shown from table II-2, two-thirds or more of the U.S. responding producers and importersindicated that galvanized steel wire produced in the United States and imported from China and Mexicoare “always” used interchangeably. All but one responding producer (***) reported that galvanized steelwire produced in the United States and imported from subject and nonsubject countries are at least“frequently” used interchangeably. At least one-half of all responding importers indicated that galvanizedsteel wire produced in the United States and imported from subject and nonsubject countries are “always”used interchangeably.
As indicated in table II-3, eight of nine responding U.S. producers reported that differences otherthan price between galvanized steel wire produced in the United States and imported from China and
16 Conference transcript, pp. 6-7 (Waite), Petitioners postconference brief, pp. 21-23.
17 Conference transcript, p. 21 (Cronin).
18 Conference transcript, pp. 56-57 (Johnson).
19 Conference transcript, p. 132 (Zhang).
20 Conference transcript, pp. 132-133 (Gutierrez).
21 Deacero’s postconference brief, p. 1.
II-8

Table II-2Galvanized steel wire: Perceived interchangeability between galvanized steel wire produced in theUnited States and in other countries, by country pairs
Country pair
Number of U.S. producersreporting
Number of U.S. importersreporting
A F S N A F S N
U.S. vs. other countries: U.S. vs. China 6 2 1 0 12 4 2 0
U.S. vs. Mexico 6 2 1 0 10 3 2 0
U.S. vs. Canada 3 2 1 0 6 3 3 0
U.S. vs. other nonsubject 1 3 1 0 6 3 2 0
Subject countries comparisons: China vs. Mexico 6 2 1 0 9 2 3 0
Nonsubject countries comparisons: China vs. Canada 3 2 1 0 7 3 3 0
China vs. other nonsubject 1 3 1 0 6 2 2 0
Mexico vs. Canada 2 2 1 0 6 3 3 0
Mexico vs. other nonsubject 1 3 1 0 6 2 2 0
Canada vs. other nonsubject 1 3 1 0 6 2 2 0
Note.--A = Always, F = Frequently, S = Sometimes, N = Never.
Source: Compiled from data submitted in response to Commission questionnaires.
Table II-3Galvanized steel wire: Perceived significant differences other than price between galvanized steelwire produced in the United States and in other countries, by country pairs
Country pair
Number of U.S. producersreporting
Number of U.S. importersreporting
A F S N A F S N
U.S. vs. other countries: U.S. vs. China 0 1 4 4 3 2 7 5
U.S. vs. Mexico 0 1 4 4 0 1 8 4
U.S. vs. Canada 0 1 3 2 1 2 6 2
U.S. vs. other nonsubject 0 1 4 0 1 1 6 2
Subject countries comparisons: China vs. Mexico 0 1 3 4 1 1 6 4
Nonsubject countries comparisons: China vs. Canada 0 1 3 1 2 2 5 1
China vs. other nonsubject 0 1 4 0 1 0 5 3
Mexico vs. Canada 0 1 3 1 1 2 6 1
Mexico vs. other nonsubject 0 1 4 0 0 1 6 2
Canada vs. other nonsubject 0 1 4 0 0 0 6 2
Note.--A = Always, F = Frequently, S = Sometimes, N = Never.
Source: Compiled from data submitted in response to Commission questionnaires.
II-9

Mexico were “sometimes” or “never” a significant factor in their sales. U.S. producer ***, however,indicated that differences other than price between galvanized steel wire produced in the United Statesand imported from China and Mexico were “frequently” a significant factor in its sales.
Twelve of 17 responding importers indicated that differences other than price between galvanizedsteel wire produced in the United States and imported from China were “sometimes” or “never” asignificant factor in sales. Of the remaining five responding importers, three reported that differencesother than price were “always” a significant factor in its sales. Only one importer, ***, provided anexplanation, which stated that quality was also a significant factor in sales. The remaining two importers,***, indicated that longer delivery times on galvanized wire from China was a reason why factors otherthan price were “frequently” a significant factor in sales. *** also reported quality, availability,reliability, and customer service as factors that made factors other than price “frequently” a significantfactor in sales. Twelve of 13 responding importers reported that differences other than price betweengalvanized steel wire produced in the United States and imported from Mexico were “sometimes” or“never” a significant factor in sales. The remaining responding importer, ***, indicated that differencesother than price were “frequently” a significant factor in sales.
U.S. importer *** indicated that imports from China cannot compete with U.S.-produced producton quality, availability, delivery times, reliability, and customer service. It also reported that compared toimports from China, imports from Mexico have much better lead times, better quality, offer bettertechnical support, and are a more reliable source of supply.
U.S. importer *** noted that Mexican producers cannot always provide consistent product qualityand currently do not offer a quality galvanized waste bale wire product. It also indicated that longlead-times and vessel delays for imports from China are a disadvantage for customers that require “just intime” delivery. *** also indicated that the quality of wire in China is not always consistent.
II-10

PART III: U.S. PRODUCERS’ PRODUCTION, SHIPMENTS, ANDEMPLOYMENT
The Commission analyzes a number of factors in making injury determinations (see 19 U.S.C. §§1677(7)(B) and 1677(7)(C)). Information on the alleged subsidies and margins of dumping was presentedearlier in this report and information on the volume and pricing of imports of the subject merchandise ispresented in Parts IV and V. Information on the other factors specified is presented in this section and/orPart VI and (except as noted) is based on the questionnaire responses of nine firms that accounted forapproximately *** percent of U.S. production of galvanized steel wire during 2010.
U.S. PRODUCERS
The Commission sent producer questionnaires to 11 possible producers. Eight of the possibleproducers completed a producer questionnaire. Two of the possible producers, ***, reported that they donot produce the subject product, while one company did not respond.1 Finally, one producer, WireCoWorldGroup, identified itself to the Commission as a producer and completed a questionnaire response.
Presented in table III-1 is a list of current domestic producers of galvanized steel wire and eachcompany’s position on the petition, production locations, related and/or affiliated firms, and share ofreported production of galvanized steel wire in 2010.
1 *** did not respond to the Commission’s producer questionnaire despite repeated follow-up by Staff. Stafftelephone interview with ***. “Petitioners estimate that *** - accounted for less than *** percent of galvanized wireproduced in the United States in 2010.” Confidential petition, p. I-5.
III-1

Table III-1Galvanized steel wire: U.S. producers, positions on the petition, U.S. production locations, relatedand/or affiliated firms, and shares of 2010 reported U.S. production
FirmPosition on
petitionU.S. production
location(s) Related and/or affiliated firms
Share of2010
production(percent)
BekaertCorporation ***
Van Buren, AK;Shelbyville, KY;and Orrville, OH
Belgo Bekaert Arames; AcmaSA; Inchalam SA; Productos deAcero SA-Prodinsa; Productorade Alambres ColombianosSAS; Ideal Alambrec SA;Procables SA; Prodac SA; andVicson. ***
Davis WireCorporation Support
Irwindale, CA;Kent, WA; andPueblo, CO
National Standard and NationalStrand ***
Johnston WireTechnologies,Inc. Support Johnstown, PA ---- ***KeystoneConsolidatedIndustries,Inc. *** Peoria, IL ---- ***
Leggett &Platt,Incorporated ***
Carthage, MO;Jacksonville, FL;and Montevallo,AL
L&P Materials Manufacturing,Inc. (d/b/a Adcom Wire) andMetrock Steel & Wire. ***
Mid-SouthWireCompany,Inc.1 Support Nashville, TN ---- ***Mount JoyWireCorporation *** Mount Joy, PA ---- ***NationalStandard Support Niles, MI Sivaco Wire Company ***OklahomaSteel & WireCompany, Inc. Support
Madill, OK; Norman, OK; andCenterville, IA
Iowa Steel & Wire Companyand Southwestern Wire, Inc. ***
WirecoWorldGroup *** Kansas City, MO Aceros Camesa *** 1 ***. 2 Petitioners estimate that *** accounted for less than *** percent of galvanized wire production in the UnitedStates in 2010.
Note.–Because of rounding, shares may not total to 100.0 percent.
Source: Compiled from data submitted in response to Commission questionnaires.
Three U.S. producers are related to foreign producers of galvanized steel wire (one of which,WireCo WorldGroup, is related to Mexican producer, Aceros Camesa). In addition, Davis Wire andNational Standard are sister companies owned by Heico Holding, Inc., which has export operations in
III-2

China. Furthermore, as discussed in greater detail below, six U.S. producers import directly or throughaffiliated companies galvanized steel wire, and three purchase galvanized steel wire from U.S. importers.
U.S. CAPACITY, PRODUCTION, AND CAPACITY UTILIZATION
U.S. producers’ capacity, production, and capacity utilization data for galvanized steel wire arepresented in table III-2. Capacity increased from 2009 to 2010 because ***.
Table III-2Galvanized steel wire: U.S. capacity, production, and capacity utilization, 2008-10
Item
Calendar year
2008 2009 2010
Capacity (short tons)1 2 809,538 809,538 897,988
Production (short tons) 534,175 442,041 492,223
Capacity utilization (percent) 66.0 54.6 54.8
1 *** reported capacity based on operating 168 hours per week and 50 weeks per year. *** reported capacity based onoperating 168 hours per week and 50 weeks per year. *** reported capacity based on operating 168 hours per week and 50weeks per year. *** reported capacity based on operating 120 hours per week and 50 weeks per year. *** reported capacitybased on operating 168 hours per week and 50 weeks per year. *** reported capacity based on operating 108 hours per weekand 50 weeks per year. *** reported capacity based on operating 168 hours per week and 50 weeks per year. *** reportedcapacity based on operating 168 hours per week and 52 weeks per year. *** reported capacity based on operating 80 hours perweek and 50 weeks per year. 2 ***.
Source: Compiled from data submitted in response to Commission questionnaires.
In the Commission’s questionnaire, U.S. producers were asked if they had experienced any plantopenings, relocations, expansions, acquisitions, consolidations, closures, or prolonged shutdowns becauseof strikes or equipment failure; curtailment of production because of shortages of materials; or any otherchange in the character of their operations or organization relation to the production of galvanized steelwire since January 1, 2008. Five firms reported such changes; their responses to this inquiry arepresented in table III-3.
Table III-3Galvanized steel wire: U.S. producers’ comments concerning changes in character of operations
* * * * * * *
U.S. PRODUCERS’ SHIPMENTS
Data on U.S. producers’ shipments of galvanized steel wire are presented in table III-4. All U.S.shipments (commercial shipments, internal consumption, and transfers to related firms) decreased overthe 2008-10 period for which data were collected. Exports were consistently less than *** percent ofoverall shipments during this period. Overall, domestic producers’ U.S. shipments, in terms of quantity,fell by 8.0 percent from 2008 to 2010, whereas export shipments by domestic producers, in terms ofquantity, fell by *** percent from 2008 to 2010. The unit value of U.S. producers’ U.S. shipmentsdecreased from $1,176 per short ton in 2008 to a period low of $978 per short ton in 2009 beforerecovering somewhat in 2010 to $1,010 per short ton.
III-3

Table III-4Galvanized steel wire: U.S. producers’ shipments, by types, 2008-10
Item
Calendar year
2008 2009 2010
Quantity (short tons)
Commercial shipments *** *** ***
Internal consumption *** *** ***
Transfers to related firms *** *** ***
U.S. shipments 528,138 441,197 486,120
Export shipments *** *** ***
Total shipments *** *** ***
Value (1,000 dollars)
Commercial shipments *** *** ***
Internal consumption *** *** ***
Transfers to related firms *** *** ***
U.S. shipments 621,088 431,710 490,880
Export shipments *** *** ***
Total shipments *** *** ***
Unit value (per short ton)
Commercial shipments *** *** ***
Internal consumption *** *** ***
Transfers to related firms *** *** ***
U.S. shipments 1,176 978 1,010
Export shipments *** *** ***
Total shipments *** *** ***
Share of quantity (percent)
Commercial shipments *** *** ***
Internal consumption *** *** ***
Transfers to related firms *** *** ***
U.S. shipments *** *** ***
Export shipments *** *** ***
Total shipments 100.0 100.0 100.0
Note.–Because of rounding, figures may not add to the totals shown.
Source: Compiled from data submitted in response to Commission questionnaires.
III-4

CAPTIVE CONSUMPTION2
Section 771(7)(C)(iv) of the Act states that–
If domestic producers internally transfer significant production of the domestic like product forthe production of a downstream article and sell significant production of the domestic likeproduct in the merchant market, and the Commission finds that–
(I) the domestic like product produced that is internally transferred forprocessing into that downstream article does not enter the merchantmarket for the domestic like product,
(II) the domestic like product is the predominant material input in theproduction of that downstream article, and
(III) the production of the domestic like product sold in the merchant market isnot generally used in the production of that downstream article,
then the Commission, in determining market share and the factors affecting financialperformance . . ., shall focus primarily on the merchant market for the domestic like product.3
Transfer and Sale of Significant Production of the Domestic Like Product
Between 2008 and 2010, non-commercial shipments4 accounted for an overall decreasing share ofthe reported quantity of U.S. producers’ U.S. shipments of galvanized steel wire, declining from ***percent in 2008 to *** percent in 2009 and to *** percent in 2010. Conversely, commercial shipmentsaccounted for an increasing share of U.S. producers’ U.S. shipments of galvanized steel wire, increasingfrom *** percent in 2008 to *** percent in 2009 and to *** percent in 2010.
Petitioners contend that the captive consumption provision does not appear to apply. Althoughgalvanized steel wire that is internally consumed for processing into downstream products does not enterthe merchant market for galvanized steel wire and although galvanized steel wire is the predominantmaterial input in the production of the downstream products, the galvanized wire sold in the merchantmarket is generally used in the production of the downstream products.5 Respondent Deacero similarlyconcluded that the captive production provision is not met because there are no significant differencesbetween galvanized steel wire used for internal production and the galvanized steel wire sold in thecommercial market.6
The First Statutory Criterion
The first requirement for application of the captive consumption provision is that the domesticlike product that is internally transferred for processing into that downstream article not enter themerchant market for the domestic like product. As shown in the tabulation below, U.S. producers
2 For purposes of this section of the report, *** is considered. Staff notes, however, that this company was unableto provide complete and timely data on shipments that it ultimately classified as internal consumption, resulting in amodest overstatement of commercial shipments.
3 19 U.S.C. § 1677(7)(C)(iv).
4 Non-commercial shipments include internal consumption as well as transfers to related parties.
5 Petitioners’ postconference brief, p. 23 fn. 99.
6 Respondent Deacero’s postconference brief, p. 6 fn. 15.
III-5

reported non-commercial shipments of galvanized steel wire for the production of various downstreamproducts and, in the case of one company, related company transfers that were re-sold “as-is.”
* * * * * * *
The Second Statutory Criterion
The second criterion of the captive consumption provision concerns whether the domestic likeproduct is the predominant material input in the production of the downstream article that is captivelyproduced. As shown in the following tabulation, with respect to the downstream articles resulting fromnon-commercial shipments, galvanized steel wire reportedly comprises at least 66 percent of the finishedcost of the various downstream products.
* * * * * * *
The Third Statutory Criterion
The third criterion of the captive consumption provision is that the production of the domesticlike product sold in the merchant market is not generally used in the production of the downstream articleproduced from the domestic like product that is internally transferred for processing. According toconference testimony, ***, Heico Wire Group (parent company of both Davis Wire and NationalStandard) and Oklahoma Steel and Wire, suggested that there is an overlap in the downstream articlesproduced from commercial and non-commercial shipments of galvanized steel wire.7 As shown in thefollowing tabulation, the most common overlap in the application of commercial and non-commercialshipments of galvanized steel wire appears to be as a fencing component.8 9
* * * * * * *
7 Conference transcript, p. 88 (Cronin: “We do both and the wire we use internally also gets sold in the market byMexico and China, by our competitors, for making fencing wire, and ag products, and stucco netting, and poultrynetting and things like that, so, but the specs are the same, our internal specs are the same as what we sell to themarket.” and Weinand: “ I concur. The quality of the wire is the same both internally and externally.”).
8 See also conference transcript, p. 22 (Cronin, fencing is “a significant market” for galvanized steel wire in theUnited States).
9 Six of the nine U.S. producers reported fencing and/or chain link weaving wire as one of the end uses of thegalvanized steel wire that their firms manufacture. Compiled from U.S. producers’ questionnaire responses.
III-6

U.S. PRODUCERS’ INVENTORIES
Table III-5 presents end-of-period inventories for galvanized steel wire. Inventories fluctuateddownward both in absolute terms and relative to production and shipments.
Table III-5Galvanized steel wire: U.S. producers’ end-of-period inventories, 2008-10
Item
Calendar year
2008 2009 2010
Inventories (short tons) 29,126 23,931 25,034
Ratio to production (percent) 5.5 5.4 5.1
Ratio to U.S. shipments (percent) 5.5 5.4 5.1
Ratio to total shipments (percent) *** *** ***
Source: Compiled from data submitted in response to Commission questionnaires.
U.S. PRODUCERS’ IMPORTS AND PURCHASES
U.S. producers’ imports and purchases of galvanized steel wire are presented in table III-6.
Table III-6Galvanized steel wire: U.S. producers’ imports and purchases, 2008-10
* * * * * * *
U.S. EMPLOYMENT, WAGES, AND PRODUCTIVITY
The U.S. producers’ aggregate employment data for galvanized steel wire are presented in tableIII-7. Employment data generally decreased throughout the period for which data were collected.
Table III-7Galvanized steel wire: U.S. producers’ employment-related data, 2008-10
Item
Calendar year
2008 2009 2010
Production and related workers (PRWs) 693 670 666
Hours worked by PRWs (1,000 hours) 1,598 1,459 1,481
Hours worked per PRW 2,306 2,178 2,224
Wages paid to PRWs (1,000 dollars) 30,521 28,789 28,501
Hourly wages $19.10 $19.73 $19.24
Productivity (short tons produced per hour) 334.3 303.0 332.4
Unit labor costs (per short ton) $57.14 $65.13 $57.90
Source: Compiled from data submitted in response to Commission questionnaires.
III-7


PART IV: U.S. IMPORTS, APPARENT CONSUMPTION, ANDMARKET SHARES
U.S. IMPORTERS
Importer questionnaires were sent to 32 firms believed to be importers of subject galvanized steelwire, as well as to all U.S. producers of galvanized steel wire.1 Usable questionnaire responses werereceived from 21 companies, representing 82.0 percent of galvanized steel wire imports from China in2010 and representing all galvanized steel wire imports from Mexico in 2010. Table IV-1 lists allresponding U.S. importers of galvanized steel wire from China and Mexico and other sources, theirlocations, and their shares of U.S. imports, in 2010.
Table IV-1Galvanized steel wire: U.S. importers, sources of imports, U.S. headquarters, and shares ofimports in 2010
Firm Headquarters Sources of importsShare of imports (percent)
China Mexico Other Total
ArcelorMittal Montreal Inc.Conjreteur,Quebec *** *** *** *** ***
B&Z Galvanized Wire Industry Covina, CA *** *** *** *** ***Bekaert Corp. Marietta, GA *** *** *** *** ***
Blue Linx Atlanta, GA *** *** *** *** ***Building Material Distributors, Inc. Galt, CA *** *** *** *** ***Deacero USA, Inc. Houston, TX *** *** *** *** ***DSR International Melville, NY *** *** *** *** ***Heico Wire Group - Davis Wire Corporation Irwindale, CA *** *** *** *** ***Itochu New York, NY *** *** *** *** ***Jims Supply Company Bakersfield, CA *** *** *** *** ***Leggett & Platt Carthage, MO *** *** *** *** ***Midwest Air Technologies Long Grove, IL *** *** *** *** ***Officemate InternationalCorporation Edison, NJ *** *** *** *** ***Oklahoma Steel Madill, OK *** *** *** *** ***
Sivaco Wire GroupMarieville,Quebec *** *** *** *** ***
Tata Steel Schaumburg, IL *** *** *** *** ***The Wire Source Alpharetta, GA *** *** *** *** ***Tree Island Wire USA, Inc. Walnut, CA *** *** *** *** ***UniwireTrading, LLC New York, NY *** *** *** *** ***WCJ Pilgrim Wire Glendale, WI *** *** *** *** ***
WireCo WorldGroupKansas City,MO *** *** *** *** ***
Total 100.0 100.0 100.0 100.0Note.–Because of rounding, figures may not add to the totals shown.
Source: Compiled from data submitted in response to Commission questionnaires.
1 The Commission sent questionnaires based on a review of data provided by U.S. Customs and Border Protection(“Customs”), to importers who may have imported one percent or greater of total imports under HTS subheadings7217.20.30 and 7217.20.45 in any one year since 2008.
IV-1

U.S. IMPORTS
Table IV-2 presents data for U.S. imports of galvanized steel wire from China and Mexico and allother sources. From 2008 to 2010, the quantity of imports from China decreased by 37.2 percent, thequantity of imports from Mexico increased by 71.4 percent, and the quantity of imports from nonsubjectsources decreased by 39.1 percent. The increase in the volume of subject imports from Mexico can beexplained in part by Deacero’s acquistion of Stay-Tuff in October of 2006. Throughout the period forwhich data were collected, ***.2 The average unit values of imports from China, Mexico, and nonsubjectsources decreased. With respect to the decrease in average unit values of imports from Mexico,Respondent Deacero explained that the decrease resulted from ***.3
Table IV-2Galvanized steel wire: U.S. imports, by sources, 2008-10
SourceCalendar year
2008 2009 2010Quantity (short tons)
China 64,487 41,743 40,486Mexico 39,325 45,335 67,410 Subject 103,811 87,078 107,897Nonsubject 120,865 79,085 73,613
Total 224,676 166,163 181,510Value (1,000 dollars)1
China 77,871 40,371 38,252Mexico 51,333 45,878 56,437 Subject 129,204 86,249 94,689Nonsubject 152,486 80,069 83,999
Total 281,690 166,318 178,688Unit value (dollars per short ton)1
China $1,208 $967 $945Mexico 1,305 1,012 837 Subject 1,245 990 878Nonsubject 1,262 1,012 1,141
Average 1,254 1,001 984Share of quantity (percent)
China 28.7 25.1 22.3Mexico 17.5 27.3 37.1 Subject 46.2 52.4 59.4Nonsubject 53.8 47.6 40.6
Total 100.0 100.0 100.0Share of value (percent)
China 27.6 24.3 21.4Mexico 18.2 27.6 31.6 Subject 45.9 51.9 53.0Nonsubject 54.1 48.1 47.0
Total 100.0 100.0 100.01 Landed, U.S. port of entry, duty-paid.
Source: Compiled from official Commerce statistics.
2 Respondent Deacero’s postconference brief, exh. 12.
3 Respondent Deacero’s postconference brief, exh. 9.
IV-2

Table IV-3 presents data for U.S. imports of galvanized steel wire from leading nonsubjectsources. The leading nonsubject country is Canada. In 2010, Canada accounted for 73.5 percent of thevolume of imports from all nonsubject sources. In 2010, Canada accounted for 29.8 percent of thevolume of imports from all sources (subject and nonsubject).
Table IV-3Galvanized steel wire: U.S. imports from leading nonsubject sources, 2008-10
SourceCalendar year
2008 2009 2010Quantity (short tons)
Canada 89,839 56,221 54,132Israel 674 8,142 8,533Brazil 6,054 2,687 2,340Ecuador 367 149 1,454India 2,115 1,534 1,419Korea 2,837 1,074 1,097Germany 884 592 946Poland 195 22 816Dominican Republic 1,586 933 590Japan 425 148 543All other 15,887 7,582 1,743
Total 120,865 79,085 73,613Value (1,000 dollars)1
Canada 112,224 58,526 62,034Israel 936 7,022 7,963Brazil 6,108 2,210 2,392Ecuador 530 167 1,316India 2,477 1,283 1,244Korea 3,807 1,348 1,417Germany 1,924 1,148 1,651Poland 248 29 1,034Dominican Republic 1,947 824 602Japan 1,013 521 1,925All other 21,271 6,991 2,421
Total 152,486 80,069 83,999Unit value (dollars per short ton)1
Canada 1,249 1,041 1,146Israel 1,388 862 933Brazil 1,009 822 1,022Ecuador 1,444 1,126 905India 1,171 836 877Korea 1,342 1,255 1,292Germany 2,176 1,940 1,745Poland 1,270 1,297 1,266Dominican Republic 1,228 883 1,021Japan 2,382 3,527 3,548All other 1,339 922 1,389
Average 1,262 1,012 1,1411 Landed, U.S. port of entry, duty-paid.
Source: Compiled from official Commerce statistics.
IV-3

CUMULATION CONSIDERATIONS
In assessing whether subject imports compete with each other and with the domestic like productwith respect to cumulation, the Commission generally has considered the following four factors: (1) thedegree of fungibility, including specific customer requirements and other quality-related questions; (2)presence of sales or offers to sell in the same geographic markets; (3) common channels of distribution;and (4) simultaneous presence in the market. Channels of distribution and fungibility (interchangeability)are discussed in Part II of this report. Additional information concerning geographical markets andsimultaneous presence in the market is presented below.4
Geographic Markets
U.S. producers reported that their sales were nationwide.5 In 2010, the largest Customs districtsfor galvanized steel wire entering the United States from China were Los Angeles, CA, San Francisco,CA, and Chicago, IL, which accounted for 35.6 percent, 13.2 percent, and 11.5 percent, respectively ofChinese galvanized steel wire entering the United States. Importers of Chinese-made galvanized steelwire reported that their geographic market area is throughout the United States. In 2010, the largestCustoms district for galvanized steel wire entering the United States from Mexico was Laredo, TX, whichaccounted for 97.1 percent of Mexican galvanized steel wire entering the United States. Deaceroaccounted for the majority of imports and its questionnaire response states that ***.
Presence in the Market
Official Commerce statistics show that U.S. imports from China and Mexico were present inevery month throughout the period for which data were collected.
NEGLIGIBILITY
The statute requires that an investigation be terminated without an injury determination if importsof the subject merchandise are found to be negligible.6 Negligible imports are generally defined in theTariff Act of 1930, as amended, as imports from a country of merchandise corresponding to a domesticlike product where such imports account for less than 3 percent of the volume of all such merchandiseimported into the United States in the most recent 12-month period for which data are available thatprecedes the filing of the petition or the initiation of the investigation. However, if there are imports ofsuch merchandise from a number of countries subject to investigations initiated on the same day thatindividually account for less than 3 percent of the total volume of the subject merchandise, and if the
4 At the conference, Petitioners requested that the Commission cumulate imports from China and Mexico becauseChinese and Mexican imports are present simultaneously throughout the U.S. market and compete for the samedistributers and end users. Conference transcript, pp. 18-19 (Waite) and Petitioners’ postconference brief, pp. 13-18. Chinese Respondents requested that the Commission exercise its discretion not to cumulate imports because ofdifferences in trends in the volume of imports, pricing strategies, size of industries in China and Mexico, anddifferent geographic concentrations. Conference transcript, pp. 113-116 (Malashevich). Respondent Deacerorequested that the Commission not cumulate imports because the Chinese industry is significantly larger than theMexican industry, the trends in import volumes differed, and incentives indicate that imports from Mexico andChina would likely compete differently in the U.S. market. Respondent Deacero’s postconference brief, pp. 22-25.
5 U.S. producers’ questionnaire responses and conference transcript, pp. 7, 152 (Waite).
6 Sections 703(a)(1), 705(b)(1), 733(a)(1), and 735(b)(1) of the Act (19 U.S.C. §§ 1671b(a)(1), 1671d(b)(1),1673b(a)(1), and 1673d(b)(1)).
IV-4

imports from those countries collectively account for more than 7 percent of the volume of all suchmerchandise imported into the United States during the applicable 12-month period, then imports fromsuch countries are deemed not to be negligible.7 Imports from China accounted for 19.5 percent of totalimports of galvanized steel wire by quantity during March 2010 through February 2011. Imports fromMexico accounted for 39.0 percent of total imports of galvanized steel wire by quantity during March2010 through February 2011.
APPARENT U.S. CONSUMPTION
Data concerning apparent U.S. consumption of galvanized steel wire during the period for whichdata were collected are shown in table IV-4a and IV-4b (merchant market only). From 2008 to 2010, thequantity of apparent U.S. consumption decreased by 11.3 percent. From 2008 to 2010 the quantity ofapparent U.S. merchant market consumption decreased by *** percent.
Table IV-4aGalvanized steel wire: U.S. shipments of domestic product, U.S. imports, and apparent U.S.consumption, 2008-10
Item
Calendar year
2008 2009 2010
Quantity (short tons)
U.S. producers’ U.S. shipments 528,138 441,197 486,120
U.S. imports from–
China 64,487 41,743 40,486
Mexico 39,325 45,335 67,410
Subject total 103,811 87,078 107,897
Nonsubject countries 120,865 79,085 73,613
Total U.S. imports 224,676 166,163 181,510
Apparent U.S. consumption 752,814 607,360 667,630
Value (1,000 dollars)
U.S. producers’ U.S. shipments 621,088 431,710 490,880
U.S. imports from--
China 77,871 40,371 38,252
Mexico 51,333 45,878 56,437
Subject total 129,204 86,249 94,689
Nonsubject countries 152,486 80,069 83,999
Total U.S. imports 281,690 166,318 178,688
Apparent U.S. consumption 902,778 598,029 669,567
Note.–Because of rounding, figures may not add to the totals shown.
Source: Compiled from data submitted in response to Commission questionnaires.
7 Section 771(24) of the Act (19 U.S.C. § 1677(24)).
IV-5

Table IV-4bGalvanized steel wire: U.S. commercial shipments of domestic product, U.S. imports, andmerchant market consumption, 2008-10
Item
Calendar year
2008 2009 2010
Quantity (short tons)
U.S. producers’ U.S. shipments *** *** ***
U.S. imports from–
China 64,487 41,743 40,486
Mexico 39,325 45,335 67,410
Subject total 103,811 87,078 107,897
Nonsubject countries1 120,865 79,085 73,613
Total U.S. imports 224,676 166,163 181,510
Apparent U.S. merchant marketconsumption *** *** ***
Value (1,000 dollars)
U.S. producers’ U.S. shipments *** *** ***
U.S. imports from--
China 77,871 40,371 38,252
Mexico 51,333 45,878 56,437
Subject total 129,204 86,249 94,689
Nonsubject countries1 152,486 80,069 83,999
Total U.S. imports 281,690 166,318 178,688
Apparent U.S. merchant marketconsumption *** *** ***
Note.–Because of rounding, figures may not add to the totals shown.
Source: Compiled from data submitted in response to Commission questionnaires.
U.S. MARKET SHARES
U.S. market share data are presented in tables IV-5a and IV-5b (merchant market only). U.S.producers’ U.S. shipments’ share of the U.S. market increased from 70.2 percentage points to 72.8percentage points between 2008 and 2010. During 2008-10, the share of the total U.S. market held byU.S. imports from China decreased by 2.5 percentage points, the share held by imports from Mexicoincreased by 4.9 percentage points, and the share held by imports from nonsubject countries declined by5.0 percentage points.
With respect to the merchant market only, U.S. producers’ U.S. shipments’ share of the U.S.market increased by *** percentage points, the share of the total U.S. market held by U.S. imports fromChina decreased by *** percentage points, the share held by imports from Mexico increased by ***percentage points, and the share held by imports from nonsubject countries declined by *** percentagepoints during the period for which data were collected.
IV-6

Table IV-5aGalvanized steel wire: U.S. consumption and market shares, 2008-10
Item
Calendar year
2008 2009 2010
Quantity (short tons)
Apparent U.S. consumption 752,814 607,360 667,630
Value (1,000 dollars)
Apparent U.S. consumption 902,778 598,029 669,567
Share of quantity (percent)
U.S. producers’ U.S. shipments 70.2 72.6 72.8
U.S. imports from--
China 8.6 6.9 6.1
Mexico 5.2 7.5 10.1
Subject total 13.8 14.3 16.2
Nonsubject countries 16.1 13.0 11.0
All countries 29.8 27.4 27.2
Share of value (percent)
U.S. producers’ U.S. shipments 68.8 72.2 73.3
U.S. imports from--
China 8.6 6.8 5.7
Mexico 5.7 7.7 8.4
Subject total 14.3 14.4 14.1
Nonsubject countries 16.9 13.4 12.5
All countries 31.2 27.8 26.7
Note.–Because of rounding, figures may not add to the totals shown.
Source: Compiled from data submitted in response to Commission questionnaires.
Table IV-5bGalvanized steel wire: U.S. merchant market consumption and market shares, 2008-10
* * * * * * *
RATIO OF IMPORTS TO U.S. PRODUCTION
Information concerning the ratio of imports to U.S. production of galvanized steel wire ispresented in table IV-6.
IV-7

Table IV-6Galvanized steel wire: U.S. production, U.S. imports, and ratios of imports to U.S. production,2008-10
Item
Calendar year
2008 2009 2010
Quantity (short tons)
U.S. production 534,175 442,041 492,223
Imports from:
China 64,487 41,743 40,486
Mexico 39,325 45,335 67,410
Subject total 103,811 87,078 107,897
Nonsubject countries 120,865 79,085 73,613
Total imports 224,676 166,163 181,510
Ratio of U.S. imports to production (percent)
Imports from:
China 12.1 9.4 8.2
Mexico 7.4 10.3 13.7
Subject total 19.4 19.7 21.9
Nonsubject countries 22.6 17.9 15.0
Total imports 42.1 37.6 36.9
Note.–Because of rounding, figures may not add to the totals shown.
Source: Compiled from data submitted in response to Commission questionnaires.
IV-8

PART V: PRICING AND RELATED INFORMATION
FACTORS AFFECTING PRICES
Raw Material Costs
Raw material costs accounted for approximately 71 percent of U.S. producers’ total cost of goodsduring 2010. Per-unit raw material costs decreased by 21 percent between 2008 and 2010 from $857 pershort ton in 2008 to $676 per short ton in 2010. Wire rod and zinc are the main raw materials used toproduce galvanized steel wire. The monthly average price of wire rod increased by 17 percent during2008, decreased by 21 percent during 2009, and then increased by 25 percent during 2010 (see figure V-1). The monthly price of zinc fluctuated widely between 2008 and 2010; decreasing by almost 50 percent during 2008, then recovering to near its January 2008 level by January 2010. In 2010, zinc pricesfluctuated but ended the year at about the same levels as January 2010.
U.S. Inland Transportation Costs
Transportation costs for U.S. inland shipments of galvanized steel wire generally account for asmall-to-moderate share of the delivered price of these products. U.S. producers reported that the costsranged from 1 to 7 percent of the delivered price of galvanized steel wire, while most U.S. importersreported that the costs ranged from 1 to 13 percent. Seven of nine responding U.S. producers and five of15 responding importers reported making at least 70 percent of their sales within 101 to 1,000 miles oftheir storage or production facilities. Two responding producers (***) and six responding importersreported making at least 70 percent of their sales within 100 miles of their storage or production facilities.
PRICING PRACTICES
Pricing Methods
All producers and most importers reported using transaction-by-transaction negotiations for atleast some of their sales of galvanized steel wire. In addition, one producer and two importers reportedusing contracts for at least some of their sales, and two producers and two importers reported using pricelists. Three of eight responding producers and 11 of 16 responding importers reported selling on adelivered basis only; two producers and three importers reported selling on a f.o.b basis only; and theremaining responding producers and importers reported selling on both f.o.b. and delivered bases. Six ofeight responding producers and eight of 16 importers reported that at least 80 percent of their sales ofgalvanized steel wire are made-to-order. Two responding producers and three importers reported that atleast 75 percent of their sales are from inventory.
Seven of nine responding producers and 12 of 17 responding importers reported making at least70 percent of their sales on a spot basis and two producers (***) and five importers reported making atleast 65 percent of their sales on a short-term contract basis.
V-1

Figure V-1Galvanized steel wire: Average wire rod and zinc prices, by month, January 2008-December 2010
Source: Zinc cash LME daily official monthly average price, Metal Bulletin, downloaded April 6, 2011,Wire rod (mesh), North American price, MEPS, http://www.meps.co.uk/world-price.htm, downloaded April4, 2011.
V-2

Lead Times
Nearly all U.S. producers reported lead times from inventory of up to one week and lead times forsales produced-to-order of three days to six weeks. Importers’ lead times for delivery ranged from two toten days on sales from U.S. inventories and, except for one importer, sales of product produced-to-orderranged from 30 to 120 days. Mexican producer Deacero reported that its lead time for produced-to-orderproduct was ***. All responding producers and importers except for *** reported that they generallyarrange for the transportation to their customers’ locations.
Sales Terms and Discounts
Three producers and six importers reported the use of quantity discounts; one producer and twoimporters reported using annual volume discounts; and five producers and 12 importers reported havingno discount policy. In addition, three producers and five importers reported using other types ofdiscounts including customer specific discounts and rebates, discounts for particular end uses, anddiscounts for marketing expenses.
PRICE DATA
The Commission requested U.S. producers and importers of galvanized steel wire to providequarterly data for quantity and f.o.b. value for the following galvanized steel wire products that wereshipped to unrelated U.S. customers during 2008-10:
Product 1.–0.148-inch (3.76mm) diameter, low carbon galvanized wire, Class 1 (zinc)coating, for industrial use.
Product 2.–0.085-inch (2.16mm) diameter, low carbon galvanized wire, Commercial coating,for industrial use.
Eight U.S. producers, five importers of galvanized steel wire from China, one importer ofgalvanized steel wire from Mexico, and three importers of galvanized steel wire from Canada providedusable pricing data for sales of the requested products, although not all firms reported pricing for allproducts for all quarters.1 Pricing data reported by these firms accounted for approximately 5 percent ofU.S. producers’ commercial shipments of galvanized steel wire, 6 percent of U.S. shipments of subjectimports from China, and *** percent of U.S. shipments of subject imports from Mexico in 2010.
1 Several producers and importers reported data for product that did not exactly meet the product specificationsbut which they felt was competitive with the specified product. Importer *** reported data for imports from Chinaof high carbon products that had a diameter of 0.104 inches (2.64mm) for product 1 and a diameter of 0.080 inches(2.03mm) for product 2. Importer *** reported data for imports from Canada with a diameter ranging from 0.080inches to 0.090 inches for product 2. U.S. producer *** reported a 0.1480 inch diameter product (***) for product 1. Importer *** reported data for imports from China with a diameter of 0.086 inches for product 2. U.S. producer ***reported data for a 0.915 inch diameter product for product 1. U.S. importer *** reported data for products withdiameters of 2.03mm, 2.33mm, and 3.63mm for product 1.
V-3

Price Trends
Price data are shown in tables V-1 to V-2 and figure V-2, and nonsubject country price data arepresented in appendix D. Price trend summary data are presented in table V-3. During 2008-10, forproduct 1 and product 2, respectively, domestic prices increased by *** and *** percent, Mexican pricesincreased by *** and *** percent, and Chinese prices decreased by *** and increased by *** percent.2
Price Comparisons
Margins of underselling and overselling are presented in table V-4. As can be seen from thetable, prices for galvanized steel wire imported from China were below those for U.S.-producedgalvanized steel wire in 8 of 17 instances; margins of underselling ranged from 3.1 to 44.2 percent. In theremaining 9 instances, prices for galvanized steel wire imported from China were above those for U.S.-produced galvanized steel wire; margins of overselling ranged from 3.1 to 30.5 percent.3 Prices forgalvanized steel wire imported from Mexico were below those for U.S.-produced galvanized steel wire inall 21 possible comparisons; margins of underselling ranged from 5.8 to 32.6 percent.
2 The relatively low price for Chinese-produced product 2 in the fourth quarter of 2008 was because ***. Therelatively high price for Chinese-produced product 2 in the first quarter of 2009 was because the only importerreporting price data was ***.
3 Price data for product 2 reported by U.S. importer *** was not included in tables V-2 to V-4. Petitionerscontend that the price data for product 2 reported by U.S. importer *** is at a different level of trade or a data errorbecause it is “substantially higher” than all other Chinese and Mexican importers. It also notes that *** is related to*** which it characterizes as a *** of products made from galvanized steel wire. Petitioners’ postconference brief,p. 31. *** indicated that its price data were for commercial shipments and is an f.o.b. value. Staff interview with*** of ***, April 28, 2011. If the data for *** is included, prices for galvanized steel wire imported from China arebelow those for U.S.-produced galvanized steel wire in 7 of 20 instances with margins of underselling ranging from1.8 to 33.5 percent. In the remaining 13 instances, prices for galvanized steel wire imported from China are abovethose for U.S.-produced galvanized steel wire; margins of overselling range from 4.4 to 37.3 percent.
V-4

Table V-1Galvanized steel wire: Weighted-average f.o.b. prices and quantities of domestic and importedproduct 11 and margins of underselling/(overselling), by quarters, 2008-10
Period
United States China Mexico
Price (per short
ton)
Quantity(shorttons)
Price (per
shortton)
Quantity(shorttons)
Margin(percent)
Price (per
shortton)
Quantity(shorttons)
Margin(percent)
2008: Jan.-Mar. $*** *** -- 0 -- $*** *** ***
Apr.-June 1,225 1,470 -- 0 -- *** *** ***
July-Sept. 1,351 1,150 $*** *** *** -- 0 --
Oct.-Dec. 1,382 565 -- 0 -- *** *** ***
2009: Jan.-Mar. 1,110 657 *** *** *** *** *** ***
Apr.-June 946 849 *** *** *** *** *** ***
July-Sept. 888 1,058 -- 0 -- *** *** ***
Oct.-Dec. 959 393 *** *** *** *** *** ***
2010: Jan.-Mar. 1,018 785 *** *** *** *** *** ***
Apr.-June 1,139 767 *** *** *** -- 0 --
July-Sept. 960 1,018 *** *** *** *** *** ***
Oct.-Dec. 924 1,040 *** *** *** *** *** ***
1 Product 1: 0.148-inch (3.76mm) diameter, low carbon galvanized wire, Class 1 (zinc) coating, for industrialuse.
Source: Compiled from data submitted in response to Commission questionnaires.
V-5

Table V-2Galvanized Steel Wire: Weighted-average f.o.b. prices and quantities of domestic and importedproduct 21 and margins of underselling/(overselling), by quarters, 2008-10
Period
United States China Mexico
Price (per short
ton)
Quantity(shorttons)
Price (per
shortton)
Quantity(shorttons)
Margin(percent)
Price (per
shortton)
Quantity(shorttons)
Margin(percent)
2008: Jan.-Mar. $884 1,457 -- 0 -- $*** *** ***
Apr.-June 1,086 1,138 -- 0 -- *** *** ***
July-Sept. 1,383 1,223 -- 0 -- *** *** ***
Oct.-Dec. 1,282 1,035 $*** *** *** *** *** ***
2009: Jan.-Mar. *** *** *** *** *** -- 0 --
Apr.-June 929 1,155 *** *** *** *** *** ***
July-Sept. 871 1,312 *** *** *** *** *** ***
Oct.-Dec. 900 636 *** *** *** *** *** ***
2010: Jan.-Mar. 882 1,920 855 55 3.1 *** *** ***
Apr.-June 940 2,831 *** *** *** *** *** ***
July-Sept. *** *** *** *** *** *** *** ***
Oct.-Dec. *** *** *** *** *** *** *** ***
1 Product 2: 0.085-inch (2.16mm) diameter, low carbon galvanized wire, Commercial coating, for industrial use.
Source: Compiled from data submitted in response to Commission questionnaires.
Figure V-2Galvanized steel wire: Weighted-average f.o.b. prices and quantities of domestic and importedproduct, by quarters, 2008-10
* * * * * * *
V-6

Table V-3Galvanized steel wire: Summary of weighted-average f.o.b. prices for products 1 and 2 from theUnited States, China, and Mexico
ItemNumber ofquarters
Low price (per ton)
High price(per ton)
Change in price1
(percent)
Product 1
United States 12 $*** $*** ***
China 8 *** *** ***
Mexico 10 *** *** ***
Product 2
United States 12 *** *** ***
China 9 *** *** ***
Mexico 11 *** *** *** 1 Percentage change (based on unrounded data) from first quarter 2008 to fourth quarter 2010, except for product1 from China (percentage change from third quarter 2008 to fourth quarter 2010) and product 2 from China(percentage change from fourth quarter 2008 to fourth quarter 2010). Thus, the percentage change is notnecessarily calculated from the high and low prices shown in this table.
Source: Compiled from data submitted in response to Commission questionnaires.
Table V-4Galvanized steel wire: Instances of underselling/overselling and the range and average ofmargins, 2008-10
Source
Underselling Overselling
Number ofinstances
Range(percent)
Averagemargin
(percent)Number ofinstances
Range(percent)
Averagemargin
(percent)
China 8 3.1 to 44.2 17.2 9 3.1 to 30.5 11.0
Mexico 21 5.8 to 32.6 16.9 0 - -
Total 29 3.1 to 44.2 17.0 9 3.1 to 30.5 11.0
Source: Compiled from data submitted in response to Commission questionnaires.
LOST SALES AND LOST REVENUES
The Commission requested U.S. producers of galvanized steel wire to report any instances of lostsales or revenues they experienced due to competition from imports of galvanized steel wire from Chinaand Mexico since January 2008. Petitioners provided allegations of both lost sales and lost revenues inthe petition. *** responding non-petitioning U.S. producers reported that they had to either reduce pricesand roll back announced price increases or that they had lost sales to imports from China and Mexico. One of these producers provided additional lost revenue and lost sales allegations. The 32 lost salesallegations made by producers totaled $10.6 million and involved more than 10,900 short tons ofgalvanized steel wire and the 12 lost revenues allegations totaled $542,000 and involved more than 7,200
V-7

short tons of galvanized steel wire.4 Staff attempted to contact all of these purchasers, and a summary ofthe information obtained follows (tables V-5 and V-6).5
Table V-5Galvanized steel wire: U.S. producers’ lost sales allegations
* * * * * * *
Table V-6Galvanized steel wire: U.S. producers’ lost revenue allegations
* * * * * * *
* * * * * * *6
4 ***.
5 ***.
6 ***.
V-8

PART VI: FINANCIAL CONDITION OF U.S. PRODUCERS
BACKGROUND
Nine producers,1 provided usable financial data for their operations on their galvanized steel wireoperations. These firms accounted for the majority of the domestic industry’s production/sales volumeduring 2010. *** reported internal consumption of galvanized steel wire, and these sales accounted forapproximately *** percent of the industry’s 2010 sales values.2 *** reported transfer sales to relatedparties, which accounted for approximately *** percent of the combined 2010 sales value. Overall, morethan 45 percent of annual sales in every year (*** percent in 2008, *** percent in 2009, and *** percentin 2010, respectively) were either internally consumed and/or transferred to related firms.
OPERATIONS ON GALVANIZED STEEL WIRE
Aggregate income-and-loss data for the U.S. producers are presented in table VI-1. Tosummarize, the overall financial condition of the domestic galvanized steel wire industry worsened from2008 to 2009, both in terms of sales quantities and values and profitability. The domestic industry’s operating income of $18.5 million in 2008 declined to an operating loss of $6.1 million in 2009, primarilyreflecting lower unit values for net sales. From 2009 to 2010, both sales quantities and values increasedand the domestic industry’s operating loss decreased from $6.1 million to $0.5 million, as unit values fornet sales increased. Most of the financial deterioration occurred from 2008 to 2009, as sales quantity,sales value, and profitability all fell, and the moderate operating income became an operating loss of over$6 million. Decreases in per-unit sales values ($222 per short ton) were much higher than decreases inper-unit total costs, i.e., cost of goods sold (“COGS”) and selling, general, and administrative (“SG&A”)expenses combined ($173 per short ton, primarily resulting from lower COGS, especially lower rawmaterials cost). From 2009 to 2010, both sales quantities and values increased while both per-unit salesvalue and per-unit total cost increased. However, since increases in per-unit sales prices ($28 per shortton) exceeded increases in per-unit total costs ($15 per short ton), the per-unit operating loss in 2010 was$1 per short ton compared to a per-unit operating loss of $14 in 2009. Two producers reported operatinglosses in 2008, compared to four producers in 2009 and 2010.
1 The producer with a fiscal year ending other than in December is ***.
2 Per-unit values of internal consumption were the same (or even slightly higher) as per-unit values of commercialsales of each of these producers for all three years. ***’s revisions to report some amounts of internal consumptionare not reflected in this report because the revisions were incomplete and submitted too late. However, thecompany’s commercial sales and internal consumption were very small, and did not have a material impact on theaggregate financial data presented in this chapter.
VI-1

Table VI-1Galvanized steel wire: Results of operations of U.S. producers, fiscal years 2008-10
Item
Fiscal year
2008 2009 2010
Net sales: Quantity (short tons)
Commercial sales *** *** ***
Internal consumption *** *** ***
Transfers to related firms *** *** ***
Total net sales 532,841 443,562 489,294
Net sales: Value ($1,000)
Commercial sales *** *** ***
Internal consumption *** *** ***
Transfers to related firms *** *** ***
Total net sales 639,237 433,898 492,052
COGS 593,574 414,201 463,957
Gross profit 45,663 19,697 28,095
SG&A expenses 27,185 25,790 28,618
Operating income (loss) 18,478 (6,093) (523)
Interest expense 2,549 1,798 1,929
Other expense 1,702 1,581 2,021
Other income 183 308 0
Net income (loss) 14,410 (9,164) (4,473)
Depreciation/amortization 12,456 10,908 10,322
Cash flow 26,866 1,744 5,849Table continued on next page.
VI-2

Table VI-1--ContinuedGalvanized steel wire: Results of operations of U.S. producers, fiscal years 2008-10
ItemFiscal year
2008 2009 2010
Unit value (per short ton)
Net sales $1,200 $978 $1,006
COGS 1,114 934 948
Gross profit 86 44 57
SG&A expenses 51 58 58
Operating income (loss) 35 (14) (1)
Ratio to net sales (percent)
COGS 92.9 95.5 94.3
Gross profit 7.1 4.5 5.7
SG&A expenses 4.3 5.9 5.8
Operating income (loss) 2.9 (1.4) (0.1)
Number of firms reporting
Operating losses 2 4 4
Data 9 9 9
Source: Compiled from data submitted in response to Commission questionnaires.
The results of the responding U.S. producers’ commercial sales only are presented in table VI-2. The results of operations based on commercial sales only are different from the results of operationsbased on all sales. Specifically, the results of commercial sales were more profitable (operating incomemargins were *** percent, *** percent, and *** percent in 2008, 2009, and 2010, respectively) comparedto the results of the combined sales.
Table VI-2Galvanized steel wire: Results of operations of U.S. producers (commercial sales only), fiscalyears 2008-10
* * * * * * *
In aggregate, per-unit sales values of internal consumption and transfer sales were generallylower than per-unit sales values of commercial sales, as were per-unit COGS, gross margin, and operatingincome. This may be attributable to differences in product mix, physical characteristics, costs, or qualitybetween the products sold in merchant market and those internally consumed or transferred to relatedfirms. However, per-unit sales values of internal consumption for each individual producer reportingsuch transactions were the same (or even slightly higher) as per-unit sales values of commercial sales.
Selected company-by-company data are presented in table VI-3. Total net sales (quantities and
values), per-unit values (sales, COGS, SG&A, and operating income), operating income, and the ratio ofoperating income (loss) to net sales are presented in this table on a firm-by-firm basis. Virtually everycompany reported the same experience – from 2008 to 2009 sales quantities and values, unit sales values,
VI-3
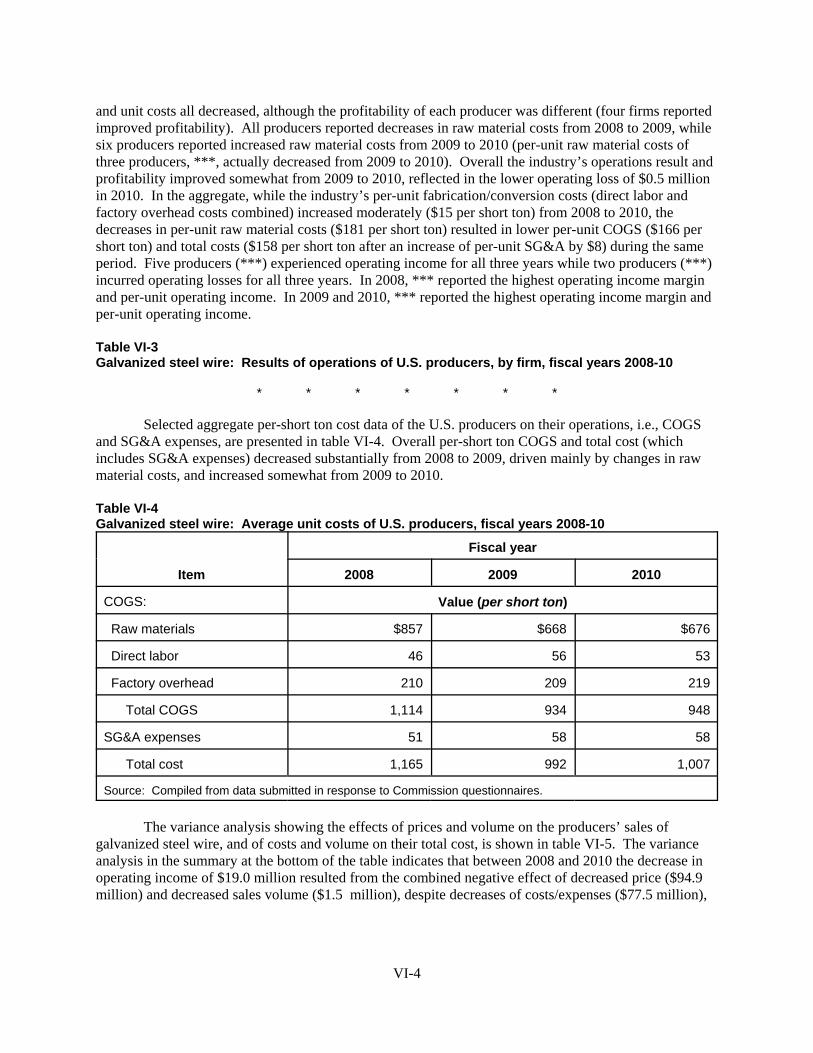
and unit costs all decreased, although the profitability of each producer was different (four firms reportedimproved profitability). All producers reported decreases in raw material costs from 2008 to 2009, whilesix producers reported increased raw material costs from 2009 to 2010 (per-unit raw material costs ofthree producers, ***, actually decreased from 2009 to 2010). Overall the industry’s operations result andprofitability improved somewhat from 2009 to 2010, reflected in the lower operating loss of $0.5 millionin 2010. In the aggregate, while the industry’s per-unit fabrication/conversion costs (direct labor andfactory overhead costs combined) increased moderately ($15 per short ton) from 2008 to 2010, thedecreases in per-unit raw material costs ($181 per short ton) resulted in lower per-unit COGS ($166 pershort ton) and total costs ($158 per short ton after an increase of per-unit SG&A by $8) during the sameperiod. Five producers (***) experienced operating income for all three years while two producers (***)incurred operating losses for all three years. In 2008, *** reported the highest operating income marginand per-unit operating income. In 2009 and 2010, *** reported the highest operating income margin andper-unit operating income.
Table VI-3Galvanized steel wire: Results of operations of U.S. producers, by firm, fiscal years 2008-10
* * * * * * *
Selected aggregate per-short ton cost data of the U.S. producers on their operations, i.e., COGSand SG&A expenses, are presented in table VI-4. Overall per-short ton COGS and total cost (whichincludes SG&A expenses) decreased substantially from 2008 to 2009, driven mainly by changes in rawmaterial costs, and increased somewhat from 2009 to 2010.
Table VI-4Galvanized steel wire: Average unit costs of U.S. producers, fiscal years 2008-10
Item
Fiscal year
2008 2009 2010
COGS: Value (per short ton)
Raw materials $857 $668 $676
Direct labor 46 56 53
Factory overhead 210 209 219
Total COGS 1,114 934 948
SG&A expenses 51 58 58
Total cost 1,165 992 1,007
Source: Compiled from data submitted in response to Commission questionnaires.
The variance analysis showing the effects of prices and volume on the producers’ sales ofgalvanized steel wire, and of costs and volume on their total cost, is shown in table VI-5. The varianceanalysis in the summary at the bottom of the table indicates that between 2008 and 2010 the decrease inoperating income of $19.0 million resulted from the combined negative effect of decreased price ($94.9million) and decreased sales volume ($1.5 million), despite decreases of costs/expenses ($77.5 million),
VI-4

as the negative effect of decreased prices from 2008 to 2010 more than offset the positive effect ofdecreased costs and expenses.3
Table VI-5Galvanized steel wire: Variance analysis of operations of U.S. producers, fiscal years 2008-10
Item
Between fiscal years
2008-10 2008-09 2009-10
Value ($1,000)
Net sales:
Price variance (94,943) (98,233) 13,418
Volume variance (52,242) (107,106) 44,736
Total net sales variance (147,185) (205,339) 58,154
Cost of sales:
Cost variance 81,107 79,918 (7,051)
Volume variance 48,510 99,455 (42,705)
Total cost variance 129,617 179,373 (49,756)
Gross profit variance (17,568) (25,966) 8,398
SG&A expenses:
Expense variance (3,655) (3,160) (169)
Volume variance 2,222 4,555 (2,659)
Total SG&A variance (1,433) 1,395 (2,828)
Operating income variance (19,001) (24,571) 5,570
Summarized as:
Price variance (94,943) (98,233) 13,418
Net cost/expense variance 77,452 76,758 (7,220)
Net volume variance (1,510) (3,096) (628)
Note.--Unfavorable variances are shown in parentheses; all others are favorable. The data are comparable tochanges in operating income as presented in table VI-1.
Source: Compiled from data submitted in response to Commission questionnaires.
3 The Commission’s variance analysis is calculated in three parts: sales variance, COGS variance, and SG&Aexpenses variance. Each part consists of a price variance (in the case of the sales variance) or a cost variance (in thecase of the COGS and SG&A variances) and a volume variance. The sales or cost variance is calculated as thechange in unit price/cost times the new volume, while the volume variance is calculated as the change in volumetimes the old unit price/cost. Summarized at the bottom of the respective tables, the price variance is from sales, thecost/expense variance is the sum of those items from COGS and SG&A, respectively, and the net volume variance isthe sum of the price, COGS, and SG&A volume variance. All things being equal, a stable overall product mixgenerally enhances the utility of the Commission’s variance analysis.
VI-5

CAPITAL EXPENDITURES AND RESEARCH AND DEVELOPMENT EXPENSES
The responding firms’ aggregate data on capital expenditures and research and development(“R&D”) expenses are presented in table VI-6. Even though all U.S. producers except *** reportedcapital expenditures, only ***, incurred substantial amounts of capital expenditures during the period forwhich data were collected. Capital expenditures increased continuously and substantially between 2008to 2010, due primarily to *** capital investments, especially in 2010.4 Data for capital expenditures on afirm-by-firm basis are shown in table VI-7. R&D expenses remained relatively low and the same throughout this period. *** reported R&D expenses.
Table VI-6Galvanized steel wire: Capital expenditures and R&D expenses by U.S. producers, fiscal years2008-10
* * * * * * *
Table VI-7Galvanized steel wire: Capital expenditures by U.S. producers, by firms, fiscal years 2008-10
* * * * * * *
ASSETS AND RETURN ON INVESTMENT
U.S. producers were requested to provide data on their total net assets used in the production andsales of galvanized steel wire during the period for which data were collected to assess their return oninvestment (“ROI”). The total value of assets remained relatively the same level between 2008 and 2010. The return on the assets turned from positive to negative from 2008 to 2009 as an operating incometurned to an operating loss and remained negative (but improved) in 2010. Even though the combinedtotal net assets remained relatively the same, total net assets of *** decreased substantially over theperiod examined, because there was no substantial capital acquisition (no major expansion or improvingproductive facilities) and some assets were fully depreciated during the same period.5 The trend of ROIover the period was the same as the trend of the operating income margin shown in table VI-1.
4 ***. E-mail from ***, April 28, 2011.
5 ***. E-mails from ***, April 26, 2011.
VI-6
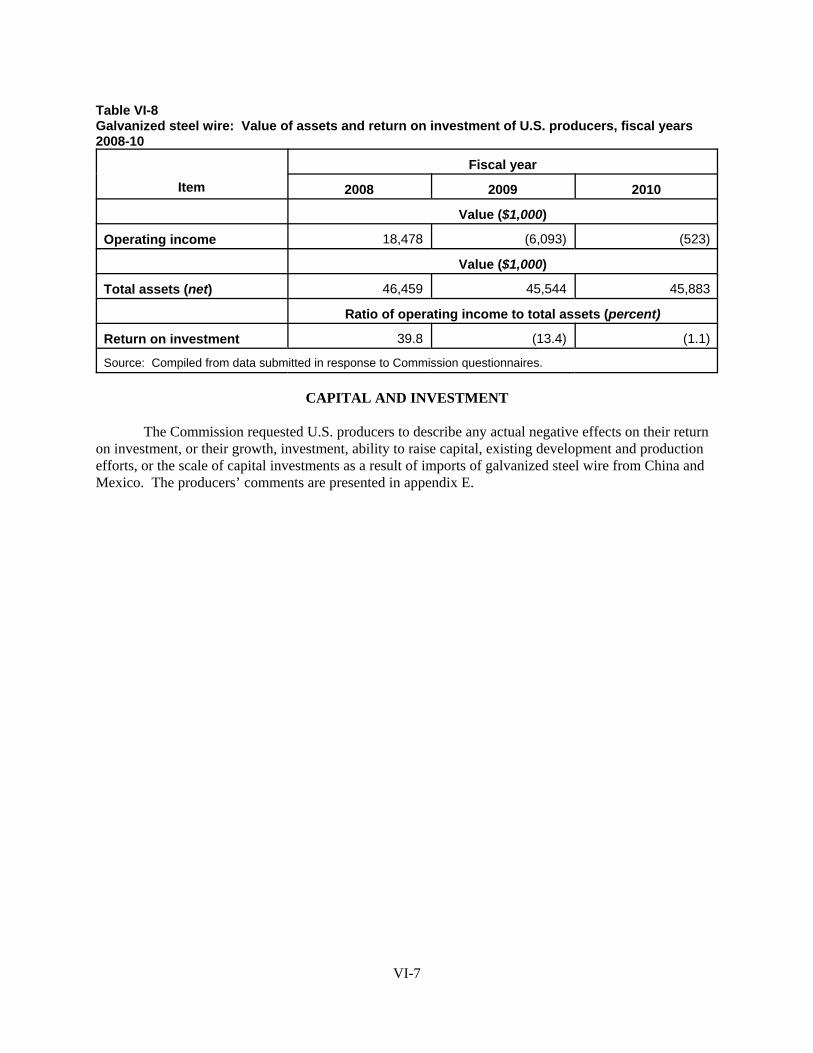
Table VI-8Galvanized steel wire: Value of assets and return on investment of U.S. producers, fiscal years2008-10
Item
Fiscal year
2008 2009 2010
Value ($1,000)
Operating income 18,478 (6,093) (523)
Value ($1,000)
Total assets (net) 46,459 45,544 45,883
Ratio of operating income to total assets (percent)
Return on investment 39.8 (13.4) (1.1)
Source: Compiled from data submitted in response to Commission questionnaires.
CAPITAL AND INVESTMENT
The Commission requested U.S. producers to describe any actual negative effects on their returnon investment, or their growth, investment, ability to raise capital, existing development and productionefforts, or the scale of capital investments as a result of imports of galvanized steel wire from China andMexico. The producers’ comments are presented in appendix E.
VI-7


PART VII: THREAT CONSIDERATIONS AND INFORMATION ONNONSUBJECT COUNTRIES
The Commission analyzes a number of factors in making threat determinations (see 19 U.S.C. §1677(7)(F)(i)). Information on the nature of the alleged subsidies was presented earlier in this report;information on the volume and pricing of imports of the subject merchandise is presented in Parts IV andV; and information on the effects of imports of the subject merchandise on U.S. producers’ existingdevelopment and production efforts is presented in Part VI. Information on inventories of the subjectmerchandise; foreign producers’ operations, including the potential for “product-shifting;” any otherthreat indicators, if applicable; and any dumping in third-country markets, follows. Also presented in thissection of the report is information obtained for consideration by the Commission on nonsubjectcountries.
THE INDUSTRY IN CHINA
Overview
The petition identified 279 producers of galvanized steel wire in China.1 The Commissionreceived questionnaire responses from 18 firms. These firms’ reported exports to the United States in2010 were equivalent to 57.7 percent of U.S. imports of galvanized steel wire from China in that sameyear. Table VII-1 provides information on the 18 Chinese firms that supplied data. In general Chinesefirms reported their principal non-U.S. export markets to be Canada, the European Union, Japan, Korea,the Middle East, South America, and Vietnam.
Table VII-1Galvanized steel wire: Chinese firms’ reported 2010 production, exports to the United States, andshare of exports to the United States
* * * * * * *
Operations on Galvanized Steel Wire
Table VII-2 presents data for the 18 responding firms during 2008-10 and forecasts for 2011 and2012. *** was the largest reporting Chinese producer, reporting *** short tons of production ofgalvanized steel wire in 2010. *** were the largest reporting Chinese exporters, accounting forapproximately *** percent and *** percent, respectively, of reported Chinese galvanized steel wireexports to the United States in 2010. The responding Chinese foreign producers did not report producingother products on the same equipment used in the production of galvanized steel wire. Several Chineseproducers reported changes to their labor agreements resulting in an increase of wages. At the staffconference, witness testimony described a labor shortage in China.2
The reported aggregate capacity of the responding Chinese producers of galvanized steel wireincreased throughout the period for which data were collected. Capacity utilization fell from 2008 to2009, but recovered somewhat in 2010 as Chinese production levels reached their highest point in thethree year period. Reported capacity utilization was 92.8 percent in 2008, 82.9 percent in 2009, and 86.6
1 The Commission issued foreign producer questionnaires to firms that accounted for 80 percent or more of U.S.imports of galvanized steel wire from China in each year between 2008 and 2010 under HTS subheadings7217.20.30 and 7217.20.45 according to confidential Customs data.
2 Conference transcript, pp. 121-122, 140-141 (Zhang).
VII-1

percent in 2010. Chinese home market shipments and internal consumption increased between 2008 and2010, while overall exports declined largely reflecting reduced export to the United States. SeveralChinese producers reported that exports to the United States are projected to decline because of theunpredictability of the export market, the slow recovery of the world economy, and/or the initiation ofthese investigations.
Table VII-2Galvanized steel wire: Chinese production capacity, production, shipments, and inventories, 2008-10 and projected 2011-12
Item
Actual experience Projections
2008 2009 2010 2011 2012
Quantity (short tons)
Capacity 246,902 254,330 273,075 267,970 264,970
Production1 229,195 210,964 236,619 231,746 231,135
End of period inventories 7,928 6,738 7,931 6,876 6,866
Shipments:
Internal consumption 64,942 75,455 73,210 72,247 72,250
Home market 87,753 81,987 101,347 103,740 103,340
Exports to--
The United States 37,631 21,762 23,377 15,417 12,190
All other markets 53,606 47,822 56,082 54,563 53,365
Total exports 91,237 69,584 79,459 69,980 65,555
Total shipments 243,932 227,026 254,016 245,967 241,145
Ratios and shares (percent)
Capacity utilization 92.8 82.9 86.6 86.5 87.2
Inventories to production 3.5 3.2 3.4 3.0 3.0
Inventories to total shipments 3.3 3.0 3.1 2.8 2.8
Share of total quantity of shipments:
Internal consumption 26.6 33.2 28.8 29.4 30.0
Home market 36.0 36.1 39.9 42.2 42.9
Exports to--
The United States 15.4 9.6 9.2 6.3 5.1
All other markets 22.0 21.1 22.1 22.2 22.1
All export markets 37.4 30.7 31.3 28.5 27.2
1 ***. Email from ***, May 2, 2010.
Source: Compiled from data submitted in response to Commission questionnaires.
VII-2

THE INDUSTRY IN MEXICO
Overview
The petition identified one primary producer of galvanized steel wire in Mexico.3 TheCommission received questionnaire responses from two firms. These firms’ reported exports to theUnited States in 2010 were equivalent to *** percent of U.S. imports of galvanized steel wire fromMexico in that same year. Table VII-3 provides information on the two Mexican firms that supplieddata. In addition to exporting to the United States, Aceros Camesa’s principal export markets include ***and Deacero’s principal export markets include ***.
Table VII-3Galvanized steel wire: Mexican firms’ reported 2010 production, exports to the United States, andshare of exports to the United States
* * * * * * *
Operations on Galvanized Steel Wire
Table VII-4 present data for the two responding firms during 2008-10 and forecasts for 2011 and2012. Deacero S.A. de C.V. (“Deacero”) accounted for *** percent of reported Mexican production ofgalvanized steel wire in 2010. According to Deacero, it is the largest Mexican producer and the onlyrelevant exporter to the United States.4
Both responding Mexican producers reported ***. ***. ***. ***. ***. As a result, capacity*** throughout the period for which data were collected and ***. The ***. Capacity utilizationexceeded *** percent throughout the period for which data were collected. Internal consumptionaccounted for more than *** percent of shipments annually throughout the period examined. This isprojected to ***. Total exports increased throughout the period for which data were collected, primarilyreflecting increased in exports to the United States.
Table VII-4Galvanized steel wire: Mexican production capacity, production, shipments, and inventories, 2008-10 and projected 2011-12
* * * * * * *
U.S. INVENTORIES OF PRODUCT FROM CHINA AND MEXICO
Table VII-5 present data for U.S. importers’ end-of-period inventories of imports during 2008-10. During 2008-10, inventories of imports from China decreased by 45.7 percent and inventories of importsfrom Mexico increased by *** percent.
3 Respondent Deacero reported that the Mexican industry consists of a total of only six companies: Deacero,Camesa, Villacero, Cecsamex, Grupo Acerero Hidlago, and Alambres Potosi. Conference transcript, p. 88(Gutierrez) and Respondent Deacero’s postconference brief, p. 23.
4 Conference transcript, p. 91 (Gutierrez).
VII-3

Table VII-5Galvanized steel wire: U.S. importers’ end-of-period inventories of imports, 2008-10
Item
Calendar year
2008 2009 2010
China:
Inventories (short tons) 11,602 6,508 6,298
Ratio of inventories to imports (percent) 23.8 24.2 19.0
Ratio to U.S. shipments of imports (percent) 21.1 20.4 19.6
Mexico:
Inventories (short tons) *** *** ***
Ratio of inventories to imports (percent) *** *** ***
Ratio to U.S. shipments of imports (percent) *** *** ***
Subject sources:
Inventories (short tons) *** *** ***
Ratio to inventories to imports (percent) *** *** ***
Ratio of U.S. shipments of imports (percent) *** *** ***
Nonsubject sources:
Inventories (short tons) *** *** ***
Ratio of inventories to imports (percent) *** *** ***
Ratio to U.S. shipments of imports (percent) *** *** ***
All sources:
Inventories (short tons) *** *** ***
Ratio of inventories to imports (percent) *** *** ***
Ratio to U.S. shipments of imports (percent) *** *** ***
Source: Compiled from data submitted in response to Commission questionnaires.
VII-4

U.S. IMPORTERS’ CURRENT ORDERS
The Commission requested U.S. importers to indicate whether they imported or arranged for theimportation of galvanized steel wire after December 31, 2010. Sixteen of the 21 reporting importersstated that they had imported or arranged for importation since December 31, 2010. Table VII-6 presentsthe U.S. importers which indicated that they had imported or arranged for the importation of the subjectproduct from China and Mexico and the quantity of those U.S. imports.5
Table VII-6Galvanized steel wire: U.S. importers’ orders of subject imports from China and Mexicosubsequent to December 31, 2010, by firm
* * * * * * *
ANTIDUMPING INVESTIGATIONS IN THIRD-COUNTRY MARKETS
No antidumping investigations in third-country markets were reported.
INFORMATION ON NONSUBJECT COUNTRIES
With respect to foreign industry data, the Commission sought publicly available informationregarding worldwide trade of galvanized steel wire. In addition to firms reporting imports from Chinaand Mexico, 11 firms reported imports from nonsubject sources. The Commission also obtained officialCommerce data for imports by country. The leading nonsubject country was Canada (accounting for 29.8percent of total U.S. imports of galvanized steel wire during 2010). All other nonsubject sourcescombined accounted for less than 13.0 percent of galvanized steel wire imports by quantity and value,with imports from the 27 other countries ranging between less than 0.01 percent and 4.7 percent of 2010imports (table IV-3 ).
There are eleven known producers of galvanized steel wire in Canada.6 Two notable producers ofgalvanized steel wire in Canada are Sivaco and Tree Island.7 Imports from Canada declined by 39.7percent between 2008 and 2010. According to respondents, this decline in imports is due to “seriousfinancial issues” and subsequent production cutbacks at Tree Island and an appreciation of the U.S. dollar“making the U.S. a less attractive market for Canadian suppliers.8 The average unit values of imports ofgalvanized steel wire from Canada were generally higher than subject country imports. According topetitioners, Sivaco principally produces a high-quality high-carbon specialty wire, music wire, andHDMB galvanized wire for use in niche applications whereas Tree Island produces the broad spectrum ofgalvanized steel wire and competes directly with U.S. producers of galvanized steel wire.9
The next largest supplier of nonsubject galvanized steel wire to the United States is Israel. Imports from Israel grew by over 1,000 percent by quantity and by 750 percent by value between 2008and 2010, yet these imports, by quantity and value, account for less than 5 percent of total imports. Two
5 According to official import statistics, in January 2011 and February 2011, imports from China of galvanizedsteel wire were 1,975 short tons and 1,469 short tons, respectively. In contrast to the volumes reported in table VII-6, in January 2011 and February 2011 alone, imports from Mexico of galvanized steel wire were 6,984 short tonsand 7,212 short tons, respectively.
6 WAI, Virtual Trade Show database, http://www.wirenet.org/vts/vts_search.cfm, retrieved May 2, 2011.
7 Conference transcript, pp. 64-65 (Cronin and Weinand).
8 Conference transcript, pp. 96-97 (Gutierrez).
9 Conference transcript, pp. 63-64 (Cronin and Wienand).
VII-5

notable Israeli producers are Barzelan Steel and Hod Assaf Industries. Barzelan Steel, a subsidiary ofYehuda Steel, produces galvanized steel wire for export to European and North American Markets.10 Barzalan Steel produces high and low tensile strength galvanized steel wire for the agricultural, recycling,building, and construction industries. Hod Assaf recently expanded its operations in 2008 by acquiringGlobal Wire of Netivot Israel.11 Hod Assaf also manufactures high and low tensile strength cold drawngalvanized wires for industrial and agricultural applications.
Global Exports of Galvanized Steel Wire
The largest supplier of galvanized steel wire, globally, is China (table VII-7).12 China accountsfor 44.3 percent of all exported galvanized steel wire. The next largest sources of exported galvanizedsteel wire are the EU and Canada, accounting for 13.7 percent and 5.3 percent of global exports,respectively.13
10 Yehuda Steel web site, http://ysteel.co.il/Index.asp?CategoryID=171, retrieved May 5, 2011; Barzelan Steelwebsite, http://barzelan-new.upsite.co.il/?categoryId=62666, retrieved May 5, 2011.
11 Hod Assaf web site, http://www.hodmetal.co.il/, retrieved May 2, 2011; Bloomberg Businessweek CompanyProfile, “Hod Assaf Industries LTD., Co.” http://investing.businessweek.com/research/stocks/snapshot/snapshot_article.asp?ticker=HOD:IT, retrieved May 5, 2011.
12 For HTS 7217.20, which includes galvanized steel wire. Global Trade Atlas, http://www.gtis.com/gta/,retrieved May 2, 2011.
13 EU exports principally supply end-users in non-EU European countries such as Norway and Switzerland.
VII-6

Table VII-7Galvanized steel wire: Reporting country exports, 2008-10
Reporting country
Calendar year
2008 2009 2010
Quantity (short tons)
China 713,008 652,671 761,935
European Union1 102,612 110,224 147,954
Canada 109,553 68,215 62,945
Malaysia 54,831 60,893 76,554
Mexico 53,311 52,152 67,345
South Korea 55,279 43,204 42,055
Turkey 47,744 50,548 64,183
Russia 58,025 57,718 51,728
South Africa 77,126 60,211 47,859
United States 30,362 26,746 30,783
All other 168,576 147,457 169,471
Total 1,470,426 1,330,038 1,522,810
Value (1,000 dollars)
China 655,174 468,338 605,832
European Union1 174,091 139,458 187,548
Canada 140,930 70,229 72,078
Malaysia 76,230 45,148 66,764
Mexico 70,198 47,911 54,453
South Korea 71,415 46,737 48,902
Turkey 49,430 34,980 47,884
Russia 58,566 36,436 37,646
South Africa 60,822 33,666 34,850
United States 32,631 27,495 34,296
All other 212,824 137,077 175,879
Total 1,602,311 1,087,475 1,366,132
1 European Union exports are for EU-27 external exports.
Note.–Global exports of galvanized steel wire classified as HS code 7217.20.Note.–Original data published in metric tons, which were converted to short tons using a conversion factor of1.1023.
Source: Compiled from Global Trade Atlas.
VII-7


APPENDIX A
FEDERAL REGISTER NOTICES
A-1


19382 Federal Register / Vol. 76, No. 67 / Thursday, April 7, 2011 / Notices
Authority, HUD granted an exception to applicability of the Buy American requirements with respect to work, using CFRFC grant funds, in connection with the Cambridge Affordable Presidential Apartments. The exception was granted by HUD on the basis that the relevant manufactured goods (energy efficient hot water baseboards) are not produced in the U.S. in sufficient and reasonably available quantities or of satisfactory quality.
2. Housing Authority of the City of Bowling Green. Upon request of the Housing Authority of the City of Bowling Green, HUD granted an exception to applicability of the Buy American requirements with respect to work, using CFRFC grant funds, in connection with the Bowling Green High Rise Apartments. The exception was granted by HUD on the basis that the relevant manufactured goods (dual flush toilets) are not produced in the U.S. in sufficient and reasonably available quantities or of satisfactory quality.
3. Housing Authority of the City of Runge. Upon request of the Housing Authority of the City of Runge, HUD granted an exception to applicability of the Buy American requirements with respect to work, using CFRFC funds, in connection with eleven scattered sites. The exception was granted by HUD on the basis that the relevant manufactured goods (ceiling fans) are not produced in the U.S. in sufficient and reasonably available quantities or of satisfactory quality.
Dated: March 30, 2011. Deborah Hernandez, General Deputy Assistant Secretary for Public and Indian Housing. [FR Doc. 2011–8234 Filed 4–6–11; 8:45 am]
BILLING CODE 4210–67–P
DEPARTMENT OF THE INTERIOR
Office of Surface Mining Reclamation and Enforcement
Notice of Proposed Information Collection
AGENCY: Office of Surface Mining Reclamation and Enforcement, Interior ACTION: Notice and request for comments for 1029–0091.
INTERNATIONAL TRADE COMMISSION
[Investigation Nos. 701–TA–479 and 731– TA–1183–1184 (Preliminary)]
Galvanized Steel Wire From China and Mexico
AGENCY: United States International Trade Commission. ACTION: Institution of antidumping and countervailing duty investigations and scheduling of preliminary phase investigations.
SUMMARY: The Commission hereby gives notice of the institution of investigations and commencement of preliminary phase antidumping and countervailing Investigation Nos. 701–TA–479 and 731–TA–1183–1184 (Preliminary) under sections 703(a) and 733(a) of the Tariff Act of 1930 (19 U.S.C. 1671b(a) and 1673b(a)) (the Act) to determine whether there is a reasonable indication that an industry in the United States is materially injured or threatened with material injury, or the establishment of an industry in the United States is materially retarded, by reason of
VerDate Mar<15>2010 21:42 Apr 06, 2011 Jkt 223001 PO 00000 Frm 00076 Fmt 4703 Sfmt 4703 E:\FR\FM\07APN1.SGM 07APN1mst
ocks
till o
n D
SK
H9S
0YB
1PR
OD
with
NO
TIC
ES
19383 Federal Register / Vol. 76, No. 67 / Thursday, April 7, 2011 / Notices
imports from China and Mexico of galvanized steel wire, provided for in subheading 7217.20.30 and 7217.20.45 of the Harmonized Tariff Schedule of the United States, that are alleged to be sold in the United States at less than fair value and alleged to be subsidized by the Government of China. Unless the Department of Commerce extends the time for initiation pursuant to sections 702(c)(1)(B) or 732(c)(1)(B) of the Act (19 U.S.C. 1671a(c)(1)(B) or 1673a(c)(1)(B)), the Commission must reach a preliminary determination in antidumping and countervailing duty investigations in 45 days, or in this case by May 16, 2011. The Commission’s views are due at Commerce within five business days thereafter, or by May 23, 2011.
For further information concerning the conduct of these investigations and rules of general application, consult the Commission’s Rules of Practice and Procedure, part 201, subparts A through E (19 CFR part 201), and part 207, subparts A and B (19 CFR part 207). DATES: Effective Date: March 31, 2011. FOR FURTHER INFORMATION CONTACT: Angela Newell (202–708–5409), Office of Investigations, U.S. International Trade Commission, 500 E Street, SW., Washington, DC 20436. Hearing- impaired persons can obtain information on this matter by contacting the Commission’s TDD terminal on 202– 205–1810. Persons with mobility impairments who will need special assistance in gaining access to the Commission should contact the Office of the Secretary at 202–205–2000. General information concerning the Commission may also be obtained by accessing its Internet server (http:// www.usitc.gov). The public record for these investigations may be viewed on the Commission’s electronic docket (EDIS) at http://edis.usitc.gov. SUPPLEMENTARY INFORMATION:
Background.—These investigations are being instituted in response to a petition filed on March 31, 2011, by Davis Wire Corp., Irwindale, CA; Johnstown Wire Technologies, Inc.; Johnstown, PA; Mid-South Wire Co., Inc., Nashville, TN; National Standard, LLC, Niles, MI; and Oklahoma Steel and Wire Co., Inc., Madill, OK.
Participation in the investigations and public service list.—Persons (other than petitioners) wishing to participate in the investigations as parties must file an entry of appearance with the Secretary to the Commission, as provided in sections 201.11 and 207.10 of the Commission’s rules, not later than seven days after publication of this notice in the Federal Register. Industrial users
and (if the merchandise under investigation is sold at the retail level) representative consumer organizations have the right to appear as parties in Commission antidumping and countervailing duty investigations. The Secretary will prepare a public service list containing the names and addresses of all persons, or their representatives, who are parties to these investigations upon the expiration of the period for filing entries of appearance.
Limited disclosure of business proprietary information (BPI) under an administrative protective order (APO) and BPI service list.—Pursuant to section 207.7(a) of the Commission’s rules, the Secretary will make BPI gathered in these investigations available to authorized applicants representing interested parties (as defined in 19 U.S.C. 1677(9)) who are parties to the investigations under the APO issued in the investigations, provided that the application is made not later than seven days after the publication of this notice in the Federal Register. A separate service list will be maintained by the Secretary for those parties authorized to receive BPI under the APO.
Conference.—The Commission’s Director of Investigations has scheduled a conference in connection with these investigations for 8:45 a.m. on April 22, 2011, at the U.S. International Trade Commission Building, 500 E Street, SW., Washington, DC. Requests to appear at the conference should be filed in writing with the Secretary to the Commission on or before April 19, 2011. Parties in support of the imposition of antidumping duties in these investigations and parties in opposition to the imposition of such duties will each be collectively allocated one hour within which to make an oral presentation at the conference. A nonparty who has testimony that may aid the Commission’s deliberations may request permission to present a short statement at the conference.
Written submissions.—As provided in sections 201.8 and 207.15 of the Commission’s rules, any person may submit to the Commission on or before April 27, 2011, a written brief containing information and arguments pertinent to the subject matter of the investigations. Parties may file written testimony in connection with their presentation at the conference no later than three days before the conference. If briefs or written testimony contain BPI, they must conform with the requirements of sections 201.6, 207.3, and 207.7 of the Commission’s rules. The Commission’s rules do not authorize filing of submissions with the
Secretary by facsimile or electronic means, except to the extent permitted by section 201.8 of the Commission’s rules, as amended, 67 FR 68036 (November 8, 2002). Even where electronic filing of a document is permitted, certain documents must also be filed in paper form, as specified in II(C) of the Commission’s Handbook on Electronic Filing Procedures, 67 FR 68168, 68173 (November 8, 2002).
In accordance with sections 201.16(c) and 207.3 of the rules, each document filed by a party to the investigations must be served on all other parties to the investigations (as identified by either the public or BPI service list), and a certificate of service must be timely filed. The Secretary will not accept a document for filing without a certificate of service.
Authority: These investigations are being conducted under authority of title VII of the Tariff Act of 1930; this notice is published pursuant to section 207.12 of the Commission’s rules.
By order of the Commission. Issued: April 1, 2011.
James R. Holbein, Acting Secretary to the Commission. [FR Doc. 2011–8223 Filed 4–6–11; 8:45 am]
BILLING CODE ––P
SUMMARY: The Commission hereby gives notice of the institution of investigations and commencement of preliminary phase antidumping investigation Nos. 731–TA–1186–1187 (Preliminary) under section 733(a) of the Tariff Act of 1930 (19 U.S.C. 1673b(a)) (the Act) to determine whether there is a reasonable indication that an industry in the United States is materially injured or threatened with material injury, or the establishment of an industry in the United States is materially retarded, by reason of imports from China and Taiwan of certain stilbenic optical brightening agents, provided for in subheading 3204.20.80 of the Harmonized Tariff Schedule of the United States, that are alleged to be sold in the United States at less than fair
VerDate Mar<15>2010 19:53 Apr 06, 2011 Jkt 223001 PO 00000 Frm 00077 Fmt 4703 Sfmt 4703 E:\FR\FM\07APN1.SGM 07APN1mst
ocks
till o
n D
SK
H9S
0YB
1PR
OD
with
NO
TIC
ES

21914 Federal Register / Vol. 76, No. 75 / Tuesday, April 19, 2011 / Notices
(2) Title of the Form/Collection: Application for Posthumous Citizenship.
(3) Agency form number, if any, and the applicable component of the Department of Homeland Security sponsoring the collection: Form N–644; U.S. Citizenship and Immigration Services (USCIS).
(4) Affected public who will be asked or required to respond, as well as a brief abstract: Primary: Individuals or households. The information collected will be used to determine an applicant’s eligibility to request posthumous citizenship status for a decedent and to determine the decedent’s eligibility for such status.
(5) An estimate of the total number of respondents and the amount of time estimated for an average respondent to respond: 50 responses at 1 hour and 50 minutes (1.83 hours) per response.
(6) An estimate of the total public burden (in hours) associated with the collection: 92 annual burden hours.
If you need a copy of the information collection instrument, please visit the Web site at: http:// www.regulations.gov/.
We may also be contacted at: USCIS, Regulatory Products Division, Office of the Executive Secretariat, 20 Massachusetts Avenue, NW., Room 5012, Washington, DC 20529–2020, Telephone number 202–272–8377.
Dated: April 14, 2011. Sunday A. Aigbe, Chief, Regulatory Products Division, Office of the Executive Secretariat, U.S. Citizenship and Immigration Services, Department of Homeland Security. [FR Doc. 2011–9441 Filed 4–18–11; 8:45 am]
BILLING CODE 9111–97–P
SUMMARY: This order extends the withdrawal created by Public Land Order No. 6845 for an additional 20-year term. This extension is necessary to continue protection of the archaeological values at the Arroyo del Tajo Pictograph Site in Socorro County, New Mexico.
DATES: Effective Date: April 12, 2011. FOR FURTHER INFORMATION CONTACT: Ann D. Sullivan, Bureau of Land Management, Socorro Field Office, 901 S. Highway 85, Socorro, New Mexico 87801, or 575–835–0412. SUPPLEMENTARY INFORMATION: The purpose for which the withdrawal was first made requires this extension to continue protection of the archaeological values at the Arroyo del Tajo Pictograph Site. The withdrawal extended by this order will expire on April 11, 2031, unless, as a result of a review conducted prior to the expiration date pursuant to Section 204(f) of the Federal Land Policy and Management Act of 1976, 43 U.S.C. 1714(f), the Secretary determines that the withdrawal shall be further extended.
Order
By virtue of the authority vested in the Secretary of the Interior by Section 204 of the Federal Land Policy and Management Act of 1976, 43 U.S.C. 1714, it is ordered as follows:
Public Land Order No. 6845 (56 FR 14865 (1991)), which withdrew 200 acres of public land from settlement, sale, location, or entry under the general land laws, including the United States mining laws (30 U.S.C. ch. 2), but not leasing under the mineral leasing laws, to protect the archaeological values at the Arroyo del Tajo Pictograph Site, is hereby extended for an additional 20- year period until April 11, 2031. (Authority: 43 CFR 2310.4)
Dated: April 5, 2011. Wilma A. Lewis, Assistant Secretary—Land and Minerals Management. [FR Doc. 2011–9428 Filed 4–18–11; 8:45 am]
BILLING CODE 4310–MW–P
INTERNATIONAL TRADE COMMISSION
[Investigation Nos. 701–TA–479 and 731– TA–1183–1184 (Preliminary)]
Galvanized Steel Wire From China and Mexico
AGENCY: United States International Trade Commission. ACTION: Revised schedule for the subject antidumping and countervailing duty investigations.
DATES: Effective Date: April 13, 2011. FOR FURTHER INFORMATION CONTACT: Angela M.W. Newell (202–708–5409), Office of Investigations, U.S. International Trade Commission, 500 E Street, SW., Washington, DC 20436.
Hearing-impaired persons can obtain information on this matter by contacting the Commission=s TDD terminal on 202–205–1810. Persons with mobility impairments who will need special assistance in gaining access to the Commission should contact the Office of the Secretary at 202–205–2000. General information concerning the Commission may also be obtained by accessing its Internet server (http:// www.usitc.gov). The public record for these investigations may be viewed on the Commission=s electronic docket (EDIS) at http://edis.usitc.gov. SUPPLEMENTARY INFORMATION: Effective March 31, 2011, the Commission established a schedule for the conduct of these investigations (75 FR 877, April 7, 2011). Due to scheduling conflicts, the Commission is issuing a revised schedule.
Specifically, the Commission will hold its conference on April 21, 2011, beginning at 1 p.m. Briefs are due on April 27, 2011, at 12 noon.
For further information concerning the investigations see the Commission=s notice cited above and the Commission’s Rules of Practice and Procedure, part 201, subparts A through E (19 CFR part 201), and part 207, subparts A and C (19 CFR part 207).
Authority: The investigations are being conducted under authority of title VII of the Tariff Act of 1930; this notice is published pursuant to section 207.21 of the Commission’s rules.
Issued: April 13, 2011. By order of the Commission.
James R. Holbein, Acting Secretary to the Commission. [FR Doc. 2011–9383 Filed 4–18–11; 8:45 am]
BILLING CODE P
DEPARTMENT OF JUSTICE
[OMB Number 1122–0018]
Agency Information Collection Activities: Extension of Currently Approved Collection
ACTION: 60-Day Notice of Information Collection Under Review: Semi-Annual Progress Report for the Grants to Indian Tribal Governments Program.
The Department of Justice, Office on Violence Against Women (OVW) will be submitting the following information collection request to the Office of Management and Budget (OMB) for review and approval in accordance with the Paperwork Reduction Act of 1995. Comments are encouraged and will be accepted for ‘‘sixty days’’ until June 20,
VerDate Mar<15>2010 16:19 Apr 18, 2011 Jkt 223001 PO 00000 Frm 00061 Fmt 4703 Sfmt 4703 E:\FR\FM\19APN1.SGM 19APN1mst
ocks
till o
n D
SK
H9S
0YB
1PR
OD
with
NO
TIC
ES

23548 Federal Register / Vol. 76, No. 81 / Wednesday, April 27, 2011 / Notices
certifications are provided at the end of the Interim Final Rule. The Department intends to reject factual submissions in any proceeding segments initiated on or after March 14, 2011 if the submitting party does not comply with the revised certification requirements.
These initiations and this notice are in accordance with section 751(a) of the Act (19 U.S.C. 1765(a)), and 19 CFR 351.221(c)(1)(i).
April 19, 2011. Gary Taverman, Acting Deputy Assistant Secretary for Antidumping and Countervailing Duty Operations. [FR Doc. 2011–10185 Filed 4–26–11; 8:45 am]
BILLING CODE 3510–DS–P
DEPARTMENT OF COMMERCE
International Trade Administration
[A–570–975, A–201–840]
Galvanized Steel Wire From the People’s Republic of China and Mexico: Initiation of Antidumping Duty Investigations
AGENCY: Import Administration, International Trade Administration, Department of Commerce. DATES: Effective Date: April 27, 2011. FOR FURTHER INFORMATION CONTACT: Catherine Bertrand at (202) 482–3207 (the People’s Republic of China (the ‘‘PRC’’)), AD/CVD Operations, Office 9; or Angelica Mendoza at (202) 482–3019 (Mexico), AD/CVD Operations, Office 7, Import Administration, International Trade Administration, U.S. Department of Commerce, 14th Street and Constitution Avenue, NW., Washington, DC 20230. SUPPLEMENTARY INFORMATION:
The Petitions
On March 31, 2011, the Department of Commerce (the ‘‘Department’’) received petitions concerning imports of galvanized steel wire from the PRC and Mexico filed in proper form on behalf of Davis Wire Corporation (‘‘Davis Wire’’), Johnstown Wire Technologies, Inc., Mid-South Wire Company, Inc., National Standard, LLC, and Oklahoma Steel & Wire Company, Inc., (collectively, ‘‘Petitioners’’). See Petitions for the Imposition of Antidumping Duties on Galvanized Steel Wire from Mexico and Antidumping and Countervailing Duties on Galvanized Steel Wire from the People’s Republic of China filed on March 31, 2011 (the ‘‘Petitions’’). On April 6, 2011, the Department issued a request for additional information and
clarification of certain areas of the Petitions. Petitioners filed a response to this request on April 11, 2011 (hereinafter, ‘‘Supplement to the PRC Petition,’’ ‘‘Supplement to the Mexico Petition,’’ and ‘‘Supplement to the AD/ CVD Petitions,’’ respectively). Based on a conversation with Department officials, Petitioners filed a further response on April 14, 2011 (hereinafter, ‘‘Second Supplement to the AD/CVD Petitions’’). In addition they provided the Department with an additional required certification on April 15, 2011. See Certification Letter filed April 15, 2011.
In accordance with section 732(b) of the Tariff Act of 1930, as amended (the ‘‘Act’’), Petitioners allege that imports of galvanized steel wire from the PRC and Mexico are being, or are likely to be, sold in the United States at less than fair value, within the meaning of section 731 of the Act, and that such imports are materially injuring, or threatening material injury to, an industry in the United States.
The Department finds that Petitioners filed the Petitions on behalf of the domestic industry because Petitioners are interested parties as defined in section 771(9)(C) of the Act and have demonstrated sufficient industry support with respect to the antidumping duty investigations that Petitioners are requesting that the Department initiate (see ‘‘Determination of Industry Support for the Petitions’’ section below).
Period of Investigation The period of investigation (‘‘POI’’) for
the investigation involving the PRC is July 1, 2010, through December 31, 2010. The POI for the investigation involving Mexico is January 1, 2010, through December 31, 2010. See 19 CFR 351.204(b)(1).
Scope of Investigations The product covered by these
investigations is galvanized steel wire from the PRC and Mexico. For a full description of the scope of the investigations, please see the ‘‘Scope of the Investigations,’’ in Appendix I of this notice.
Comments on Scope of Investigations During our review of the Petitions, we
discussed the scope with Petitioners to ensure that it is an accurate reflection of the products for which the domestic industry is seeking relief. Moreover, as discussed in the preamble to the Department’s regulations (Antidumping Duties; Countervailing Duties; Final Rule, 62 FR 27296, 27323 (May 19, 1997)), we are setting aside a period for interested parties to raise issues
regarding product coverage. The Department encourages all interested parties to submit such comments by May 10, 2011, twenty calendar days from the signature date of this notice. All comments must be filed on the records of the PRC and Mexico antidumping duty investigations as well as the PRC countervailing duty investigation. Comments should be addressed to Import Administration’s APO/Dockets Unit, Room 1870, U.S. Department of Commerce, 14th Street and Constitution Avenue, NW., Washington, DC 20230. The period of scope consultations is intended to provide the Department with ample opportunity to consider all comments and to consult with parties prior to the issuance of the preliminary determinations.
Comments on Product Characteristics for Antidumping Duty Questionnaires
We are requesting comments from interested parties regarding the appropriate physical characteristics of galvanized steel wire to be reported in response to the Department’s antidumping questionnaires. This information will be used to identify the key physical characteristics of the subject merchandise in order to more accurately report the relevant factors and costs of production, as well as to develop appropriate product comparison criteria.
Interested parties may provide any information or comments that they feel are relevant to the development of an accurate listing of physical characteristics. Specifically, they may provide comments as to which characteristics are appropriate to use as 1) general product characteristics and 2) the product comparison criteria. We note that it is not always appropriate to use all product characteristics as product comparison criteria. We base product comparison criteria on meaningful commercial differences among products. In other words, while there may be some physical product characteristics utilized by manufacturers to describe galvanized steel wire, it may be that only a select few product characteristics take into account commercially meaningful physical characteristics. In addition, interested parties may comment on the order in which the physical characteristics should be used in product matching. Generally, the Department attempts to list the most important physical characteristics first and the least important characteristics last.
In order to consider the suggestions of interested parties in developing and
VerDate Mar<15>2010 15:36 Apr 26, 2011 Jkt 223001 PO 00000 Frm 00013 Fmt 4703 Sfmt 4703 E:\FR\FM\27APN1.SGM 27APN1WR
eier
-Avi
les
on D
SK
GB
LS3C
1PR
OD
with
NO
TIC
ES

23549 Federal Register / Vol. 76, No. 81 / Wednesday, April 27, 2011 / Notices
1 On April 18, 2011, the Department placed Deacero’s filing on the records of the AD and CVD petitions concerning the PRC. See Memorandum to the File from Norbert Gannon, Office of Policy, entitled, Petitions for the Imposition of Antidumping Duties on Imports of Galvanized Steel Wire from the People’s Republic of China (the PRC) and Mexico and Countervailing Duties on Imports of Galvanized Steel Wire from the PRC—Deacero S.A. de C.V.’s April 14, 2011, Letter to the Department of Commerce.
issuing the antidumping duty questionnaires, we must receive comments at the above-referenced address by May 10, 2011. Additionally, rebuttal comments must be received by May 17, 2011.
Determination of Industry Support for the Petitions
Section 732(b)(1) of the Act requires that a petition be filed on behalf of the domestic industry. Section 732(c)(4)(A) of the Act provides that a petition meets this requirement if the domestic producers or workers who support the petition account for: (i) At least 25 percent of the total production of the domestic like product; and (ii) more than 50 percent of the production of the domestic like product produced by that portion of the industry expressing support for, or opposition to, the petition. Moreover, section 732(c)(4)(D) of the Act provides that, if the petition does not establish support of domestic producers or workers accounting for more than 50 percent of the total production of the domestic like product, the Department shall: (i) poll the industry or rely on other information in order to determine if there is support for the petition, as required by subparagraph (A); or (ii) determine industry support using a statistically valid sampling method to poll the ‘‘industry.’’
Section 771(4)(A) of the Act defines the ‘‘industry’’ as the producers as a whole of a domestic like product. Thus, to determine whether a petition has the requisite industry support, the statute directs the Department to look to producers and workers who produce the domestic like product. The International Trade Commission (‘‘ITC’’), which is responsible for determining whether ‘‘the domestic industry’’ has been injured, must also determine what constitutes a domestic like product in order to define the industry. While both the Department and the ITC must apply the same statutory definition regarding the domestic like product (see section 771(10) of the Act), they do so for different purposes and pursuant to a separate and distinct authority. In addition, the Department’s determination is subject to limitations of time and information. Although this may result in different definitions of the like product, such differences do not render the decision of either agency contrary to law. See USEC, Inc. v. United States, 132 F. Supp. 2d 1, 8 (Ct. Int’l Trade 2001), citing Algoma Steel Corp., Ltd. v. United States, 688 F. Supp. 639, 644 (Ct. Int’l Trade 1988), aff’d 865 F.2d 240 (Fed. Cir. 1989), cert. denied 492 U.S. 919 (1989).
Section 771(10) of the Act defines the domestic like product as ‘‘a product which is like, or in the absence of like, most similar in characteristics and uses with, the article subject to an investigation under this title.’’ Thus, the reference point from which the domestic like product analysis begins is ‘‘the article subject to an investigation’’ (i.e., the class or kind of merchandise to be investigated, which normally will be the scope as defined in the petition).
With regard to the domestic like product, Petitioners do not offer a definition of domestic like product distinct from the scope of the investigations. Based on our analysis of the information submitted on the record, we have determined that galvanized steel wire constitutes a single domestic like product and we have analyzed industry support in terms of that domestic like product. For a discussion of the domestic like product analysis in this case, see Antidumping Duty Investigation Initiation Checklist: Galvanized Steel Wire from the PRC (‘‘PRC Initiation Checklist’’) at Attachment II, and Antidumping Duty Investigation Initiation Checklist: Galvanized Steel Wire from Mexico (‘‘Mexico Initiation Checklist’’) at Attachment II, dated concurrently with this notice and on file in the Central Records Unit (‘‘CRU’’), Room 7046 of the main Department of Commerce building.
In determining whether Petitioners have standing under section 732(c)(4)(A) of the Act, we considered the industry support data contained in the Petitions with reference to the domestic like product as defined in the ‘‘Scope of the Investigations,’’ in Appendix I of this notice. To establish industry support, Petitioners provided their own 2010 production of the domestic like product, and compared this to the estimated total production of the domestic like product for the entire domestic industry. See Volume I of the Petitions, at I–3 through I–5 and Exhibits I–1 through I–5, Supplement to the AD/CVD Petitions, at 1, 7, and Exhibit (Supp-I)–7, and Second Supplement to the AD/CVD Petitions, at (Second Supp)–2, Exhibit (Second Supp)–2, and Second Revised Exhibit I– 1; see also PRC Initiation Checklist at Attachment II and Mexico Initiation Checklist at Attachment II.
On April 14, 2011, we received an industry support challenge from a Mexican producer of galvanized steel wire and its U.S. affiliate. See Letter from Deacero, titled ‘‘Galvanized Steel Wire from Mexico—Comments on Industry Support,’’ dated April 14,
2011.1 Petitioner responded to this submission on April 18, 2011. See Letter from Petitioners, titled ‘‘Petitioners’ Response to Question about U.S. industry,’’ dated April 18, 2011. Our review of the data provided in the Petitions, supplemental submissions, and other information readily available to the Department indicates that Petitioners have established industry support. See PRC Initiation Checklist at Attachment II and Mexico Initiation Checklist at Attachment II. First, the Petitions established support from domestic producers (or workers) accounting for more than 50 percent of the total production of the domestic like product and, as such, the Department is not required to take further action in order to evaluate industry support (e.g., polling). See section 732(c)(4)(D) of the Act; see also PRC Initiation Checklist at Attachment II and Mexico Initiation Checklist at Attachment II. Second, the domestic producers (or workers) have met the statutory criteria for industry support under section 732(c)(4)(A)(i) of the Act because the domestic producers (or workers) who support the Petitions account for at least 25 percent of the total production of the domestic like product. See PRC Initiation Checklist at Attachment II and Mexico Initiation Checklist at Attachment II. Finally, the domestic producers (or workers) have met the statutory criteria for industry support under section 732(c)(4)(A)(ii) of the Act because the domestic producers (or workers) who support the Petitions account for more than 50 percent of the production of the domestic like product produced by that portion of the industry expressing support for, or opposition to, the Petitions. Accordingly, the Department determines that the Petitions were filed on behalf of the domestic industry within the meaning of section 732(b)(1) of the Act. See id.
The Department finds that Petitioners filed the Petitions on behalf of the domestic industry because they are interested parties as defined in section 771(9)(C) of the Act and they have demonstrated sufficient industry support with respect to the antidumping duty investigations that they are requesting the Department initiate. See id.
VerDate Mar<15>2010 15:36 Apr 26, 2011 Jkt 223001 PO 00000 Frm 00014 Fmt 4703 Sfmt 4703 E:\FR\FM\27APN1.SGM 27APN1WR
eier
-Avi
les
on D
SK
GB
LS3C
1PR
OD
with
NO
TIC
ES

23550 Federal Register / Vol. 76, No. 81 / Wednesday, April 27, 2011 / Notices
Allegations and Evidence of Material Injury and Causation
Petitioners allege that the U.S. industry producing the domestic like product is being materially injured, or is threatened with material injury, by reason of the imports of the subject merchandise sold at less than normal value (‘‘NV’’). In addition, Petitioners allege that subject imports exceed the negligibility threshold provided for under section 771(24)(A) of the Act. Petitioners contend that the industry’s injured condition is illustrated by reduced market share, lost sales and revenues, reduced production, reduced shipments, reduced capacity utilization rate, underselling and price depression and suppression, reduced workforce, decline in financial performance, and an increase in import penetration. We have assessed the allegations and supporting evidence regarding material injury, threat of material injury, and causation, and we have determined that these allegations are properly supported by adequate evidence and meet the statutory requirements for initiation. See PRC Initiation Checklist at Attachment III and Mexico Initiation Checklist at Attachment III.
Allegations of Sales at Less Than Fair Value
The following is a description of the allegations of sales at less than fair value upon which the Department based its decision to initiate these investigations of imports of galvanized steel wire from the PRC and Mexico. The sources of data for the deductions and adjustments relating to the U.S. price, the factors of production (‘‘FOPs’’) (for the PRC) and cost of production (‘‘COP’’) (for Mexico) are also discussed in the country- specific initiation checklists. See PRC Initiation Checklist at 6–10 and Mexico Initiation Checklist at 6–10.
Export Price
The PRC For the PRC, Petitioners calculated
export price (‘‘EP’’) based on offers for sale of galvanized steel wire by certain Chinese exporters/resellers and declarations of lost U.S. sales by U.S. producers during the POI, as identified in two Declarations Regarding Lost U.S. Sales and four Declarations Regarding U.S. Sales Offers provided by Petitioners. See PRC Initiation Checklist at 6; see also Volume III of the Petitions at Exhibit III–5. Petitioners substantiated the U.S. price quotes with affidavits. See Supplement to the PRC Petition at Exhibit (Supp-III)–5. Based on stated sales and delivery terms, Petitioners deducted adjustments,
charges and expenses associated with exporting and delivering to the U.S. customer, including brokerage and handling, ocean freight and insurance, U.S. duties and U.S. inland freight charges, and distributor mark-up, where appropriate. See PRC Initiation Checklist at 6; see also Volume III of the Petitions at III–5, Exhibit III–5 and Exhibit III–6, and Supplement to the PRC Petition at (Supp-III)–11 and Exhibit (Supp-III)–6. Petitioners made no other adjustments. See PRC Initiation Checklist for additional details.
Mexico
For Mexico, Petitioners based U.S. EP on offers of sale for major types of galvanized steel wire for delivery to U.S. customers during the POI. See Mexico Initiation Checklist at 7; see also Volume II of the Petitions at II–6 and Exhibits II–5 and II–6. The prices were listed on multiple declarations which were made by a senior marketing executive at Davis Wire. In each offer, the Davis Wire representative discussed certain prices for galvanized steel wire with these customers regarding potential sales. See Volume II of the Petitions at Exhibit II–5. In certain instances, the customer sourced galvanized steel wire from Davis Wire, but only after Davis Wire matched the price quote from the Mexican producer. In other instances, rather than source galvanized steel wire from Davis Wire, the customers decided to purchase galvanized steel wire imported from Mexico at prices listed on each declaration, which Petitioners used as the basis for U.S. price. See Supplement to the Mexico Petition at Exhibit (Supp- II)–5. Based on the stated sales and delivery terms, Petitioners then adjusted the U.S. prices to account for expenses associated with exporting and delivering the product to these specific U.S. customers (i.e., ocean freight and insurance, U.S. duties and U.S. inland freight charges, and distributor mark-up, where appropriate). See Mexico Initiation Checklist at 7; see also Volume II of the Petitions at page II–6 and Exhibits II–5 and II–6.
Normal Value
The PRC
Petitioners state that the Department has long treated the PRC as a non- market economy (‘‘NME’’) country and this designation remains in effect today. See Volume III of the Petitions at III–1 through III–2; see also Drill Pipe from the People’s Republic of China: Final Determination of Sales at Less Than Fair Value and Critical Circumstances, 76 FR 1966, 1968 (January 11, 2011); see
also Certain Seamless Carbon and Alloy Steel Standard, Line, and Pressure Pipe from the People’s Republic of China: Final Determination of Sales at Less Than Fair Value and Critical Circumstances, in Part, 75 FR 57449, 57452 (September 21, 2010).
In accordance with section 771(18)(C)(i) of the Act, the presumption of NME status remains in effect until revoked by the Department. The presumption of NME status for the PRC has not been revoked by the Department and, therefore, remains in effect for purposes of the initiation of the PRC investigation. Accordingly, the NV of the product for the PRC investigation is appropriately based on FOPs valued in a surrogate market- economy (‘‘ME’’) country in accordance with section 773(c) of the Act. In the course of the PRC investigation, all parties, including the public, will have the opportunity to provide relevant information related to the issue of the PRC’s NME status and the granting of separate rates to individual exporters.
Petitioners claim that India is an appropriate surrogate country under section 773(c) of the Act because it is an ME country that is at a comparable level of economic development to the PRC and surrogate values data from India are available and reliable. Petitioners believe that India is a significant producer of merchandise under consideration and is a very significant producer of related steel wire products. Petitioners are not aware of significant production of galvanized steel wire among other potential surrogate countries, such as the Philippines, Indonesia, Thailand, Ukraine, and Peru. See Volume III of the Petitions at III–2 through III–3 and Exhibit III–1. Based on the information provided by Petitioners, we believe that it is appropriate to use India as a surrogate country for initiation purposes. After initiation of the investigation, interested parties will have the opportunity to submit comments regarding surrogate country selection and, pursuant to 19 CFR 351.301(c)(3)(i), will be provided an opportunity to submit publicly available information to value FOPs within 40 days after the date of publication of the preliminary determination.
Petitioners calculated the NV and dumping margins for the U.S. price, discussed above, using the Department’s NME methodology as required by 19 CFR 351.202(b)(7)(i)(C) and 19 CFR 351.408. Petitioners calculated NV based on consumption rates experienced by two non-integrated U.S. producers. Petitioners assert that, to the best of Petitioners’ knowledge, the
VerDate Mar<15>2010 15:36 Apr 26, 2011 Jkt 223001 PO 00000 Frm 00015 Fmt 4703 Sfmt 4703 E:\FR\FM\27APN1.SGM 27APN1WR
eier
-Avi
les
on D
SK
GB
LS3C
1PR
OD
with
NO
TIC
ES

23551 Federal Register / Vol. 76, No. 81 / Wednesday, April 27, 2011 / Notices
2 See, e.g., Polyethylene Terephthalate Film, Sheet, and Strip from the People’s Republic of China: Preliminary Determination of Sales at Less Than Fair Value, 73 FR 24552, 24559 (May 5, 2008), unchanged in Polyethylene Terephthalate Film, Sheet, and Strip from the People’s Republic of China: Final Determination of Sales at Less Than Fair Value, 73 FR 55039 (September 24, 2008) (‘‘PET Film’’).
3 Petitioners did not place an Indian value for natural gas on the record of this proceeding. 4 Duty Entitlement Passbook Scheme.
consumption rates of these two U.S. producers are very similar, if not identical, to the consumption of Chinese producers. See Volume III of the Petitions at III–3 and Exhibit III–2, and Supplement to the PRC Petition at (Supp-III)–1 through (Supp-III)–2.
Petitioners valued by-product and most FOPs based on reasonably available, public surrogate country data, specifically, Indian import statistics from the Global Trade Atlas (‘‘GTA’’). See Volume III of the Petitions at III–4 and Exhibit III–3. Petitioners excluded from these import statistics values from countries previously determined by the Department to be NME countries, and from Indonesia, the Republic of Korea and Thailand, as the Department has previously excluded prices from these countries because they maintain broadly available, non-industry-specific export subsidies. Finally, imports that were labeled as originating from an ‘‘unspecified’’ country were excluded from the average value, because the Department could not be certain that they were not from either an NME country or a country with generally available export subsidies.2 See Volume III of the Petitions at III–4 and Exhibit III–3. For valuing other FOPs, Petitioners used sources selected by the Department in recent proceedings involving the PRC. See Volume III of the Petitions at III–4, and Exhibit III–3. In addition, Petitioners made Indian Rupee/U.S. dollar (‘‘USD’’) and Thai Baht/USD currency conversions using average exchange rates for the POI, based on Federal Reserve exchange rates. See Volume III of the Petitions at III–4 and Exhibit III–3, and Supplement to the PRC Petition at Exhibit (Supp- III)–3. Petitioners determined labor costs using the labor consumption rates derived from two U.S. Producers. See Volume III of the Petitions at Exhibit III– 2. Petitioners valued labor costs using the calculated wage rate in a recent review involving steel wire nails from China. See Volume III of the Petitions at Exhibit III–3, and Supplement to the PRC Petition at (Supp-III)–6. For purposes of initiation, the Department determines that the surrogate values used by Petitioners are reasonably available and, thus, acceptable for purposes of initiation.
Petitioners determined electricity costs using the electricity consumption rates, in kilowatt hours, derived from two U.S. producers’ experience. See Volume III of the Petitions at Exhibit III– 2. Petitioners valued electricity using the Indian electricity rate reported by the Central Electric Authority of the Government of India, the source used in the fifth administrative review of Certain Frozen Warmwater Shrimp from the PRC. See Volume III of the Petitions at Exhibit III–3; citing Certain Frozen Warmwater Shrimp From the People’s Republic of China: Preliminary Results and Preliminary Partial Rescission of the Fifth Antidumping Duty Administrative Review, 76 FR 8338 (February 14, 2011) (‘‘Certain Frozen Warmwater Shrimp from the PRC’’).
Petitioners determined water costs using the water consumption derived from two U.S. producers’ experience. See Volume III of the Petitions at Exhibit III–2. Petitioners valued water based on information from the Maharashtra Industrial Development Corporation, the source used in the fifth administrative review of Certain Frozen Warmwater Shrimp from the PRC. See Volume III of the Petitions at Exhibit III– 3.
Petitioners determined natural gas costs using the natural gas consumption rates derived from two U.S. producers’ experience. See Volume III of the Petitions at Exhibit III–2. Petitioners valued natural gas costs using the calculation performed by the Department in the fifth administrative review of Pure Magnesium from the PRC and converted the Thai Baht 3 value using average exchange rates for the POI, based on Federal Reserve exchange rates. See Volume III of the Petitions at III–4 and Exhibit III–3; citing Pure Magnesium from the People’s Republic of China: Final Results of Antidumping Duty Administrative Review, 73 FR 76336 (December 16, 2008).
Four financial statements were placed on the record for consideration to value factory overhead, selling, general and administrative (‘‘SG&A’’), and profit. Petitioners placed the financial statements of Indian producers Usha Martin Limited (‘‘Usha Martin’’), Tata Steel (‘‘Tata’’), and Sterling Tools Limited (‘‘Sterling’’) on the record. The Department placed the statement of Indian producer Visakha Wire Ropes Limited (‘‘Visakha’’) on the record.
The Department has determined not to use Sterling Tools Limited (‘‘Sterling’’) for valuation of the financial ratios because its raw material input is
steel bar and not wire rod. Sterling does not draw wire; therefore, its production process is not similar to that of galvanized steel wire producers because drawing wire rod into wire is a continuous process, whereas steel bar is a cut-to-length product.
Tata and Usha Martin do not match the level of integration of the production experience used for the normal value calculation in the Petition, and benefit from subsidies the Department has previously found to be countervailable.4 However, they both make wire from wire rod and produce comparable merchandise using a similar production process. We also find that Visakha’s production process is similar to the production experience used for the normal value calculation in the Petition in that it is the same level of integration and Visakha draws wire from wire rod. Although, Petitioners argued that the Visakha statement appears to be incomplete the Department notes that it is our practice to only disregard incomplete financial statements as a basis for calculating surrogate financial ratios where the statement is missing key sections, such as sections of the auditor’s report, that are vital to our analysis and calculations. See Wooden Bedroom Furniture from the People’s Republic of China: Final Results of the 2004–2005 Semi-Annual New Shipper Reviews, 71 FR 70739 (December 6, 2006), and accompanying Issues and Decision Memorandum at Comment 2. Here, we find that the Visakha statement appears to contain all of the essential components of an audited financial statement, and Petitioners have not alleged that any specific material information is missing. We recognize the statements of Usha Martin, Tata and Visakha financial statements are not an exact match to the production experience of galvanized steel wire producers. However, after considering all available information on the record, the Department determines that the financial statements of Usha Martin, Tata, and Visakha are sufficiently representative to value the surrogate financial ratios for galvanized steel wire.
Further, the Department has a preference for using multiple financial statements in order to determine surrogate financial ratios for manufacturing overhead, SG&A expenses, and profit where no single source on the record has proven to be entirely representative. See Certain Oil Country Tubular Goods from the People’s Republic of China: Final Determination of Sales at Less Than Fair Value, Affirmative Final
VerDate Mar<15>2010 15:36 Apr 26, 2011 Jkt 223001 PO 00000 Frm 00016 Fmt 4703 Sfmt 4703 E:\FR\FM\27APN1.SGM 27APN1WR
eier
-Avi
les
on D
SK
GB
LS3C
1PR
OD
with
NO
TIC
ES

23552 Federal Register / Vol. 76, No. 81 / Wednesday, April 27, 2011 / Notices
Determination of Critical Circumstances and Final Determination of Targeted Dumping, 75 FR 20335 (April 19, 2010), and accompanying Issues and Decision Memorandum at Comment 13 (‘‘OCTG Final’’). Accordingly, we are averaging the surrogate financial ratios of Usha Martin, Tata, and Visakha and based on a simple average of these three financial statements, we have revised the margins calculated by Petitioners. See PRC Initiation Checklist at Appendix V.
Mexico Petitioners calculated NV for
galvanized steel wire using, initially, information they were able to obtain about home market prices. See Mexico Initiation Checklist at 8; see also Volume II of the Petitions at II–1 through II–2 and Exhibit II–1; see also Supplement to the Mexico Petition at Exhibit (Supp-II)–1. However, because Petitioners demonstrated that there are reasonable grounds to believe that these home market prices were below cost, they based NV on constructed value (‘‘CV’’) in accordance with section 773(e)(1) of the Act. See Volume II of the Petitions at II–4; see also the ‘‘Normal Value Based on Constructed Value’’ section of this notice.
Sales-Below-Cost Allegation Petitioners have provided information
demonstrating reasonable grounds to believe or suspect that sales of galvanized steel wire in the Mexican market were made at prices below the fully absorbed COP, within the meaning of section 773(b) of the Act, and requested that the Department conduct a country-wide sales-below-cost investigation. The Statement of Administrative Action (‘‘SAA’’), submitted to Congress in connection with the interpretation and application of the Uruguay Round Agreements Act (‘‘URAA’’), states that an allegation of sales below COP need not be specific to individual exporters or producers. See SAA, H.R. Doc. No. 103–316 at 833 (1994). The SAA, at 833, states that ‘‘Commerce will consider allegations of below-cost sales in the aggregate for a foreign country, just as Commerce currently considers allegations of sales at less than fair value on a country-wide basis for purposes of initiating an antidumping investigation.’’
Further, the SAA provides that section 773(b)(2)(A) of the Act retains the requirement that the Department have ‘‘reasonable grounds to believe or suspect’’ that below-cost sales have occurred before initiating such an investigation. Reasonable grounds exist when an interested party provides specific factual information on costs and
prices, observed or constructed, indicating that sales in the foreign market in question are at below-cost prices. Id.
Cost of Production Pursuant to section 773(b)(3) of the
Act, COP consists of the cost of manufacturing (‘‘COM’’); SG&A expenses; financial expenses; and packing expenses. Petitioners calculated raw materials, labor, energy, and packing costs based on the average production experience of two U.S. producers of galvanized steel wire adjusted for known differences to manufacture galvanized steel wire in Mexico using publicly available data. See Mexico Initiation Checklist at 8–10. For further discussion regarding Petitioners’ calculation of raw materials, labor, energy, and packing, see the ‘‘Normal Value Based on Constructed Value’’ section of this notice. Petitioners could not find financial statements for a Mexican manufacturer that produced comparable merchandise which did not have a fully integrated manufacturing process, and therefore, reported zero overhead expense in calculating COP and CV. While this is a conservative approach for the initiation, if the Department needs to rely on the Petition rate as facts available during the proceeding, it may be necessary to calculate an overhead cost using some reasonable alternative in calculating COP and CV. To calculate the SG&A and profit, Petitioners relied on the fiscal year 2009 financial statements of a Mexican producer of comparable merchandise. See the ‘‘Normal Value Based on Constructed Value’’ section of this notice; see also Volume II of the Petitions at II–5 and Exhibit II–3; Second Supplement to the AD/CVD Petitions at (Second SUPP)–3 and Revised Exhibits II–4 and II–6.
Based upon a comparison of the prices of the foreign like product in the home market to the calculated COP of the product, we find reasonable grounds to believe or suspect that sales of the foreign like product were made below the COP, within the meaning of section 773(b)(2)(A)(i) of the Act. Accordingly, the Department is initiating a country- wide cost investigation.
Normal Value Based on Constructed Value
Because Petitioners alleged sales below cost, pursuant to sections 773(a)(4), 773(b) and 773(e) of the Act, they calculated NV based on CV. Petitioners based CV on the average of two U.S. producers’ actual consumption of direct materials, direct labor, energy, and general expenses, plus amounts for
profit and packing, for several major types of galvanized steel wire. See Volume II of the Petitions at II–4 and Exhibit I–2. Believing the consumption experience of domestic U.S. producers to be very similar to consumption in the Mexican galvanized steel wire market, due to the little difference in production processes between Mexican and U.S. galvanized steel wire producers, Petitioners calculated raw materials, labor, energy, and packing costs on that experience. See Volume II of the Petitions at II–4 and footnote 8. Petitioners provided Mexican import statistics from the GTA to demonstrate the value of each raw material input for purposes of calculating direct materials. See Volume II of the Petitions at Exhibit II–3; see also Supplement to the Mexico Petition at Exhibit (Supp-II)–3. Petitioners based cost of labor on expected wages in Mexico as recorded on the Import Administration Web site. See Volume II of the Petitions at II–5. As discussed in the ‘‘Cost of Production’’ section of this notice, Petitioners reported zero overhead expense in calculating COP and CV. Petitioners provided financial statements for the year 2009 from Ternium Mexico S.A. de C.V. (Ternium), a Mexican manufacturer of comparable merchandise, for the calculation of SG&A and profit. See Volume II of the Petitions at II–5 and Exhibit II–3; see also Supplement to the Mexico Petition at (Supp-II)–5 through (Supp-II)–6; Second Supplement to the AD/CVD Petitions at (Second Supp)–3 and Revised Exhibits II–4 and II–6; see also Mexico Initiation Checklist.
Fair Value Comparisons
Based on the data provided by Petitioners, there is reason to believe that imports of galvanized steel wire from the PRC and Mexico are being, or are likely to be, sold in the United States at less than fair value. Based on a comparison of EPs and NV calculated in accordance with section 773(c) of the Act, the estimated dumping margins for galvanized steel wire from the PRC, using the Department’s revised financial ratios, range from 171 percent to 235 percent. See PRC Initiation Checklist at 10 and Appendix V. Based on a comparison of EPs and CV calculated in accordance with section 773(a)(4) of the Act, the estimated dumping margins for galvanized steel wire from Mexico range from 166 percent to 244 percent. See Mexico Initiation Checklist at 11; see also Second Supplement to the AD/CVD Petitions at Revised Exhibit II–6.
VerDate Mar<15>2010 15:36 Apr 26, 2011 Jkt 223001 PO 00000 Frm 00017 Fmt 4703 Sfmt 4703 E:\FR\FM\27APN1.SGM 27APN1WR
eier
-Avi
les
on D
SK
GB
LS3C
1PR
OD
with
NO
TIC
ES

23553 Federal Register / Vol. 76, No. 81 / Wednesday, April 27, 2011 / Notices
Initiation of Antidumping Investigations
Based upon the examination of the Petitions on galvanized steel wire from the PRC and Mexico, the Department finds that the Petitions meet the requirements of section 732 of the Act. Therefore, we are initiating antidumping duty investigations to determine whether imports of galvanized steel wire from the PRC and Mexico are being, or are likely to be, sold in the United States at less than fair value. In accordance with section 733(b)(1)(A) of the Act and 19 CFR 351.205(b)(1), unless postponed, we will make our preliminary determinations no later than 140 days after the date of these initiations.
Targeted Dumping Allegations On December 10, 2008, the
Department issued an interim final rule for the purpose of withdrawing 19 CFR 351.414(f) and (g), the regulatory provisions governing the targeted dumping analysis in antidumping duty investigations, and the corresponding regulation governing the deadline for targeted dumping allegations, 19 CFR 351.301(d)(5). See Withdrawal of the Regulatory Provisions Governing Targeted Dumping in Antidumping Duty Investigations, 73 FR 74930 (December 10, 2008). The Department stated that ‘‘{w}ithdrawal will allow the Department to exercise the discretion intended by the statute and, thereby, develop a practice that will allow interested parties to pursue all statutory avenues of relief in this area.’’ See id. at 74931.
In order to accomplish this objective, if any interested party wishes to make a targeted dumping allegation in either of these investigations pursuant to section 777A(d)(1)(B) of the Act, such allegations are due no later than 45 days before the scheduled date of the country-specific preliminary determination.
Respondent Selection
The PRC After considering the large number of
producers and exporters of galvanized steel wire from the PRC identified by Petitioners, and considering the resources that must be utilized by the Department to mail quantity and value questionnaires to all 279 identified producers and exporters—including entering each address in a shipping handler’s Web site, researching companies’ addresses to ensure correctness, organizing mailings, and following up on potentially undeliverable mailings—the Department
has thus determined that we do not have sufficient administrative resources to mail quantity and value questionnaires to all 279 identified producers and exporters. See Volume I of the Petitions at Exhibit I–10, and Supplement to the PRC Petition, at Exhibit (Supp–III)–I. Therefore, the Department has determined to limit the number of quantity and value questionnaires it will send out to exporters and producers based on U.S. Customs and Border Protection (‘‘CBP’’) data for U.S. imports under the Harmonized Tariff Schedule of the United States (‘‘HTSUS’’) numbers 7217.20.3000, 7217.20.4510, 7217.20.4520, 7217.20.4530, 7217.20.4540, 7217.20.4550, 7217.20.4560, 7217.20.4570, and 7217.20.4580. These are the same HTSUS numbers used by Petitioners to demonstrate that dumping occurred during the POI, and closely match the subject merchandise. See Volume I of the Petitions at Exhibit I–8 and Exhibit I–12; see also Appendix I of this notice. The Department will review the CBP data and comments from parties on the CBP data to determine how many quantity and value questionnaires we will mail to producers and exporters of galvanized steel wire from the PRC.
The Department requires that the respondents submit a response to both the quantity and value questionnaire and the separate-rate application by the deadline noted below in order to receive consideration for separate-rate status. See Circular Welded Austenitic Stainless Pressure Pipe from the People’s Republic of China: Initiation of Antidumping Duty Investigation, 73 FR 10221, 10225 (February 26, 2008); Initiation of Antidumping Duty Investigation: Certain Artist Canvas From the People’s Republic of China, 70 FR 21996, 21999 (April 28, 2005). Although the Department is limiting the number of quantity and value questionnaires it will send out, exporters and producers of galvanized steel wire that do not receive quantity and value questionnaires that intend to submit a response can obtain a copy from the Import Administration Web site. The Department will post the quantity and value questionnaire along with the filing instructions on the Import Administration Web site at http://ia.ita.doc.gov/ia-highlights-and- news.html and a response to the quantity and value questionnaire is due no later than May 25, 2011.
Mexico Following standard practice in AD
investigations involving ME countries, the Department intends to select
respondents based on CBP data for U.S. imports under the HTSUS numbers 7217.20.30 and 7217.20.45. We intend to release the CBP data under Administrative Protective Order (‘‘APO’’) to all parties with access to information protected by APO within five days of publication of this Federal Register notice and make our decision regarding respondent selection within 20 days of publication of this notice. The Department invites comments regarding the CBP data and respondent selection within seven days of publication of this Federal Register notice.
Interested parties must submit applications for disclosure under APO in accordance with 19 CFR 351.305. Instructions for filing such applications may be found on the Department’s Web site at http://ia.ita.doc.gov/apo.
Separate Rates In order to obtain separate-rate status
in NME investigations, exporters and producers must submit a separate-rate status application. See Policy Bulletin 05.1: Separate-Rates Practice and Application of Combination Rates in Antidumping Investigations involving Non-Market Economy Countries (April 5, 2005) (‘‘Separate Rates and Combination Rates Bulletin’’), available on the Department’s Web site at http:// ia.ita.doc.gov/policy/bull05-1.pdf. Based on our experience in processing the separate-rate applications in previous antidumping duty investigations, we have modified the application for this investigation to make it more administrable and easier for applicants to complete. See, e.g., Initiation of Antidumping Duty Investigation: Certain New Pneumatic Off-the-Road Tires From the People’s Republic of China, 72 FR 43591, 43594–95 (August 6, 2007). The specific requirements for submitting the separate-rate application in this investigation are outlined in detail in the application itself, which will be available on the Department’s Web site at http://ia.ita.doc.gov/ia- highlights-and-news.html on the date of publication of this initiation notice in the Federal Register. The separate-rate application will be due 60 days after publication of this initiation notice. For exporters and producers who submit a separate-rate status application and subsequently are selected as mandatory respondents, these exporters and producers will no longer be eligible for consideration for separate rate status unless they respond to all parts of the questionnaire as mandatory respondents. As noted in the ‘‘Respondent Selection’’ section above, the Department requires that
VerDate Mar<15>2010 15:36 Apr 26, 2011 Jkt 223001 PO 00000 Frm 00018 Fmt 4703 Sfmt 4703 E:\FR\FM\27APN1.SGM 27APN1WR
eier
-Avi
les
on D
SK
GB
LS3C
1PR
OD
with
NO
TIC
ES

23554 Federal Register / Vol. 76, No. 81 / Wednesday, April 27, 2011 / Notices
respondents submit a response to both the quantity and value questionnaire and the separate-rate application by the respective deadlines in order to receive consideration for separate-rate status. The quantity and value questionnaire will be available on the Department’s Web site at http://ia.ita.doc.gov/ia- highlights-and-news.html on the date of the publication of this initiation notice in the Federal Register.
Use of Combination Rates in an NME Investigation
The Department will calculate combination rates for certain respondents that are eligible for a separate rate in this investigation. The Separate Rates and Combination Rates Bulletin states: {w}hile continuing the practice of assigning separate rates only to exporters, all separate rates that the Department will now assign in its NME investigations will be specific to those producers that supplied the exporter during the period of investigation. Note, however, that one rate is calculated for the exporter and all of the producers which supplied subject merchandise to it during the period of investigation. This practice applies both to mandatory respondents receiving an individually calculated separate rate as well as the pool of non-investigated firms receiving the weighted-average of the individually calculated rates. This practice is referred to as the application of ‘‘combination rates’’ because such rates apply to specific combinations of exporters and one or more producers. The cash-deposit rate assigned to an exporter will apply only to merchandise both exported by the firm in question and produced by a firm that supplied the exporter during the period of investigation.
See Separate Rates and Combination Rates Bulletin, at 6 (emphasis added).
Distribution of Copies of the Petitions In accordance with section
732(b)(3)(A) of the Act and 19 CFR 351.202(f), copies of the public versions of the Petitions have been provided to the representatives of the Governments of the PRC and Mexico. Because of the large number of producers/exporters identified in the Petitions, the Department considers the service of the public version of the Petitions to the foreign producers/exporters satisfied by the delivery of the public versions of the Petitions to the Governments of the PRC and Mexico, consistent with 19 CFR 351.203(c)(2).
ITC Notification We have notified the ITC of our
initiations, as required by section 732(d) of the Act.
Preliminary Determinations by the ITC The ITC will preliminarily determine,
no later than May 16, 2011, whether
there is a reasonable indication that imports of galvanized steel wire from the PRC and Mexico are materially injuring, or threatening material injury to a U.S. industry. A negative ITC determination with respect to any country will result in the investigation being terminated for that country; otherwise, these investigations will proceed according to statutory and regulatory time limits.
Notification to Interested Parties
Interested parties must submit applications for disclosure under APO in accordance with 19 CFR 351.305. On January 22, 2008, the Department published Antidumping and Countervailing Duty Proceedings: Documents Submission Procedures; APO Procedures (73 FR 3634). Parties wishing to participate in these investigations should ensure that they meet the requirements of these procedures (e.g., the filing of letters of appearance as discussed at 19 CFR 351.103(d)).
Any party submitting factual information in an AD/CVD proceeding must certify to the accuracy and completeness of that information. See section 782(b) of the Act. Parties are hereby reminded that revised certification requirements are in effect for company/government officials as well as their representatives in all segments of any AD/CVD proceedings initiated on or after March 14, 2011. See Certification of Factual Information to Import Administration During Antidumping and Countervailing Duty Proceedings: Interim Final Rule, 76 FR 7491 (February 10, 2011) (Interim Final Rule) amending 19 CFR 351.303(g)(1) & (2). The formats for the revised certifications are provided at the end of the Interim Final Rule. The Department intends to reject factual submissions in any proceeding segments initiated on or after March 14, 2011, if the submitting party does not comply with the revised certification requirements.
This notice is issued and published pursuant to section 777(i) of the Act.
Dated: April 20, 2011. Ronald K. Lorentzen, Deputy Assistant Secretary for Import Administration.
Appendix I
Scope of the Investigations
The scope of these investigations covers galvanized steel wire which is a cold-drawn carbon quality steel product in coils, of solid, circular cross section with an actual diameter of 0.5842 mm (0.0230 inch) or more, plated or coated with zinc (whether by hot-dipping or electroplating).
Steel products to be included in the scope of these investigations, regardless of Harmonized Tariff Schedule of the United States (‘‘HTSUS’’) definitions, are products in which: (1) Iron predominates, by weight, over each of the other contained elements; (2) the carbon content is two percent or less, by weight; and (3) none of the elements listed below exceeds the quantity, by weight, respectively indicated:
• 1.80 percent of manganese, or • 1.50 percent of silicon, or • 1.00 percent of copper, or • 0.50 percent of aluminum, or • 1.25 percent of chromium, or • 0.30 percent of cobalt, or • 0.40 percent of lead, or • 1.25 percent of nickel, or • 0.30 percent of tungsten, or • 0.02 percent of boron, or • 0.10 percent of molybdenum, or • 0.10 percent of niobium, or • 0.41 percent of titanium, or • 0.15 percent of vanadium, or • 0.15 percent of zirconium. The products subject to these
investigations are currently classified in subheadings 7217.20.30 and 7217.20.45 of the HTSUS which cover galvanized wire of all diameters and all carbon content. Galvanized wire is reported under statistical reporting numbers 7217.20.3000, 7217.20.4510, 7217.20.4520, 7217.20.4530, 7217.20.4540, 7217.20.4550, 7217.20.4560, 7217.20.4570, and 7217.20.4580. These products may also enter under HTSUS subheadings 7229.20.0015, 7229.90.5008, 7229.90.5016, 7229.90.5031, and 7229.90.5051. Although the HTSUS subheadings are provided for convenience and Customs purposes, the written description of the merchandise is dispositive.
[FR Doc. 2011–10220 Filed 4–26–11; 8:45 am]
BILLING CODE 3510–DS–P
DEPARTMENT OF COMMERCE
International Trade Administration
[A–570–972, A–583–848]
Certain Stilbenic Optical Brightening Agents From the People’s Republic of China and Taiwan: Initiation of Antidumping Duty Investigations
AGENCY: Import Administration, International Trade Administration, Department of Commerce. DATES: Effective Date: April 27, 2011. FOR FURTHER INFORMATION CONTACT: Shawn Higgins at (202) 482–0679 or Robert Bolling at (202) 482–3434 (People’s Republic of China), AD/CVD Enforcement, Office 4 or Hermes Pinilla at (202) 482–3477 or Sandra Stewart at (202) 482–0768 (Taiwan), AD/CVD Enforcement, Office 5, Import Administration, International Trade Administration, U.S. Department of Commerce, 14th Street and Constitution Avenue, NW., Washington, DC 20230.
VerDate Mar<15>2010 15:36 Apr 26, 2011 Jkt 223001 PO 00000 Frm 00019 Fmt 4703 Sfmt 4703 E:\FR\FM\27APN1.SGM 27APN1WR
eier
-Avi
les
on D
SK
GB
LS3C
1PR
OD
with
NO
TIC
ES

23564 Federal Register / Vol. 76, No. 81 / Wednesday, April 27, 2011 / Notices
party does not comply with the revised certification requirements.
This notice is issued and published pursuant to section 777(i) of the Act.
Dated: April 20, 2011. Ronald K. Lorentzen, Deputy Assistant Secretary for Import Administration.
Appendix I—Scope of the Investigation The merchandise covered by this
investigation includes certain steel nails having a shaft length up to 12 inches. Certain steel nails include, but are not limited to, nails made of round wire and nails that are cut. Certain steel nails may be of one piece construction or constructed of two or more pieces. Certain steel nails may be produced from any type of steel, and have a variety of finishes, heads, shanks, point types, shaft lengths and shaft diameters. Finishes include, but are not limited to, coating in vinyl, zinc (galvanized, whether by electroplating or hot- dipping one or more times), phosphate cement, and paint. Head styles include, but are not limited to, flat, projection, cupped, oval, brad, headless, double, countersunk, and sinker. Shank styles include, but are not limited to, smooth, barbed, screw threaded, ring shank and fluted shank styles. Screw-threaded nails subject to this investigation are driven using direct force and not by turning the fastener using a tool that engages with the head. Point styles include, but are not limited to, diamond, blunt, needle, chisel and no point. Certain steel nails may be sold in bulk, or they may be collated into strips or coils using materials such as plastic, paper, or wire.
Certain steel nails subject to this investigation are currently classified under the Harmonized Tariff Schedule of the United States (HTSUS) subheadings 7317.00.55, 7317.00.65, and 7317.00.75.
Excluded from the scope of this investigation are steel nails specifically enumerated and identified in ASTM Standard F 1667 (2005 revision) as Type I, Style 20 nails, whether collated or in bulk, and whether or not galvanized.
Also excluded from the scope of this investigation are the following products:
• Non-collated (i.e., hand-drive or bulk), two-piece steel nails having plastic or steel washers (‘‘caps’’) already assembled to the nail, having a bright or galvanized finish, a ring, fluted or spiral shank, an actual length of 0.500″ to 8″, inclusive; an actual shank diameter of 0.1015″ to 0.166″, inclusive; and an actual washer or cap diameter of 0.900″ to 1.10″, inclusive;
• Non-collated (i.e., hand-drive or bulk), steel nails having a bright or
galvanized finish, a smooth, barbed or ringed shank, an actual length of 0.500″ to 4″, inclusive; an actual shank diameter of 0.1015″ to 0.166″, inclusive; and an actual head diameter of 0.3375″ to 0.500″, inclusive, and whose packaging and packaging marking are clearly and prominently labeled ‘‘Roofing’’ or ‘‘Roof’’ nails;
• Wire collated steel nails, in coils, having a galvanized finish, a smooth, barbed or ringed shank, an actual length of 0.500″ to 1.75″, inclusive; an actual shank diameter of 0.116″ to 0.166″, inclusive; and an actual head diameter of 0.3375″ to 0.500″, inclusive, and whose packaging and packaging marking are clearly and prominently labeled ‘‘Roofing’’ or ‘‘Roof’’ nails;
• Non-collated (i.e., hand-drive or bulk), steel nails having a convex head (commonly known as an umbrella head), a smooth or spiral shank, a galvanized finish, an actual length of 1.75″ to 3″, inclusive; an actual shank diameter of 0.131″ to 0.152″, inclusive; and an actual head diameter of 0.450″ to 0.813″, inclusive, and whose packaging and packaging marking are clearly and prominently labeled ‘‘Roofing’’ or ‘‘Roof’’ nails;
• Corrugated nails. A corrugated nail is made of a small strip of corrugated steel with sharp points on one side;
• Thumb tacks, which are currently classified under HTSUS 7317.00.10.00;
• Fasteners suitable for use in powder-actuated hand tools, not threaded and threaded, which are currently classified under HTSUS 7317.00.20 and 7317.00.30;
• Certain steel nails that are equal to or less than 0.0720 inches in shank diameter, round or rectangular in cross section, between 0.375 inches and 2.5 inches in length, and that are collated with adhesive or polyester film tape backed with a heat seal adhesive; and
• Fasteners having a case hardness greater than or equal to 50 HRC, a carbon content greater than or equal to 0.5 percent, a round head, a secondary reduced-diameter raised head section, a centered shank, and a smooth symmetrical point, suitable for use in gas-actuated hand tools.
While the HTSUS subheadings are provided for convenience and customs purposes, the written description of the scope of this investigation is dispositive. [FR Doc. 2011–10187 Filed 4–26–11; 8:45 am]
BILLING CODE 3510–DS–P
DEPARTMENT OF COMMERCE
International Trade Administration
[C–570–976]
Galvanized Steel Wire From the People’s Republic of China: Initiation of Countervailing Duty Investigation
AGENCY: Import Administration, International Trade Administration, Department of Commerce. DATES: Effective Date: April 27, 2011. FOR FURTHER INFORMATION CONTACT: Nicholas Czajkowski or David Lindgren, AD/CVD Operations, Office 6, Import Administration, International Trade Administration, U.S. Department of Commerce, 14th Street, and Constitution Avenue, NW., Washington, DC 20230; telephone: (202) 482–1395 or (202) 482–3870, respectively. SUPPLEMENTARY INFORMATION:
The Petition
On March 31, 2011, the Department of Commerce (the Department) received a countervailing duty (CVD) petition concerning imports of galvanized steel wire from the People’s Republic of China (PRC) filed in proper form by Davis Wire Corporation, Johnstown Wire Technologies, Inc., Mid-South Wire Company, Inc., National Standard, LLC, and Oklahoma Steel & Wire Company, Inc. (Petitioners), domestic producers of galvanized steel wire. See ‘‘Petition for the Imposition of Countervailing Duties on Galvanized Steel Wire from the People’s Republic of China’’ (CVD Petition). On April 6, 2011, the Department requested additional information and clarification of certain areas of the CVD Petition involving the subsidy allegations. On the same day we issued a separate set of requests for information regarding the scope, industry support, and injury sections of the CVD Petition and the accompanying antidumping petitions for Mexico and the PRC. Petitioners filed timely, separate responses to these questionnaires on April 11, 2011 (First Supplement to the CVD Petition and Supplement to the AD/CVD Petitions, respectively). On April 12, 2011, the Department issued a second set of questions regarding general issues, injury information and antidumping- specific topics. On April 14, 2011, Petitioners filed timely responses to the April 12, 2011 questionnaires (Second Supplement to the AD/CVD Petitions). On April 12, 2011, the Department requested additional information regarding the CVD Petition. See Memo to the File from Mark E. Hoadley, Program Manager, AD/CVD Operations,
VerDate Mar<15>2010 15:36 Apr 26, 2011 Jkt 223001 PO 00000 Frm 00029 Fmt 4703 Sfmt 4703 E:\FR\FM\27APN1.SGM 27APN1WR
eier
-Avi
les
on D
SK
GB
LS3C
1PR
OD
with
NO
TIC
ES

23565 Federal Register / Vol. 76, No. 81 / Wednesday, April 27, 2011 / Notices
Office 6, Import Administration ‘‘Telephone Conversation with Counsel for Petitioners: Countervailing Duty Investigation on Galvanized Steel Wire from the People’s Republic of China,’’ dated April 12, 2011. On April 15, 2011, Petitioners filed timey responses to the April 12, 2011 request (Second Supplement to the CVD Petition). In addition Petitioners provided the Department with an additional required certification on April 15, 2011. See Certification Letter filed April 15, 2011.
In accordance with section 702(b)(1) of the Tariff Act of 1930, as amended (the Act), Petitioners allege that producers/exporters of galvanized steel wire in the PRC received countervailable subsidies within the meaning of sections 701 and 771(5) of the Act, and that imports from these producers/exporters materially injure, or threaten material injury to, an industry in the United States.
The Department finds that Petitioners filed the CVD Petition on behalf of the domestic industry because they are an interested party as defined in section 771(9)(C) of the Act and the Petitioners have demonstrated sufficient industry support with respect to the CVD investigation that they are requesting the Department initiate (see ‘‘Determination of Industry Support for the Petition’’ below).
Period of Investigation The period of investigation (POI) is
calendar year 2010, i.e., January 1, 2010, through December 31, 2010. See 19 CFR 351.204(b)(2).
Scope of Investigation The products covered by this
investigation are galvanized steel wire from the PRC. For a full description of the scope of the investigation, please see the ‘‘Scope of the Investigation,’’ Appendix to this notice.
Comments on Scope of Investigation During our review of the CVD
Petition, we discussed the scope with Petitioners to ensure that it is an accurate reflection of the products for which the domestic industry is seeking relief. Moreover, as discussed in the preamble to the regulations (Antidumping Duties; Countervailing Duties; Final Rule, 62 FR 27296, 27323 (May 19, 1997)), we are setting aside a period for interested parties to raise issues regarding product coverage. The Department encourages all interested parties to submit such comments by May 10, 2011, twenty calendar days from the signature date of this notice. All comments must be filed on the records of the China and Mexico
antidumping duty investigations as well as the China countervailing duty investigation. Comments should be addressed to Import Administration’s APO/Dockets Unit, Room 1870, U.S. Department of Commerce, 14th Street and Constitution Avenue, NW., Washington, DC 20230. The period of scope consultations is intended to provide the Department with ample opportunity to consider all comments and to consult with parties prior to the issuance of the preliminary determinations.
Consultations Pursuant to section 702(b)(4)(A)(ii) of
the Act, the Department held consultations with the Government of the PRC (GOC) with respect to the CVD Petition on April 14, 2011. See Memorandum to the File, dated April 15, 2011, ‘‘Consultations with Officials from the Government of the People’s Republic of China on the Countervailing Duty Petitions regarding Steel Wheels and Galvanized Steel Wire’’ a public document on file in the Central Records Unit (CRU), Room 7046 of the main Department of Commerce building.
Determination of Industry Support for the Petition
Section 702(b)(1) of the Act requires that a petition be filed on behalf of the domestic industry. Section 702(c)(4)(A) of the Act provides that a petition meets this requirement if the domestic producers or workers who support the petition account for: (i) At least 25 percent of the total production of the domestic like product; and (ii) more than 50 percent of the production of the domestic like product produced by that portion of the industry expressing support for, or opposition to, the petition. Moreover, section 702(c)(4)(D) of the Act provides that, if the petition does not establish support of domestic producers or workers accounting for more than 50 percent of the total production of the domestic like product, the Department shall: (i) Poll the industry or rely on other information in order to determine if there is support for the petition, as required by subparagraph (A), or (ii) determine industry support using a statistically valid sampling method to poll the ‘‘industry.’’
Section 771(4)(A) of the Act defines the ‘‘industry’’ as the producers as a whole of a domestic like product. Thus, to determine whether a petition has the requisite industry support, the statute directs the Department to look to producers and workers who produce the domestic like product. The International Trade Commission (ITC), which is
responsible for determining whether ‘‘the domestic industry’’ has been injured, must also determine what constitutes a domestic like product in order to define the industry. While both the Department and the ITC must apply the same statutory definition regarding the domestic like product (section 771(10) of the Act), they do so for different purposes and pursuant to a separate and distinct authority. In addition, the Department’s determination is subject to limitations of time and information. Although this may result in different definitions of the like product, such differences do not render the decision of either agency contrary to law. See USEC, Inc. v. United States, 132 F. Supp. 2d 1, 8 (Ct. Int’l Trade 2001), citing Algoma Steel Corp., Ltd. v. United States, 688 F. Supp. 639, 644 (Ct. Int’l Trade 1988), aff’d 865 F.2d 240 (Fed. Cir. 1989), cert. denied 492 U.S. 919 (1989).
Section 771(10) of the Act defines the domestic like product as ‘‘a product which is like, or in the absence of like, most similar in characteristics and uses with, the article subject to an investigation under this title.’’ Thus, the reference point from which the domestic like product analysis begins is ‘‘the article subject to an investigation’’ (i.e., the class or kind of merchandise to be investigated, which normally will be the scope as defined in the petition).
With regard to the domestic like product, Petitioners do not offer a definition of domestic like product distinct from the scope of the investigation. Based on our analysis of the information submitted on the record, we have determined that galvanized steel wire constitutes a single domestic like product and we have analyzed industry support in terms of that domestic like product. For a discussion of the domestic like product analysis in this case, see ‘‘Countervailing Duty Investigation Initiation Checklist: Galvanized Steel Wire from the People’s Republic of China’’ (CVD Initiation Checklist), at Attachment II, ‘‘Analysis of Industry Support for the Petitions Covering Galvanized Steel Wire from the People’s Republic of China,’’ on file in the Central Records Unit (CRU), Room 7046 of the main Department of Commerce building.
In determining whether Petitioners have standing under section 702(c)(4)(A) of the Act, we considered the industry support data contained in the CVD Petition with reference to the domestic like product as defined in the ‘‘Scope of the Investigation’’ Appendix to this notice. To establish industry support, Petitioners provided their own 2010 production of the domestic like
VerDate Mar<15>2010 15:36 Apr 26, 2011 Jkt 223001 PO 00000 Frm 00030 Fmt 4703 Sfmt 4703 E:\FR\FM\27APN1.SGM 27APN1WR
eier
-Avi
les
on D
SK
GB
LS3C
1PR
OD
with
NO
TIC
ES

23566 Federal Register / Vol. 76, No. 81 / Wednesday, April 27, 2011 / Notices
1 On April 18, 2011, the Department placed Deacero’s filing on the records of the AD and CVD petitions concerning the PRC. See Memorandum to the File from Norbert Gannon, Office of Policy, entitled, Petitions for the Imposition of Antidumping Duties on Imports of Galvanized Steel Wire from the People’s Republic of China (the PRC) and Mexico and Countervailing Duties on Imports of Galvanized Steel Wire from the PRC—Deacero S.A. de C.V.’s April 14, 2011, Letter to the Department of Commerce.
product, and compared this to the estimated total production of the domestic like product for the entire domestic industry. See Volume I of the Petitions, at I–3 through I–5, and Exhibits I–1 through I–5; Supplement to the AD/CVD Petitions, dated April 11, 2011, at 1, 7 and Exhibit Supp-I–7; Second Supplement to the AD/CVD Petitions, dated April 14, 2011, at 2, and Exhibit 2; and Second Revised Exhibit I–1; see also CVD Initiation Checklist at Attachment II.
On April 14, 2011, we received an industry support challenge from a Mexican producer of galvanized steel wire and its U.S. affiliate. See Letter from Deacero, titled ‘‘Galvanized Steel Wire from Mexico—Comments on Industry Support,’’ dated April 14, 2011.1 This submission was placed on the record of the CVD Petition on April 18, 2011. See Letter from Petitioners, titled ‘‘Petitioners’ Response to Question about U.S. industry,’’ dated April 18, 2011. Petitioner responded to this submission on April 18, 2011. Our review of the data provided in the CVD Petition, supplemental submissions, and other information readily available to the Department indicates that Petitioners have established industry support. See CVD Initiation Checklist at Attachment II. First, the CVD Petition established support from domestic producers (or workers) accounting for more than 50 percent of the total production of the domestic like product and, as such, the Department is not required to take further action in order to evaluate industry support (e.g., polling). See section 702(c)(4)(D) of the Act; see also CVD Initiation Checklist at Attachment II. Second, the domestic producers (or workers) have met the statutory criteria for industry support under section 702(c)(4)(A)(i) of the Act because the domestic producers (or workers) who support the CVD Petition account for at least 25 percent of the total production of the domestic like product. See CVD Initiation Checklist at Attachment II. Finally, the domestic producers (or workers) have met the statutory criteria for industry support under section 702(c)(4)(A)(ii) of the Act because the domestic producers (or workers) who support the CVD Petition account for more than 50 percent of the
production of the domestic like product produced by that portion of the industry expressing support for, or opposition to, the CVD Petition. Accordingly, the Department determines that the CVD Petition was filed on behalf of the domestic industry within the meaning of section 702(b)(1) of the Act. See CVD Initiation Checklist at Attachment II.
The Department finds that Petitioners filed the CVD Petition on behalf of the domestic industry because they are an interested party as defined in sections 771(9)(C) of the Act and have demonstrated sufficient industry support with respect to the CVD investigation that they are requesting the Department initiate. See CVD Initiation Checklist at Attachment II.
Injury Test Because the PRC is a ‘‘Subsidies
Agreement Country’’ within the meaning of section 701(b) of the Act, section 701(a)(2) of the Act applies to this investigation. Accordingly, the ITC must determine whether imports of subject merchandise from the PRC materially injure, or threaten material injury to, a U.S. industry.
Allegations and Evidence of Material Injury and Causation
Petitioners allege that imports of galvanized steel wire from the PRC are benefitting from countervailable subsidies and that such imports are causing, or threatening to cause, material injury to the domestic industry producing galvanized steel wire. In addition, Petitioners allege that subsidized imports exceed the negligibility threshold provided for under section 771(24)(A) of the Act.
Petitioners contend that the industry’s injured condition is illustrated by reduced market share, lost sales and revenues, reduced production, reduced shipments, reduced capacity utilization rate, underselling and price depression and suppression, reduced workforce, decline in financial performance, and an increase in import penetration. We have assessed the allegations and supporting evidence regarding material injury, threat of material injury, and causation, and we have determined that these allegations are properly supported by adequate evidence and meet the statutory requirements for initiation. See CVD Initiation Checklist at Attachment III.
Initiation of Countervailing Duty Investigation
Section 702(b)(1) of the Act requires the Department to initiate a CVD proceeding whenever an interested party files a CVD petition on behalf of
an industry that: (1) Alleges the elements necessary for an imposition of a duty under section 701(a) of the Act; and (2) is accompanied by information reasonably available to the petitioners supporting the allegations.
The Department has examined the CVD Petition on galvanized steel wire from the PRC and finds that it complies with the requirements of section 702(b)(1) of the Act. Therefore, in accordance with section 702(b)(1) of the Act, we are initiating a CVD investigation to determine whether producers/exporters of galvanized steel wire in the PRC receive countervailable subsidies. For a discussion of evidence supporting our initiation determination, see CVD Initiation Checklist.
We are including in our investigation the following programs alleged in the CVD Petition to provide countervailable subsidies to producers/exporters of the subject merchandise.
A. Preferential Loans and Interest Rates
1. Policy Loans to the Galvanized Steel Wire Industry
2. Preferential Loans for Key Projects and Technologies
3. Preferential Loans and Directed Credit
4. Preferential Lending to GSW Producers and Exporters Classified as ‘‘Honorable Enterprises’’
5. Loans and Interest Subsidies Provided Pursuant to the Northeast Revitalization Program
B. Government Provision of Inputs for Less than Adequate Remuneration (LTAR)
1. Provision of Wire Rod for LTAR 2. Provision of Zinc for LTAR 3. Provision of Land Use Rights for
LTAR a. Provision of Land Use Rights for
LTAR within the Jinzhou District within the City of Dalian
b. Provision of Land Use Rights for LTAR to Enterprises within the Zhaoqing High-Tech Industry Development Zone in Guangdong Province
c. Provision of Land Use Rights for LTAR to Enterprises within the South Sanshui Science and Technology Industrial Park of Foshan City
4. Provision of Electricity for LTAR
C. Income and Other Direct Taxes
1. Income Tax Credits for Domestically-Owned Companies Purchasing Domestically-Produced Equipment
2. Income Tax Exemption for Investment in Domestic Technological Renovation
VerDate Mar<15>2010 15:36 Apr 26, 2011 Jkt 223001 PO 00000 Frm 00031 Fmt 4703 Sfmt 4703 E:\FR\FM\27APN1.SGM 27APN1WR
eier
-Avi
les
on D
SK
GB
LS3C
1PR
OD
with
NO
TIC
ES

23567 Federal Register / Vol. 76, No. 81 / Wednesday, April 27, 2011 / Notices
3. Accelerated Depreciation for Enterprises Located in the Northeast Region
4. Forgiveness of Tax Arrears for Enterprises in the Old Industrial Bases of Northeast China
5. Income Tax Exemption for Investors in Designated Geographical Regions within Liaoning Province
D. Indirect Tax and Tariff Exemption Programs
1. VAT Deduction on Fixed Assets 2. Export Subsidies Characterized as
‘‘VAT Rebates’’ 3. Import Tariff and VAT Exemptions
for Foreign Invested Enterprises and Certain Domestic Enterprises Using Imported Equipment in Encouraged Industries
4. Reduction in or Exemption from Fixed Assets Investment Orientation Regulatory Tax
E. Grant Programs
1. ‘‘Five Points, One Line’’ Program of Liaoning Province
2. Provincial Export Interest Subsidies 3. State Key Technology Project Fund 4. Export Assistance Grants 5. Subsidies for Development of
Famous Export Brands and China World Top Brands
6. Sub-Central Government Programs to Promote Famous Export Brands and China World Top Brands
7. Zhejiang Province Program to Rebate Antidumping Legal Fees
8. Technology to Improve Trade Research and Development Fund of Jiangsu Province
9. Outstanding Growth Private Enterprise and Small and Medium- Sized Enterprises Development in Jiangyin Fund of Jiangyin City
10. Grants for Programs Under the 2007 Science and Technology Development Plan in Shandong Province
11. Special Funds for Encouraging Foreign Economic and Trade Development and for Drawing Significant Foreign Investment Projects in Shandong Province
F. Preferential Tax Subsidies for FIEs
1. ‘‘Two Free, Three Half’’ Tax Exemptions for ‘‘Productive’’ FIEs
2. Income Tax Exemption Program for Export-Oriented FIEs
3. Local Income Tax Exemption and Reduction Programs for ‘‘Productive’’ FIEs
4. Preferential Tax Programs for FIEs Recognized as High or New Technology Enterprises
5. Income Tax Subsidies for FIEs Based on Geographic Location
6. VAT Refunds for FIEs Purchasing Domestically-Produced Equipment
7. Income Tax Credits for FIEs Purchasing Domestically-Produced Equipment
8. Exemption from City Construction Tax and Education Fee for FIEs
For a description of each of these programs and a full discussion of the Department’s decision to initiate an investigation of these programs, see CVD Initiation Checklist.
We are not including in our investigation the following programs alleged to benefit producers/exporters of the subject merchandise in the PRC.
1. Export Loans from Policy Banks and State-Owned Commercial Banks (SOCBs)
2. Government Restraints on Exports of Raw Materials: Wire Rod
3. Government Restraints on Exports of Raw Materials: Zinc
4. Tax Reduction for Enterprises Making Little Profit
5. Provincial Fund for Fiscal and Technological Innovation
6. International Market Exploration Fund (SME Fund)
7. Funds for Water Treatment and Pollution Control Projects for the Three Rivers and Three Lakes in Shandong Province
8. Undervaluation of Chinese Currency
For further information explaining why the Department is not initiating an investigation of these programs, see CVD Initiation Checklist.
Respondent Selection
For this investigation, the Department intends to select respondents based on U.S. Customs and Border Protection (CBP) data for U.S. imports during the POI. We intend to release the CBP data under Administrative Protective Order (APO) to all parties with access to information protected by APO within five days of the announcement of the initiation of this investigation. Interested parties may submit comments regarding the CBP data and respondent selection within seven calendar days of publication of this notice. We intend to make our decision regarding respondent selection within 20 days of publication of this Federal Register notice. Interested parties must submit applications for disclosure under APO in accordance with 19 CFR 351.305(b). Instructions for filing such applications may be found on the Department’s Web site at http://ia.ita.doc.gov/apo.
Distribution of Copies of the Petition
In accordance with section 702(b)(4)(A)(i) of the Act, copies of the public versions of the CVD Petition and amendments thereto have been provided to the GOC. Because of the
particularly large number of producers/ exporters identified in the CVD Petition, the Department considers the service of the public version of the petition to the foreign producers/exporters satisfied by the delivery of the public version to the GOC, consistent with 19 CFR 351.203(c)(2).
ITC Notification We have notified the ITC of our
initiation, as required by section 702(d) of the Act.
Preliminary Determination by the ITC The ITC will preliminarily determine,
within 45 days after the date on which the CVD Petition was filed, whether there is a reasonable indication that imports of allegedly subsidized galvanized steel wire from the PRC materially injure, or threaten material injury to, a U.S. industry. See section 703(a)(2) of the Act. A negative ITC determination will result in the investigation being terminated. See section 703(a)(1) of the Act. Otherwise, the investigation will proceed according to statutory and regulatory time limits.
Notification to Interested Parties Interested parties must submit
applications for disclosure under administrative protective orders in accordance with 19 CFR 351.305. On January 22, 2008, the Department published Antidumping and Countervailing Duty Proceedings: Documents Submission Procedures; APO Procedures, (73 FR 3634). Parties wishing to participate in these investigations should ensure that they meet the requirements of these procedures (e.g., the filing of letters of appearance as discussed at 19 CFR 351.103(d)).
Any party submitting factual information in an AD/CVD proceeding must certify to the accuracy and completeness of that information. See section 782(b) of the Act. Parties are hereby reminded that revised certification requirements are in effect for company/government officials as well as their representatives in all segments of any AD/CVD proceedings initiated on or after March 14, 2011. See Certification of Factual Information to Import Administration During Antidumping and Countervailing Duty Proceedings: Interim Final Rule, 76 FR 7491 (February 10, 2011) (Interim Final Rule) amending 19 CFR 351.303(g)(1) and (2). The formats for the revised certifications are provided at the end of the Interim Final Rule. The Department intends to reject factual submissions in any proceeding segments initiated on or after March 14, 2011, if the submitting
VerDate Mar<15>2010 15:36 Apr 26, 2011 Jkt 223001 PO 00000 Frm 00032 Fmt 4703 Sfmt 4703 E:\FR\FM\27APN1.SGM 27APN1WR
eier
-Avi
les
on D
SK
GB
LS3C
1PR
OD
with
NO
TIC
ES

23568 Federal Register / Vol. 76, No. 81 / Wednesday, April 27, 2011 / Notices
party does not comply with the revised certification requirements.
This notice is issued and published pursuant to section 777(i) of the Act.
Dated: April 20, 2011. Ronald K. Lorentzen, Deputy Assistant Secretary for Import Administration.
Appendix—Scope of the Investigation
The scope of the investigation covers galvanized steel wire which is a cold- drawn carbon quality steel product in coils, of solid, circular cross section with an actual diameter of 0.5842 mm (0.0230 inch) or more, plated or coated with zinc (whether by hot-dipping or electroplating).
Steel products to be included in the scope of the investigation, regardless of Harmonized Tariff Schedule of the United States (‘‘HTSUS’’) definitions, are products in which: (1) Iron predominates, by weight, over each of the other contained elements; (2) the carbon content is two percent or less, by weight; and (3) none of the elements listed below exceeds the quantity, by weight, respectively indicated: • 1.80 percent of manganese, or • 1.50 percent of silicon, or • 1.00 percent of copper, or • 0.50 percent of aluminum, or • 1.25 percent of chromium, or • 0.30 percent of cobalt, or • 0.40 percent of lead, or • 1.25 percent of nickel, or • 0.30 percent of tungsten, or • 0.02 percent of boron, or • 0.10 percent of molybdenum, or • 0.10 percent of niobium, or • 0.41 percent of titanium, or • 0.15 percent of vanadium, or • 0.15 percent of zirconium.
The products subject to the investigation are currently classified in subheadings 7217.20.30 and 7217.20.45 of the HTSUS which cover galvanized wire of all diameters and all carbon content. Galvanized wire is reported under statistical reporting numbers 7217.20.3000, 7217.20.4510, 7217.20.4520, 7217.20.4530, 7217.20.4540, 7217.20.4550, 7217.20.4560, 7217.20.4570, and 7217.20.4580. These products may also enter under HTSUS subheadings 7229.20.0015, 7229.90.5008, 7229.90.5016, 7229.90.5031, and 7229.90.5051. Although the HTSUS subheadings are provided for convenience and Customs purposes, the written description of the merchandise is dispositive. [FR Doc. 2011–10211 Filed 4–26–11; 8:45 am]
BILLING CODE 3510–DS–P
DEPARTMENT OF COMMERCE
International Trade Administration
Civil Nuclear Trade Advisory Committee Public Meeting
AGENCY: International Trade Administration, Commerce. ACTION: Notice of Federal Advisory Committee meeting.


APPENDIX B
CONFERENCE WITNESSES
B-1


CALENDAR OF PUBLIC PRELIMINARY CONFERENCE
Those listed below appeared as witnesses at the United States International TradeCommission’s preliminary conference:
Subject: Galvanized Steel Wire from China and Mexico
Inv. Nos.: 701-TA-479 and 731-TA-1183-1184 (Preliminary)
Date and Time: April 21, 2011 - 1:00 p.m.
Sessions were held in connection with these preliminary investigations in the ALJ CourtroomB (room 111), 500 E Street, S.W., Washington, D.C.
OPENING REMARKS:
Petitioners (Frederick P. Waite, Vorys, Sater, Seymour and Pease LLP)Respondents (Jay C. Campbell, White & Case LLP and Mark E. Pardo, Grunfeld, Desiderio,Lebowitz, Silverman
& Klestadt LLP)
In Support of the Imposition of Antidumping and Countervailing Duty Orders:
Vorys, Sater, Seymour and Pease LLPWashington, D.C.on behalf of
Davis Wire CorporationJohnstown Wire Technologies, Inc.Mid-South Wire Company, Inc.National Standard, LLCOklahoma Steel & Wire Company, Inc.
Peter M. Cronin, Corporate Vice President, Salesand Marketing, Heico Wire Group (DavisWire Corporation and National Standard, LLC)
John T. Johnson, Jr., President, Mid-South WireCompany, Inc.
B-3

In Support of the Imposition of Antidumping and Countervailing Duty Orders (continued):
David Weinand, Executive Vice President, OklahomaSteel & Wire Company, Inc.
Lou Richards, Vice President Sales, Oklahoma Steel& Wire Company, Inc.
Dr. Patrick Magrath, Economic Consultant, Magrath& Otis LLC
Frederick P. Waite )) – OF COUNSEL
Kimberly R. Young )
In Opposition to the Imposition of Antidumping and Countervailing Duty Orders:
Grunfeld, Desiderio, Lebowitz, Silverman & Klestadt LLPWashington, D.C.on behalf of
Wire Products Association Branch, China SteelConstruction and its individual members
JJ Zhang, General Manager, B&Z GalvanizedWire Industry
Bruce Malashevich, President, EconomicConsulting Services, LLC
Francis J. Sailer )) – OF COUNSEL
Mark E. Pardo )
B-4

In Opposition to the Imposition of Antidumping and Countervailing Duty Orders (continued):
White & Case LLPWashington, D.C.on behalf of
Deacero S.A. de C.V.Deacero USA, Inc.
Daniel M. Gutierrez, Vice President of IndustrialSales, Deacero S.A. de C.V.
Randall M. Lenz, Sales Manager, Stay-TuffFence Mfg. Inc.
Jay C. Campbell )) – OF COUNSEL
Kristina Zissis )
CLOSING REMARKS:
Petitioners (Frederick P. Waite, Vorys, Sater, Seymour and Pease LLP)Respondents (Jay C. Campbell, White & Case LLP and Mark E. Pardo,
Grunfeld, Desiderio, Lebowitz, Silverman & Klestadt LLP)
B-5


APPENDIX C
SUMMARY DATA
C-1


Table C-1Galvanized steel wire: Summary data concerning the U.S. market, 2008-10
(Quantity=short tons, value=1,000 dollars, unit values, unit labor costs, and unit expenses are per short ton; period changes=percent, except where noted)
Reported data Period changes
Item 2008 2009 2010 2008-10 2008-09 2009-10
U.S. consumption quantity: Amount . . . . . . . . . . . . . . . . . . . 752,814 607,360 667,630 -11.3 -19.3 9.9 Producers' share (1) . . . . . . . . . 70.2 72.6 72.8 2.7 2.5 0.2 Importers' share (1): China . . . . . . . . . . . . . . . . . . . . 8.6 6.9 6.1 -2.5 -1.7 -0.8 Mexico . . . . . . . . . . . . . . . . . . . 5.2 7.5 10.1 4.9 2.2 2.6 Subtotal . . . . . . . . . . . . . . . . . 13.8 14.3 16.2 2.4 0.5 1.8 All other sources . . . . . . . . . . . 16.1 13.0 11.0 -5.0 -3.0 -2.0 Total imports . . . . . . . . . . . . . 29.8 27.4 27.2 -2.7 -2.5 -0.2
U.S. consumption value: Amount . . . . . . . . . . . . . . . . . . . 902,778 598,029 669,567 -25.8 -33.8 12.0 Producers' share (1) . . . . . . . . . 68.8 72.2 73.3 4.5 3.4 1.1 Importers' share (1): China . . . . . . . . . . . . . . . . . . . . 8.6 6.8 5.7 -2.9 -1.9 -1.0 Mexico . . . . . . . . . . . . . . . . . . . 5.7 7.7 8.4 2.7 2.0 0.8 Subtotal . . . . . . . . . . . . . . . . . 14.3 14.4 14.1 -0.2 0.1 -0.3 All other sources . . . . . . . . . . . 16.9 13.4 12.5 -4.3 -3.5 -0.8 Total imports . . . . . . . . . . . . . 31.2 27.8 26.7 -4.5 -3.4 -1.1
U.S. imports from: China: Quantity . . . . . . . . . . . . . . . . . . 64,487 41,743 40,486 -37.2 -35.3 -3.0 Value . . . . . . . . . . . . . . . . . . . . 77,871 40,371 38,252 -50.9 -48.2 -5.2 Unit value . . . . . . . . . . . . . . . . $1,208 $967 $945 -21.8 -19.9 -2.3 Ending inventory quantity . . . . 11,602 6,508 6,298 -45.7 -43.9 -3.2 Mexico: Quantity . . . . . . . . . . . . . . . . . . 39,325 45,335 67,410 71.4 15.3 48.7 Value . . . . . . . . . . . . . . . . . . . . 51,333 45,878 56,437 9.9 -10.6 23.0 Unit value . . . . . . . . . . . . . . . . $1,305 $1,012 $837 -35.9 -22.5 -17.3 Ending inventory quantity . . . . *** *** *** *** *** *** Subtotal: Quantity . . . . . . . . . . . . . . . . . . 103,811 87,078 107,897 3.9 -16.1 23.9 Value . . . . . . . . . . . . . . . . . . . . 129,204 86,249 94,689 -26.7 -33.2 9.8 Unit value . . . . . . . . . . . . . . . . $1,245 $990 $878 -29.5 -20.4 -11.4 Ending inventory quantity . . . . *** *** *** *** *** *** All other sources: Quantity . . . . . . . . . . . . . . . . . . 120,865 79,085 73,613 -39.1 -34.6 -6.9 Value . . . . . . . . . . . . . . . . . . . . 152,486 80,069 83,999 -44.9 -47.5 4.9 Unit value . . . . . . . . . . . . . . . . $1,262 $1,012 $1,141 -9.6 -19.8 12.7 Ending inventory quantity . . . . *** *** *** *** *** *** All sources: Quantity . . . . . . . . . . . . . . . . . . 224,676 166,163 181,510 -19.2 -26.0 9.2 Value . . . . . . . . . . . . . . . . . . . . 281,690 166,318 178,688 -36.6 -41.0 7.4 Unit value . . . . . . . . . . . . . . . . $1,254 $1,001 $984 -21.5 -20.2 -1.6 Ending inventory quantity . . . . *** *** *** *** *** ***
Table continued on next page.
C-3

Table C-1--ContinuedGalvanized steel wire: Summary data concerning the U.S. market, 2008-10
(Quantity=short tons, value=1,000 dollars, unit values, unit labor costs, and unit expenses are per short ton; period changes=percent, except where noted)
Reported data Period changes
Item 2008 2009 2010 2008-10 2008-09 2009-10
U.S. producers': Average capacity quantity . . . . . 809,538 809,538 897,988 10.9 0.0 10.9 Production quantity . . . . . . . . . . 534,175 442,041 492,223 -7.9 -17.2 11.4 Capacity utilization (1) . . . . . . . . 66.0 54.6 54.8 -11.2 -11.4 0.2 U.S. shipments: Quantity . . . . . . . . . . . . . . . . . . 528,138 441,197 486,120 -8.0 -16.5 10.2 Value . . . . . . . . . . . . . . . . . . . . 621,088 431,710 490,880 -21.0 -30.5 13.7 Unit value . . . . . . . . . . . . . . . . $1,176 $978 $1,010 -14.1 -16.8 3.2 Export shipments: Quantity . . . . . . . . . . . . . . . . . . *** *** *** *** *** *** Value . . . . . . . . . . . . . . . . . . . . *** *** *** *** *** *** Unit value . . . . . . . . . . . . . . . . *** *** *** *** *** *** Ending inventory quantity . . . . . 29,126 23,931 25,034 -14.0 -17.8 4.6 Inventories/total shipments (1) . *** *** *** *** *** *** Production workers . . . . . . . . . . 693 670 666 -3.9 -3.3 -0.6 Hours worked (1,000s) . . . . . . . 1,598 1,459 1,481 -7.3 -8.7 1.5 Wages paid ($1,000s) . . . . . . . . 30,521 28,789 28,501 -6.6 -5.7 -1.0 Hourly wages . . . . . . . . . . . . . . . $19.10 $19.73 $19.24 0.8 3.3 -2.5 Productivity (tons/1,000 hours) . 334.3 303.0 332.4 -0.6 -9.4 9.7 Unit labor costs . . . . . . . . . . . . . $57.14 $65.13 $57.90 1.3 14.0 -11.1 Net sales: Quantity . . . . . . . . . . . . . . . . . . 532,841 443,562 489,294 -8.2 -16.8 10.3 Value . . . . . . . . . . . . . . . . . . . . 639,237 433,898 492,052 -23.0 -32.1 13.4 Unit value . . . . . . . . . . . . . . . . $1,200 $978 $1,006 -16.2 -18.5 2.8 Cost of goods sold (COGS) . . . . 593,574 414,201 463,957 -21.8 -30.2 12.0 Gross profit or (loss) . . . . . . . . . 45,663 19,697 28,095 -38.5 -56.9 42.6 SG&A expenses . . . . . . . . . . . . 27,185 25,790 28,618 5.3 -5.1 11.0 Operating income or (loss) . . . . 18,478 (6,093) (524) (2) (2) 91.4 Capital expenditures . . . . . . . . . *** *** *** *** *** *** Unit COGS . . . . . . . . . . . . . . . . $1,114 $934 $948 -14.9 -16.2 1.5 Unit SG&A expenses . . . . . . . . . $51 $58 $58 14.6 14.0 0.6 Unit operating income or (loss) . $35 ($14) ($1) (2) (2) 92.2 COGS/sales (1) . . . . . . . . . . . . . 92.9 95.5 94.3 1.4 2.6 -1.2 Operating income or (loss)/ sales (1) . . . . . . . . . . . . . . . . . . 2.9 -1.4 -0.1 -3.0 -4.3 1.3
(1) "Reported data" are in percent and "period changes" are in percentage points. (2) Not applicable.
Note.--Financial data are reported on a fiscal year basis and may not necessarily be comparable to data reportedon a calendar year basis. Because of rounding, figures may not add to the totals shown. Unit values and sharesare calculated from the unrounded figures.
Source: Compiled from data submitted in response to Commission questionnaires and from official Commerce statistics.

Table C-2Galvanized steel wire: Summary data concerning the U.S. open market, 2008-10
(Quantity=short tons, value=1,000 dollars, unit values, unit labor costs, and unit expenses are per short ton; period changes=percent, except where noted)
Reported data Period changes
Item 2008 2009 2010 2008-10 2008-09 2009-10
U.S. OM consumption quantity: Amount . . . . . . . . . . . . . . . . . . . *** *** *** *** *** *** Producers' share (1) . . . . . . . . . *** *** *** *** *** *** Importers' share (1): China . . . . . . . . . . . . . . . . . . . . *** *** *** *** *** *** Mexico . . . . . . . . . . . . . . . . . . . *** *** *** *** *** *** Subtotal . . . . . . . . . . . . . . . . . *** *** *** *** *** *** All other sources . . . . . . . . . . . *** *** *** *** *** *** Total imports . . . . . . . . . . . . . *** *** *** *** *** ***
U.S. OM consumption value: Amount . . . . . . . . . . . . . . . . . . . *** *** *** *** *** *** Producers' share (1) . . . . . . . . . *** *** *** *** *** *** Importers' share (1): China . . . . . . . . . . . . . . . . . . . . *** *** *** *** *** *** Mexico . . . . . . . . . . . . . . . . . . . *** *** *** *** *** *** Subtotal . . . . . . . . . . . . . . . . . *** *** *** *** *** *** All other sources . . . . . . . . . . . *** *** *** *** *** *** Total imports . . . . . . . . . . . . . *** *** *** *** *** ***
U.S. imports from: China: Quantity . . . . . . . . . . . . . . . . . . 64,487 41,743 40,486 -37.2 -35.3 -3.0 Value . . . . . . . . . . . . . . . . . . . . 77,871 40,371 38,252 -50.9 -48.2 -5.2 Unit value . . . . . . . . . . . . . . . . . $1,208 $967 $945 -21.8 -19.9 -2.3 Ending inventory quantity . . . . 11,602 6,508 6,298 -45.7 -43.9 -3.2 Mexico: Quantity . . . . . . . . . . . . . . . . . . 39,325 45,335 67,410 71.4 15.3 48.7 Value . . . . . . . . . . . . . . . . . . . . 51,333 45,878 56,437 9.9 -10.6 23.0 Unit value . . . . . . . . . . . . . . . . . $1,305 $1,012 $837 -35.9 -22.5 -17.3 Ending inventory quantity . . . . *** *** *** *** *** *** Subtotal: Quantity . . . . . . . . . . . . . . . . . . 103,811 87,078 107,897 3.9 -16.1 23.9 Value . . . . . . . . . . . . . . . . . . . . 129,204 86,249 94,689 -26.7 -33.2 9.8 Unit value . . . . . . . . . . . . . . . . . $1,245 $990 $878 -29.5 -20.4 -11.4 Ending inventory quantity . . . . *** *** *** *** *** *** All other sources: Quantity . . . . . . . . . . . . . . . . . . 120,865 79,085 73,613 -39.1 -34.6 -6.9 Value . . . . . . . . . . . . . . . . . . . . 152,486 80,069 83,999 -44.9 -47.5 4.9 Unit value . . . . . . . . . . . . . . . . . $1,262 $1,012 $1,141 -9.6 -19.8 12.7 Ending inventory quantity . . . . *** *** *** *** *** *** All sources: Quantity . . . . . . . . . . . . . . . . . . 224,676 166,163 181,510 -19.2 -26.0 9.2 Value . . . . . . . . . . . . . . . . . . . . 281,690 166,318 178,688 -36.6 -41.0 7.4 Unit value . . . . . . . . . . . . . . . . . $1,254 $1,001 $984 -21.5 -20.2 -1.6 Ending inventory quantity . . . . *** *** *** *** *** ***
U.S. producers': U.S. commercial shipments: Quantity . . . . . . . . . . . . . . . . . . *** *** *** *** *** *** Value . . . . . . . . . . . . . . . . . . . . *** *** *** *** *** *** Unit value . . . . . . . . . . . . . . . . . *** *** *** *** *** *** Commercial sales: Quantity . . . . . . . . . . . . . . . . . . *** *** *** *** *** *** Value . . . . . . . . . . . . . . . . . . . . *** *** *** *** *** *** Unit value . . . . . . . . . . . . . . . . . *** *** *** *** *** *** Cost of goods sold (COGS) . . . . *** *** *** *** *** *** Gross profit or (loss) . . . . . . . . . *** *** *** *** *** *** SG&A expenses . . . . . . . . . . . . *** *** *** *** *** *** Operating income or (loss) . . . . *** *** *** *** *** *** Unit COGS . . . . . . . . . . . . . . . . . *** *** *** *** *** *** Unit SG&A expenses . . . . . . . . . *** *** *** *** *** *** Unit operating income or (loss) . *** *** *** *** *** *** COGS/sales (1) . . . . . . . . . . . . . *** *** *** *** *** *** Operating income or (loss)/ sales (1) . . . . . . . . . . . . . . . . . . *** *** *** *** *** ***
(1) "Reported data" are in percent and "period changes" are in percentage points.
Note.--Financial data are reported on a fiscal year basis and may not necessarily be comparable to data reportedon a calendar year basis. Because of rounding, figures may not add to the totals shown. Unit values and sharesare calculated from the unrounded figures.
Source: Compiled from data submitted in response to Commission questionnaires and from official Commerce statist
C-5


APPENDIX D
NONSUBJECT COUNTRY PRICE DATA
D-1


Three importers reported price data for nonsubject country Canada for products 1 and 2. Theseprice items and accompanying data are comparable to those presented in tables V-1 and V-2.
In comparing nonsubject country pricing data with U.S. producer pricing data, prices for productimported from Canada were lower than prices for U.S.-produced product in 7 instances and higher in 17instances. In comparing nonsubject country pricing data with subject country pricing data, prices forproduct imported from Canada were lower than prices for product imported from subject countries in 3instances and higher in 35 instances. Specifically, prices for product imported from Canada were higherthan prices for product imported from China in 14 of 17 instances and higher than prices for productimported from Mexico in all 21 instances. Price and quantity data for Canada are shown in tables D-1 toD-2 and in figure D-1 (with domestic and subject sources).
Table D-1Galvanized steel wire: Weighted-average f.o.b. prices and quantities of nonsubject importedproduct 1,1 by quarters, January 2008-December 2010
Period
Canada
Price (per short ton)
Quantity(short tons)
2008: Jan.-Mar. $*** ***
Apr.-June *** ***
July-Sept. *** ***
Oct.-Dec. *** ***
2009: Jan.-Mar. *** ***
Apr.-June *** ***
July-Sept. *** ***
Oct.-Dec. *** ***
2010: Jan.-Mar. *** ***
Apr.-June *** ***
July-Sept. *** ***
Oct.-Dec. *** ***
1 Product 1: 0.148-inch (3.76mm) diameter, low carbon galvanized wire, Class 1 (zinc) coating, for industrial use.
Source: Compiled from data submitted in response to Commission questionnaires.
D-3

Table D-2Galvanized steel wire: Weighted-average f.o.b. prices and quantities of nonsubject importedproduct 2,1 by quarters, January 2008-December 2010
Period
Canada
Price (per short ton)
Quantity(short tons)
2008: Jan.-Mar. $*** ***
Apr.-June *** ***
July-Sept. *** ***
Oct.-Dec. *** ***
2009: Jan.-Mar. *** ***
Apr.-June *** ***
July-Sept. *** ***
Oct.-Dec. *** ***
2010: Jan.-Mar. *** ***
Apr.-June *** ***
July-Sept. *** ***
Oct.-Dec. *** ***
1 Product 2: 0.085-inch (2.16mm) diameter, low carbon galvanized wire, Commercial coating, for industrial use.
Source: Compiled from data submitted in response to Commission questionnaires.
Figure D-1Galvanized steel wire: Weighted-average f.o.b. prices and quantities of domestic and importedproduct, by quarters, January 2008-December 2010
* * * * * * *
D-4

APPENDIX E
ALLEGED EFFECTS OF IMPORTS ON U.S. PRODUCERS’ EXISTINGDEVELOPMENT AND PRODUCTION EFFORTS, GROWTH, INVESTMENT,
AND ABILITY TO RAISE CAPITAL
E-1


The Commission requested U.S. processors to describe any actual or potential negative effectssince January 1, 2008, on their return on investment, growth, investment, ability to raise capital, existingdevelopment and production efforts (including efforts to develop a derivative or more advanced versionof the product), or the scale of capital investments as a result of imports of galvanized steel wire fromChina and Mexico. Their responses are as follows:
Actual Negative Effects
Bekaert.–***
Davis Wire.–***
Johnstown Wire.–***
Keystone.–***
Leggett & Platt.–***
Mid-South Wire.–***
National Standard.–***
Oklahoma Steel & Wire.–***
WireCo.–***
Anticipated Negative Effects
Bekaert.–***
Davis Wire.–***
Johnstown Wire.–***
Keystone.–***
Leggett & Platt.–***
Mid-South Wire.–***
National Standard.–***
E-3

Oklahoma Steel & Wire.–***
WireCo.–***
E-4