GALEX Catalog of UV Point Sources in M33 - arXiv
12
arXiv:1407.1050v2 [astro-ph.SR] 3 Jul 2015 Mon. Not. R. Astron. Soc. 000, 000–000 (0000) Printed 30 March 2021 (MN L A T E X style file v2.2) GALEX Catalog of UV Point Sources in M33 Dale Mudd 1 , K.Z. Stanek 1 1 Dept. of Astronomy, The Ohio State University, 140 W. 18th Ave., Columbus, OH 43210 E-mail: [email protected] 30 March 2021 ABSTRACT The hottest stars (>10,000 K), and by extension typically the most massive ones, are those that will be prevalent in the ultraviolet (UV) portion of the electromagnetic spectrum, and we expect to numerous B, O, and Wolf-Rayet stars to be bright in UV data. In this paper, we update the previous point source UV catalog of M33, created using the Ultraviolet Imaging Telescope (UIT), using data from the Galaxy Evolution Explorer (GALEX). We utilize PSF photometry to optimally photometer sources in the crowded regions of the galaxy, and benefit from GALEX’s increased sensitivity compared to UIT. We match our detections with data from the Local Group Galaxies Survey (LGGS, Massey et al. 2006) to create a catalog with photometry spanning from the far-UV through the optical for a final list of 24738 sources. All of these sources have far-UV (FUV; 1516Å), near-UV (NUV; 2267Å), and V data, and a significant fraction also have U, B, R, and I data as well. We also present an additional 3000 sources that have no matching optical counterpart. We compare all of our sources to a catalog of known Wolf-Rayet stars in M33 (Neugent & Massey 2011) and find that we recover 114 of 206 stars with spatially-coincident UV point sources. Additionally, we highlight and investi- gate those sources with unique colors as well as a selection of other well-studied sources in M33. 1 INTRODUCTION M33, also known as the Triangulum Galaxy, was "officially" dis- covered by Messier (1781), although it might have been noted more than a century earlier by Hodierno (1654). There is a wide range of calculated distances for this Local Group galaxy, ranging from 700- 1100 kpc, and we adopt a distance of d = 964 kpc (Bonanos et al. 2006). Being so close, it is a well-studied galaxy indeed: as of April 2015, the Astrophysics Data System reveals >1,200 refer- eed articles with “M33” in the abstract. M33 has been studied across many wavelengths (e.g., Helfer et al. 2003; Massey et al. 2006; Warner et al. 1973; Pietsch et al. 2004; Long et al. 2010; Thompson et al. 2009; Massey et al. 1996) and across time (e.g., Hubble 1926; Hubble & Sandage 1953; Freedman et al. 1991; Macri et al. 2001; Hartman et al. 2006). Perhaps surprisingly, there have been relatively few studies of M33 in UV wavelengths (e.g., Massey et al. 1996; Thilker et al. 2005), and no catalog of point sources based on GALEX images of M33 has been published, a situation which we rectify in this paper. The Galaxy Evolution Explorer (GALEX) was launched in 2003. It was designed as a UV all-sky survey, with 5 smaller sur- veys making up the first portion of the mission. Specifically, we employ data from the Nearby Galaxy Survey (NGS) in the cur- rent work. The goal of the telescope was to gain a better un- derstanding of galaxy evolution by studying local star formation, star formation histories, extinction, and UV galaxy morphology (Martin & GALEX Science Team 2003). The instrument consisted of a 50 cm telescope connected to two sealed tube detectors and microchannel plates with a peak quantum efficiency of about 10%. The dichroic splitter allowed for simultaneous observation in both the near and far UV filters spanning from 1350 to 2800Å. The cir- cular field of view on the telescope had a diameter of roughly 1.2°. For more on the technical aspects of GALEX, see Jelinsky et al. (2003) and Morrissey et al. (2007). A UV study of M33 is of potentially great importance. The most massive stars may appear quite faint in an optical survey since most of their emission may be concentrated in shorter wavelength bands. As such, a mission such as GALEX is ideal for identifying and characterizing these massive stars. Wolf-Rayet stars are also much more prominent in the UV with their extreme surface tem- peratures. In this work, we create a catalog of UV point sources in M33 using the GALEX space telescope. We match this to a ground- based optical catalog, as well as a list of known Wolf-Rayet stars, in the galaxy and present photometric data spanning seven filters for tens of thousands of sources, which can be used for numerous astrophysical applications. We begin by discussing the methods used for the construc- tion of our catalog and matching against the previous UV and op- tical catalogs of M33 in §2. In §3, we discuss the most interesting sources and aspects of our final product and then conclude. 2 DATA AND METHODS 2.1 UV Photometry We begin with the UV science images 1 of M33 taken with the GALEX space telescope during the NGS on November 11, 2003. There are several pointings at M33 as part of GALEX’s survey. 1 We retrieved these images from the Barbara A. Mikulski Archive for Space Telescopes (MAST).
Transcript of GALEX Catalog of UV Point Sources in M33 - arXiv

arX
iv:1
407.
1050
v2 [
astr
o-ph
.SR
] 3
Jul 2
015
Mon. Not. R. Astron. Soc.000, 000–000 (0000) Printed 30 March 2021 (MN LATEX style file v2.2)
GALEX Catalog of UV Point Sources in M33
Dale Mudd1, K.Z. Stanek11Dept. of Astronomy, The Ohio State University, 140 W. 18th Ave., Columbus, OH 43210E-mail: [email protected]
30 March 2021
ABSTRACTThe hottest stars (>10,000 K), and by extension typically the most massive ones,are thosethat will be prevalent in the ultraviolet (UV) portion of theelectromagnetic spectrum, and weexpect to numerous B, O, and Wolf-Rayet stars to be bright in UV data. In this paper, weupdate the previous point source UV catalog of M33, created using the Ultraviolet ImagingTelescope (UIT), using data from the Galaxy Evolution Explorer (GALEX). We utilize PSFphotometry to optimally photometer sources in the crowded regions of the galaxy, and benefitfrom GALEX’s increased sensitivity compared to UIT. We match our detections with datafrom the Local Group Galaxies Survey (LGGS, Massey et al. 2006) to create a catalog withphotometry spanning from the far-UV through the optical fora final list of 24738 sources.All of these sources have far-UV (FUV; 1516Å), near-UV (NUV;2267Å), andV data, and asignificant fraction also haveU, B, R, andI data as well. We also present an additional 3000sources that have no matching optical counterpart. We compare all of our sources to a catalogof known Wolf-Rayet stars in M33 (Neugent & Massey 2011) and find that we recover 114 of206 stars with spatially-coincident UV point sources. Additionally, we highlight and investi-gate those sources with unique colors as well as a selection of other well-studied sources inM33.
1 INTRODUCTION
M33, also known as the Triangulum Galaxy, was "officially" dis-covered by Messier (1781), although it might have been notedmorethan a century earlier by Hodierno (1654). There is a wide range ofcalculated distances for this Local Group galaxy, ranging from 700-1100 kpc, and we adopt a distance of d = 964 kpc (Bonanos et al.2006). Being so close, it is a well-studied galaxy indeed: asofApril 2015, the Astrophysics Data System reveals>1,200 refer-eed articles with “M33” in the abstract. M33 has been studiedacross many wavelengths (e.g., Helfer et al. 2003; Massey etal.2006; Warner et al. 1973; Pietsch et al. 2004; Long et al. 2010;Thompson et al. 2009; Massey et al. 1996) and across time (e.g.,Hubble 1926; Hubble & Sandage 1953; Freedman et al. 1991;Macri et al. 2001; Hartman et al. 2006). Perhaps surprisingly, therehave been relatively few studies of M33 in UV wavelengths (e.g.,Massey et al. 1996; Thilker et al. 2005), and no catalog of pointsources based on GALEX images of M33 has been published, asituation which we rectify in this paper.
The Galaxy Evolution Explorer (GALEX) was launched in2003. It was designed as a UV all-sky survey, with 5 smaller sur-veys making up the first portion of the mission. Specifically,weemploy data from the Nearby Galaxy Survey (NGS) in the cur-rent work. The goal of the telescope was to gain a better un-derstanding of galaxy evolution by studying local star formation,star formation histories, extinction, and UV galaxy morphology(Martin & GALEX Science Team 2003). The instrument consistedof a 50 cm telescope connected to two sealed tube detectors andmicrochannel plates with a peak quantum efficiency of about 10%.The dichroic splitter allowed for simultaneous observation in boththe near and far UV filters spanning from 1350 to 2800Å. The cir-
cular field of view on the telescope had a diameter of roughly 1.2°.For more on the technical aspects of GALEX, see Jelinsky et al.(2003) and Morrissey et al. (2007).
A UV study of M33 is of potentially great importance. Themost massive stars may appear quite faint in an optical survey sincemost of their emission may be concentrated in shorter wavelengthbands. As such, a mission such as GALEX is ideal for identifyingand characterizing these massive stars. Wolf-Rayet stars are alsomuch more prominent in the UV with their extreme surface tem-peratures. In this work, we create a catalog of UV point sources inM33 using the GALEX space telescope. We match this to a ground-based optical catalog, as well as a list of known Wolf-Rayet stars,in the galaxy and present photometric data spanning seven filtersfor tens of thousands of sources, which can be used for numerousastrophysical applications.
We begin by discussing the methods used for the construc-tion of our catalog and matching against the previous UV and op-tical catalogs of M33 in §2. In §3, we discuss the most interestingsources and aspects of our final product and then conclude.
2 DATA AND METHODS
2.1 UV Photometry
We begin with the UV science images1 of M33 taken with theGALEX space telescope during the NGS on November 11, 2003.There are several pointings at M33 as part of GALEX’s survey.
1 We retrieved these images from the Barbara A. Mikulski Archive forSpace Telescopes (MAST).
© 0000 RAS
2 Dale Mudd and K.Z. Stanek
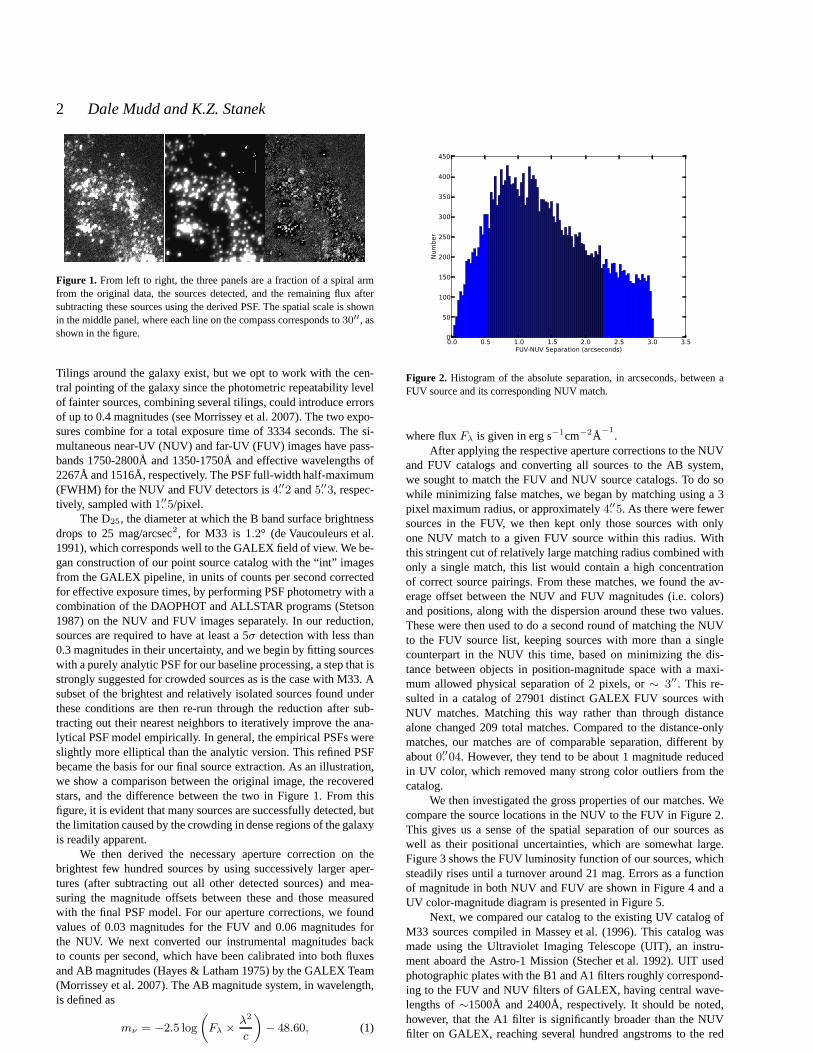
Figure 1. From left to right, the three panels are a fraction of a spiralarmfrom the original data, the sources detected, and the remaining flux aftersubtracting these sources using the derived PSF. The spatial scale is shownin the middle panel, where each line on the compass corresponds to30′′, asshown in the figure.
Tilings around the galaxy exist, but we opt to work with the cen-tral pointing of the galaxy since the photometric repeatability levelof fainter sources, combining several tilings, could introduce errorsof up to 0.4 magnitudes (see Morrissey et al. 2007). The two expo-sures combine for a total exposure time of 3334 seconds. The si-multaneous near-UV (NUV) and far-UV (FUV) images have pass-bands 1750-2800Å and 1350-1750Å and effective wavelengthsof2267Å and 1516Å, respectively. The PSF full-width half-maximum(FWHM) for the NUV and FUV detectors is4.′′2 and5.′′3, respec-tively, sampled with1.′′5/pixel.
The D25, the diameter at which the B band surface brightnessdrops to 25 mag/arcsec2, for M33 is 1.2° (de Vaucouleurs et al.1991), which corresponds well to the GALEX field of view. We be-gan construction of our point source catalog with the “int” imagesfrom the GALEX pipeline, in units of counts per second correctedfor effective exposure times, by performing PSF photometrywith acombination of the DAOPHOT and ALLSTAR programs (Stetson1987) on the NUV and FUV images separately. In our reduction,sources are required to have at least a 5σ detection with less than0.3 magnitudes in their uncertainty, and we begin by fitting sourceswith a purely analytic PSF for our baseline processing, a step that isstrongly suggested for crowded sources as is the case with M33. Asubset of the brightest and relatively isolated sources found underthese conditions are then re-run through the reduction after sub-tracting out their nearest neighbors to iteratively improve the ana-lytical PSF model empirically. In general, the empirical PSFs wereslightly more elliptical than the analytic version. This refined PSFbecame the basis for our final source extraction. As an illustration,we show a comparison between the original image, the recoveredstars, and the difference between the two in Figure 1. From thisfigure, it is evident that many sources are successfully detected, butthe limitation caused by the crowding in dense regions of thegalaxyis readily apparent.
We then derived the necessary aperture correction on thebrightest few hundred sources by using successively largeraper-tures (after subtracting out all other detected sources) and mea-suring the magnitude offsets between these and those measuredwith the final PSF model. For our aperture corrections, we foundvalues of 0.03 magnitudes for the FUV and 0.06 magnitudes forthe NUV. We next converted our instrumental magnitudes backto counts per second, which have been calibrated into both fluxesand AB magnitudes (Hayes & Latham 1975) by the GALEX Team(Morrissey et al. 2007). The AB magnitude system, in wavelength,is defined as
mν = −2.5 log
(
Fλ ×λ2
c
)
− 48.60, (1)
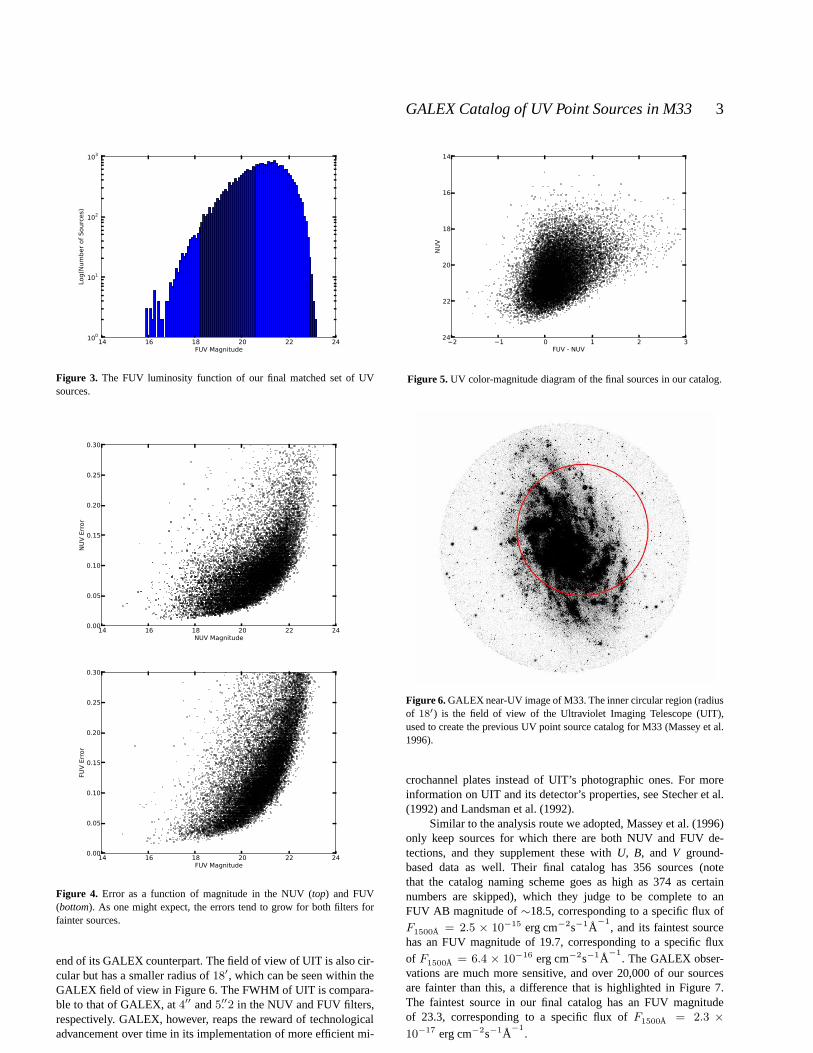
0.0 0.5 1.0 1.5 2.0 2.5 3.0 3.5FUV-NUV Separation (arcseconds)
0
50
100
150
200
250
300
350
400
450
Number
Figure 2. Histogram of the absolute separation, in arcseconds, between aFUV source and its corresponding NUV match.
where fluxFλ is given in erg s−1cm−2Å−1
.After applying the respective aperture corrections to the NUV
and FUV catalogs and converting all sources to the AB system,we sought to match the FUV and NUV source catalogs. To do sowhile minimizing false matches, we began by matching using a3pixel maximum radius, or approximately4.′′5. As there were fewersources in the FUV, we then kept only those sources with onlyone NUV match to a given FUV source within this radius. Withthis stringent cut of relatively large matching radius combined withonly a single match, this list would contain a high concentrationof correct source pairings. From these matches, we found theav-erage offset between the NUV and FUV magnitudes (i.e. colors)and positions, along with the dispersion around these two values.These were then used to do a second round of matching the NUVto the FUV source list, keeping sources with more than a singlecounterpart in the NUV this time, based on minimizing the dis-tance between objects in position-magnitude space with a maxi-mum allowed physical separation of 2 pixels, or∼ 3′′. This re-sulted in a catalog of 27901 distinct GALEX FUV sources withNUV matches. Matching this way rather than through distancealone changed 209 total matches. Compared to the distance-onlymatches, our matches are of comparable separation, different byabout0.′′04. However, they tend to be about 1 magnitude reducedin UV color, which removed many strong color outliers from thecatalog.
We then investigated the gross properties of our matches. Wecompare the source locations in the NUV to the FUV in Figure 2.This gives us a sense of the spatial separation of our sourcesaswell as their positional uncertainties, which are somewhatlarge.Figure 3 shows the FUV luminosity function of our sources, whichsteadily rises until a turnover around 21 mag. Errors as a functionof magnitude in both NUV and FUV are shown in Figure 4 and aUV color-magnitude diagram is presented in Figure 5.
Next, we compared our catalog to the existing UV catalog ofM33 sources compiled in Massey et al. (1996). This catalog wasmade using the Ultraviolet Imaging Telescope (UIT), an instru-ment aboard the Astro-1 Mission (Stecher et al. 1992). UIT usedphotographic plates with the B1 and A1 filters roughly correspond-ing to the FUV and NUV filters of GALEX, having central wave-lengths of∼1500Å and 2400Å, respectively. It should be noted,however, that the A1 filter is significantly broader than the NUVfilter on GALEX, reaching several hundred angstroms to the red
© 0000 RAS, MNRAS000, 000–000
GALEX Catalog of UV Point Sources in M33 3
14 16 18 20 22 24FUV Magnitude
100
101
102
103
Log(Number of Sources)
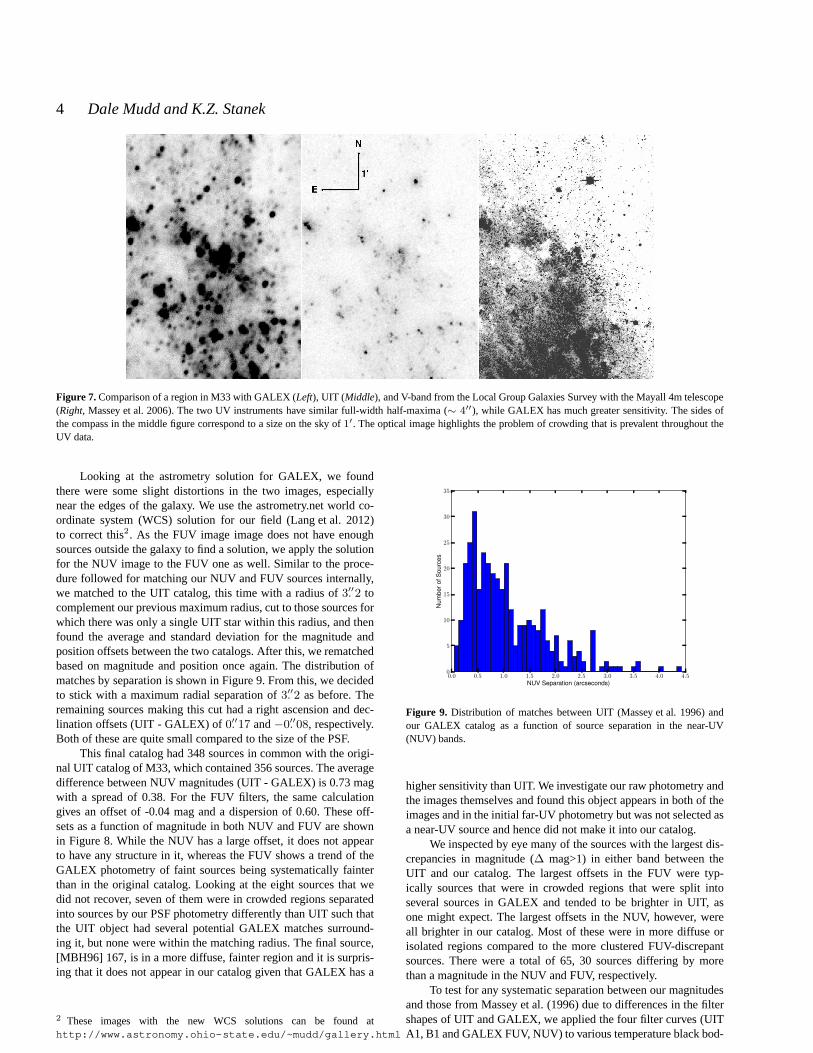
Figure 3. The FUV luminosity function of our final matched set of UVsources.
14 16 18 20 22 24NUV Magnitude
0.00
0.05
0.10
0.15
0.20
0.25
0.30
NUV Error
14 16 18 20 22 24FUV Magnitude
0.00
0.05
0.10
0.15
0.20
0.25
0.30
FUV Error
Figure 4. Error as a function of magnitude in the NUV (top) and FUV(bottom). As one might expect, the errors tend to grow for both filtersforfainter sources.
end of its GALEX counterpart. The field of view of UIT is also cir-cular but has a smaller radius of18′, which can be seen within theGALEX field of view in Figure 6. The FWHM of UIT is compara-ble to that of GALEX, at4′′ and5.′′2 in the NUV and FUV filters,respectively. GALEX, however, reaps the reward of technologicaladvancement over time in its implementation of more efficient mi-
−2 −1 0 1 2 3FUV - NUV
14
16
18
20
22
24
NUV
Figure 5. UV color-magnitude diagram of the final sources in our catalog.
Figure 6. GALEX near-UV image of M33. The inner circular region (radiusof 18′) is the field of view of the Ultraviolet Imaging Telescope (UIT),used to create the previous UV point source catalog for M33 (Massey et al.1996).
crochannel plates instead of UIT’s photographic ones. For moreinformation on UIT and its detector’s properties, see Stecher et al.(1992) and Landsman et al. (1992).
Similar to the analysis route we adopted, Massey et al. (1996)only keep sources for which there are both NUV and FUV de-tections, and they supplement these withU, B, and V ground-based data as well. Their final catalog has 356 sources (notethat the catalog naming scheme goes as high as 374 as certainnumbers are skipped), which they judge to be complete to anFUV AB magnitude of∼18.5, corresponding to a specific flux ofF1500Å = 2.5 × 10⁻¹⁵ erg cm−2s−1Å
−1
, and its faintest sourcehas an FUV magnitude of 19.7, corresponding to a specific fluxof F
1500Å = 6.4 × 10⁻¹⁶ erg cm−2s−1Å−1
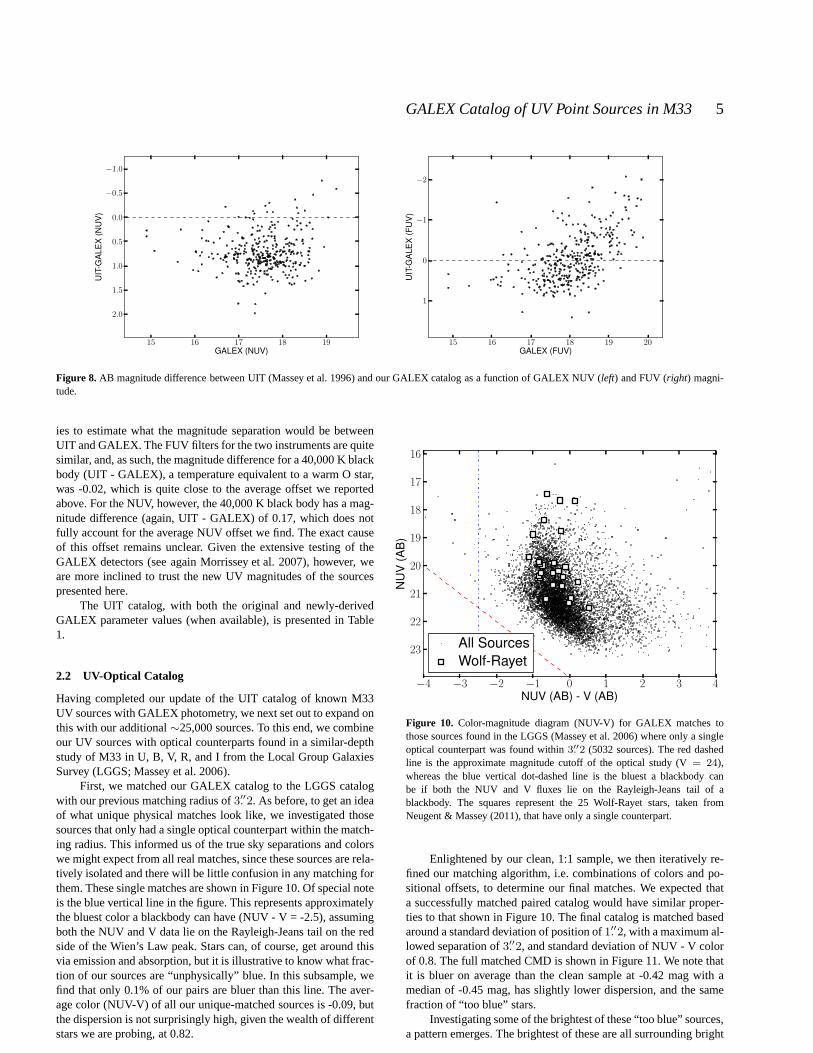
. The GALEX obser-vations are much more sensitive, and over 20,000 of our sourcesare fainter than this, a difference that is highlighted in Figure 7.The faintest source in our final catalog has an FUV magnitudeof 23.3, corresponding to a specific flux ofF
1500Å = 2.3 ×
10−17 erg cm−2s−1Å−1
.
© 0000 RAS, MNRAS000, 000–000
4 Dale Mudd and K.Z. Stanek
Figure 7. Comparison of a region in M33 with GALEX (Left), UIT (Middle), and V-band from the Local Group Galaxies Survey with the Mayall 4m telescope(Right, Massey et al. 2006). The two UV instruments have similar full-width half-maxima (∼ 4
′′), while GALEX has much greater sensitivity. The sides ofthe compass in the middle figure correspond to a size on the skyof 1′. The optical image highlights the problem of crowding that is prevalent throughout theUV data.
Looking at the astrometry solution for GALEX, we foundthere were some slight distortions in the two images, especiallynear the edges of the galaxy. We use the astrometry.net worldco-ordinate system (WCS) solution for our field (Lang et al. 2012)to correct this2. As the FUV image image does not have enoughsources outside the galaxy to find a solution, we apply the solutionfor the NUV image to the FUV one as well. Similar to the proce-dure followed for matching our NUV and FUV sources internally,we matched to the UIT catalog, this time with a radius of3.′′2 tocomplement our previous maximum radius, cut to those sources forwhich there was only a single UIT star within this radius, andthenfound the average and standard deviation for the magnitude andposition offsets between the two catalogs. After this, we rematchedbased on magnitude and position once again. The distribution ofmatches by separation is shown in Figure 9. From this, we decidedto stick with a maximum radial separation of3.′′2 as before. Theremaining sources making this cut had a right ascension and dec-lination offsets (UIT - GALEX) of0.′′17 and−0.′′08, respectively.Both of these are quite small compared to the size of the PSF.
This final catalog had 348 sources in common with the origi-nal UIT catalog of M33, which contained 356 sources. The averagedifference between NUV magnitudes (UIT - GALEX) is 0.73 magwith a spread of 0.38. For the FUV filters, the same calculationgives an offset of -0.04 mag and a dispersion of 0.60. These off-sets as a function of magnitude in both NUV and FUV are shownin Figure 8. While the NUV has a large offset, it does not appearto have any structure in it, whereas the FUV shows a trend of theGALEX photometry of faint sources being systematically fainterthan in the original catalog. Looking at the eight sources that wedid not recover, seven of them were in crowded regions separatedinto sources by our PSF photometry differently than UIT suchthatthe UIT object had several potential GALEX matches surround-ing it, but none were within the matching radius. The final source,[MBH96] 167, is in a more diffuse, fainter region and it is surpris-ing that it does not appear in our catalog given that GALEX hasa
2 These images with the new WCS solutions can be found athttp://www.astronomy.ohio-state.edu/~mudd/gallery.html
Figure 9. Distribution of matches between UIT (Massey et al. 1996) andour GALEX catalog as a function of source separation in the near-UV(NUV) bands.
higher sensitivity than UIT. We investigate our raw photometry andthe images themselves and found this object appears in both of theimages and in the initial far-UV photometry but was not selected asa near-UV source and hence did not make it into our catalog.
We inspected by eye many of the sources with the largest dis-crepancies in magnitude (∆ mag>1) in either band between theUIT and our catalog. The largest offsets in the FUV were typ-ically sources that were in crowded regions that were split intoseveral sources in GALEX and tended to be brighter in UIT, asone might expect. The largest offsets in the NUV, however, wereall brighter in our catalog. Most of these were in more diffuse orisolated regions compared to the more clustered FUV-discrepantsources. There were a total of 65, 30 sources differing by morethan a magnitude in the NUV and FUV, respectively.
To test for any systematic separation between our magnitudesand those from Massey et al. (1996) due to differences in the filtershapes of UIT and GALEX, we applied the four filter curves (UITA1, B1 and GALEX FUV, NUV) to various temperature black bod-
© 0000 RAS, MNRAS000, 000–000
GALEX Catalog of UV Point Sources in M33 5
Figure 8. AB magnitude difference between UIT (Massey et al. 1996) andour GALEX catalog as a function of GALEX NUV (left) and FUV (right) magni-tude.
ies to estimate what the magnitude separation would be betweenUIT and GALEX. The FUV filters for the two instruments are quitesimilar, and, as such, the magnitude difference for a 40,000K blackbody (UIT - GALEX), a temperature equivalent to a warm O star,was -0.02, which is quite close to the average offset we reportedabove. For the NUV, however, the 40,000 K black body has a mag-nitude difference (again, UIT - GALEX) of 0.17, which does notfully account for the average NUV offset we find. The exact causeof this offset remains unclear. Given the extensive testingof theGALEX detectors (see again Morrissey et al. 2007), however,weare more inclined to trust the new UV magnitudes of the sourcespresented here.
The UIT catalog, with both the original and newly-derivedGALEX parameter values (when available), is presented in Table1.
2.2 UV-Optical Catalog
Having completed our update of the UIT catalog of known M33UV sources with GALEX photometry, we next set out to expand onthis with our additional∼25,000 sources. To this end, we combineour UV sources with optical counterparts found in a similar-depthstudy of M33 in U, B, V, R, and I from the Local Group GalaxiesSurvey (LGGS; Massey et al. 2006).
First, we matched our GALEX catalog to the LGGS catalogwith our previous matching radius of3.′′2. As before, to get an ideaof what unique physical matches look like, we investigated thosesources that only had a single optical counterpart within the match-ing radius. This informed us of the true sky separations and colorswe might expect from all real matches, since these sources are rela-tively isolated and there will be little confusion in any matching forthem. These single matches are shown in Figure 10. Of specialnoteis the blue vertical line in the figure. This represents approximatelythe bluest color a blackbody can have (NUV - V = -2.5), assumingboth the NUV and V data lie on the Rayleigh-Jeans tail on the redside of the Wien’s Law peak. Stars can, of course, get around thisvia emission and absorption, but it is illustrative to know what frac-tion of our sources are “unphysically” blue. In this subsample, wefind that only 0.1% of our pairs are bluer than this line. The aver-age color (NUV-V) of all our unique-matched sources is -0.09, butthe dispersion is not surprisingly high, given the wealth ofdifferentstars we are probing, at 0.82.
Figure 10. Color-magnitude diagram (NUV-V) for GALEX matches tothose sources found in the LGGS (Massey et al. 2006) where only a singleoptical counterpart was found within3.′′2 (5032 sources). The red dashedline is the approximate magnitude cutoff of the optical study (V = 24),whereas the blue vertical dot-dashed line is the bluest a blackbody canbe if both the NUV and V fluxes lie on the Rayleigh-Jeans tail ofablackbody. The squares represent the 25 Wolf-Rayet stars, taken fromNeugent & Massey (2011), that have only a single counterpart.
Enlightened by our clean, 1:1 sample, we then iteratively re-fined our matching algorithm, i.e. combinations of colors and po-sitional offsets, to determine our final matches. We expected thata successfully matched paired catalog would have similar proper-ties to that shown in Figure 10. The final catalog is matched basedaround a standard deviation of position of1.′′2, with a maximum al-lowed separation of3.′′2, and standard deviation of NUV - V colorof 0.8. The full matched CMD is shown in Figure 11. We note thatit is bluer on average than the clean sample at -0.42 mag with amedian of -0.45 mag, has slightly lower dispersion, and the samefraction of “too blue” stars.
Investigating some of the brightest of these “too blue” sources,a pattern emerges. The brightest of these are all surrounding bright
© 0000 RAS, MNRAS000, 000–000
6 Dale Mudd and K.Z. Stanek
GA
LE
XP
hotometry
of[MB
H96]S
ources
UIT
αU
δU
αG
δG
FU
VU
NU
VU
FU
VG
NU
VG
FU
VU
-GN
UV
U-G
Sep( ′′)
Matches
223.13300
30.5827523.13335
30.5826218.19
18.3118.03±
0.0617.62±
0.030.09
0.691.18
33
23.1570830.66825
23.1567730.66829
17.4417.35
17.59±
0.0816.86±
0.020.01
0.490.97
24
23.1585430.66797
23.1581330.66810
17.7018.31
17.69±
0.0617.48±
0.03-0.94
0.831.35
15
23.1787130.64644
23.1785530.64642
18.1517.84
18.26±
0.1516.96±
0.011.37
0.880.5
26
23.1858330.58325
23.1859730.58333
17.6717.93
17.80±
0.0917.40±
0.08-0.35
0.530.52
2
Table1:
UIT
sourcesthatw
ererecovered
usingG
AL
EX
data.Here,’M
atches’refers
tothe
number
ofGA
LE
Xobjects
we
findthatare
wit
hin5′′
andcom
patiblew
iththe
givenU
ITsource.
The
subscript’U’stands
forU
IT,whereas
thesubscript’G
’stands
forG
AL
EX
.The
firstfivesources
aregiven
toshow
thefor
matting.T
hefullversion
ofthistable
isavailable
inthe
online
version.
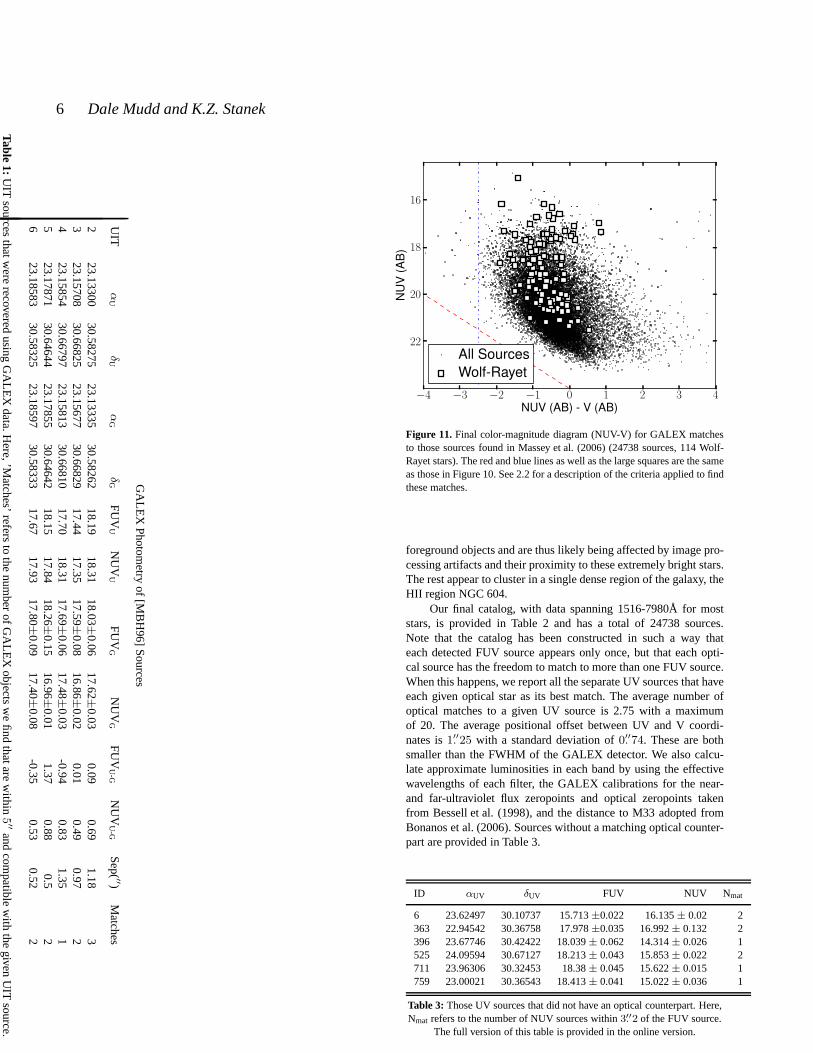
Figure 11. Final color-magnitude diagram (NUV-V) for GALEX matchesto those sources found in Massey et al. (2006) (24738 sources, 114 Wolf-Rayet stars). The red and blue lines as well as the large squares are the sameas those in Figure 10. See 2.2 for a description of the criteria applied to findthese matches.
foreground objects and are thus likely being affected by image pro-cessing artifacts and their proximity to these extremely bright stars.The rest appear to cluster in a single dense region of the galaxy, theHII region NGC 604.
Our final catalog, with data spanning 1516-7980Å for moststars, is provided in Table 2 and has a total of 24738 sources.Note that the catalog has been constructed in such a way thateach detected FUV source appears only once, but that each opti-cal source has the freedom to match to more than one FUV source.When this happens, we report all the separate UV sources thathaveeach given optical star as its best match. The average numberofoptical matches to a given UV source is 2.75 with a maximumof 20. The average positional offset between UV and V coordi-nates is1.′′25 with a standard deviation of0.′′74. These are bothsmaller than the FWHM of the GALEX detector. We also calcu-late approximate luminosities in each band by using the effectivewavelengths of each filter, the GALEX calibrations for the near-and far-ultraviolet flux zeropoints and optical zeropointstakenfrom Bessell et al. (1998), and the distance to M33 adopted fromBonanos et al. (2006). Sources without a matching optical counter-part are provided in Table 3.
ID αUV δUV FUV NUV Nmat
6 23.62497 30.10737 15.713±0.022 16.135± 0.02 2363 22.94542 30.36758 17.978±0.035 16.992± 0.132 2396 23.67746 30.42422 18.039± 0.062 14.314± 0.026 1525 24.09594 30.67127 18.213± 0.043 15.853± 0.022 2711 23.96306 30.32453 18.38± 0.045 15.622± 0.015 1759 23.00021 30.36543 18.413± 0.041 15.022± 0.036 1
Table 3: Those UV sources that did not have an optical counterpart. Here,Nmat refers to the number of NUV sources within3.′′2 of the FUV source.
The full version of this table is provided in the online version.
© 0000 RAS, MNRAS000, 000–000
GA
LE
XC
atalogofU
VPointSources
inM
337
Full Catalog
Name αUV δUV αOpt δOpt FUV errF NUV errF U errU B errB V errV R errR I errI Sep(”) Matches
J013239.46+301952.5 23.16439 30.33169 23.16442 30.3312521.869 0.127 21.862 0.115 22.229 0.021 22.227 0.032 22.608 0.051 22.677 0.1 99.999 99.999 1.587 1J013239.45+302241.6 23.16430 30.37832 23.16437 30.3782220.082 0.056 20.157 0.041 20.425 0.004 20.616 0.009 20.891 0.013 21.049 0.012 21.284 0.004 0.421 2J013239.46+303955.1 23.16413 30.66541 23.16442 30.6653120.340 0.087 19.884 0.037 20.063 0.004 20.225 0.006 20.503 0.008 20.79 0.01 21.121 0.0 0.967 1J013354.22+304410.5 23.47561 30.73663 23.47592 30.7362520.536 0.179 20.303 0.198 19.766 0.003 19.968 0.006 20.257 0.009 20.492 0.011 20.712 0.0 1.671 2J013239.45+302214.4 23.16448 30.37081 23.16437 30.3706720.438 0.061 20.514 0.061 20.563 0.005 20.623 0.012 20.858 0.012 21.114 0.016 21.456 0.0 0.609 1J013349.96+304323.4 23.45809 30.72294 23.45817 30.7231720.662 0.183 19.763 0.058 21.578 0.02 21.149 0.025 21.271 0.03 20.975 0.023 20.17 0.0 0.864 3J013349.96+305256.2 23.45845 30.88262 23.45817 30.8822818.714 0.093 18.665 0.037 19.546 0.014 19.684 0.01 19.904 0.014 19.947 0.017 20.059 0.001 1.499 4J013349.96+305256.2 23.45845 30.88262 23.45817 30.8822820.451 0.104 18.665 0.037 19.546 0.014 19.684 0.01 19.904 0.014 19.947 0.017 20.059 0.001 1.499 4J013349.96+303427.8 23.45801 30.57427 23.45817 30.5743920.638 0.083 20.541 0.083 20.6 0.004 20.821 0.011 21.138 0.014 21.45 0.019 21.743 0.0 0.658 2J013321.23+304042.0 23.33814 30.67849 23.33846 30.6783320.676 0.084 20.413 0.058 20.678 0.006 20.563 0.009 20.921 0.013 21.236 0.015 21.665 0.0 1.146 2J013358.39+304823.7 23.49306 30.80683 23.49329 30.8065820.493 0.122 20.091 0.044 20.702 0.006 20.674 0.011 20.905 0.014 21.1 0.018 21.386 0.0 1.147 2
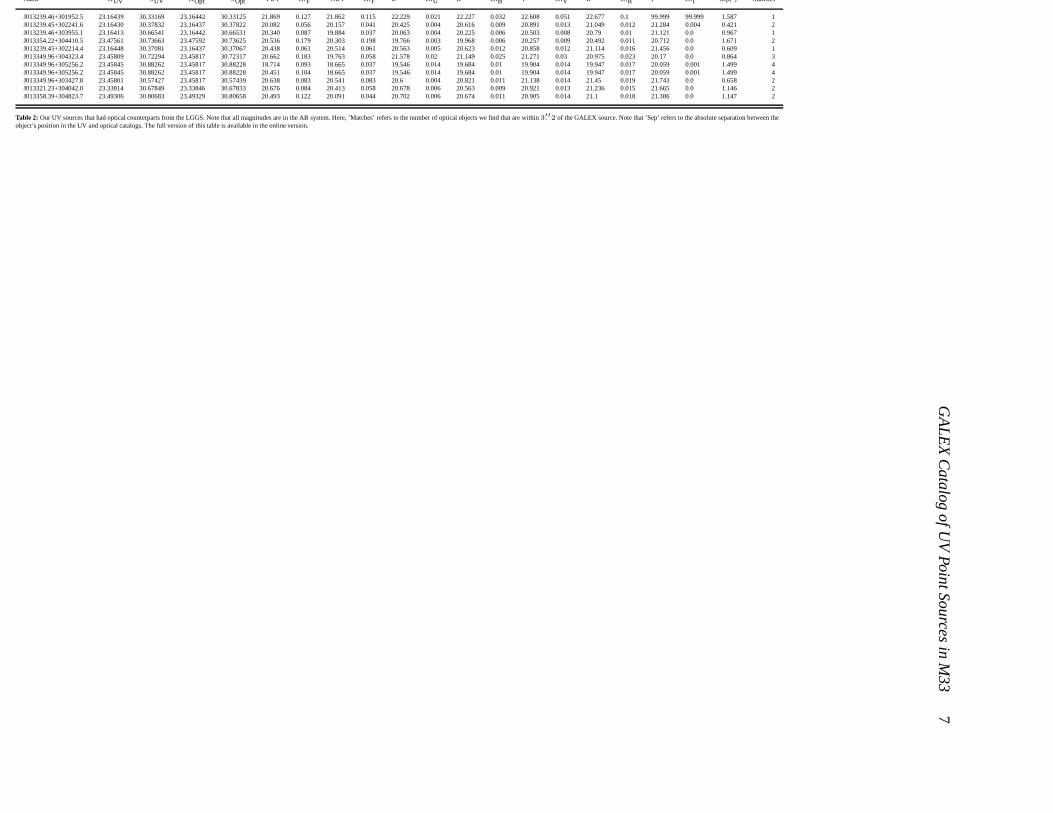
Table 2: Our UV sources that had optical counterparts from the LGGS. Note that all magnitudes are in the AB system. Here, ’Matches’refers to the number of optical objects we find that are within3.′′2 of the GALEX source. Note that ’Sep’ refers to the absolute separation between the
object’s position in the UV and optical catalogs. The full version of this table is available in the online version.
©0000
RA
S,M
NR
AS000,000–000
8 Dale Mudd and K.Z. Stanek
3 DISCUSSION
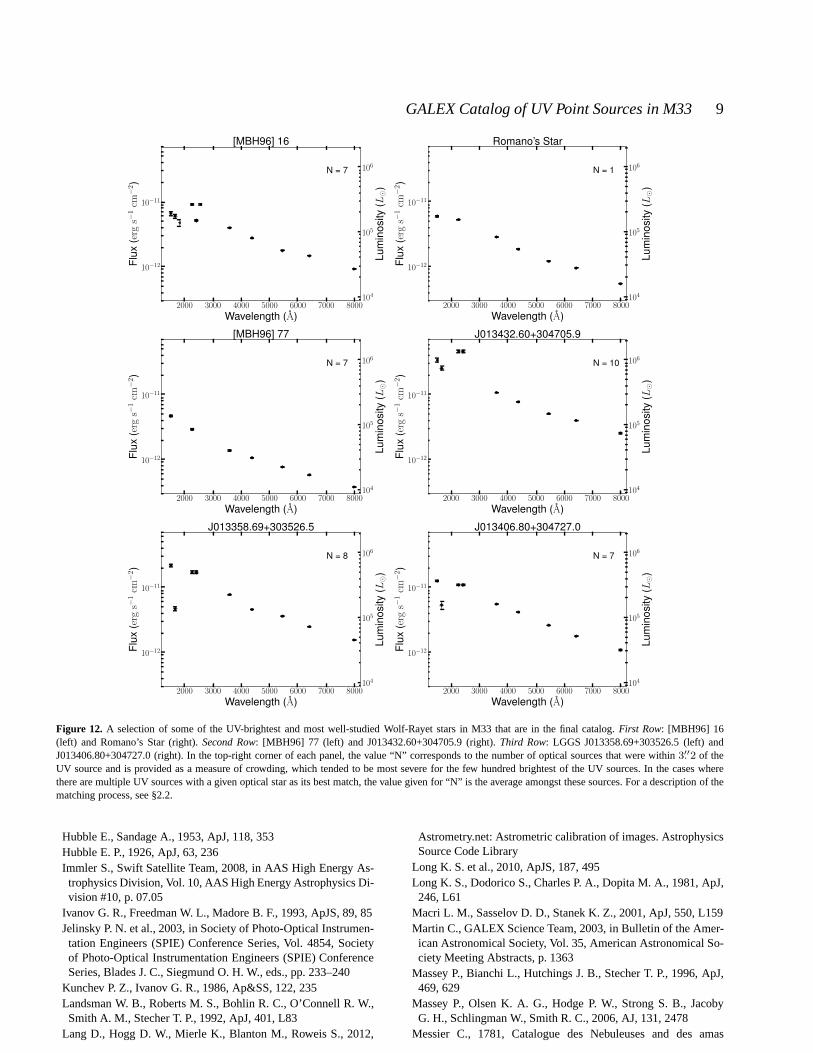
With our UV/optical catalog in hand, we next investigate a selectionof the more well-known stars in M33 that are likely also UV bright.First, we look at a selection of Wolf-Rayet stars (WR), thoughtto be massive (>20M⊙) stars that have blown off their envelopesand have become essentially hot, exposed stellar cores. With ef-fective temperatures typically in excess of 30,000 K, occasionallyreaching well over 100,000 K, these stars should peak at a wave-length blueward of even GALEX’s FUV filter. As such, ignoringany absorption or extinction, we expect these stars to be among thehighest luminosity in the FUV from the bandpasses presentedhere.In Figure 12, the sources [MBH96] 16, Romano’s Star (Romano1978), and [MBH96] 77, presented in the top and middle rows,are a selection of the most well-known WR stars in the galaxy.[MBH96] 16, as can be seen from the figure, has three separateUV matches to its optical counterpart in our data. Two of thesepeak in the NUV, whereas one continues to rise in the FUV. Sinceit is a WR star, the most likely true match is this hottest UV source.Romano’s Star, [MBH96] 77, LGGS J013358.69+303526.5, andLGGS J013406.80+304727.0 also exhibit this behavior, albeit withsomewhat different slopes. Comparing our sources to a catalog ofknown WR stars in M33 (Neugent & Massey 2011), we recover114 out of a total 206.
Another star we investigate is a detached eclipsing binaryused by the DIRECT Project (Bonanos et al. 2006) to measurethe distance to M33 itself, whose SED is presented in Figure13. The two stars in this binary have derived temperatures inexcess of 35,000 K. Our best matches, however, peak in thenear-UV rather than the FUV, as one might expect. Next, welook at M33 X-7 (e.g, Long et al. 1981, 2010), a high mass X-ray binary. From Figure 13, we see that it is quite luminousin the UV bands, as might be predicted due to the presence ofboth an accreting compact object and a hot stellar companion.We also have a number of well-studied blue supergiants in oursample, including Hubble-Sandage Variable B (Hubble & Sandage1953) and 2MASS J01332895+3047441 (Kunchev & Ivanov 1986;Ivanov et al. 1993; Skrutskie et al. 2006). These stars, althoughblue, are much cooler than WR stars and we anticipate their spectralenergy distributions to peak at longer wavelengths. Both matches to2MASS J01332895+3047441 peak in the NUV. This star has beenclassified as a B-type supergiant (Massey et al. 2006), whichcanindeed be warm enough to peak blueward of the optical range.
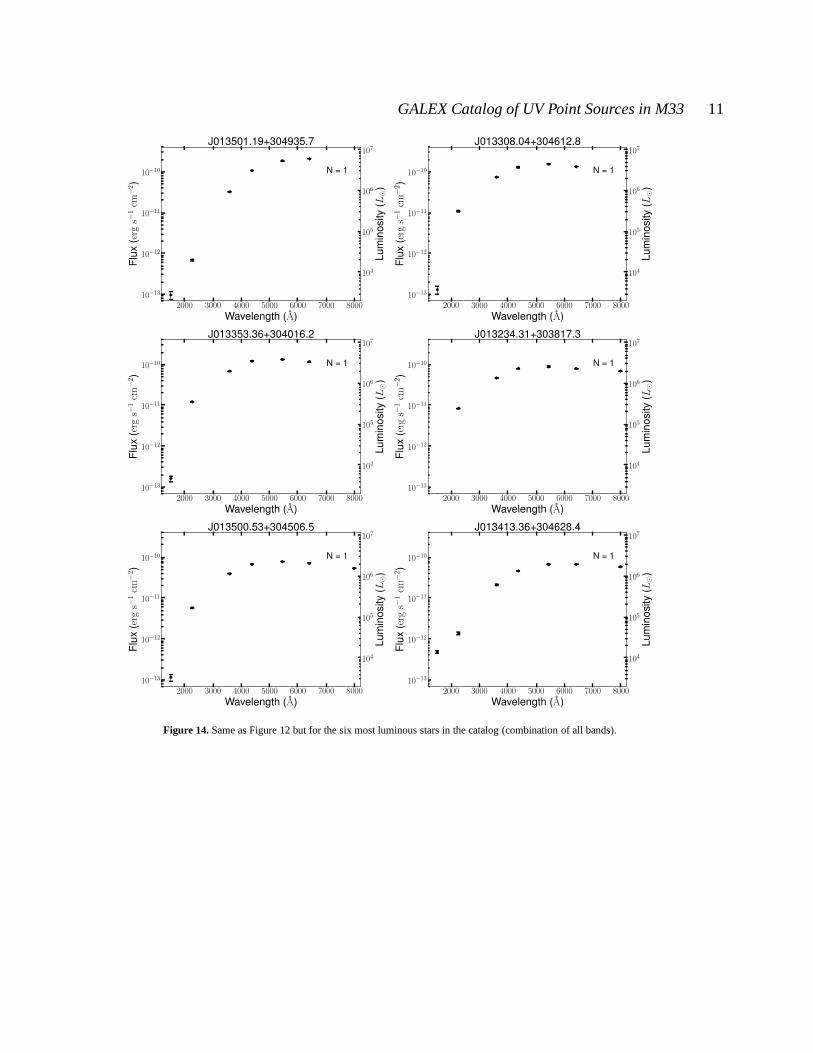
After searching the catalog for known interesting sources,anobvious next step is to look at the luminous stars in the catalog. Wepresent the 6 most luminous sources in Figure 14, where “mostlu-minous” here is defined as the summation of fluxes from all avail-able bands. Immediately a trend appears. All of these stars havemost of their flux in the optical bandpasses and the UV data con-tributes minimally to their total bolometric luminosity. The bright-est stars in the catalog, then, are likely all relatively common andcooler red supergiants, though there may be also some of the rareryet more intrinsically luminous yellow supergiants, as well as a fewforeground sources.
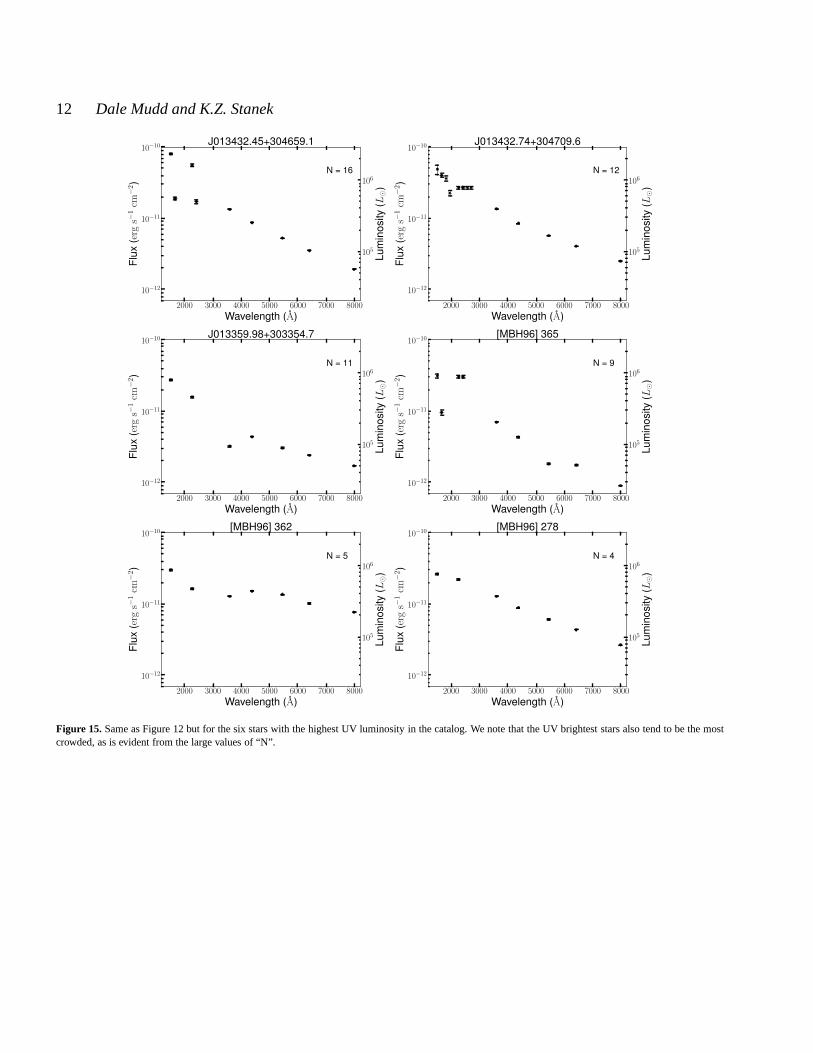
For which stars does the UV data significantly change their in-ferred bolometric luminosities? To answer this question, we presentthe six stars with the highest luminosity in GALEX’s FUV band-pass in Figure 15. Three of these were found in the UIT catalogofM33, but three are new UV sources. All of these tend to have nearand far-UV luminosities of around106L⊙. This is a factor of sixdown from the peak bandpass luminosity in Figure 14, but it isofthe same order of magnitude as in those stars. The differenceis that
the UV bright stars are bright solely in the UV, often dropping byat least a factor of two in flux between the near-UV and V bands.And this is not unexpected of extremely hot stars which will emitsignificantly in the UV but have their flux fall continually inredderbands.
With this work, we seek to update and expand the existingUV catalog of M33 using archival GALEX data. Using PSF pho-tometry to optimally find and photometer sources, we find tensofthousands of more sources than in the pipeline product as it was notconstructed to handle such a crowded environment. We match theseto the UIT catalog (Massey et al. 1996) and recover all but eight ofthese sources. Next, we match to an optical catalog from the LGGS(Massey et al. 2006) to create a final catalog with 27901sources,of which 24738 have optical matches thereby spanning seven fil-ters from the far-UV to near-IR. We then investigate the propertiesof our catalog and find that the most overall luminous sourcesaretypically brightest in the optical bands (and hence likely evolvedstars), but there are still many sources, likely young, massive starsand WR stars, that are continuing to rise in the UV range, indicatinghigh effective temperatures.
A useful future endeavor would be to perform a similar analy-sis with theSwift UV data of M33 (Immler & Swift Satellite Team2008).Swift covers 3 UV filters with high spatial resolution, whichwould further assist in lessening the obvious crowding issue that ispersistent in both the GALEX and UIT data.
ACKNOWLEDGEMENTS
DM would like to thank Philip Massey, Scott Adams, MichaelFausnaugh, Rubab Khan, Ben Shappee, and Obright Lorain forhelpful discussions that contributed greatly to this paper. We alsowish to thank the anonymous referee, who provided numerous use-ful comments and aided the betterment of this manuscript.
Based on observations made with the NASA Galaxy Evolu-tion Explorer. Some of the data presented in this paper were ob-tained from the Mikulski Archive for Space Telescopes (MAST).STScI is operated by the Association of Universities for Researchin Astronomy, Inc., under NASA contract NAS5-26555. Supportfor MAST for non-HST data is provided by the NASA Office ofSpace Science via grant NNX13AC07G and by other grants andcontracts.
REFERENCES
Bessell M. S., Castelli F., Plez B., 1998, A&A, 333, 231Bonanos A. Z. et al., 2006, ApJ, 652, 313de Vaucouleurs G., de Vaucouleurs A., Corwin, Jr. H. G., ButaR. J., Paturel G., Fouqué P., 1991, Third Reference Catalogue ofBright Galaxies. Volume I: Explanations and references. VolumeII: Data for galaxies between 0h and 12h. Volume III: Data forgalaxies between 12h and 24h.
Freedman W. L., Wilson C. D., Madore B. F., 1991, ApJ, 372, 455Hartman J. D., Bersier D., Stanek K. Z., Beaulieu J.-P., Kaluzny J.,Marquette J.-B., Stetson P. B., Schwarzenberg-Czerny A., 2006,MNRAS, 371, 1405
Hayes D. S., Latham D. W., 1975, ApJ, 197, 593Helfer T. T., Thornley M. D., Regan M. W., Wong T., Sheth K.,Vogel S. N., Blitz L., Bock D. C.-J., 2003, ApJS, 145, 259
Hodierno G., 1654, De systemate orbis cometici, deque admiran-dis coeli characteribus
© 0000 RAS, MNRAS000, 000–000
GALEX Catalog of UV Point Sources in M33 9
Figure 12. A selection of some of the UV-brightest and most well-studied Wolf-Rayet stars in M33 that are in the final catalog.First Row: [MBH96] 16(left) and Romano’s Star (right).Second Row: [MBH96] 77 (left) and J013432.60+304705.9 (right).Third Row: LGGS J013358.69+303526.5 (left) andJ013406.80+304727.0 (right). In the top-right corner of each panel, the value “N” corresponds to the number of optical sources that were within3.′′2 of theUV source and is provided as a measure of crowding, which tended to be most severe for the few hundred brightest of the UV sources. In the cases wherethere are multiple UV sources with a given optical star as itsbest match, the value given for “N” is the average amongst these sources. For a description of thematching process, see §2.2.
Hubble E., Sandage A., 1953, ApJ, 118, 353Hubble E. P., 1926, ApJ, 63, 236Immler S., Swift Satellite Team, 2008, in AAS High Energy As-trophysics Division, Vol. 10, AAS High Energy AstrophysicsDi-vision #10, p. 07.05
Ivanov G. R., Freedman W. L., Madore B. F., 1993, ApJS, 89, 85Jelinsky P. N. et al., 2003, in Society of Photo-Optical Instrumen-tation Engineers (SPIE) Conference Series, Vol. 4854, Societyof Photo-Optical Instrumentation Engineers (SPIE) ConferenceSeries, Blades J. C., Siegmund O. H. W., eds., pp. 233–240
Kunchev P. Z., Ivanov G. R., 1986, Ap&SS, 122, 235Landsman W. B., Roberts M. S., Bohlin R. C., O’Connell R. W.,Smith A. M., Stecher T. P., 1992, ApJ, 401, L83
Lang D., Hogg D. W., Mierle K., Blanton M., Roweis S., 2012,
Astrometry.net: Astrometric calibration of images. AstrophysicsSource Code Library
Long K. S. et al., 2010, ApJS, 187, 495Long K. S., Dodorico S., Charles P. A., Dopita M. A., 1981, ApJ,246, L61
Macri L. M., Sasselov D. D., Stanek K. Z., 2001, ApJ, 550, L159Martin C., GALEX Science Team, 2003, in Bulletin of the Amer-ican Astronomical Society, Vol. 35, American AstronomicalSo-ciety Meeting Abstracts, p. 1363
Massey P., Bianchi L., Hutchings J. B., Stecher T. P., 1996, ApJ,469, 629
Massey P., Olsen K. A. G., Hodge P. W., Strong S. B., JacobyG. H., Schlingman W., Smith R. C., 2006, AJ, 131, 2478
Messier C., 1781, Catalogue des Nebuleuses and des amas
© 0000 RAS, MNRAS000, 000–000

10 Dale Mudd and K.Z. Stanek
Figure 13. Same as Figure 12 but for other, non WR sources in M33.First Row: [MBH96] 196, a detached eclipsing binary that has been usedto measure thedistance to M33, and M33 X-7 (HMXB).Second Row: Hubble-Sandage Variable B (left) and 2MASS J01332895+3047441, both blue supergiants.
d’Etoiles (Catalog of Nebulae and Star Clusters). Tech. rep.Morrissey P. et al., 2007, ApJS, 173, 682Neugent K. F., Massey P., 2011, ApJ, 733, 123Pietsch W., Misanovic Z., Haberl F., Hatzidimitriou D., Ehle M.,Trinchieri G., 2004, A&A, 426, 11
Romano G., 1978, Information Bulletin on Variable Stars, 1433,1
Skrutskie M. F. et al., 2006, AJ, 131, 1163Stecher T. P. et al., 1992, ApJ, 395, L1Stetson P. B., 1987, PASP, 99, 191Thilker D. A. et al., 2005, ApJ, 619, L67Thompson T. A., Prieto J. L., Stanek K. Z., Kistler M. D., BeacomJ. F., Kochanek C. S., 2009, ApJ, 705, 1364
Warner P. J., Wright M. C. H., Baldwin J. E., 1973, MNRAS, 163,163
© 0000 RAS, MNRAS000, 000–000
GALEX Catalog of UV Point Sources in M33 11
Figure 14. Same as Figure 12 but for the six most luminous stars in the catalog (combination of all bands).
© 0000 RAS, MNRAS000, 000–000
12 Dale Mudd and K.Z. Stanek
Figure 15. Same as Figure 12 but for the six stars with the highest UV luminosity in the catalog. We note that the UV brightest stars also tend to be the mostcrowded, as is evident from the large values of “N”.
© 0000 RAS, MNRAS000, 000–000