GALDERMA - Hugin Onlinereports.huginonline.com/844077/97986.pdf · Galderma - Key dates NESTLE 1962...
27
GALDERMA CORPORATE PRESENTATION UPDATED - 4 APRIL 2001
Transcript of GALDERMA - Hugin Onlinereports.huginonline.com/844077/97986.pdf · Galderma - Key dates NESTLE 1962...
GALDERMACORPORATE PRESENTATION
UPDATED - 4 APRIL 2001
Pg 2Corporate Presentation

Corporate Presentation Pg 3
Key dates
Key facts and figures
Strategy
Sales
Research & Development
Regulatory Affairs
Manufacturing
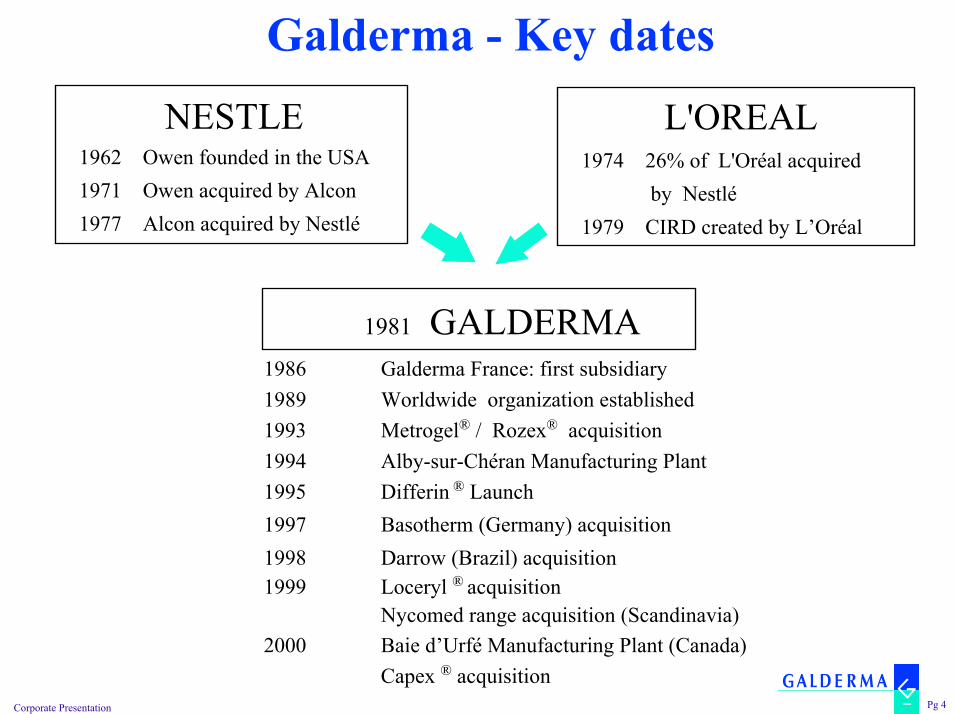
Galderma - Key datesNESTLE
1962 Owen founded in the USA1971 Owen acquired by Alcon1977 Alcon acquired by Nestlé
L'OREAL1974 26% of L'Oréal acquired
by Nestlé1979 CIRD created by L’Oréal
1986 Galderma France: first subsidiary1989 Worldwide organization established1993 Metrogel® / Rozex® acquisition1994 Alby-sur-Chéran Manufacturing Plant1995 Differin ® Launch1997 Basotherm (Germany) acquisition1998 Darrow (Brazil) acquisition1999 Loceryl ® acquisition
Nycomed range acquisition (Scandinavia)2000 Baie d’Urfé Manufacturing Plant (Canada)
Capex ® acquisition
1981 GALDERMA
Pg 4Corporate Presentation
Corporate Presentation Pg 5
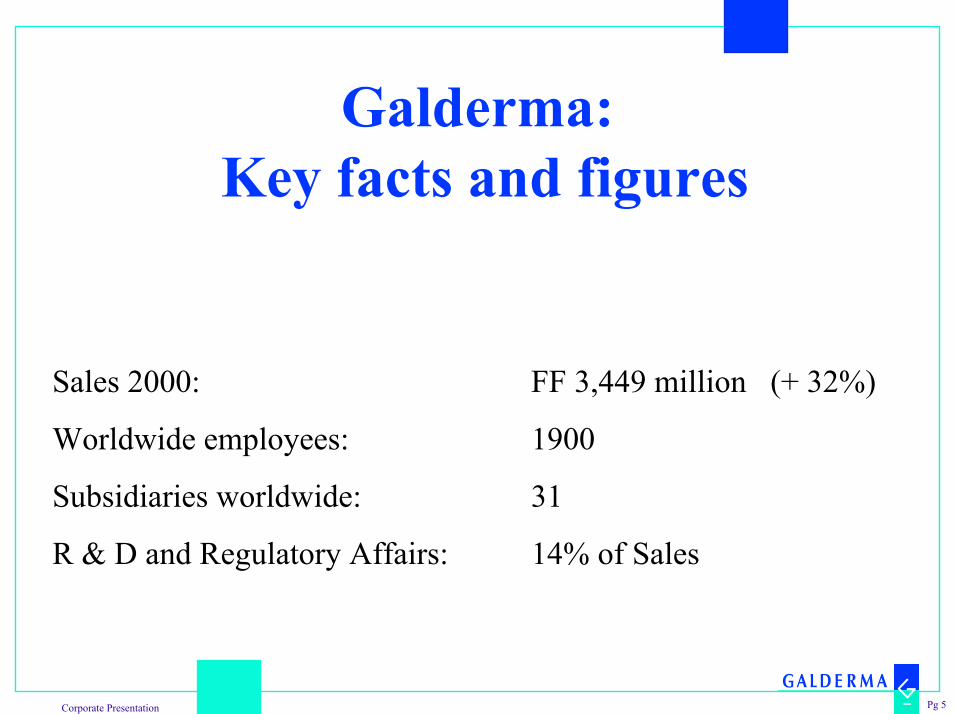
Galderma: Key facts and figures
Sales 2000: FF 3,449 million (+ 32%)
Worldwide employees: 1900
Subsidiaries worldwide: 31
R & D and Regulatory Affairs: 14% of Sales

O R G A N I S A T I O N
President and CEOXavier Yon
CORPORATE ZONES
R & DAlain Jacot North America
Steve Clark/Humberto Antunes
Southern EuropeMiddle East and Africa
Claude Vincent
Northern EuropeAlbert Draaijer
RegulatoryAffairs
Chris Hensby
Corporate Marketing andBusiness Development
Manufacturing andTechnology
Philippe Lancery
Administrationand Finance
John Dickinson
Human Resourcesand Communication
Klaus Vogl
Latin AmericaGabriel Villada
AsiaDominique Charles
InformationManagementSean Burke
Pg 6Corporate Presentation

L'OREAL SA 50% NESTLE SA 50% GALDERMA PHARMA SA(Suisse)
NORTH AMERICA
UNITED STATES
CANADA
PUERTO RICO
LATIN AMERICA
ARGENTINA
BRAZIL
CHILE
COLOMBIA
VENEZUELA
URUGUAY
MEXICO
PERU
DOMINICAN REPUBLIC
SOUTHERN EUROPEMIDDLE EAST, AFRICA
FRANCE
ITALY SPAIN
PHILIPPINES
TAIWAN
SINGAPORE
THAILAND
VIETNAM
INDIA
ASIA
Pg 7
OTHERS
JAPAN
KOREA
MALAYSIA
= Subsidiaries /Rep. Office
GREECE
PORTUGAL
TURKEY
OTHERS
CHINA
NORTHERN EUROPE, Australia, New Zealand,
S. Africa
AUSTRIA
BELGIUMGERMANY
NETHERLANDS
IRELAND
SWEDEN(Scandinavia)
OTHERS
SWITZERLAND
EASTERN EUROPE
UNITED KINGDOM
AUSTRALIA
HONG KONG
SOUTH AFRICA
NEW ZEALAND

Corporate Presentation Pg 8
Galderma strategy
“We have chosen dermatology”
Corporate Presentation Pg 9
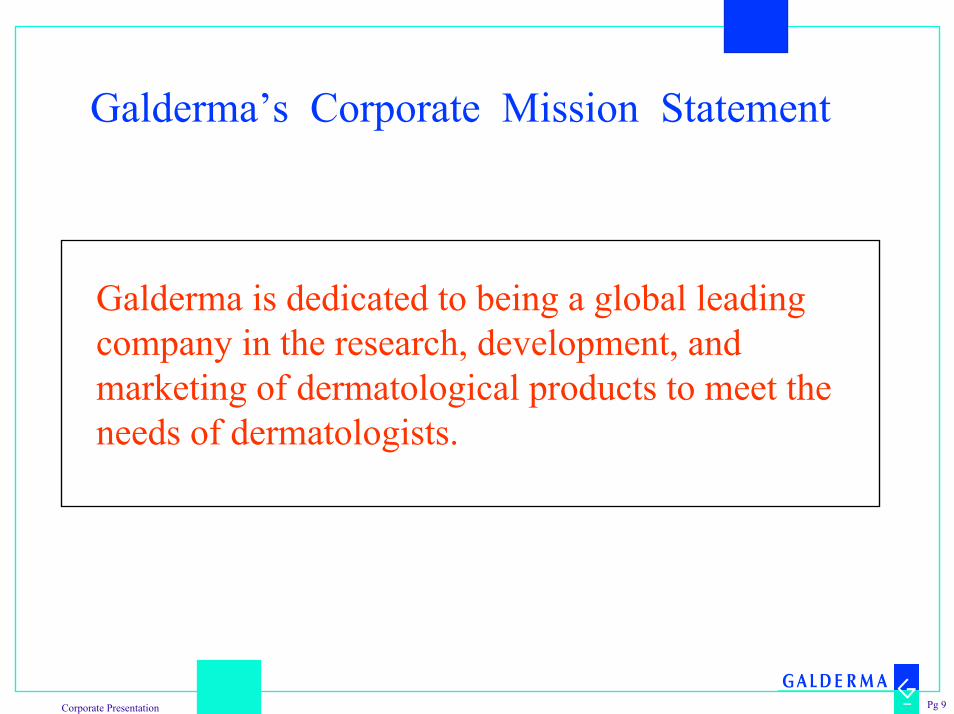
Galderma’s Corporate Mission Statement
Galderma is dedicated to being a global leading company in the research, development, andmarketing of dermatological products to meet theneeds of dermatologists.
Corporate Presentation Pg 10
Galderma strategyTo answer the needs of dermatologists
Pharmaceutical products (primary focus)
Non-pharmaceutical products (secondary focus):in certain limited areas, where drugs alone cannot meet dermatologists’ and patients’ needs, non-pharmaceutical products arenecessary(eg cleansers, moisturizers, shampoos ....)

Corporate Presentation Pg 11
Dermatologicals « D » Market by Class2000 Sales = US$8 761 Million (+6.3%)
Source : IMS, MIDAS DATAVIEW MAT Dec. (% of change in Local Currency Dollar = w/o the influence of the fluctuations of the exchange rates). Retail Universe + Hospital Universe in Japan.
Woundhealing Agents (+0,7%)
5%
Others (+6,6%)12%
Anti-Acne (+13,6%)19%
Top. Cortico Comb. (+5,2%)9%
Emol. & Protect. (+1,8%)8%
Antiseptics & Disinfectant (+0,9%)
7% Antifungals (+4,2%)13%
Top.Cortico Plain (+3,6%)14%
Top. Antibiotics (+8%)5%
Topical Antipruritics (+5,7%)3%
Anti-Psoriasis (+16,3%)5%
Corporate Presentation Pg 12
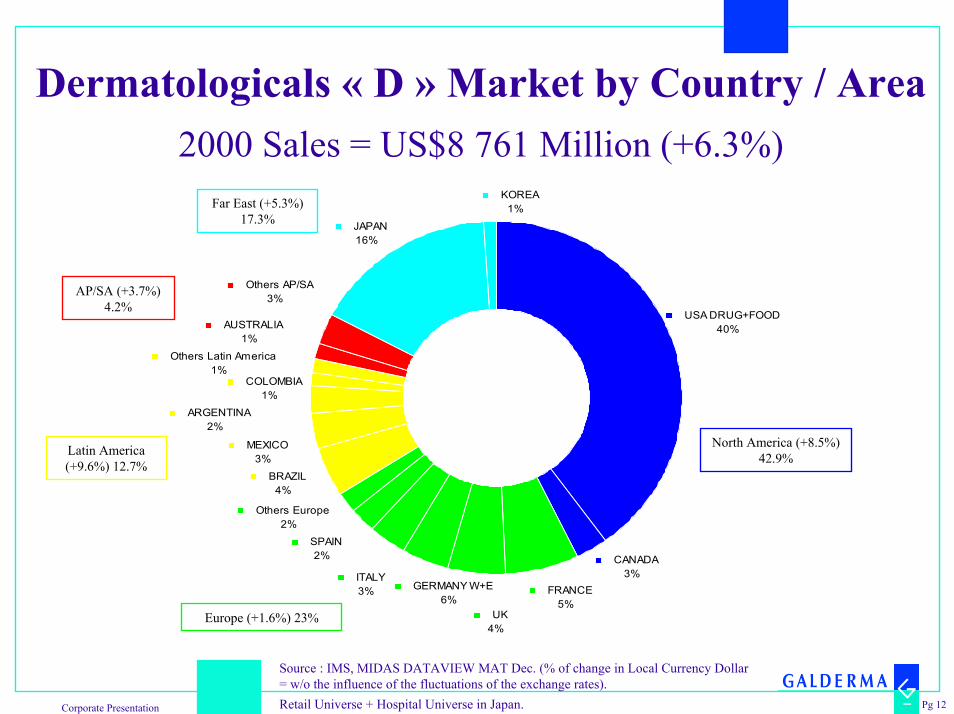
USA DRUG+FOOD40%
Others Latin America1%
AUSTRALIA1%
Others AP/SA3%
JAPAN16%
KOREA1%
COLOMBIA1%
MEXICO3% BRAZIL
4%
Others Europe2%
SPAIN2%
ARGENTINA2%
ITALY3%
UK4%
FRANCE5%
CANADA3%
GERMANY W+E6%
Dermatologicals « D » Market by Country / Area2000 Sales = US$8 761 Million (+6.3%)
Source : IMS, MIDAS DATAVIEW MAT Dec. (% of change in Local Currency Dollar = w/o the influence of the fluctuations of the exchange rates). Retail Universe + Hospital Universe in Japan.
Latin America (+9.6%) 12.7%
Europe (+1.6%) 23%
North America (+8.5%) 42.9%
AP/SA (+3.7%) 4.2%
Far East (+5.3%) 17.3%
Corporate Presentation Pg 13
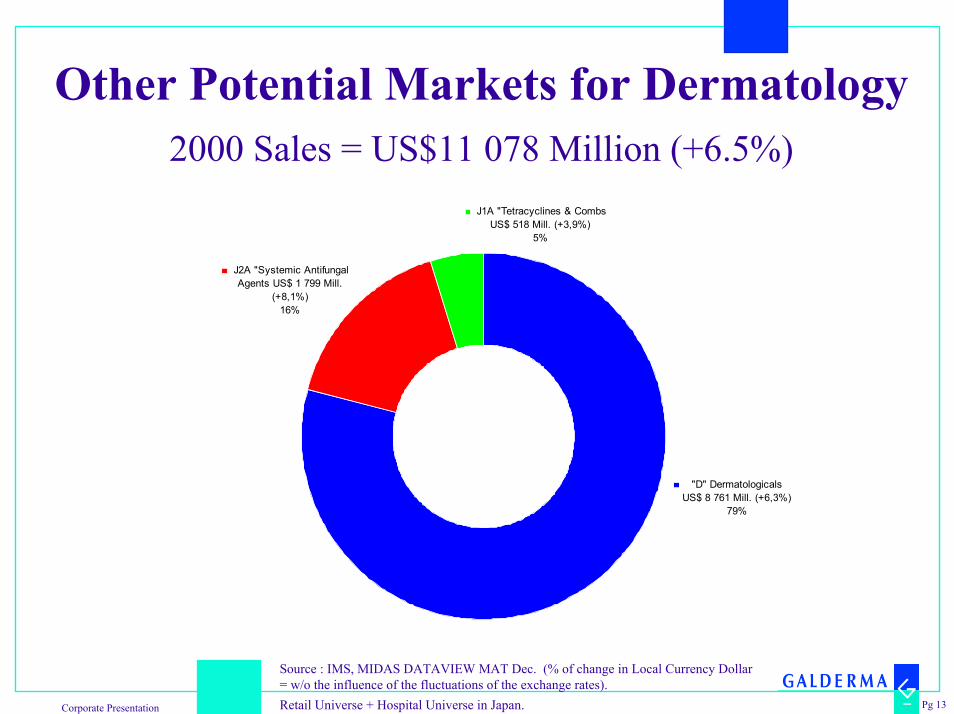
Other Potential Markets for Dermatology2000 Sales = US$11 078 Million (+6.5%)
"D" Dermatologicals US$ 8 761 Mill. (+6,3%)
79%
J2A "Systemic Antifungal Agents US$ 1 799 Mill.
(+8,1%)16%
J1A "Tetracyclines & Combs US$ 518 Mill. (+3,9%)
5%
Source : IMS, MIDAS DATAVIEW MAT Dec. (% of change in Local Currency Dollar = w/o the influence of the fluctuations of the exchange rates). Retail Universe + Hospital Universe in Japan.

Leading Corporations - DermatologySales in «D» Class (+000)
1996 1997 1998 1999 2000 Corporations - MAT Dec. (+000) 1999 Sales (US$)
2000 Sales (US$)
00 % Sales Market Share
(US$)
00/99 % Change
(US$)
00/99 % Change
(LC$)Total "D" Class 8 483 661 8 760 795 100,0 3,3 6,3
3 3 3 1 1 ROCHE 668 582 759 539 8,7 13,6 17,52 2 2 2 2 SCHERING PLOUGH 657 377 685 693 7,8 4,3 7,51 1 1 3 3 JOHNSON & JOHNSON 646 626 603 035 6,9 -6,7 -4,34 4 4 4 4 GLAXOSMITHKLINE 471 359 473 414 5,4 0,4 4,66 6 7 6 5 AVENTIS 313 849 376 759 4,3 20 24,3
10 7 6 5 6 GALDERMA 322 836 351 302 4,0 8,8 12,35 5 5 7 7 BRISTOL-MYERS SQB. 307 320 314 919 3,6 2,5 3,38 8 8 8 8 SCHERING AG 243 978 243 766 2,8 -0,1 9,37 9 9 9 9 PFIZER 200 012 193 523 2,2 -3,2 -0,7
14 14 12 12 10 STIEFEL LABS 168 082 180 840 2,1 7,6 10,212 12 10 10 11 NOVARTIS 182 496 175 114 2,0 -4 -2,211 11 11 11 12 BAYER 172 843 172 538 2,0 -0,2 1,79 10 13 13 13 PHARMACIA CORP 163 307 153 761 1,8 -5,8 -3,9
70 73 22 14 14 MERCK & CO 153 080 153 282 1,7 0,1 4,815 15 15 15 15 KOWA SHINYAKU 134 668 136 272 1,6 1,2 -3,519 17 16 16 16 LEO 106 968 100 264 1,1 -6,3 3,220 20 20 19 17 SHIONOGI SEIYAKU 89 092 95 468 1,1 7,2 2,213 13 14 17 18 PROCTER & GAMBLE 93 305 89 678 1,0 -3,9 -3,617 18 17 18 19 BOOTS 90 014 82 523 0,9 -8,3 2,716 16 18 20 20 AMERICAN HOME 82 979 77 109 0,9 -7,1 -5,3
Pg 14
Reported Countries : Argentina, Australia, Belgium, Brazil, Canada, Chile, Colombia, France, Germany, India (4 last MATs), Ireland, Italy, Japan, Japan Hospital, Korea, Mexico, Netherlands, Philippines, Portugal, South Africa, Spain, USA, UK, Venezuela
Source : IMS, MIDAS DATAVIEW

Pg 15
Leading International Products - DermatologySales in «D» Class (+000)
1996 1997 1998 1999 2000 International Product / Sales in US$ (+000) / MAT Dec. Major Corporation 1999 2000
00/99 % Change (US$)
00/99 % Change
(LC$)
00 % MS (US$)
Total "D" Class 8 483 662 8 760 796 3,3 6,3 100,01 1 1 1 1 ROACCUTANE Roche 551 679 645 817 17,1 20,2 7,47 6 4 3 2 LOTRIDERM Schering Plough 170 643 186 352 9,2 9,9 2,12 2 2 2 3 NIZORAL J&J 215 844 183 314 -15,1 -11,8 2,15 5 5 4 4 DAIVONEX/PSORCUTAN BMS 163 474 168 624 3,2 9,0 1,9
22 13 12 10 5 BENZAMYCIN Aventis 114 650 152 163 32,7 33,2 1,774 74 16 6 6 PROSCAR (=Propecia) Merck & Co 148 527 149 542 0,7 5,4 1,74 4 6 7 7 DIANE Schering AG 146 879 149 118 1,5 12,3 1,73 3 3 5 8 ZOVIRAX GlaxoSmithkline 159 852 146 352 -8,4 -2,5 1,7
12 11 8 8 9 BACTROBAN GlaxoSmithkline 128 530 146 287 13,8 15,7 1,710 9 9 9 10 ELOCON Schering Plough 125 107 138 892 11,0 15,2 1,69 8 11 12 11 CELESTONE Schering Plough 109 079 113 016 3,6 7,4 1,3
67 22 13 14 12 DIFFERINE GALDERMA 92 963 109 731 18,0 19,5 1,36 7 7 11 13 RETIN-A J&J 112 223 93 192 -17,0 -16,6 1,1
11 10 10 13 14 LAMISIL Novartis 102 681 82 499 -19,7 -20,0 0,931 23 21 18 15 ROZEX/METRO GALDERMA 66 421 76 383 15,0 16,1 0,916 18 14 15 16 DALACIN C Pharmacia Corp 79 692 74 779 -6,2 -5,1 0,928 31 29 32 17 BATRAFEN/PENLAC Aventis, Pierre Fabre 40 472 72 939 80,2 101,4 0,813 17 18 17 18 ISODINE Meiji Seika 70 543 70 630 0,1 -3,9 0,815 14 15 16 19 CANESTEN Bayer 70 991 68 909 -2,9 1,8 0,824 20 20 19 20 LACHYDRIN BMS 63 235 66 838 5,7 5,7 0,873 70 53 35 21 ALDARA Minnesota 3M 37 843 61 432 62,3 63,5 0,720 21 19 20 22 PEVARYL J&J 58 954 58 919 -0,1 6,9 0,719 16 17 21 23 QUADRIDERM Schering Plough 54 299 57 220 5,4 7,1 0,717 19 22 22 24 DERMOVATE GlaxoSmithkline 54 239 55 340 2,0 4,7 0,621 26 27 24 25 RINDERON VG Shionogi Seiyaku 51 049 54 973 7,7 2,8 0,675 75 48 25 26 REGRANEX J&J 47 404 52 299 10,3 10,3 0,630 24 23 23 27 BETADINE Degussa-Huels 51 088 49 389 -3,3 6,0 0,664 61 34 28 28 NEOTIGASON Roche 43 495 47 369 8,9 14,4 0,547 41 35 34 29 ULTRAVATE BMS 37 862 45 495 20,2 20,2 0,525 27 24 27 30 FUCIDIN LEO 45 615 43 841 -3,9 3,3 0,5
Reported Countries : Argentina, Australia, Belgium, Brazil, Canada, Chile, Colombia, France, Germany, India (4 last MATs), Ireland, Italy, Japan, Japan Hospital, Korea, Mexico,Netherlands, Philippines, Portugal, South Africa, Spain, USA, UK, Venezuela
Source : IMS, MIDAS DATAVIEW

Corporate Presentation Pg 16
Galderma SalesFF million
395 464 593755
1040
15781978
2604
3449
0
500
1000
1500
2000
2500
3000
3500
4000
1992 1993 1994 1995 1996 1997 1998 1999 2000+ 17 % + 28 % + 27 % + 38 % + 52 %+ 26 % + 25 % + 32 % + 32 %
Published Sales Historical Exchange RateSource: Company data 2001
Corporate Presentation Pg 17
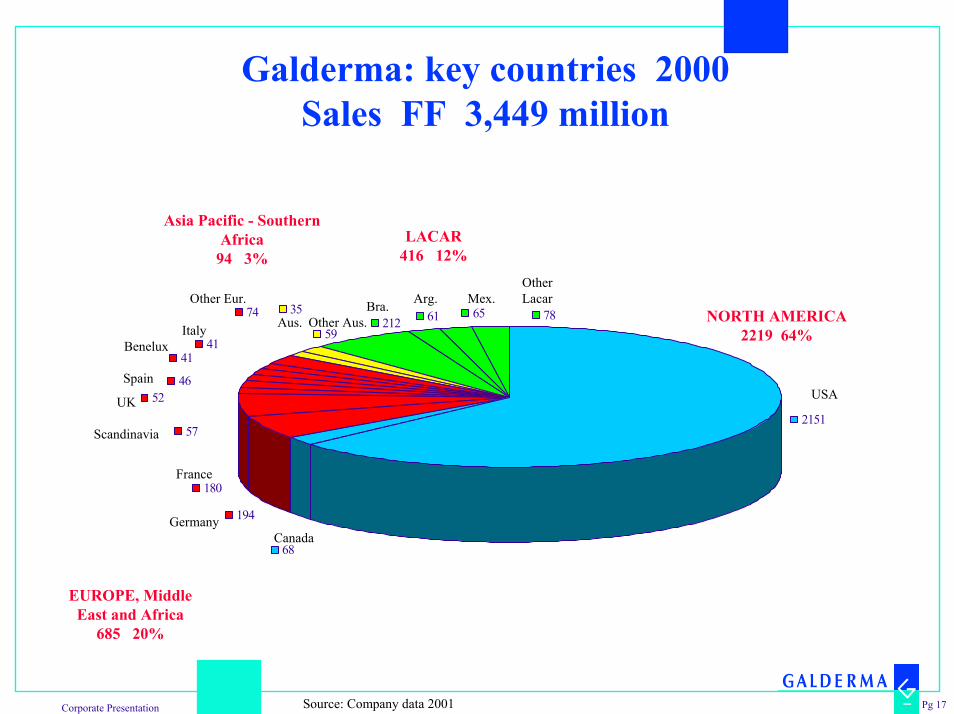
Galderma: key countries 2000Sales FF 3,449 million
41
4652
41
74 35
59212
57
180
194
68
61 65
2151
78
USA
CanadaGermany
Scandinavia
Benelux
France
Mex.Other LacarArg.Other Eur.
Italy
Bra.
Spain
UK
Aus. Other Aus. NORTH AMERICA2219 64%
LACAR416 12%
EUROPE, Middle East and Africa
685 20%
Asia Pacific - Southern Africa
94 3%
Source: Company data 2001

Corporate Presentation Pg 18
Pharmaceutical Products
Topical anti-acne
- Differin ® - ClindaGel®- Benzac ®- Eryacne ®- Retacnyl ®
Oral AB anti-acne- Tetralysal ®
Topical anti-fungals- Loceryl ®
Topical anti-rosacea
- Rozex/Metrogel ® / Metrocream ® / Metrolotion ®
Corticosteroids
- Desowen ®- Efficort ®
Oral anti-histamines- Mistamine ®
Topical anti-psoriasis/seborrheic dermatitis- Silkis ®- Capex ®
Galderma: major brands
Corporate Presentation Pg 19
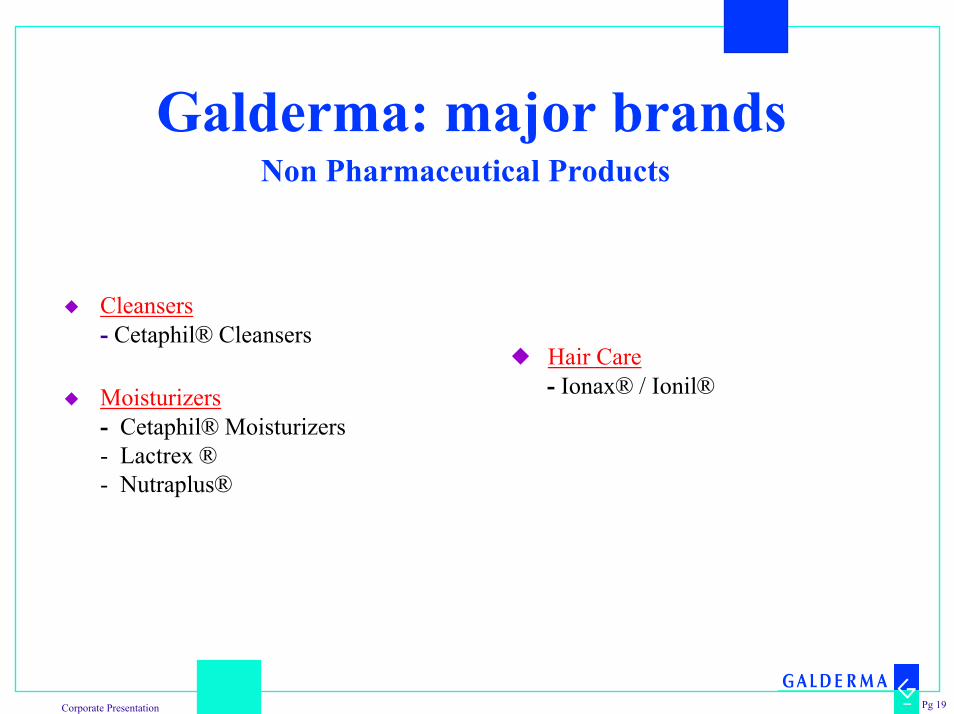
Galderma: major brandsNon Pharmaceutical Products
Cleansers- Cetaphil® Cleansers
Moisturizers- Cetaphil® Moisturizers- Lactrex ®- Nutraplus®
Hair Care- Ionax® / Ionil®

Corporate Presentation Pg 20
Galderma: top 10 products 2000
0
100
200
300
400
500
600
700
800
900
1000D
iffer
in
Roz
ex /
Met
ro.
Cet
aphi
l
Loce
ryl
Des
owen
Ben
zac
Tetra
lysa
l
Ery
acne
Nut
rapl
us
Ell
Cra
nell
Oth
ers
FF million
30%
16 %
7%
4%6%
2 %1 %1 %
Source: Company Data 2001
1 %
21%
11%

Corporate Presentation Pg 21
GaldermaSales by therapeutic category
2000 FF 3 449 million
Anti-fungal7%
Other4%
Non Rx24%
Anti-rosacea21%
Oral AB anti-acne
2%
Anti-acne topical35%
Corticosteroid7%
Source: Company data 2001

Corporate Presentation Pg 22
GaldermaResearch & Development
• Total budget 2000: 14% of sales (incl. Reg Affairs)
• Employees: 380• Facilities: Sophia Antipolis, France
Princeton, New Jersey, USA
Tokyo, Japan
• Area of expertise: Nuclear modulators
• Industrial property: Patents - 1500 +
•Disease Targets: Acne - Psoriasis - Rosacea - Onychomycosis
Alopecia - Skin Ageing - Pigmentation Disorders
Corporate Presentation Pg 23
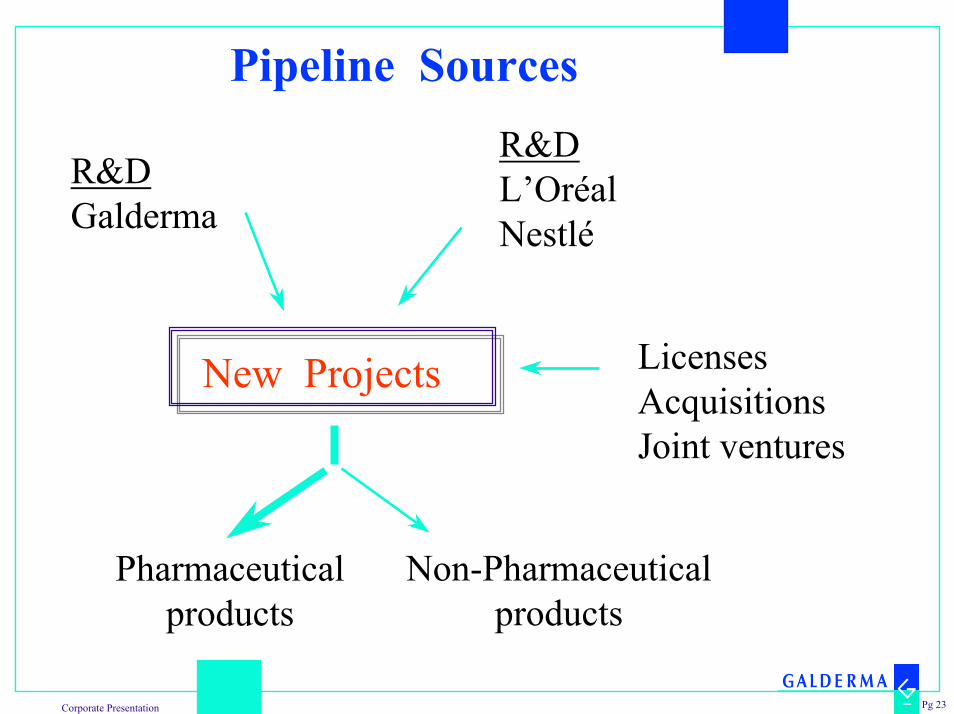
Pipeline SourcesR&DL’OréalNestlé
R&DGalderma
New Projects LicensesAcquisitionsJoint ventures
Non-Pharmaceuticalproducts
Pharmaceuticalproducts
Corporate Presentation Pg 24
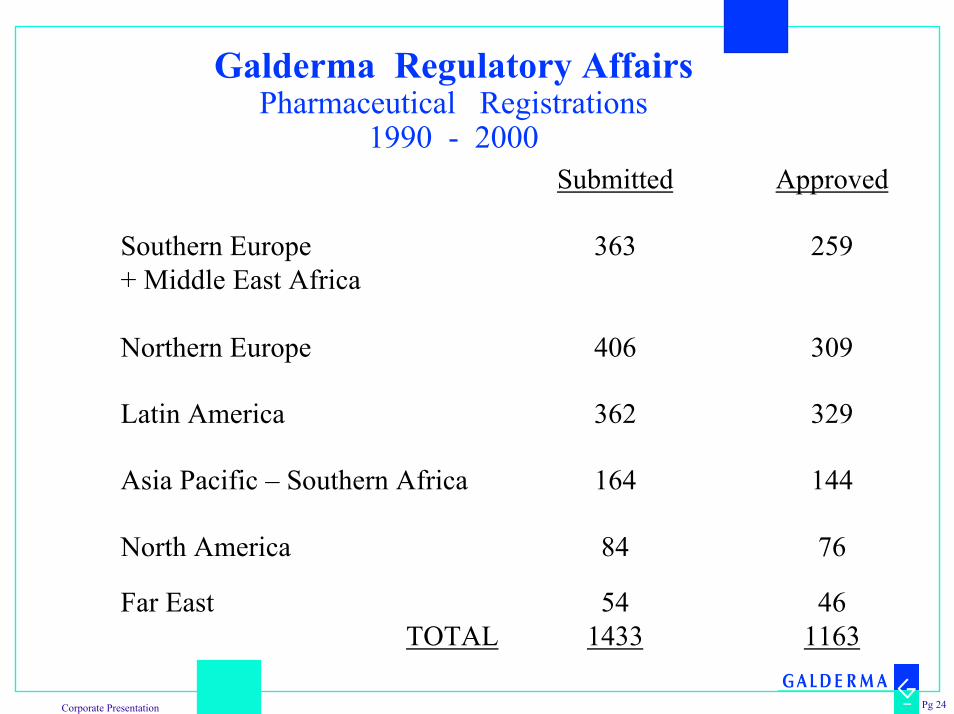
Galderma Regulatory AffairsPharmaceutical Registrations
1990 - 2000Submitted Approved
Southern Europe+ Middle East Africa
363 259
Northern Europe 406 309
Latin America 362 329
Asia Pacific – Southern Africa 164 144
North America 84 76
Far East 54 46TOTAL 1433 1163

Corporate Presentation Pg 25
Galderma - Production
PRIMARY
Date of Opening Capacity Workforce
France - Alby-sur-Chéran April 1994 20 million units 120 (1998)
Canada - Baie d ’Urfé 2nd quarter 2000 40 million units 115 (2000)
LOCAL PRODUCTION (sub-contractors)
- USA - San Antonio, Texas opened 1960’s capacity: 26 million units- Mexico- Brazil - Australia- South Africa - Germany- India

Corporate Presentation Pg 26
Galderma:A unique profile
Joint shareholders Nestlé L’Oréal
Focused approach We have chosen dermatology
Dedicated resources R & D - Reg. Affairs - Production
Global organization NorthAmerica
AsiaEuropeMiddle East
Africa
LatinAmerica
Pg 26

Corporate Presentation Pg 27
GaldermaCorporate objective
“ Become the leading company in Dermatologyin the World ”