Galaxy and Mass Assembly (GAMA): the red fraction and ...ccp/reprints/prescott11.pdf · Mon. Not....
13
Mon. Not. R. Astron. Soc. 417, 1374–1386 (2011) doi:10.1111/j.1365-2966.2011.19353.x Galaxy and Mass Assembly (GAMA): the red fraction and radial distribution of satellite galaxies Matthew Prescott, 1 I. K. Baldry, 1 P. A. James, 1 S. P. Bamford, 2 J. Bland-Hawthorn, 3 S. Brough, 4 M. J. I. Brown, 5 E. Cameron, 6 C. J. Conselice, 2 S. M. Croom, 3 S. P. Driver, 7 C. S. Frenk, 8 M. Gunawardhana, 3 D. T. Hill, 7 A. M. Hopkins, 4 D. H. Jones, 5 L. S. Kelvin, 7 K. Kuijken, 9 J. Liske, 10 J. Loveday, 11 R. C. Nichol, 12 P. Norberg, 13 H. R. Parkinson, 13 J. A. Peacock, 13 S. Phillipps, 14 K. A. Pimbblet, 5 C. C. Popescu, 15 A. S. G. Robotham, 7 R. G. Sharp, 16 W. J. Sutherland, 17 E. N. Taylor, 3 R. J. Tuffs, 18 E. van Kampen 10 and D. Wijesinghe 3 1 Astrophysics Research Institute, Liverpool John Moores University, Twelve Quays House, Egerton Wharf, Birkenhead CH41 1LD 2 Centre for Astronomy and Particle Theory, University of Nottingham, University Park, Nottingham NG7 2RD 3 Sydney Institute for Astronomy, School of Physics, University of Sydney, NSW 2006, Australia 4 Australian Astronomical Observatory, PO Box 296, Epping, NSW 1710, Australia 5 School of Physics, Monash University, Clayton, Victoria 3800, Australia 6 Department of Physics, Swiss Federal Institute of Technology (ETH-Z¨ urich), 8093 Z¨ urich, Switzerland 7 School of Physics & Astronomy, University of St Andrews, North Haugh, St Andrews, Fife KY16 9SS 8 Institute for Computational Cosmology, Department of Physics, Durham University, South Road, Durham DH1 3LE 9 Leiden University, PO Box 9500, 2300 RA Leiden, the Netherlands 10 European Southern Observatory, Karl-Schwarzschild-Str. 2, 85748 Garching, Germany 11 Astronomy Centre, University of Sussex, Falmer, Brighton BN1 9QH 12 Institute of Cosmology and Gravitation (ICG), University of Portsmouth, Dennis Sciama Building, Burnaby Road, Portsmouth PO1 3FX 13 Institute for Astronomy, University of Edinburgh, Royal Observatory, Blackford Hill, Edinburgh EH9 3HJ 14 Astrophysics Group, HH Wills Physics Laboratory, University of Bristol, Tyndall Avenue, Bristol BS81TL 15 Jeremiah Horrocks Institute, University of Central Lancashire, Preston PR1 2HE 16 Research School of Astronomy & Astrophysics, Mount Stromlo Observatory, Cotter Road, Weston Creek, ACT 2611, Australia 17 Astronomy Unit, Queen Mary University London, Mile End Road, London E1 4NS 18 Max Planck Institute for Nuclear Physics (MPIK), Saupfercheckweg 1, 69117 Heidelberg, Germany Accepted 2011 June 29. Received 2011 June 29; in original form 2011 January 20 ABSTRACT We investigate the properties of satellite galaxies that surround isolated hosts within the redshift range 0.01 < z < 0.15, using data taken as part of the Galaxy And Mass Assembly survey. Making use of isolation and satellite criteria that take into account stellar mass estimates, we find 3514 isolated galaxies of which 1426 host a total of 2998 satellites. Separating the red and blue populations of satellites and hosts, using colour–mass diagrams, we investigate the radial distribution of satellite galaxies and determine how the red fraction of satellites varies as a function of satellite mass, host mass and the projected distance from their host. Comparing the red fraction of satellites to a control sample of small neighbours at greater projected radii, we show that the increase in red fraction is primarily a function of host mass. The satellite red fraction is about 0.2 higher than the control sample for hosts with 11.0 < log 10 M ∗ < 11.5, while the red fractions show no difference for hosts with 10.0 < log 10 M ∗ < 10.5. For the satellites of more massive hosts, the red fraction also increases as a function of decreasing projected distance. Our results suggest that the likely main mechanism for the quenching of star formation in satellites hosted by isolated galaxies is strangulation. Key words: surveys – galaxies: dwarf – galaxies: evolution – galaxies: formation – galaxies: interactions – galaxies: star formation. E-mail: [email protected] C 2011 The Authors Monthly Notices of the Royal Astronomical Society C 2011 RAS
Transcript of Galaxy and Mass Assembly (GAMA): the red fraction and ...ccp/reprints/prescott11.pdf · Mon. Not....

Mon. Not. R. Astron. Soc. 417, 1374–1386 (2011) doi:10.1111/j.1365-2966.2011.19353.x
Galaxy and Mass Assembly (GAMA): the red fraction and radialdistribution of satellite galaxies
Matthew Prescott,1� I. K. Baldry,1 P. A. James,1 S. P. Bamford,2 J. Bland-Hawthorn,3
S. Brough,4 M. J. I. Brown,5 E. Cameron,6 C. J. Conselice,2 S. M. Croom,3
S. P. Driver,7 C. S. Frenk,8 M. Gunawardhana,3 D. T. Hill,7 A. M. Hopkins,4
D. H. Jones,5 L. S. Kelvin,7 K. Kuijken,9 J. Liske,10 J. Loveday,11 R. C. Nichol,12
P. Norberg,13 H. R. Parkinson,13 J. A. Peacock,13 S. Phillipps,14 K. A. Pimbblet,5
C. C. Popescu,15 A. S. G. Robotham,7 R. G. Sharp,16 W. J. Sutherland,17 E. N. Taylor,3
R. J. Tuffs,18 E. van Kampen10 and D. Wijesinghe3
1Astrophysics Research Institute, Liverpool John Moores University, Twelve Quays House, Egerton Wharf, Birkenhead CH41 1LD2Centre for Astronomy and Particle Theory, University of Nottingham, University Park, Nottingham NG7 2RD3Sydney Institute for Astronomy, School of Physics, University of Sydney, NSW 2006, Australia4Australian Astronomical Observatory, PO Box 296, Epping, NSW 1710, Australia5School of Physics, Monash University, Clayton, Victoria 3800, Australia6Department of Physics, Swiss Federal Institute of Technology (ETH-Zurich), 8093 Zurich, Switzerland7School of Physics & Astronomy, University of St Andrews, North Haugh, St Andrews, Fife KY16 9SS8Institute for Computational Cosmology, Department of Physics, Durham University, South Road, Durham DH1 3LE9Leiden University, PO Box 9500, 2300 RA Leiden, the Netherlands10European Southern Observatory, Karl-Schwarzschild-Str. 2, 85748 Garching, Germany11Astronomy Centre, University of Sussex, Falmer, Brighton BN1 9QH12Institute of Cosmology and Gravitation (ICG), University of Portsmouth, Dennis Sciama Building, Burnaby Road, Portsmouth PO1 3FX13Institute for Astronomy, University of Edinburgh, Royal Observatory, Blackford Hill, Edinburgh EH9 3HJ14Astrophysics Group, HH Wills Physics Laboratory, University of Bristol, Tyndall Avenue, Bristol BS8 1TL15Jeremiah Horrocks Institute, University of Central Lancashire, Preston PR1 2HE16Research School of Astronomy & Astrophysics, Mount Stromlo Observatory, Cotter Road, Weston Creek, ACT 2611, Australia17Astronomy Unit, Queen Mary University London, Mile End Road, London E1 4NS18Max Planck Institute for Nuclear Physics (MPIK), Saupfercheckweg 1, 69117 Heidelberg, Germany
Accepted 2011 June 29. Received 2011 June 29; in original form 2011 January 20
ABSTRACTWe investigate the properties of satellite galaxies that surround isolated hosts within the redshiftrange 0.01 < z < 0.15, using data taken as part of the Galaxy And Mass Assembly survey.Making use of isolation and satellite criteria that take into account stellar mass estimates, wefind 3514 isolated galaxies of which 1426 host a total of 2998 satellites. Separating the redand blue populations of satellites and hosts, using colour–mass diagrams, we investigate theradial distribution of satellite galaxies and determine how the red fraction of satellites varies asa function of satellite mass, host mass and the projected distance from their host. Comparingthe red fraction of satellites to a control sample of small neighbours at greater projected radii,we show that the increase in red fraction is primarily a function of host mass. The satellite redfraction is about 0.2 higher than the control sample for hosts with 11.0 < log10 M∗ < 11.5,while the red fractions show no difference for hosts with 10.0 < log10 M∗ < 10.5. For thesatellites of more massive hosts, the red fraction also increases as a function of decreasingprojected distance. Our results suggest that the likely main mechanism for the quenching ofstar formation in satellites hosted by isolated galaxies is strangulation.
Key words: surveys – galaxies: dwarf – galaxies: evolution – galaxies: formation – galaxies:interactions – galaxies: star formation.
�E-mail: [email protected]
C© 2011 The AuthorsMonthly Notices of the Royal Astronomical Society C© 2011 RAS

GAMA: satellite galaxies 1375
1 IN T RO D U C T I O N
In recent years satellite galaxies have received much attention inboth observational and theoretical studies in order to establish theirrole in the formation and evolution of galaxies. In the current �
cold dark matter (�CDM) models of the Universe, galaxies areassembled in a hierarchical fashion, whereby small haloes of DMmerge to form larger haloes, in which baryonic matter then coolsand condenses to form stars. In this framework satellite galaxiesare associated with subhaloes of DM residing within the virial radiiof larger haloes, which are believed to be left over from an earlierassembly phase of their host. Thus, the measurement of the spatialdistribution of satellites, both in terms of their angular and radialdistributions, can provide an insight into the mass accretion historiesof galaxies.
The most common way to determine the radial distribution is tocalculate the projected density of satellites surrounding samples ofmore luminous hosts, which requires redshifts and photometry ofsatellites and hosts. Previous studies which attempted to constrainthe small-scale galaxy correlation function (Lake & Tremaine 1980;Phillipps & Shanks 1987; Vader & Sandage 1991; Lorrimer et al.1994) or investigated the companions of field ellipticals (Madore,Freedman & Bothun 2004; Smith, Martınez & Graham 2004) foundthat the projected density of satellites, as a function of radius, hasa profile that can be described as a power law of the form �(R) ∝Rα , with a slope, α, ranging between −0.5 and −1.25. Subse-quently, more accurate measurements of the projected density havebeen made, making use of larger and more complete redshift sur-veys, such as the 2-degree Field Galaxy Redshift Survey (2dFGRS;Colless et al. 2001) and the Sloan Digital Sky Survey (SDSS; Yorket al. 2000), allowing the production of large statistical samplesof satellites and hosts selected using various well-defined criteria(Sales & Lambas 2004; Chen et al. 2006; Ann, Park & Choi 2008;Bailin et al. 2008; Chen 2008).
Studies which have examined the radial distribution of satellitesas a function of host luminosity, colour or morphology have ob-tained mixed results. The first to divide their sample into early andlate types was Lorrimer et al. (1994), who found the projected den-sity profile of the satellites of early-type hosts to have steeper slopesand therefore to be more centrally concentrated than the satellitesof late-type hosts. In contrast to this, Sales & Lambas (2005), usingdata from 2dFGRS, found that the distribution of the satellites ofred hosts has a shallower profile than the satellites of blue hosts,which even deviates from a power law, flattening at small projectedseparation. More recently, Chen (2008), using SDSS data, foundthat the satellites of both red and blue hosts follow similar powerslopes after correcting for interlopers (galaxies mistaken as satel-lites through projection but not actually physically bound to theirhost).
Dividing their satellite sample into red and blue populations,Chen (2008) also finds that red satellites are more centrally concen-trated than blue satellites, a trend which is also seen in the semi-analytic galaxy samples produced by Sales et al. (2007) using theMillennium Simulation. One explanation of this is that red satelliteswere accreted into their host’s halo at earlier times than the bluesatellites, which is consistent with the observational finding that redsatellites have an anisotropic angular distribution with a preferenceof being aligned along the major axes of their hosts (Brainerd 2005;Yang et al. 2006; Azzaro et al. 2007; Bailin et al. 2008; Agustsson& Brainerd 2010). Comparisons between the radial distribution ofsatellites and the DM distribution produced from simulations havealso been conducted by Chen et al. (2006) and van den Bosch et al.
(2005), who find that satellites are more centrally concentrated thanDM subhaloes, but consistent with the DM profile.
Satellite galaxies provide useful information not only about theformation of galaxies but also about the processes that govern galaxyevolution in localized environments on scales of ∼1 Mpc. In thecurrent theory of galaxy evolution, it is thought that virtually allgalaxies start off as blue, late-type discs which are then transformedby various processes into red, early types. This is supported by theobserved bimodality of galaxies which can be seen out to z ∼ 1 (Bellet al. 2004; Willmer et al. 2006; Prescott, Baldry & James 2009),and studies such as Willmer et al. (2006) and Faber et al. (2007)which have shown that there has been a doubling in the stellar massdensity of galaxies on the red sequence over the last 7–8 Gyr.
The main processes believed to be responsible for transformingblue/late-type galaxies into red/early types involve the quenching ofstar formation, and include major mergers (Toomre & Toomre 1972;Hopkins et al. 2008a), feedback from active galactic nuclei (Boweret al. 2006; Croton et al. 2006) and the depletion of gas reservoirsthat fuel star formation. For satellite galaxies, the dominant processis most likely to be gas depletion, caused by the stripping of gasvia a number of different hydrodynamical and radiative interactionswith their hosts, acting over different time-scales.
When a satellite halo is accreted by the larger halo of its host,hot gas from the satellite may be removed in the process known asstrangulation (Larson, Tinsley & Caldwell 1980; Balogh, Navarro &Morris 2000), resulting in the gradual decline in star formation overlong time-scales (>1 Gyr), as its fuel for future star formation isdepleted. Star formation can be shut off more rapidly if the satelliteis subjected to sufficient external pressure that its cold gas reservoiris removed in the process of ram-pressure stripping (Gunn & Gott1972). Gas stripping via harassment (Moore et al. 1996), wherebythe DM subhaloes of satellites are heated after undergoing frequenthigh-velocity encounters with other DM haloes, is also a possibility,although this process is more likely to occur in galaxy clusters ratherthan small groups.
Recent studies using the SDSS have indicated that strangulation isthe main mechanism causing the transition of satellites from the blueto the red sequence. Producing a group catalogue from Data Release2 (DR2), Weinmann et al. (2006) investigate how the fractions ofearly- and late-type satellites vary as a function of halocentric radius,halo mass and luminosity, observing that the early-type fractionincreases with decreasing halocentric radius, increasing halo massand increasing luminosity. They argue that the increase in early-typefraction with luminosity at fixed halo mass is not expected if ram-pressure stripping or harassment is the primary cause of gas removal.Ann et al. (2008) use SDSS DR5 to investigate how the early-typefractions of satellites surrounding isolated hosts vary as a functionof luminosity and projected distance. They find that the early-typesatellite fraction increases significantly with decreasing projectedradius for early-type hosts and stays approximately constant for latetypes. They conclude that hot X-ray-emitting gas of the early-typehosts is responsible for the removal of gas.
Using an SDSS DR4 group catalogue, van den Bosch et al. (2008)compare the concentrations and colours of centrals and satellites ofthe same mass. By matching central and satellite pairs in both stellarmass and concentration, they find there is a significant differencein colour. Centrals and satellites matched in both stellar mass andcolour, on the other hand, show no difference in concentration. Un-der the assumption that centrals are the progenitors of satellites(centrals change into satellites after being accreted into a largerhalo), this implies that either the strangulation or ram-pressure strip-ping process is occurring rather than harassment, which is believed
C© 2011 The Authors, MNRAS 417, 1374–1386Monthly Notices of the Royal Astronomical Society C© 2011 RAS

1376 M. Prescott et al.
to have a significant effect on the morphology of galaxies. Inves-tigating the red fraction of satellites by mass, they estimate that70 per cent of satellite galaxies with M∗ = 109M� have under-gone satellite quenching in order to be on the red sequence at thepresent, with 30 per cent already red before becoming a satellite.For more massive satellites they find quenching to be less effective,with 65 per cent of satellites with M∗ = 1010M� being red beforeaccretion and virtually all satellites with M∗ = 1011M� alreadybeing red before becoming satellites.
Furthermore, satellites are believed to affect the evolution of theirhosts. Minor mergers between dwarf satellites and their central hostsprovide one way in which to distort and thicken galaxy discs (Quinn,Hernquist & Fullagar 1993) and enlarge the bulge components ofdiscs (Domınguez-Palmero & Balcells 2008), and mergers involv-ing gas-rich satellites may also provide gas which could prolong orreplenish star formation in early-type spirals (White & Frenk 1991;Hau et al. 2008).
Finally, satellite systems analogous to the Milky Way (MW)–Magellanic Clouds systems have also become of much interestlately due to their apparent rarity. Observational studies such asJames & Ivory (2011), Liu et al. (2011) and Tollerud et al. (2011)find that only ∼10 per cent of MW-like hosts have one Magellanic-Cloud-like satellite and only ∼5 per cent have two. Similarly, N-body simulations have shown that less than 10 per cent of MW-sized DM haloes contain two Magellanic-Cloud-sized subhaloes(Boylan-Kolchin et al. 2010; Busha et al. 2010).
In this paper we use data taken from the Galaxy and Mass As-sembly (GAMA) survey to investigate (i) the radial distributionof satellites surrounding a sample of isolated host galaxies, as afunction of host mass and colour, and (ii) how the red fraction ofsatellites depends on the projected distance between satellite andhost, the stellar mass of the satellite and the stellar mass of thehost. The GAMA redshift survey extends up to 2 mag deeper thanthe SDSS main galaxy sample and, unlike previous studies, we useisolation criteria that take account of stellar mass estimates. Theresults are discussed in terms of the quenching mechanisms that acton satellites.
The structure of this paper is as follows. In Section 2 we outlinethe GAMA survey from which our samples of galaxies are taken.In Section 3 we define our criteria used to select isolated hosts andsatellite galaxies. We also define how we select a control sampleof neighbours. Section 4 describes how we divide the red and bluepopulations of galaxies, compare properties of the hosts and satel-lites, and determine the projected density of satellites as a functionof host mass and host colour. We show how the red fraction ofsatellites depends on satellite mass, host mass and projected radius,and discuss potential processes that could produce these results inSection 5. Finally, in Section 6 we summarize our main results.Throughout this paper we assume values of H0 = 70 km s−1 Mpc−1,�m = 0.3 and �� = 0.7.
2 DATA
2.1 Galaxy and Mass Assembly
GAMA is a project to construct a multiwavelength (far-UV to radio)data base of ∼375 000 galaxies, by combining photometry andspectroscopy from the latest wide-field survey facilities (Driveret al. 2009, 2011). Currently covering 144 deg2 and going out toz ∼ 0.5, GAMA will allow the study of galaxies and cosmology onscales between 1 kpc and 1 Mpc and provide the link between wide-shallow surveys, such as the SDSS main galaxy sample (Strauss
et al. 2002), 2dFGRS (Colless et al. 2001) and 6dFGRS (Jones et al.2004), and narrow-deep surveys Deep Extragalactic EvolutionaryProbe 2 (DEEP2; Davis et al. 2003) and VIMOS VLT Deep Survey(VVDS; Le Fevre et al. 2005).
Central to GAMA is a redshift survey conducted at the 3.9-mAnglo-Australian Telescope using the AAOmega spectrograph(Sharp et al. 2006), which is crucial to addressing the main ob-jectives of the project. These include determining the DM halomass function of groups and clusters (Eke et al. 2006), measuringthe stellar mass function (Baldry, Glazebrook & Driver 2008) ofgalaxies down to Magellanic Cloud masses and determining therecent galaxy merger rate (De Propris et al. 2005).
The redshifts used in this paper were obtained as part of the ini-tial spectroscopic survey known as GAMA I, carried out over 66nights between 2008 March and 2010 May. This consists of three12 × 4 deg fields at 9, 12 and 14.5 h (G09, G12 and G15) alongthe celestial equator and covering in total 144 deg2. For detailed de-scriptions of the spectroscopic target selection and the tiling strategyused for GAMA, the reader is referred to Baldry et al. (2010) andRobotham et al. (2010), respectively. In brief, galaxies are selectedfor spectroscopy using an input catalogue drawn from the SDSSDR6 (Adelman-McCarthy et al. 2008) and UKIRT Infrared DeepSky Survey (UKIDSS) (Lawrence et al. 2007).
In the following analysis we use data for galaxies which makeup the r-band-limited Main Survey, which contains in total 114 441galaxies, which are spectroscopically selected to have Galactic-extinction-corrected Petrosian magnitudes (Petrosian 1976) of rPetro
< 19.4 in fields G09 and G15 and rPetro < 19.8 in G12.The high density of spectra per square degree of sky and high
completeness of the redshift survey (98 per cent down to rPetro =19.8; Driver et al. 2011) required to achieve the main objectivesof the project make GAMA an ideal data set to study satellitegalaxies, since it does not suffer from the same incompleteness asother spectroscopic surveys due to fibre collisions. The SDSS, forexample, has a minimum fibre spacing of 55 arcsec, resulting in10 per cent of SDSS targets being missed from the spectroscopicsample because each area is generally tiled only once, or twicein the overlap between plates. The fraction missed is higher inhigher density regions, e.g. for galaxies with two other targets within55 arcsec, the chance of obtaining an SDSS redshift is half that ofgalaxies with no close neighbours (fig. 3 of Baldry et al. 2006).This is not true for GAMA because each area is tiled four or moretimes, close targets are given a higher priority in early visits, andhigh completeness is a primary goal (Robotham et al. 2010).
2.2 Distances
From the 114 441 galaxies in the r-band magnitude-limited MainSurvey, we choose galaxies with reliable redshifts (redshift qualityvalues of Q ≥ 3), in the range 0.01 < z < 0.15, which results in asample of 34 102 galaxies, from which we search for isolated galax-ies and satellites. In the low-redshift regime of this galaxy sample,the recessional velocities of galaxies are significantly affected bypeculiar motions which can cause distance estimates to be in er-ror, if simply assuming Hubble flow velocities (Masters, Haynes& Giovanelli 2004). To mitigate the effects of peculiar motions ondistance, we make use of a parametric model of the local velocityfield known as the multi-attractor model of Tonry et al. (2000).
2.3 Photometry
The photometry used in this paper includes gri Petrosian mag-nitudes taken from SDSS DR6 and Kron-like AUTO magnitudes
C© 2011 The Authors, MNRAS 417, 1374–1386Monthly Notices of the Royal Astronomical Society C© 2011 RAS

GAMA: satellite galaxies 1377
measured using SEXTRACTOR (Bertin & Arnouts 1996), from our ownre-reduction of the SDSS images described in Hill et al. (2011). Inbrief the photometry for the SDSS is obtained for five broad-bandfilters (ugriz) using a dedicated 2.5-m telescope at Apache Point,New Mexico, equipped with a mosaic CCD camera (Gunn et al.1998) and calibrated with a 0.5-m telescope (Hogg et al. 2001). Forgreater detail regarding the SDSS the reader is referred to York et al.(2000) and Stoughton et al. (2002).
Unless otherwise stated, absolute magnitudes are calculated fromGAMA AUTO magnitudes such that
M = mAUTO − 5 log10 DL − 25 − A − K, (1)
where mAUTO is the apparent AUTO magnitude of a galaxy, DL isthe luminosity distance in Mpc, A is the Galactic extinction fromSchlegel, Finkbeiner & Davis (1998) and K the K-correction to z =0.0, determined using the K-Correct v_4_1_4 code of Blanton &Roweis (2007). For the ∼700 galaxies where SEXTRACTOR has failedto assign an AUTO magnitude in any of the g,r,i bands, we use thePetrosian magnitude (mPetro) to calculate absolute magnitudes.
In the next sections we describe the criteria and methods used inthe search for isolated and satellite galaxies.
3 SELECTION O F SATELLITE SYSTEMS
3.1 Isolated galaxies
Before searching for satellites we must define a set of criteria tosearch for isolated galaxies which may host them. In previous papersisolated galaxies are usually found by searching for galaxies whichhave no neighbours brighter than a given magnitude (either apparentor absolute) contained within a cylinder, determined by a velocityand projected radius (Zaritsky et al. 1993; Sales & Lambas 2004;Ann et al. 2008; Bailin et al. 2008). Instead of using an isolationcriterion that depends solely on luminosity, here we use a criterionthat also takes into account an estimate of the galaxies’ stellarmasses, which makes the selection more physically motivated.
To determine stellar masses we use an expression based on therelationship between a galaxy’s (g − i) colour and i-band stellarmass-to-light ratio (M∗/L) from Taylor et al. (2011), which isgiven by
log10M∗ = −0.68 + 0.73(g − i) − 0.4(Mi − 4.58), (2)
where M∗ is the stellar mass of the galaxy in solar units(M∗/M�), (g − i) is the rest-frame colour and Mi is the absolutei-band magnitude of the galaxy calculated using GAMA AUTOmagnitudes. This way of estimating stellar masses has the advan-tage of only using two luminosities in a transparent way, unlikeestimating stellar masses determined via spectral energy distribu-tion fitting, and several authors have recently suggested that M∗/Lcorrelates most reliably with g − i (Gallazzi & Bell 2009; Zibetti,Charlot & Rix 2009; Taylor et al. 2010).
The central 95 per cent of the rest-frame (g − i) colour distributionof the galaxy sample considered in this study corresponds to 0.26 <
(g − i) < 1.24, implying that the galaxy stellar mass-to-light ratioin the i band typically varies by as much as a factor of 5 from 0.32to 1.68. In order to be robust against colour errors, we restrict themass-to-light ratio to this range.
In the search for isolated centrals, we limit ourselves to usinggalaxies with rPetro ≤ 19.4 in GAMA fields G09 and G15, and rPetro
≤ 19.8 in GAMA field G12. In order to be considered isolated, thecentrals must not have any comparably massive neighbours within
a large surrounding region. We define isolated galaxies as thosewhich have the following properties.
(i) A stellar mass more than three times that of any neighbours(M∗,Iso > 3M∗,Neighbour), within a projected radius of Rp ≤ 1 Mpcand |c�z| ≤ 500 km s−1.
(ii) An apparent r-band Petrosian magnitude such that
rPetro < rlim − 2.5(log10 3) − �r, (3)
with rlim being 19.4 for G09 and G12 or 19.8 for G15, and where�r is given by
�r = 2.5[log10(M∗/Lr )max − log10(M∗/Lr )], (4)
where (M∗/Lr )max is a ‘maximum’ mass-to-light ratio in the rband. r-band mass-to-light ratios are determined by dividing thestellar masses by absolute r-band Petrosian luminosities in solarunits. This maximum stellar mass ratio is chosen to have the value(M∗/Lr )max = 2.14. The purpose of this condition is that it ensuresthat isolated galaxies are sufficiently brighter than the limit of thefield, such that even neighbouring galaxies with the highest mass-to-light ratios that are fainter than the limit still have a stellar massthat is a factor of 3 less than that of the central.
(iii) A projected distance greater than 0.5 Mpc from each edge ofthe survey regions. This third condition ensures that >80 per centof the area of the 1 Mpc circle surrounding a galaxy is within thesurvey region.
We find that 7288 galaxies out of the 34 102 galaxies satisfy thesecond and third conditions, and overall we find 3536 galaxies tobe isolated. As this study is focused on satellites hosted by typicalgalaxies and not those in large groups and clusters, we remove all22 galaxies with log10 M∗ ≥ 11.5 that may be brightest clustergalaxies, resulting in a sample of 3514 isolated galaxies.
3.2 Satellite galaxies
After finding isolated systems we search for satellites around thesegalaxies. We define satellite galaxies as those surrounding isolatedgalaxies, which have a stellar mass that is at most one-third that ofthe central galaxy (M∗ < 1/3M∗,cen), within a projected radiusof RProj ≤ 500 kpc and |c�z| ≤ 500 km s−1. We chose a minimumhost to satellite mass ratio of 3:1 as Hopkins et al. (2008b) find thata 3:1 mass ratio merger event is the limit for an L∗ disc to surviveas a disc galaxy. A satellite with one-third the mass of its host willbe ∼1.2 mag fainter, assuming it has the same stellar mass-to-lightratio.
Out of the 3514 isolated galaxies, we find that 1426 host a totalof 2998 satellite galaxies. Noting that the more massive isolatedgalaxies are more likely to have satellites, and the more massivehosts are more likely to have multiple satellites, simply because ofthe selection, we find that most (59.4 per cent) have no satellitesand the mean number of satellites per isolated galaxy is 0.85. Ex-cluding the isolated galaxies which do not host satellites, we findthat the mean number of satellites per central host is 2.10. Varyingthe projected radii and velocity differences in the isolation and satel-lite search criteria results in slightly different numbers of satellitesper host and per isolated galaxy.
3.3 Other small neighbours
For the purposes of determining how the properties of satellitegalaxies depend on the host properties, we produce a comparativesample of smaller neighbouring galaxies with similar masses to the
C© 2011 The Authors, MNRAS 417, 1374–1386Monthly Notices of the Royal Astronomical Society C© 2011 RAS
1378 M. Prescott et al.
satellites, which satisfy the same criteria but with projected dis-tances in the range 0.5 ≤ RProj ≤ 1 Mpc. To ensure these neighbour-ing galaxies have no host, we check to see that these neighbouringgalaxies have no nearby galaxies which are greater than three timesthe stellar mass of the small neighbour, within Rp < 500 kpc andwith |c�z| < 500 km s−1. As these galaxies are selected in a similarway to the satellites, we consider this to be a control sample. Sur-rounding the 3514 isolated galaxies we find a total of 2304 of thesesmall neighbours.
4 R E D A N D B L U E PO P U L AT I O N S O FG A L A X I E S
In this paper we make use of the well-known colour bimodality ofgalaxies (Strateva et al. 2001; Baldry et al. 2004) to divide the hostsand satellite galaxies into red and blue populations, with a colour–mass diagram (CMD). This enables us to compare the propertiesbetween the populations, to examine how the radial distribution ofsatellites depends on host colour, and to determine how the redfraction of satellite galaxies varies as a function of both projectedradial distance from the host and stellar mass.
4.1 Colour–mass distributions
Using g − r calculated from the AUTO magnitudes, we producea CMD using the sample of 34 102 galaxies in the range 0.01 <
z < 0.15. Fig. 1 shows the CMD plotted as logarithmically spacedcontours. Each data point is weighted by 1/Vmax, where Vmax isthe maximum comoving volume, within which the galaxy couldlie depending on its redshift and the limits of the survey (Schmidt1968).
Colour bimodality can clearly be seen in Fig. 1, and we chooseto separate the red and blue populations using a straight line withthe equation
(g − r) = 0.03(log10 M∗) + 0.35. (5)
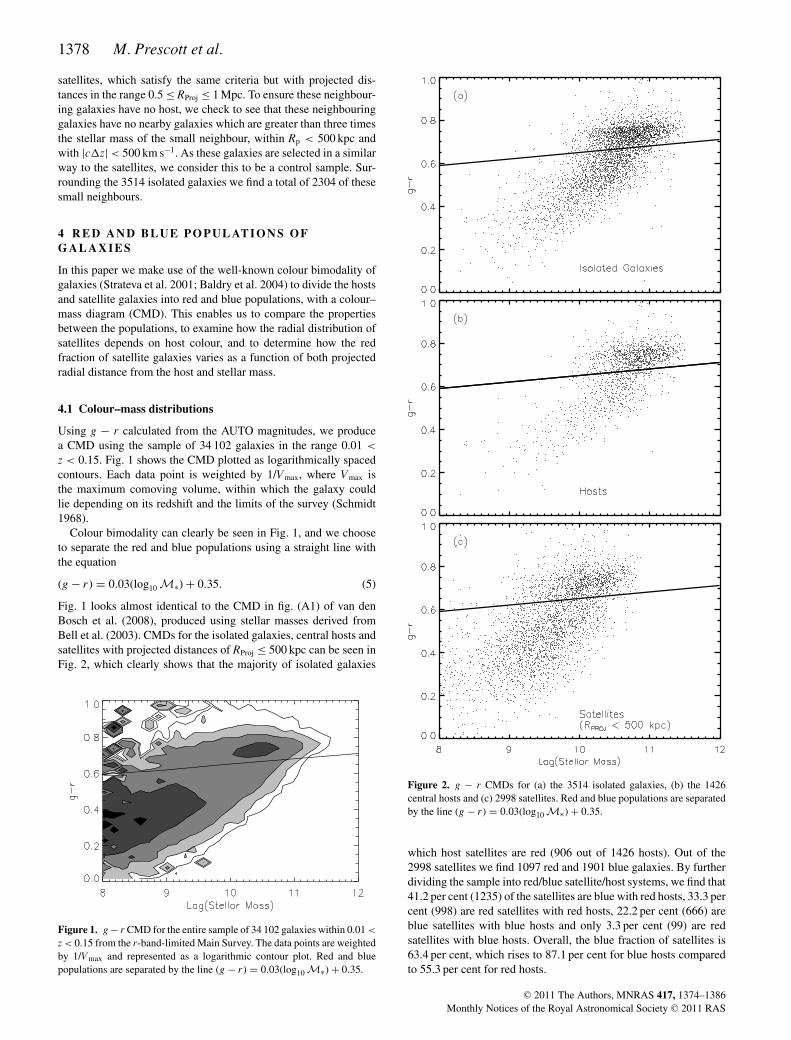
Fig. 1 looks almost identical to the CMD in fig. (A1) of van denBosch et al. (2008), produced using stellar masses derived fromBell et al. (2003). CMDs for the isolated galaxies, central hosts andsatellites with projected distances of RProj ≤ 500 kpc can be seen inFig. 2, which clearly shows that the majority of isolated galaxies
Figure 1. g − r CMD for the entire sample of 34 102 galaxies within 0.01 <
z < 0.15 from the r-band-limited Main Survey. The data points are weightedby 1/Vmax and represented as a logarithmic contour plot. Red and bluepopulations are separated by the line (g − r) = 0.03(log10 M∗) + 0.35.
Figure 2. g − r CMDs for (a) the 3514 isolated galaxies, (b) the 1426central hosts and (c) 2998 satellites. Red and blue populations are separatedby the line (g − r) = 0.03(log10 M∗) + 0.35.
which host satellites are red (906 out of 1426 hosts). Out of the2998 satellites we find 1097 red and 1901 blue galaxies. By furtherdividing the sample into red/blue satellite/host systems, we find that41.2 per cent (1235) of the satellites are blue with red hosts, 33.3 percent (998) are red satellites with red hosts, 22.2 per cent (666) areblue satellites with blue hosts and only 3.3 per cent (99) are redsatellites with blue hosts. Overall, the blue fraction of satellites is63.4 per cent, which rises to 87.1 per cent for blue hosts comparedto 55.3 per cent for red hosts.
C© 2011 The Authors, MNRAS 417, 1374–1386Monthly Notices of the Royal Astronomical Society C© 2011 RAS

GAMA: satellite galaxies 1379
4.2 Luminosity and mass distributions
In this section we compare the properties of the different samples ofgalaxies. In Fig. 3 we show the distributions in luminosity and stellarmass for red and blue hosts and satellites. This shows, as expected,the red population on average being more luminous and massivethan the blue population. We calculate mean stellar masses andabsolute r-band magnitudes for red host galaxies as log10 M∗ =10.81 and Mr = −21.81, respectively, compared to log10 M∗ =10.31 and Mr = −21.28 for the blue hosts. The latter is similar tothe value for the MW and the Schechter break (M∗) of blue galaxies(Loveday et al., in preparation). Similarly, for the red satelliteswe calculate means of log10 M∗ = 10.00 and Mr = −19.96, andlog10 M∗ = 9.35 and Mr = −19.30 for the blue. Both populationsare typically more massive and luminous than the Large MagellanicCloud.
Comparing the host galaxies to isolated galaxies without satel-lites, we find that both the blue and red galaxies with satellitesare more massive and more luminous than those without, which ismost likely a result of our satellite selection as the more massiveisolated galaxies have a larger chance of hosting a satellite. The av-erage mass and luminosity of the red galaxies without satellites arelog10 M∗ = 10.61 and Mr = −21.39 compared to the blue galaxieswhich have log10 M∗ = 10.12 and Mr = −20.94.
The mean masses and luminosities of the small neighboursare very similar to those of the satellites and we find meansof log10 M∗ = 10.77 and Mr = −20.17 for red galaxies andlog10 M∗ = 9.42 and Mr = −19.48 for the blue. This is reas-suring as it means that the small neighbours do indeed have similarproperties to the satellites and can be considered a ‘control’ sample,allowing comparisons between the two.
Other quantities useful for comparison with cosmological modelsinclude the stellar mass and luminosity differences between hostsand satellites. In Fig. 4 we show histograms of these quantities forthe blue and red hosts.
Due to our satellites having stellar masses that are less than one-third of their host mass, � log10 M∗ has a minimum value of 0.477,and we find a maximum of � log10 M∗ = 3 (1/1000 the mass of thehost). We find that the average satellite in this study is approximatelyone-tenth of the mass of the host and calculate mean logarithmicmass differences of 1.05 and 1.39 for red and blue satellites withred hosts, and 0.95 and 1.11 for red and blue satellites with bluehosts.
As for luminosity difference, we find that satellites are typically∼2 mag fainter than their hosts. Red and blue satellites of red hostsare both found to have mean magnitude difference of 2.37, and redand blue satellites with blue hosts have magnitude differences of2.54 and 2.21. We also find a small fraction of satellites which havea negative value of �Mr and are brighter than their hosts, whichwould be missed by other studies. In other words, when consideringred hosts, they can be more than three times more massive than theirblue satellites yet be of similar luminosity.
5 PRO JECTED DENSI TY OF SATELLI TE S
To investigate the radial distribution of the satellites, we calculatethe projected density per host given by
�(R) = NSat(R)
πNHost
(R2
2 − R12) , (6)
where NSat(R) is the number of satellites found within a shellbounded by inner and outer projected radii, R1 and R2, from the
Figure 3. Histograms showing the distribution of r-band absolute magnitudes (a, b) and stellar masses (c, d) for the blue and red populations of satellites withRProj ≤ 500 kpc (solid lines) and host galaxies (dashed lines).
C© 2011 The Authors, MNRAS 417, 1374–1386Monthly Notices of the Royal Astronomical Society C© 2011 RAS

1380 M. Prescott et al.
Figure 4. Distributions of the differences in the absolute r-band magnitude (a, b) and stellar masses (c, d) between the red and blue satellites (RProj ≤ 500 kpc)and their red and blue central hosts. Histograms for red satellites are shown as dotted lines, blue satellites are shown as dot–dashed lines.
host, NHost is the number of host galaxies and R is the mid-point ofthe bin.
Using projected radius bins of width �R = 0.05 Mpc and dividingthe satellites into four host stellar mass bins, 9.5 < log10 M∗ <
10.0, 10.0 < log10 M∗ < 10.5, 10.5 < log10 M∗ < 11.0 and11.0 < log10 M∗ < 11.5, we produce Fig. 5(a) which shows howthe projected density of galaxies varies as a function of projecteddistance. We fit the projected density with a power law, parametrizedby a slope, α, and normalization A:
�(R) = A(R/Mpc)α, (7)
with A in Mpc−2 as � is in Mpc−2.In Table 1 we show the best-fitting parameters and errors for
each of the curves, and find that there is little variation in the best-fitting slope, which steepens slightly from α = −0.94 ± 0.04, forsatellites with hosts in the mass range 11.0 < log10 M∗ < 11.5,to α = −1.06 ± 0.03, for satellites with hosts in the mass range9.5 < log10 M∗ < 10.0. Dividing the satellites into those with redand blue hosts (Fig. 6), with host masses between 9.5 < log10 M∗ <
11.5, we find a best-fitting slope of α = −0.94 ± 0.03 for satelliteswith red hosts compared to those with blue host which have α =−1.04 ± 0.04. These slopes suggest that the blue, low-mass hostgalaxies have slightly more centrally concentrated satellites. Theslopes, however, are affected by interlopers, galaxies which aremistaken as satellites by projection and not actually bound to theirhosts.
In order to correct for interlopers, we use a simple method ofsubtracting the average projected density of the small neighbours,with projected radii in the range 0.5 < RProj < 1.0 Mpc, from the
projected density of the satellites in each bin:
�(R)Int Corr = �(R)Sat − 〈�(0.5 < R < 1.0)small neigh〉 . (8)
Note that this assumes that these galaxies in the 0.5–1 Mpc annulirepresent the average large-scale or ‘super cluster’ environmentaround the hosts, and the correction will be an overestimate inhosts where a significant bound satellite population extends beyond0.5 Mpc, in particular for our most massive host sample (11.0–11.5).
The result of applying this interloper correction and fitting theslope for each of the host mass ranges (and colour) can also be seenin Table 1, which shows that the best-fitting slope now significantlyvaries with host mass and steepens from α = −1.09 ± 0.04 forsatellites with hosts in the mass range 11.0 < log10 M∗ < 11.5to α = −1.4 ± 0.1 for satellites with hosts in the mass range9.5 < log10 M < 10.0. For the red and blue hosts, we obtaininterloper-corrected slopes of α = −1.13 ± 0.03 and −1.38 ± 0.04,respectively. The results of this interloper subtraction can be seenin Fig. 5(b) and as the dotted lines in Fig. 6.
An observed decline in the projected density, which overall canbe approximated by �(R) ∝ R−1, is similar to other studies that in-vestigate the radial distribution of satellites. For example, Lorrimeret al. (1994), using the Centre for Astrophysics redshift survey, finda slope of α = −0.91 ± 0.05 for satellites with magnitudes in therange −16 < B < −18, after correcting for background galaxies,which is slightly shallower than the interloper-corrected slopes weobtain. Furthermore, they divide their satellite sample into early-and late-type hosts, to find that satellites with early-type hosts aremore centrally concentrated than late types, finding slopes of α =−1.01 ± 0.1 for satellites of early-type hosts and α = −0.78 ±0.05 for the late-type hosts, which is the opposite to what we find.
C© 2011 The Authors, MNRAS 417, 1374–1386Monthly Notices of the Royal Astronomical Society C© 2011 RAS

GAMA: satellite galaxies 1381
Figure 5. (a) Projected densities of satellites with RProj ≤ 500 kpc, dividedinto four host stellar mass bins, using projected radius bins of width �R =0.05 Mpc. (b) The same as above corrected for interlopers. The error barsshown are Poissonian.
Although our slope for satellites of red hosts is consistent withtheir result for early-type hosts, our result for the satellites of bluegalaxies differs from their findings for late-type hosts.
More recently, Chen et al. (2006) find an interloper-correctedslope of α = −1.58 ± 0.11, using a galaxy sample from SDSSDR4. Here satellites are defined as galaxies with Mr < −18.0,which are 2 mag fainter than their hosts, with RProj ≤ 500 kpc and�V ≤ 500 km s−1 and isolated galaxies are defined as those withMr ≤ −20.0, have no nearby galaxies within �m ≤ 2 mag, �V ≤1000 km s−1 and RProj ≤ 500 kpc. Using these same selection criteriaand a larger data sample from SDSS DR6, Chen (2008) finds thatthe interloper-corrected slopes of satellites of red and blue hosts arealmost identical and obtain values of α =−1.54 ± 0.12 and −1.50 ±0.12 for satellites of blue and red hosts, respectively. Although these
Figure 6. Projected densities of satellites with RProj ≤ 500 kpc, for the redand blue hosts with masses in the range 9.5 ≤ log10 M∗ ≤ 11.5, usingprojected radius bins of width �R = 0.05 Mpc. The interloper-correctedvalues are connected by dotted lines. The error bars are Poissonian.
values are similar to our slopes for the blue and low-mass hosts, theyare quite different for the red and high-mass hosts. Chen (2008) andothers have used r-band luminosity for isolation criteria. For redhosts, this is significantly more stringent than using an estimatedstellar mass that allows for equally luminous blue satellites. Thiscould explain some of these differences.
Sales et al. (2007) using a sample of galaxies from the semi-analytic Millennium Simulation find a slope of α = −1.55 ± 0.08,again for satellites that are at least 2 mag fainter than their hosts,within RProj ≤ 500 kpc and �V ± 500 km s−1.
Investigating the satellites of 34 elliptical galaxies, Madore et al.(2004) find a decline with a slope of α = −0.5 out to RProj � 150 kpc,which flattens out at greater projected radii. Although the slope theyobtain is again inconsistent with our results, this may be due to thesmall numbers of galaxies involved. They do note that there is aflattening in the projected density at RProj ≥ 300 kpc, which can alsobe seen in our data.
Finally, Ann et al. (2008), using SDSS DR5 data, define satellitesas galaxies with Mr < −18.0, which are more than 1 mag fainterin the r band than their hosts, within RProj ≤ 1 Mpc and �V ≤1000 km s−1. They also use an isolation criterion, so that isolatedgalaxies are required to have Mr < −19.0, and no neighbours within�m ≤ 1 mag of the host, within a RProj ≤ 500 kpc and �V ±500 km s−1, producing a sample of 2254 hosts with 4986 satellites.Without correcting for interlopers, they fit slopes for satellites withinRProj = 200 kpc of their hosts, and obtain values of α ∼ −1.8 forboth the late- and early-type satellites of late-type hosts and for theearly-type satellites of early-type hosts. For the late-type satellitesof early-type hosts, a shallower slope of α ∼ −1.5 is found.
Table 1. Best-fitting A and α parameters (equation 7) for the projected densities in Figs 5 and 6, corrected anduncorrected for interlopers. The uncertainties quoted are derived from least-squares straight-line fits to log �
versus log R with the data points shown in the figures.
Host stellar mass range NSat tot Aun corr (Mpc−2) αun corr AInt corr (Mpc−2) αInt corr
9.5 ≤ log10 M∗ ≤ 10.0 111 0.14 ± 0.03 −1.06 ± 0.10 0.05 ± 0.01 −1.40 ± 0.1010.0 ≤ log10 M∗ ≤ 10.5 457 0.13 ± 0.01 −1.09 ± 0.05 0.04 ± 0.04 −1.46 ± 0.0510.5 ≤ log10 M∗ ≤ 11.0 1 225 0.20 ± 0.01 −0.94 ± 0.03 0.10 ± 0.01 −1.14 ± 0.0411.0 ≤ log10 M∗ ≤ 11.5 1 140 0.23 ± 0.02 −0.94 ± 0.04 0.14 ± 0.01 −1.09 ± 0.04
All blue hosts 700 0.14 ± 0.01 −1.04 ± 0.04 0.05 ± 0.01 −1.38 ± 0.04All red hosts 2 223 0.21 ± 0.01 −0.94 ± 0.03 0.12 ± 0.01 −1.13 ± 0.03
C© 2011 The Authors, MNRAS 417, 1374–1386Monthly Notices of the Royal Astronomical Society C© 2011 RAS

1382 M. Prescott et al.
The shallower slopes for the high-mass hosts compared to low-mass hosts measured over the range 0.05–0.5 Mpc are expected ifsatellite density profiles are related to DM profiles (Navarro, Frenk& White 1996, hereafter NFW; surface density profile given byBartelmann 1996). The higher mass hosts would be expected tohave larger NFW scale radii and therefore shallower DM profilesover the radial range probed by our study.
6 R ED FRAC TION O F SATELLITE GALAXI ES
After measuring the projected density of satellites, we determinehow the red fraction of satellites varies as a function of mass andprojected distance from the hosts. It should be noted that the mostrobust results, free of significant selection effects, are the differencesbetween the satellites and small neighbours.
6.1 Red fraction as a function of projected distance
To measure the red fraction of satellites (RProj ≤ 0.5 Mpc) andsmall neighbours (0.5 ≤ RProj ≤ 1 Mpc), we divide the numbercounts of red galaxies by the total number of galaxies in bins ofprojected radius of width �RProj = 0.1 Mpc. By dividing the sampleof satellites into those with red and blue hosts, we produce Fig. 7(a).
Figure 7. (a) The red fraction of satellite galaxies as a function of projectedradius for the red and blue hosts. (b) The red fraction of satellite galaxies asa function of projected radius, for four different host stellar mass ranges. Wedefine galaxies with RProj ≤ 0.5 Mpc as satellites and galaxies with 0.5 ≤RProj ≤ 1.0 Mpc as small neighbouring galaxies which have been selectedin a similar way. The error bars shown are 1σ beta distribution confidenceintervals.
By dividing the sample of satellites into four bins of host stellar massas before, we produce Fig. 7(b). The error bars on the red fractionof galaxies in all plots are 1σ beta distribution confidence intervalsexplained in detail in Cameron (2010). These are an improvementover other methods for estimating binomial confidence intervals,such as Poisson errors, which are liable to misrepresent the degree ofstatistical uncertainty for small samples, or fractions that approachvalues of 0 or 1.
From Fig. 7(a) it is clear that the red fraction of satellites of redhosts is significantly higher than those with blue hosts. The averagered fraction of all the points in the range 0.05 ≤ RProj ≤ 1 Mpc forthe satellites of red hosts is 0.38 compared to 0.13 for the blue hosts.The red fraction of satellites for red hosts increases by a factor of1.49 from 0.37 at RProj = 0.45 Mpc to 0.55 at 0.05 Mpc. For thesatellites of blue hosts no trend in the red fraction as a function ofradius is seen.
Similar trends are reflected in Fig. 7(b) as expected. The redfraction of satellites and small neighbours increases significantly asa function of host mass, from an average red fraction of all the pointsin the range 0.05 ≤ RProj ≤ 1 Mpc of 0.09 for galaxies associatedwith hosts with 9.5 ≤ log10 M∗ ≤ 10.0, 0.08 for galaxies of hostswith 10.0 ≤ log10 M∗ ≤ 10.5, 0.27 for galaxies of hosts with10.5 ≤ log10 M∗ ≤ 11.0, to 0.54 for galaxies of hosts with 11.0 ≤log10 M∗ ≤ 11.5. The highest two host mass ranges show that anupturn in the red fraction occurs within RProj ∼ 500 kpc. For thehighest host mass bin 11.0 ≤ log10 M ≤ 11.5, the red fraction ofsatellites increases by a factor of 1.4 from 0.54 at RProj = 0.45 Mpcto 0.74 at 0.05 Mpc and, for satellites with host masses of 10.5 ≤log10 M∗ ≤ 11.0, with the red fraction increasing by a factor of 1.7from 0.22 at RProj = 0.45 Mpc to 0.37 at 0.05 Mpc. No trend in thered fraction as a function of radius is observed for the two lowesthost mass bins.
Following on from this, we investigate how the red fractionvaries as a function of satellite mass, by subdividing galaxies inthe host mass bins above further into satellite mass bins. It is im-portant to do this in order to verify that the satellite trends arenot simply due to mass segregation, and to separate ‘environmentquenching’ from ‘mass quenching’ (Peng et al. 2010). Figs 8(a),(c) and (e) show how the red fraction varies as a function of ra-dius, with the data separated into three different plots for threedifferent host mass bins, and then subdivided into satellite massbins of 9.5 ≤ log10 M∗ ≤ 10.0, 10.0 ≤ log10 M∗ ≤ 10.5,10.5 ≤ log10 M∗ ≤ 11.0 and 11.0 ≤ log10 M∗ ≤ 11.5, de-pending on the host mass bin. The mean numbers of satellitesand small neighbours in each bin are 36.2, 65.6 and 48.5 forthose with host masses in the ranges 10.0 ≤ log10 M∗ ≤ 10.5,10.5 ≤ log10 M∗ ≤ 11.0 and 11.0 ≤ log10 M∗ ≤ 11.5, respec-tively. In Table 2 we show the average red fractions of satellites andsmall neighbours for each of the different host and satellite massranges. From these, we can see the following.
(i) For satellites with hosts in the range 10.0 ≤ log10 M∗ ≤ 10.5,little change in the red fraction as a function of radius is observed,with the red fraction of the satellites and small neighbours remainingaround the 0.05 level for galaxies with 9.0 ≤ log10 M∗ ≤ 9.5and ∼0.14 for satellites with stellar masses in the range 9.5 ≤log10 M∗ ≤ 10.0.
(ii) For satellites with hosts in the range 10.5 ≤ log10 M∗ ≤11.0, the red fraction increases with satellite mass, such that theaverage red fraction increases from 0.11 ± 0.03, for satellites withmasses 9.0 ≤ log10 M∗ ≤ 9.5, to 0.33 ± 0.03, for satellites withmasses of 9.5 ≤ log10 M∗ ≤ 10.0, and 0.57 ± 0.02, for satellites
C© 2011 The Authors, MNRAS 417, 1374–1386Monthly Notices of the Royal Astronomical Society C© 2011 RAS

GAMA: satellite galaxies 1383
Figure 8. Left-hand panels (a, c, e) show the red fraction of satellite galaxies as a function of projected radius and satellite stellar mass, shown for three differentcentral host stellar mass ranges. Host masses of 10.0 ≤ log10 M∗ ≤ 10.5, 10.5 ≤ log10 M∗ ≤ 11.0 and 11.0 ≤ log10 M∗ ≤ 11.5 with satellites of stellarmasses 9.0 ≤ log10 M∗ ≤ 9.5 (red stars), 9.5 ≤ log10 M∗ ≤ 10.0 (green diamonds), 10.0 ≤ log10 M∗ ≤ 10.5 (blue triangles) and 10.5 ≤ log10 M∗ ≤ 11.0(purple squares). Right-hand panels (b, d, f) show the red fraction of satellites with RProj ≤ 0.5 Mpc and small neighbours with 0.5 ≤ RProj ≤ 1.0 Mpc as afunction of satellite mass, for hosts in the same mass ranges opposite. The errors shown are 1σ beta distribution confidence intervals.
with masses of 10.0 ≤ log10 M∗ ≤ 10.5. It also becomes apparentthat the red fraction increases as distance decreases. The averagered fraction of the satellites is greater than the average red fractionof the small neighbours in the same mass range. For galaxies with9.0 ≤ log10 M∗ ≤ 9.5 this difference is 0.05 ± 0.04, 0.15 ± 0.04for galaxies with 9.5 ≤ log10 M∗ ≤ 10.0 and 0.06 ± 0.04 forgalaxies with 10.0 ≤ log10 M∗ ≤ 10.5.
(iii) Satellites with host masses 11.0 ≤ log10 M∗ ≤ 11.5 showsimilar trends and the radial dependence becomes even more ap-
parent, especially for the low-mass satellites. The average red frac-tion of satellites increases from 0.37 ± 0.07, for satellites with9.0 ≤ log10 M∗ ≤ 9.5, to 0.90 ± 0.02, for the satellites with10.5 ≤ log10 M∗ ≤ 11.0. The difference between the red fractionof satellites and the small neighbours is observed to be 0.25 ± 0.07for galaxies in the mass range 9.0 ≤ log10 M∗ ≤ 9.5, 0.18 ± 0.07for galaxies with 9.5 ≤ log10 M∗ ≤ 10.0, 0.15 ± 0.05 for galaxieswith 10.0 ≤ log10 M∗ ≤ 10.5 and 0.15 ± 0.04 for galaxies with10.5 ≤ log10 M∗ ≤ 11.0.
C© 2011 The Authors, MNRAS 417, 1374–1386Monthly Notices of the Royal Astronomical Society C© 2011 RAS

1384 M. Prescott et al.
Table 2. Average red fraction of satellites and small neighbours of galaxies in Fig. 8. The error quoted is the standard error.
Host mass range Satellite mass range Mean satellite red fraction Mean small neighbour red fraction
10.0 ≤ log10 M∗ ≤ 10.5 9.0 ≤ log10 M∗ ≤ 9.5 0.08 ± 0.02 0.04 ± 0.019.5 ≤ log10 M∗ ≤ 10.0 0.14 ± 0.03 0.14 ± 0.02
10.5 ≤ log10 M∗ ≤ 11.0 9.0 ≤ log10 M∗ ≤ 9.5 0.11 ± 0.03 0.06 ± 0.029.5 ≤ log10 M∗ ≤ 10.0 0.33 ± 0.03 0.18 ± 0.0410.0 ≤ log10 M∗ ≤ 10.5 0.57 ± 0.02 0.51 ± 0.02
11.0 ≤ log10 M∗ ≤ 11.5 9.0 ≤ log10 M∗ ≤ 9.5 0.37 ± 0.07 0.12 ± 0.029.5 ≤ log10 M∗ ≤ 10.0 0.53 ± 0.03 0.35 ± 0.0510.0 ≤ log10 M∗ ≤ 10.5 0.79 ± 0.03 0.64 ± 0.0310.5 ≤ log10 M∗ ≤ 11.0 0.90 ± 0.02 0.75 ± 0.04
Our results here support the ‘galactic conformity’ phenomenon,whereby red/early-type centrals have a significantly higher fractionof red/early-type satellites, noted first by Weinmann et al. (2006) andalso observed by Ann et al. (2008). Weinmann et al. (2006) producea large catalogue of ∼53 000 groups, from a sample of ∼92 000galaxies from the SDSS DR2, using the halo-based group finder ofYang et al. (2005). Defining centrals as the brightest group membersand satellites as the remaining group members, they determine theprojected halocentric distances (normalized to the virial radius of thesystem Rvir) of the satellites and halo masses of the systems. Theyfind that the early-type fractions of satellites increase as a function ofincreasing luminosity, increasing group halo mass and decreasinghalocentric distance. For halo masses with 14 < log10 M < 15,the early-type fraction of satellites increases from ∼40 per centat 0.9R/Rvir to ∼60 per cent at 0.1R/Rvir. For lower mass haloeswith 12 < log10 M < 13, the early-type fraction of satellites isapproximately constant at ∼25 per cent. This is a similar picture towhat we see in Fig. 7.
In a study more directly comparable to ours, Ann et al. (2008)investigate satellite systems of isolated hosts and determine themorphologies of their satellite and host samples to investigate theearly-type fraction of satellite galaxies as a function of radius. Split-ting their hosts into early and late types, they find that the early-typesatellite fraction for early-type hosts increases from ∼0.2 at RProj =1 Mpc to ∼0.6 at RProj = 0.05 kpc, whereas the early-type fractionfor late-type hosts remains roughly constant, ∼0.2 for all projectedradii, which is almost identical to what we find in Fig. 7(a). Bydividing their sample into hosts with Mr < −20.5 and −21.0 <
Mr < −19.0, they show in their fig. 2 that the brighter early-typehosts have an early-type satellite fraction which is 0.05–0.20 greaterin each projected radius bin compared to those with fainter hosts.For the brighter host bin, the early-type satellite fraction increasesfrom ∼20 per cent at RProj = 1 Mpc to ∼70 per cent at RProj =0.05 Mpc, whereas the early-type satellite fraction for fainter hostsincreases from ∼20 per cent at RProj = 1 Mpc to ∼60 per cent atRProj = 0.05 Mpc. For the late-type hosts, the early-type satellitefraction is roughly constant with projected radius at ∼25 per centfor hosts with Mr < −20.5 compared to being roughly constant at∼15 per cent for hosts with −21.0 < Mr < −19.0. Again this trendis similar to our result that the red fraction of satellites increaseswith increasing host mass.
6.2 Red fraction as a function of mass
An alternative way of showing how the red fraction varies as afunction of radius can be seen in Figs 8(b), (d) and (f), which showthe red fraction of satellites and small neighbours in mass bins of
width � log10 M = 0.25, for the same host mass ranges as onthe left-hand side. As expected, the red fraction of satellites andsmall neighbours increases with increasing stellar mass. Figs 8(b),(d) and (f) clearly show that host mass has the biggest effect onthe red fraction of satellites relative to the small neighbours. Forthe satellites with the lowest host masses (10.0 ≤ log10 M∗ ≤10.5), there is virtually no difference between the red fraction of thesatellites and small neighbours, confirming that the red fraction hasno radial dependence. For the highest mass hosts, the red fractionof the satellites is about 0.2 greater than the red fraction of smallneighbours.
Using the SDSS DR4 group catalogue of Yang et al. (2007), vanden Bosch et al. (2008) define the most massive members of groupsas centrals and the remaining group members as satellites, produc-ing a sample of 218 103 centrals and 59 982 satellites. They theninvestigate how the red fractions of hosts (centrals) and satellites bymass compare. In their fig. 8, they show that the difference in thered fraction of centrals and satellites is the greatest at low masses(the satellites have red fractions which are 20–40 per cent higher forlog10 M∗ ≤ 10.0), converging at higher masses. The significant redfraction at the lowest satellite masses is discrepant with what weobserve, although this may be explained by the different definitionsof satellite galaxies.
6.3 Discussion
We have shown that the red fraction of satellites surrounding isolatedhosts increases as a function of host stellar mass, satellite mass anddecreasing projected separation, indicating that the quenching ofstar formation in satellite galaxies is more efficient in most massivesystems and acts within ∼500 kpc of the host. This quenching of starformation is likely to be due to the removal of gas by a combinationof radiative and gravitational effects of the host, which have beeninvestigated in previous studies.
One way of shutting off the star formation in satellite galaxies isby strangulation (Larson et al. 1980; Balogh et al. 2000), which isthought to occur when a satellite’s halo is accreted into the largerhalo of its host removing the satellite’s hot, diffuse gas and thuscausing a slow decline (on time-scales τ > 1 Gyr) in the star for-mation as its supply of cold gas is suppressed, and turning spiralsinto S0 galaxies. Kawata & Mulchaey (2008) simulate the strangu-lation process, showing that it acts on satellites within R < 500 kpcon time-scales of τ ∼ 2.0 Gyr. They conclude that the process ismore effective in relaxed groups of galaxies, which are dominatedby elliptical galaxies surrounded by an X-ray-emitting intergalac-tic medium (IGM). Many of the systems with high-mass hostsfound in this study could be described as the system above, making
C© 2011 The Authors, MNRAS 417, 1374–1386Monthly Notices of the Royal Astronomical Society C© 2011 RAS

GAMA: satellite galaxies 1385
strangulation a likely explanation for our results. This scenario isalso consistent with the host mass having the largest effect on thered fraction, rather than satellite mass.
Compared to the slow quenching of star formation which occursin strangulation, rapid quenching could occur if enough externalpressure is exerted on the satellite to remove its cold gas, in theprocess of ram-pressure stripping (Gunn & Gott 1972; Hester 2006).Thought to turn spiral galaxies into S0 types, ram-pressure strippingis most effective in clusters and groups of galaxies, where the densityof the hot IGM and velocities of satellites create sufficient pressureto overcome the restoring force keeping cold gas in galaxies. Hester(2006) finds, using simulations of groups, that low-mass satellitesare more severely stripped over larger distances, than larger spiralgalaxies which are only stripped at small distances from the host.This is not what we see in this study with a higher red fraction over0–0.4 Mpc, compared to the small neighbours, in the highest masshosts for all satellite masses (see Fig. 8e).
Tidal stripping of gas from satellites due to the gravitational ef-fects of the host is likely to occur simultaneously with ram-pressurestripping. Mayer et al. (2006), using N-body simulations of MW-sized haloes surrounded by gas-rich dwarfs, show that a combinationof tidal and ram-pressure stripping is more effective at removinggas than either process alone. Tidal interactions between satellitesand their hosts may explain the streams of H I gas observed locallyas the Magellanic Stream and high-velocity clouds (Putman et al.2003) and as the extragalactic H I clouds observed around M31(Thilker et al. 2004), M33 (Grossi et al. 2008) and the M81/M82group (Chynoweth et al. 2008). Shutting off of star formation mightbe expected to scale with the ratio of satellite to host mass, whichis not evident in our data. Considering satellites that are ∼0.01–0.1times the mass of the host in Fig. 8 (8.5–10 in Fig. 8b, 9–10.5 inFig. 8d, 9.5–11 in Fig. 8f), it is clear that the difference between thesatellites and small neighbours depends on the host mass but noton the ratio between the satellite and host mass. This is in agree-ment with the idea that the probability of environment quenching isindependent of the satellite stellar mass (Peng et al. 2011).
Another process which is thought to be able to strip galaxies oftheir gas is harassment (Moore et al. 1996). This is the heating ofa satellite, occurring when a satellite’s DM subhalo has frequenthigh-speed encounters with other DM subhaloes, turning low sur-face brightness discs into smaller dwarfs. Although this is usuallyconsidered as a process occurring in clusters containing thousandsof galaxies, �CDM models of the Universe reveal that galaxy sys-tems are scaled-down versions of clusters and should contain thou-sands of DM subhaloes surrounding galaxies (Klypin et al. 1999;Moore et al. 1999), which means harassment on smaller scales maybe a possibility.
Furthermore, satellite–satellite mergers could occur which wouldturn late-type satellites into early types (McIntosh et al. 2008). This,however, is unlikely to be a significant way of increasing the redfraction, due to the low numbers of satellites per host observed.
7 C O N C L U S I O N S
We have performed a search for the satellites of isolated galaxiesfrom the GAMA survey using selection criteria that take into ac-count stellar mass estimates. Separating galaxies into the red andblue populations using a CMD, we have investigated the radial dis-tribution of satellites, and how the red fraction of satellites variesas a function of projected distance, host stellar mass and satellitestellar mass.
We find that out of a sample of 3514 isolated galaxies 1426 hosta total of 2998 satellite galaxies. Separating the galaxies into redand blue populations, we find that 41.2 per cent of the satellites areblue with red hosts, 33.3 per cent are red with red hosts, 22.2 percent are blue with blue hosts and only 3.3 per cent are red withblue hosts. We find mean stellar masses and absolute magnitudesof log10 M∗ = 10.00 and Mr = −19.96, and log10 M∗ = 9.35 andMr = −19.30, for the red and blue populations of satellites, respec-tively. The average satellite in this sample is found to be approxi-mately one-tenth of the mass of its host. The mean � log10 M∗ =1.18. Our main results are as follows.
(i) Parametrizing the projected density of the satellites by �(R) ∝Rα , we find best-fitting slopes of α � −1.0 for satellites divided intofour host stellar mass bins (Fig. 5). By dividing the satellite hostsinto red and blue populations, we find the satellites of blue, low-mass hosts to be more centrally concentrated. Power-law slopes ofα = −0.94 and −1.05 for the satellites of red and blue hosts areobtained, respectively. Correcting for interlopers, the slopes steepento α = −1.13 and −1.38 (Fig. 6).
(ii) We find there to be a steady increase in the red fraction ofsatellites as projected distance decreases for satellites with hosts ofstellar mass log10 M∗ ≥ 10.5. The red fraction of satellites withhosts of stellar masses log10 M < 10.5 shows no trend as a functionof radius (Fig. 7).
(iii) Subdividing the satellite sample into host and satellite massbins reveals that the host mass has the biggest effect on the satellitered fraction. Satellites with more massive hosts are more likelyto be red. Comparing satellites to the small neighbours controlsample, we find the red fraction is 0.13–0.25 higher for satellitesof 11.0 ≤ log10 M∗ ≤ 11.5 hosts, 0.06–0.15 higher for 10.5 ≤log10 M∗ ≤ 11.0 hosts, and almost unchanged for lower mass10.0 ≤ log10 M∗ ≤ 10.5 hosts (Fig. 8).
The effect of environment, as noted by the difference betweenthe satellites and small neighbours, can act over large range in high-mass haloes and appears to be primarily a function of host massand not satellite mass. These results suggest that quenching of starformation by strangulation is likely to be the main gas removalprocess in satellite systems, with other tidal effects having a smallercontributing effect. Further study of the radial dependence of theinstantaneous star formation rates of satellite galaxies using Hα
emission line measurements is likely to yield more details about thequenching mechanism.
AC K N OW L E D G M E N T S
GAMA is a joint European–Australasian project based around aspectroscopic campaign using the Anglo-Australian Telescope. TheGAMA input catalogue is based on data taken from the Sloan Dig-ital Sky Survey and the UKIRT Infrared Deep Sky Survey. Com-plementary imaging of the GAMA regions is being obtained by anumber of independent survey programmes including GALEX MIS,VST KIDS, VISTA VIKING, WISE, Herschel-ATLAS, GMRT andASKAP providing UV to radio coverage. GAMA is funded by theSTFC (UK), the ARC (Australia), the AAO and the participatinginstitutions. The GAMA website is http://www.gama-survey.org/.MP acknowledges STFC for a postgraduate studentship. IKB andPAJ acknowledge STFC for funding. We acknowledge the IDL As-tronomy User’s Library, and IDL code maintained by D. Schlegel(IDLUTILS) as valuable resources.
We thank the anonymous referee for useful comments which haveimproved the content, clarity and presentation of this paper.
C© 2011 The Authors, MNRAS 417, 1374–1386Monthly Notices of the Royal Astronomical Society C© 2011 RAS

1386 M. Prescott et al.
REFERENCES
Adelman-McCarthy J. K. et al., 2008, ApJS, 175, 297Agustsson I., Brainerd T. G., 2010, ApJ, 709, 1321Ann H. B., Park C., Choi Y., 2008, MNRAS, 389, 86Azzaro M., Patiri S. G., Prada F., Zentner A. R., 2007, MNRAS, 376, L43Bailin J., Power C., Norberg P., Zaritsky D., Gibson B. K., 2008, MNRAS,
390, 1133Baldry I. K., Glazebrook K., Brinkmann J., Ivezic Z., Lupton R. H., Nichol
R. C., Szalay A. S., 2004, ApJ, 600, 681Baldry I. K., Balogh M. L., Bower R. G., Glazebrook K., Nichol R. C.,
Bamford S. P., Budavari T., 2006, MNRAS, 373, 469Baldry I. K., Glazebrook K., Driver S. P., 2008, MNRAS, 388, 945Baldry I. K. et al., 2010, MNRAS, 404, 86Balogh M. L., Navarro J. F., Morris S. L., 2000, ApJ, 540, 113Bartelmann M., 1996, A&A, 313, 697Bell E. F., McIntosh D. H., Katz N., Weinberg M. D., 2003, ApJS, 149, 289Bell E. F. et al., 2004, ApJ, 608, 752Bertin E., Arnouts S., 1996, A&A, 117, 393Blanton M. R., Roweis S., 2007, AJ, 133, 734Bower R. G., Benson A. J., Malbon R., Helly J. C., Frenk C. S., Baugh C.
M., Cole S., Lacey C. G., 2006, MNRAS, 370, 645Boylan-Kolchin M., Springel V., White S. D. M., Jenkins A., 2010, MNRAS,
406, 896Brainerd T. G., 2005, ApJ, 628, L101Busha M. T., Wechsler R. H., Behroozi P. S., Gerke B. F., Klypin A. A.,
Primack J. R., 2010, ApJ, preprint (arXiv:1011.6373)Cameron E., 2010, Publ. Astron. Soc. Australia, 28, 128Chen J., 2008, A&A, 484, 347Chen J., Kravtsov A. V., Prada F., Sheldon E. S., Klypin A. A., Blanton M.
R., Brinkmann J., Thakar A. R., 2006, ApJ, 647, 86Chynoweth K. M., Langston G. I., Yun M. S., Lockman F. J., Rubin K. H.
R., Scoles S. A., 2008, AJ, 135, 1983Colless M. et al., 2001, MNRAS, 328, 1039Croton D. J. et al., 2006, MNRAS, 365, 11Davis M. et al., 2003, in Guhathakurta P., ed., Proc. SPIE Vol. 4834, Dis-
coveries and Research Prospects from 6- to 10-Meter-Class TelescopesII. SPIE, Bellingham, p. 161
De Propris R., Liske J., Driver S. P., Allen P. D., Cross N. J. G., 2005, AJ,130, 1516
Domınguez-Palmero L., Balcells M., 2008, A&A, 489, 1003Driver S. P. et al., 2009, Astron. Geophys., 50, 5.12Driver S. P. et al., 2011, MNRAS, 413, 971Eke V. R., Baugh C. M., Cole S., Frenk C. S., Navarro J. F., 2006, MNRAS,
370, 1147Faber S. M. et al., 2007, ApJ, 665, 265Gallazzi A., Bell E. F., 2009, ApJS, 185, 253Grossi M., Giovanardi C., Corbelli E., Giovanelli R., Haynes M. P., Martin
A. M., Saintonge A., Dowell J. D., 2008, A&A, 487, 161Gunn J. E., Gott J. R., III, 1972, ApJ, 176, 1Gunn J. E. et al., 1998, AJ, 116, 3040Hau G. K. T., Bower R. G., Kilborn V., Forbes D. A., Balogh M. L., Oosterloo
T., 2008, MNRAS, 385, 1965Hester J. A., 2006, ApJ, 647, 910Hill D. T. et al., 2011, MNRAS, 412, 765Hogg D. W., Finkbeiner D. P., Schlegel D. J., Gunn J. E., 2001, AJ, 122,
2129Hopkins P. F., Hernquist L., Cox T. J., Keres D., 2008a, ApJS, 175, 356Hopkins P. F., Hernquist L., Cox T. J., Younger J. D., Besla G., 2008b, ApJ,
688, 757James P. A., Ivory C. F., 2011, MNRAS, 411, 495Jones D. H. et al., 2004, MNRAS, 355, 747Kawata D., Mulchaey J. S., 2008, ApJ, 672, L103Klypin A., Kravtsov A. V., Valenzuela O., Prada F., 1999, ApJ, 522, 82Lake G., Tremaine S., 1980, ApJ, 238, L13Larson R. B., Tinsley B. M., Caldwell C. N., 1980, ApJ, 237, 692Lawrence A. et al., 2007, MNRAS, 379, 1599Le Fevre O. et al., 2005, A&A, 439, 845
Liu L., Gerke B. F., Wechsler R. H., Behroozi P. S., Busha M. T., 2011, ApJ,733, 62
Lorrimer S. J., Frenk C. S., Smith R. M., White S. D. M., Zaritsky D., 1994,MNRAS, 269, 696
McIntosh D. H., Guo Y., Hertzberg J., Katz N., Mo H. J., van den Bosch F.C., Yang X., 2008, MNRAS, 388, 1537
Madore B. F., Freedman W. L., Bothun G. D., 2004, ApJ, 607, 810Masters K. L., Haynes M. P., Giovanelli R., 2004, ApJ, 607, L115Mayer L., Mastropietro C., Wadsley J., Stadel J., Moore B., 2006, MNRAS,
369, 1021Moore B., Katz N., Lake G., Dressler A., Oemler A., 1996, Nat, 379, 613Moore B., Ghigna S., Governato F., Lake G., Quinn T., Stadel J., Tozzi P.,
1999, ApJ, 524, L19Navarro J. F., Frenk C. S., White S. D. M., 1996, ApJ, 462, 563 (NFW)Peng Y., Lilly S. J., Renzini A., Carollo M., 2011, ApJ, preprint
(arXiv:1106.2546)Peng Y. et al., 2010, ApJ, 721, 193Petrosian V., 1976, ApJ, 209, L1Phillipps S., Shanks T., 1987, MNRAS, 229, 621Prescott M., Baldry I. K., James P. A., 2009, MNRAS, 397, 90Putman M. E., Staveley-Smith L., Freeman K. C., Gibson B. K., Barnes D.
G., 2003, ApJ, 586, 170Quinn P. J., Hernquist L., Fullagar D. P., 1993, ApJ, 403, 74Robotham A. et al., 2010, Publ. Astron. Soc. Australia, 27, 76Sales L., Lambas D. G., 2004, MNRAS, 348, 1236Sales L., Lambas D. G., 2005, MNRAS, 356, 1045Sales L. V., Navarro J. F., Lambas D. G., White S. D. M., Croton D. J., 2007,
MNRAS, 382, 1901Schlegel D. J., Finkbeiner D. P., Davis M., 1998, ApJ, 500, 525Schmidt M., 1968, ApJ, 151, 393Sharp R. et al., 2006, in McLean I. S., Iye M., eds, Proc. SPIE Vol. 6269,
Ground-based and Airborne Instrumentation for Astronomy. SPIE,Bellingham, p. 62690G
Smith R. M., Martınez V. J., Graham M. J., 2004, ApJ, 617, 1017Stoughton C., Lupton R. H., Bernardi M., Blanton M. R., Burles S., Cas-
tander F. J., Connolly A. J., Eisenstein D. J., 2002, AJ, 123, 485Strateva I. et al., 2001, AJ, 122, 1861Strauss M. A. et al., 2002, AJ, 124, 1810Taylor E. N., Franx M., Glazebrook K., Brinchmann J., van der Wel A., van
Dokkum P. G., 2010, ApJ, 720, 723Taylor E. N. et al., 2011, MNRAS, in pressThilker D. A., Braun R., Walterbos R. A. M., Corbelli E., Lockman F. J.,
Murphy E., Maddalena R., 2004, ApJ, 601, L39Tollerud E. J., Boylan-Kolchin M., Barton E. J., Bullock J. S., Trinh C. Q.,
2011, ApJ, preprint (arXiv:1103.1875)Tonry J. L., Blakeslee J. P., Ajhar E. A., Dressler A., 2000, ApJ, 530, 625Toomre A., Toomre J., 1972, ApJ, 178, 623Vader J. P., Sandage A., 1991, ApJ, 379, L1van den Bosch F. C., Yang X., Mo H. J., Norberg P., 2005, MNRAS, 356,
1233van den Bosch F. C., Aquino D., Yang X., Mo H. J., Pasquali A., McIntosh
D. H., Weinmann S. M., Kang X., 2008, MNRAS, 387, 79Weinmann S. M., van den Bosch F. C., Yang X., Mo H. J., 2006, MNRAS,
366, 2White S. D. M., Frenk C. S., 1991, ApJ, 379, 52Willmer C. N. A. et al., 2006, ApJ, 647, 853Yang X., Mo H. J., van den Bosch F. C., Jing Y. P., 2005, MNRAS, 356,
1293Yang X., van den Bosch F. C., Mo H. J., Mao S., Kang X., Weinmann S.
M., Guo Y., Jing Y. P., 2006, MNRAS, 369, 1293Yang X., Mo H. J., van den Bosch F. C., Pasquali A., Li C., Barden M.,
2007, ApJ, 671, 153York D. G. et al., 2000, AJ, 120, 1579Zaritsky D., Smith R., Frenk C., White S. D. M., 1993, ApJ, 405, 464Zibetti S., Charlot S., Rix H., 2009, MNRAS, 400, 1181
This paper has been typeset from a TEX/LATEX file prepared by the author.
C© 2011 The Authors, MNRAS 417, 1374–1386Monthly Notices of the Royal Astronomical Society C© 2011 RAS


![1374 bae[1]](https://static.fdocuments.in/doc/165x107/5590c45a1a28ab9d718b45d3/1374-bae1.jpg)