Gait Speed as a Vital Sign in Geriatric Rehabilitation...0 mph 0.4 mph 0.9 mph 1.3 mph 1.8 mph 2.2...
54
Transcript of Gait Speed as a Vital Sign in Geriatric Rehabilitation...0 mph 0.4 mph 0.9 mph 1.3 mph 1.8 mph 2.2...


3

1
1.1
1.2
1.3
1.4
1.5
1.6
1.7
6-12 Teens 20s 30s 40s 50s 60s 70s >80
mete
rs/s
eco
nd
Walking Speed by Gender & Age
Female
Male
Self selected walking speed categorized by gender & age: 6-12 & teens (Waters, Lunsford et al. 1988); 20s-50s (Bohannon 1997); & 60’s-80’s (Bohannon 2008)


Vital Sign
Vital sign is: Walking speed is:

General indicator that can predict future events & reflect various underlying physiological processes (Studenski 2003)
Vital Sign


Crossing the Street
2 traffic lanes (8 m)
Critical speed: 1.14 m/sec
4 traffic lanes (16 m)
Critical speed: 1.33 m/sec

0 mph 0.4 mph 0.9 mph 1.3 mph 1.8 mph 2.2 mph 2.7 mph 3.1 mph10 meter walk 50 sec 25 sec 16.7 sec 12.5 sec 10 sec 8.3 sec 7.1 sec10 foot walk time 15.2 sec 7.6 sec 5 sec 3.8 sec 3 sec 2.5 sec 2.2 sec

10 meter walk 50 sec 25 sec 16.7 sec 12.5 sec 10 sec 8.3 sec 7.1 sec
10 foot walk time 15.2 sec 7.6 sec 5 sec 3.8 sec 3 sec 2.5 sec 2.2 sec
Red Flag: < 0.6 m/s

10 meter walk time 50 sec 25 sec 16.7 sec 12.5 sec 10 sec 8.3 sec 7.1 sec10 foot walk time 15.2 sec 7.6 sec 5 sec 3.8 sec 3 sec 2.5 sec 2.2 sec
Red Flag: < 0.6 m/s
.15 m/s

10 meter walk time 50 sec 25 sec 16.7 sec 12.5 sec 10 sec 8.3 sec 7.1 sec10 foot walk time 15.2 sec 7.6 sec 5 sec 3.8 sec 3 sec 2.5 sec 2.2 sec
Yellow Flag: 0.6 – 1.0 m/s

10 meter walk 50 sec 25 sec 16.7 sec 12.5 sec 10 sec 8.3 sec 7.1 sec10 foot walk time 15.2 sec 7.6 sec 5 sec 3.8 sec 3 sec 2.5 sec 2.2 sec
Green Flag: > 1.0 m/s

(Abellan van Kan 2009)

N= 492 elders (Studenski ,2003)
Walking speed
METS Functionm/sec mph
.67 1.5 < 2 self care
.89 2.0 2.5 household activities
1.11 2.5 3.0 carry groceries, light yard work
1.33 3.0 3.5 climb several flights of stairs

Days to Death
Perc
ent A
live
.4-.6 m/s .6-.8 m/s .8-1.0m/s 1.0-1.2m/s 1.2-1.4 m/s >1.4 m/s0-.4 m/s

Days to Death
Perc
ent A
live
90-95%
70-82%
55-60%
Percent alive at 3000
days stratified by
WS
.4-.6 m/s .6-.8 m/s .8-1.0m/s 1.0-1.2m/s 1.2-1.4 m/s >1.4 m/s0-.4 m/s3000 days=
8.5 years

Improved at 1 year 31.6%Transient improvement 41.2%
Never improved 49.3%
Hardy 2007
0.1m/s improvement in WS
in 1 year

Hardy 2007
70%
60%
50%
Improved at 1 yearTransient improvementNever improved
GAINS in Walking speed predicts……9 year mortality
0.1m/s improvement in WS
in 1 year

Walking Speed Predicts…
…1 year health outcomes
Studenski 2003
0
10
20
30
40
50
60
70
80
iADL Global Health HRQ0L
>1.0 m/sec 0.6-1.0 m/sec <0.6 m/sec
Decline from Baseline to 1 year
% P
opu
lation
% patient declines in one year
stratified by WS


Measurement of Walking Speed

Test-retest reliability coefficients reported in the literature range from:
0.929 (Evans 1997) to 0.97 (Stephens 1999)


safe
cost effective
easy
interpreted
Feasibility of Tests Walking Speed

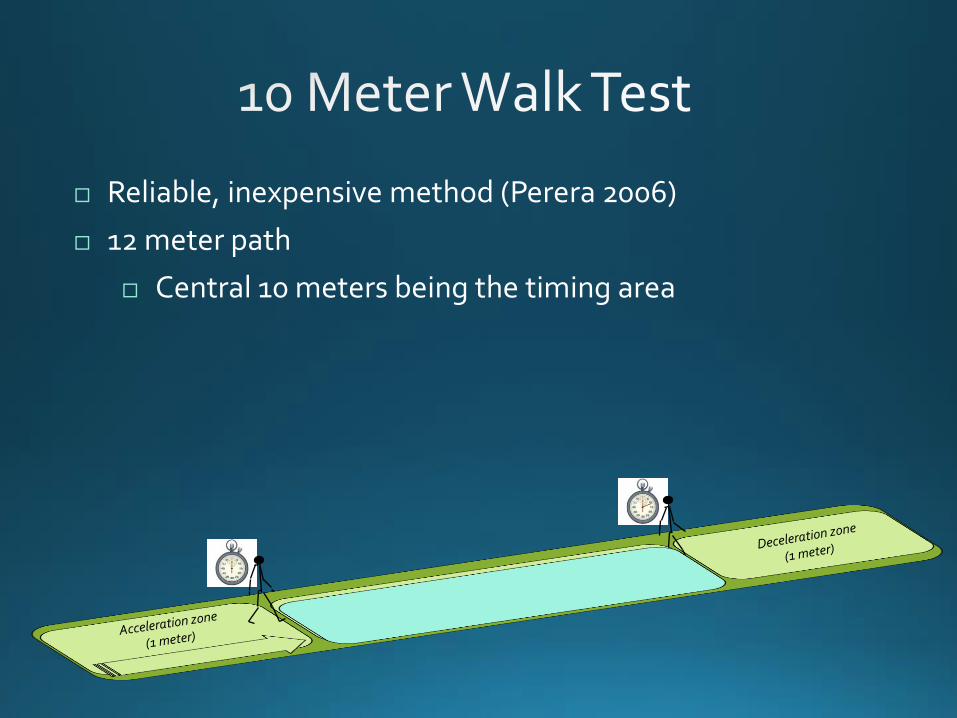
Reliable, inexpensive method (Perera 2006)
12 meter path
Central 10 meters being the timing area

Reliable
Recommended as most feasible
6 meter path
Central 4 meters being the timing area

Time to complete = meters per second
3 seconds 1.3 m/s
4 seconds 1.0 m/s
5 seconds 0.8 m/s
6.7 seconds 0.6 m/s
Quick Gait Speed Test

1.0 m/s

•
•
True change vs. measurement error Change of 0.1 m/s is predictor
Use a change
of 0.1m/s for
patient goals

Initial Examination Reassessment
IS THIS A MEANINGFUL CHANGE?
Mean difference:
WSreassess –WSinitial = 0.23 m/s
WSMDC = 0.10 m/s
Interpretation of Walking Speed (WS)


Walking Speed IS THE Vital Sign for Function
DANGER
WARNING
COMMUNITY Ambulator