Gains from Trade: Can they be Equitable? - mse.ac.in · #1a: What do we know? •In Krugman-type...
24
Gains from Trade: Can they be Equitable? Gopi Munisamy Director, Market and Trade Economics Division USDA-Economic Research Service Seminar at Madras School of Economics March 7, 2018 Views expressed here are the author’s and should not be attributed to USDA or ERS
Transcript of Gains from Trade: Can they be Equitable? - mse.ac.in · #1a: What do we know? •In Krugman-type...

Gains from Trade: Can they be Equitable?
Gopi MunisamyDirector, Market and Trade Economics Division
USDA-Economic Research Service
Seminar at Madras School of EconomicsMarch 7, 2018
Views expressed here are the author’s and should not be attributed to USDA or ERS
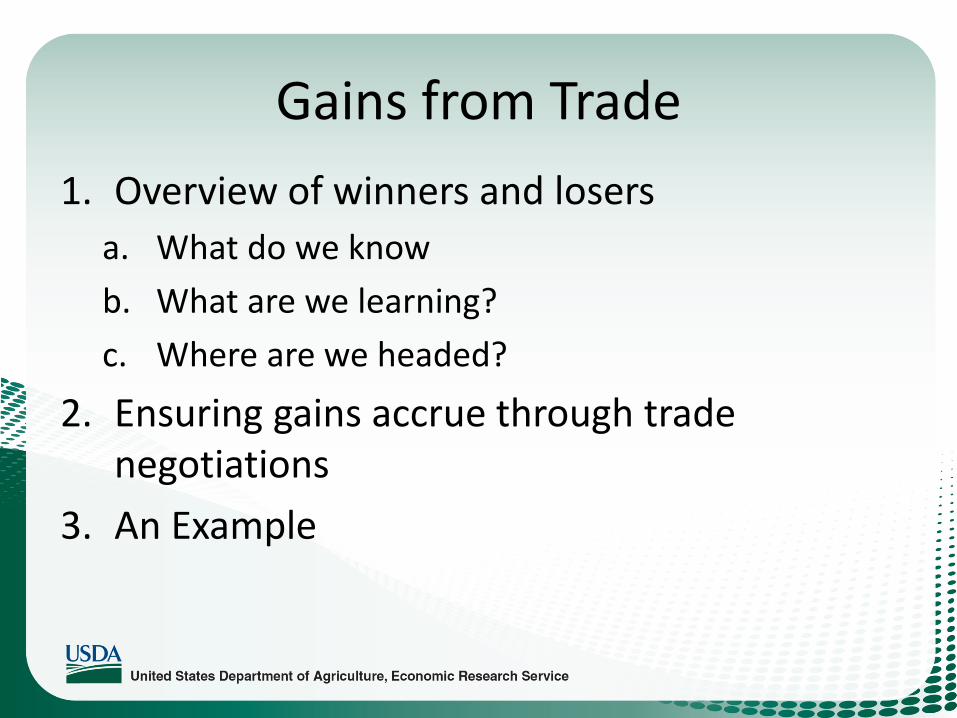
Gains from Trade
1. Overview of winners and losers
a. What do we know
b. What are we learning?
c. Where are we headed?
2. Ensuring gains accrue through trade negotiations
3. An Example

#1a: What do we know?• In basic models (Ricardian), trade arises from relative
productivity differences across countries. Upon free trade, GDP increases, complete specialization occurs, full employment is maintained and wages (for all) increase; consumption increases as well.– Can also be found in much earlier Hindu and Chinese literature
• In neoclassical models, trade is determined by relative factor endowments. Moving from autarky to free trade means GDP increases along with specialization in the good with comparative advantage, full employment occurs again, and returns to abundant factor increase (Heckscher-Ohlin). Again, consumers are on a higher indifference curve relative to autarky.
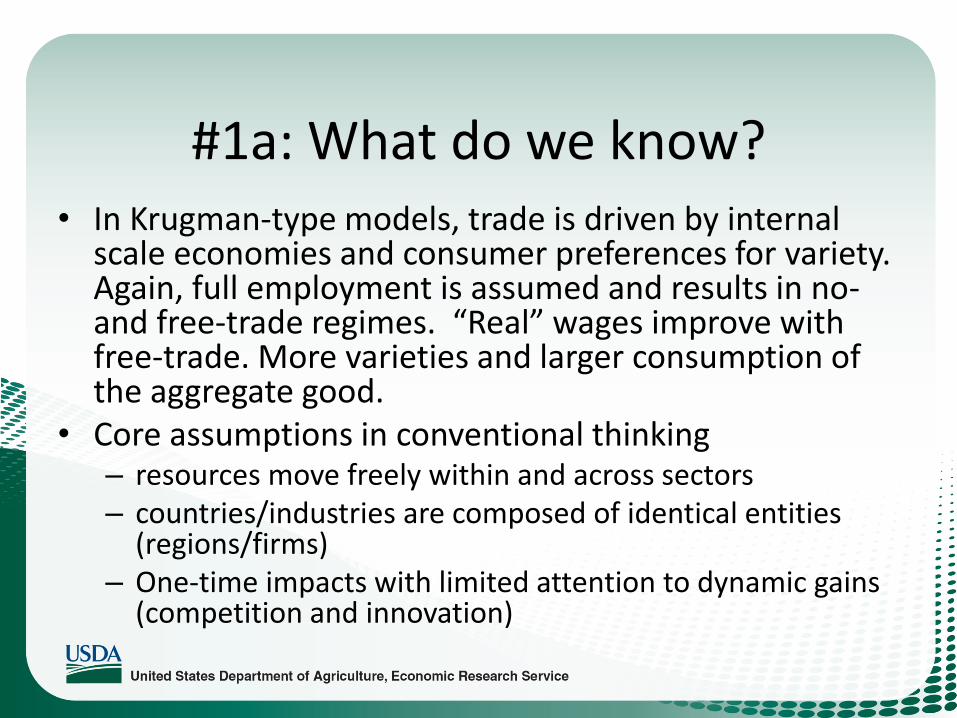
#1a: What do we know? • In Krugman-type models, trade is driven by internal
scale economies and consumer preferences for variety. Again, full employment is assumed and results in no-and free-trade regimes. “Real” wages improve with free-trade. More varieties and larger consumption of the aggregate good.
• Core assumptions in conventional thinking– resources move freely within and across sectors – countries/industries are composed of identical entities
(regions/firms)– One-time impacts with limited attention to dynamic gains
(competition and innovation)

#1b: What we are learning?• While productivity, factor endowments, scale
economies and variety preferences are all sources of trade, identification of trade’s winners and losers require attention to– Within sector or industry effects – Melitz
• Losers within an industry – some firms die, while others enter or expand
• Multi-product firms – product extensive and intensive margins
– Within country (i.e. regional) effects – new economic geography (e.g. Krugman)• Which regions gain or lose firms and employment?• Impact on regional development outcomes: wages, quality of life

#1c: Where are we headed?• We have the ability to go from national and sectoral
outcomes to regional (within-country) outcomes following trade. However, we need to broaden the scope:– Short-term impact evaluation; missing are counterfactuals such
as “what if no trade had occurred between U.S. and China (or India)?” and long-term assessment of consequences
– full-employment models, hampering our ability to inform the critical question on trade and wages/employment (Head and Larch, JIE 2016)
– Sectors and aggregates with little attention to supply chains, off-shoring and break-up of production processes, and investment
• Hopeful that emerging advances in data, methods and computational capabilities can fill the gaps.

#2: Ensuring Gains Accrue and Losses are Mitigated?
• By focusing on gains from trade within a country (regions) and industry, we stand a better chance of trade reform:
– You need votes in U.S. Congress or European or Indian parliament constituted by regional representatives.
– Focus on resources specific to regions/industries and their cost of adjustment
• safety nets that account for such adjustment costs
• Improve communication of trade outcomes– Role of technological change, skill upgrading
• Static policies reduce uncertainty, but need a balance between anticipated outcomes and lowering risk

#2 Bilateral vs. multilateral agreements
• As we focus on within-country and –industry effects, opportunities may arise in the bilateral or multilateral context for trade reform:
– A rich literature has explored the merits of bilateral vs. multilateral agreements and whether or not global reform can be achieved one pair at a time.
– Bilateral agreements are more attractive
• Can include TRIPs, TRIMs, offshoring and services
– but, they cannot be beneficial without multilateral (WTO) disciplines, especially non-discrimination (aka MFN status) and reciprocity: Baldwin (2016)
– Bilaterals require lot more human capital

#3 An Example
• It is the job of researchers and policy analysts to investigate and effectively communicate gains from trade (globalization in general) for use in negotiations, drafting policies/agreements and evaluating impact.– Hope to demonstrate it with the following example
• Market Impacts of China and India Meeting Biofuel Targets Using Traditional Feedstocks– By Beckman, Gooch, Gopinath and Landes
– Biomass and BioEnergy, 2018, Volume 108, pp.258-264.

Context: Energy and GHG Emissions
• A major source of emissions is transportation: fossil fuels
• Alternative to fossil fuels: solar, wind, wave, geothermal
• Many require substantial upfront or fixed costs
• Short-term options include blending biofuel to fossil fuels
• Paris agreement: self-chosen targets include both short- and medium-term options

Context: China and India
• Large, fast-growing transport fleets and fuel demand
• Land and water resources are limited for massive expansion of feedstock production for biofuels
• Current regulations – little to no competition between food and biofuel
feedstock production (China - no arable land for feedstock production; India - domestic production from molasses only)
– Trade policies (tariffs, use limitations)
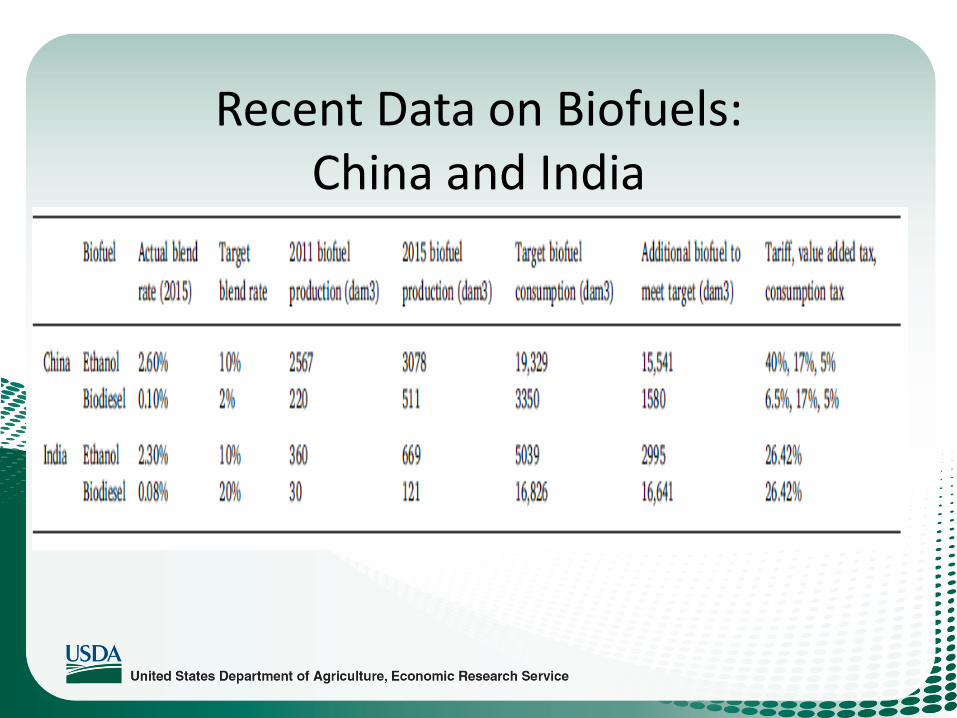
Recent Data on Biofuels: China and India

A CGE Model
• GTAP-Energy model with 2011 baseline
• Calibrated to 2020
• Consider four scenarios to achieve blending targets– Status quo
– Eliminate domestic regulations
– Alternative feedstocks (short-term again!)
– Trade policy change

Results • Scenario 1: status quo but meet blending targets
– Production needs to increase dramatically (grains 20% in China; vegetable oil by 156% in India)
– Significant price increases for food commodities– Trade volumes increase due to displacement
• Scenario 2: remove domestic regulations– Similar to scenario 1 (ethanol has the largest impact on
China and biodiesel on India)– Sugarcane production is largely irrigated. Without
additional water resource, relaxing the restriction on sugar juice uses doesn’t significantly alter the outcomes

Results (contd.)• Scenario 3: alternative feedstocks
– We are years away from 2nd and 3rd generation feedstock technology
– Wasted cooking oil for biodiesel? (Moldy) Stockpiles of maize in China?
– China made substantial progress, but prohibitive costs and sale limitations have slowed down this prospect• Good use of rotting grain stocks!
– India• Lowers vegetable oil production increases to 80 percent• Major challenges in implementing this strategy! • Positive health externalities
Scenario 4
• Scenarios 1-3 rely on domestic resources, which are severely constrained (more land, water and labor in rural areas?)• Continue to stress physical and economic environments
(negative externalities)
• How about a trade scenario?– What if we lowered import tariffs and regulations?– Turns out, as expected, we don’t have to produce as
much feedstocks as required in scenarios 1-3. Also, prices of food commodities don’t go up as much as in scenarios 1-3.

Win-Win Strategies?
• Foreign investment and trade in biofuels as well as tapping wasted cooking oil
– Lower emissions (mitigate cancer/type II diabetes incidence) and improve quality of life
– Biofuels are blended at point of use (cities)
• Foreign investment in blending infrastructure can create jobs
• Domestic industry adversely affected? Some upstream or downstream segments?

Contents lists available at ScienceDirect
Biomass and Bioenergy
journal homepage: www.elsevier.com/locate/biombioe
Research paper
Market impacts of China and India meeting biofuel targets using traditionalfeedstocks☆
Jayson Beckman∗, Elizabeth Gooch, Munisamy Gopinath, Maurice LandesEconomic Research Service, U.S. Department of Agriculture, United States
A R T I C L E I N F O
Keywords:CGEIndiaChinaTradeEthanolBiodiesel
A B S T R A C T
Biofuel production has largely occurred in Brazil, the European Union (EU), and the United States (U.S.), butseveral other countries have articulated large biofuel targets. Among them, China and India stand out with largepopulations, with a prominent food versus fuel debate. Recent research has recognized the importance of bio-fuels in replacing traditional transportation fuels in these two countries; but such work has largely consideredunconventional pathways such as lignocellulosic feedstocks. This work takes a more straight-forward approach,using a computable general equilibrium (CGE) model to estimate the market impacts of achieving biofuel targetsin 2020. Along with projections in food and fuel demand to 2020, we also consider several options in meetingbiofuel targets. China's biofuel policy focuses on ethanol, and the result of meeting a 10 percent ethanol blendtarget, along with food and feed demand, is an increase in coarse grain production of 19 percent. India's largestpotential biofuel component is biodiesel, where reaching a 20 percent target would entail a triple-digit increasein vegetable oil production. Results indicate that these impacts could be somewhat mediated if biofuel tradeaccess is increased; in addition, utilizing stockpiled grain in China, or implementation of an effective wastecooking oil collection-to-biodiesel program in either country could substantially reduce agricultural feedstockrequirements.
1. Introduction
Biofuels produced from lignocellulosic feedstocks, i.e., non-food/feed sources, remains the ultimate goal of providing green energy;however, the economic feasibility of large-scale production of suchfeedstocks remains a significant challenge. In the near future, biofuelsproduced from feedstocks that compete with other food and feed usesremains the only viable option. Countries have signaled in their in-tended national determined contributions (INDC) that biofuels are anoption to reduce greenhouse gas (GHG) emissions from transportation.However, a collision between the fuel and food/feed demand satisfac-tion is highly likely for some of the countries of the Paris Agreement.
China and India are two key ‘food versus fuel’ examples, whereambitious biofuel targets collide with the need to feed over a billionpeople each. In addition, both countries have rapidly expanding fuelfleets, with projections for transport fuels doubling for India by 2026[1]. However, biofuel production growth has been slow, both countrieshave actual biofuel blend rates of less than 2 percent. One reason for theslow growth in biofuel production is that they both have rules to limitcompetition with food uses. For example, China has removed policy
support for grain-based ethanol, mandating that biofuel feedstocks notcompete with feedstocks intended for human or animal consumption[2]. India restricts feedstock use for biofuels, such as prohibiting the useof sugar-cane juice for ethanol production. The pledges made by Chinaand India in the Paris Agreement could, however, push them to focusmore on biofuel strategies. China [3] notes that they will proactivelydevelop bioenergy. India's INDC [4] notes the national policy on bio-fuels is a 20 percent blending rate for both biodiesel and ethanol.
Some studies have explored unconventional ways (i.e., lig-nocellulosic ethanol or feedstocks grown on marginal land) for thesecountries to meet their targets. Wang and Shi [5] investigate the op-timal utilization of marginal land for biofuels in a province in China;Qui et al. [6] provides information on the feasibility and geographicallocation of lignocellulosic feedstocks in China. For India, Sasmal et al.[7] considered the potential of non-conventional biomass in North-EastIndia; Lavanya et al. [8] conducted a study to identify high yieldingcastor that could be used for biodiesel. The scope of these newer op-portunities to help meet biofuel target of these two countries remainslimited, similar to the situation in Brazil, EU and U.S. Moreover, fewstudies have examined how meeting 2020 targets with unconventional
https://doi.org/10.1016/j.biombioe.2017.11.018Received 18 February 2017; Received in revised form 18 November 2017; Accepted 22 November 2017
☆ The views expressed here are solely the authors' and do not necessarily reflect USDA or ERS.∗ Corresponding author.E-mail address: [email protected] (J. Beckman).
Biomass and Bioenergy 108 (2018) 258–264
0961-9534/ Published by Elsevier Ltd.
T

and/or traditional feedstocks will impact domestic and global food andfeed markets. In addition to the desire to lower GHG emissions, therules limiting competition between food and fuel uses, and limited in-frastructure for lignocellulosic feedstocks raise serious doubts on thesecountries ability to achieve targets pledged under the Paris agreement.
In this study, we use a computable general equilibrium (CGE) modelto analyze each country meeting their biofuel targets, focusing oncommodity price impacts for domestic and global consumers, as well asshifts in global trade patterns. An examination of each countries' biofuelproduction, feedstocks used, and trade provides information on addi-tional options to meet their targets. These are grouped into four cate-gories: reconsidering restrictions on ethanol feedstocks, an expansion ofethanol feedstocks, an expansion of biodiesel feedstocks, and a reduc-tion in trade barriers. The market impacts of each scenario are verylarge and the size of the adjustments to supply, demand, and prices iswell outside the range of the historical data; thus, the focus here is onchanges in magnitude across scenarios to help evaluate the feasibility ofthe adjustments that may be needed to meet the policy targets.
2. Background
With tremendous growth in production, biofuels have become amajor source of energy in several countries. Major producers includeBrazil, the EU, and U.S., however, each of these regions have reducedtheir mandates at some point in the last five years [9]. As such, othercountries might be good candidates to provide future growth. Becauseof the amount of transportation fuels they consume, the biofuel targetsset out by China and India are two of the more interesting cases. Inaddition, having the largest and second-largest populations makes thefood versus fuel argument a relevant theme in their energy policy.
2.1. China
China is currently the third largest producer of ethanol in the world;in addition, biofuels are a part of China's long run energy plan.However, policies encouraging or mandating the production of biofuelsfrequently change. In early 2000, China implemented an ethanol pro-gram in response to abundant grain supplies [2]. However, the rapidincrease in commodity prices (and commodity price volatility) in 2007and 2011 triggered several changes to the biofuel program. For ex-ample, policy now dictates that biofuel production should not use cropsintended for human or animal consumption. As part of their 12th FiveYear plan (FYP), which ended in 2015, China set a target of producing4.5 hm3 of ethanol and 1.1 hm3 of biodiesel; however, only the bio-diesel target was reached. China's 13th FYP (2016–2021) increasesthose targets. By 2020, China targets the production of 6.3 hm3 ofethanol and 2.3 hm3 of biodiesel annually. These targets imply a 100percent expansion of its production capacity of ethanol over the fiveyears and even larger development of biodiesel production [2].
2.1.1. EthanolAlthough China has not met its ethanol production target, produc-
tion has increased from 1.7 hm3 in 2006 to 3.7 hm3 in 2015 (Fig. 1).There are three avenues through which this expansion took place: (1)more refineries, (2) of these refineries, a number of the new ones were1.5 generation (non-grain based feedstocks) and 2nd generation (lig-nocellulosic) technologies which received subsidies, and (3) each re-finery increased their operating capacity. The driver of this increasedproduction was increased demand [2]. Ethanol blend targets have in-creased in 2016, though a national mandate has yet to be implemented.As of 2016, a total of 10 provinces and a number of municipalities useE10 blending zones which is up from 6 provinces since 2015. Duringlate 2015 to the middle of 2016, the largest fuel consumption regionswere Guangdong, Jiangsu, and Hainan provinces and Beijing andTianjin cities [2].
Although China has tried to move away from using feedstocks that
could compete for food uses, corn and wheat remain the largest inputsources for ethanol (Table 1). Combined, the two feedstocks accountedfor 80 percent of ethanol inputs in 2015. The supply of Chinese corn,however, is exposed to a number of regulations and current events.Corn destined for fuel production cannot be grown on arable land;therefore, the corn used in ethanol production has been limited to theharvest from marginal lands within China. In 2014, China began toimport ethanol for the first time. Imports were cheaper than domes-tically produced ethanol in 2015 (470 $ m3 versus 620 $ per m3). Im-ported ethanol is primarily used for fuel and is monitored by the gov-ernment. With the pending increase in domestic demand for ethanol,increased imports may become inevitable [10]. For the work here, weonly consider China's use of current, 1st generation feedstocks.
2.1.2. BiodieselBetween 2010 and 2014, Chinese biodiesel production grew around
16 percent spurred by fiscal incentives and the crackdown of the illegaluse of waste cooking oil for human consumption. Production reachedaround 1.1 hm3 in 2014 before it collapsed by more than 50 percent in2015 (Fig. 1) due to consumer complaints over fuel quality and a de-cision by oil companies to curtail purchase of used cooking oil [2].
By 2015, nearly all biodiesel was made from waste cooking oil.However, in 2015, the two major Chinese oil companies, Sinopec andCNOOC, stopped buying biodiesel for two reasons: (1) the biodiesel is ofpoor quality and (2) it has a high cost. Because of the withdrawal of themain consumers of biodiesel, producers of biodiesel have also with-drawn from the marketplace [11]. Capacity is estimated to be at 3.8hm3; however, the utilization rate is 27 percent due to the lack of largescale collection channels for waste cooking oil. By the end of 2015,there are only 31 biodiesel plants leftover from the peak of 84 in 2008,but more than one third of these 31 producers have either ceasedproduction or operate well under capacity. Part of the difficulty in ex-panding biodiesel production in China is that state owned oil companiesblock biodiesel from being sold to most consumers. As a result mostbiodiesel is sold at private gas stations in small cities or in the countryside [2]. Since 2012, China has imported biodiesel to help meet do-mestic consumption, almost all these imports have been from In-donesia. These imports were substantial in 2013 and 2014 (note thedifference in production and consumption in Fig. 1); however, 2015imports were small. Biodiesel is only approved for fuel use in selectcities [2].
2.2. India
The Government of India (GOI) proposes to reduce its dependenceon crude oil imports by ten percentage points in several ways: in-creasing domestic output; promoting energy efficiency and
Fig. 1. China biofuel production and consumption.Source: [2].
J. Beckman et al. Biomass and Bioenergy 108 (2018) 258–264
259

conservation; and encouraging greater use of alternative fuels [4].However, most of their efforts to increase biofuel production have notpanned out. Ethanol consumption has increased, but biodiesel con-sumption has rested on the hopes of using industrial vegetable oils.
2.2.1. EthanolIndia's ethanol program currently “mandates” a 5 percent blend rate
for gasoline, with the Government considering an increase to 10 per-cent. Actual blending has never reached the targeted rate because ofinadequate domestic supplies, inadequate price incentives for ethanolproducers and blenders, and a requirement that fuel ethanol, as op-posed to ethanol destined for industrial or chemical use, be suppliedfrom domestic sources. In 2015, India produced 2.1 hm3 of ethanol,with 609 dam3 used for fuel (the rest was used for industrial purposes),for a blending rate of about 2 percent of total gasoline consumption.This was an increase from an average of 344 dam3 during 2012-14(Fig. 2), resulting in increased demand for ethanol imports for nonfueluses. Ethanol imports, which are subject to a 2.5 percent tariff, reached450 dam3 in 2015 [1]. India exports relatively small amounts ofethanol.
India's ethanol is produced almost exclusively from molasses that isa co-product of domestically produced cane sugar, of which India is thesecond largest global producer (after Brazil) and a variable net trader.Production of molasses and ethanol are linked closely to production ofsugarcane, which is cyclical. Cycles are created primarily by pricesupport policies for sugarcane that require sugar mills to pay growersbased on costs of production rather than price conditions in the sugarand byproduct markets [13]. Although most (94 percent) sugarcane is
irrigated [14], abnormally dry weather that limits irrigation watersupplies can also be a source of variation in yields and production insome areas.
A key implication of India's current requirement that ethanol beproduced from molasses rather than directly from sugarcane juice isthat expansion of ethanol production can only occur to the extent thatthe associated sugar production can be efficiently disposed of in do-mestic and global markets. Meeting either a 5- or 10-percent ethanolblend target from molasses would appear to entail unrealistic gains inIndian sugar consumption and exports, and declines in sugar prices.
2.2.2. BiodieselBiodiesel is a significantly more nascent industry in India than
ethanol but, because of the much greater role of diesel as a motor fuel inIndia, may have greater potential to mitigate GHG emissions. India isthe world's third largest consumer of edible oils (after China and theEU), but these edible oils are not used to produce biodiesel [1]. Effortsto expand production of industrial vegetable oils, such as jatropha, foruse in biodiesel have met with very little success over 20-plus years offield trials. Only 136 dam3 of biodiesel were produced in 2015, for ablending rate less than a tenth of a percent. There are 6 refineriescapable of producing around 473 dam3 of biodiesel; however, capacityutilization has never been above 30 percent [1]. In addition, the cost ofbiodiesel production is found to be 20 to 50 percent more expensivethan the set purchase price established by the government [15].
Biodiesel prices are market-determined and, with the decontrol ofdiesel fuel prices implemented in October 2014, diesel prices are nowalso set in the market. Assuming that decontrol remains in effect ifworld oil prices return to higher levels, this measure may create moreincentive to produce and use biodiesel when market prices rise [1].Prior to decontrol, incentives for biodiesel production were limitedbecause biodiesel costs were typically higher than those for diesel fuel.Biodiesel imports are currently made economically unviable by a 26.42percent tariff.
3. CGE model
Given the complex links and interactions between agriculturalcommodities, competition among these commodities for limited eco-nomic resources, as well as interactions between the production, con-sumption, and trade activities, an economy-wide CGE modeling ap-proach provides an appropriate framework to analyze the impacts ofbiofuel policies. For this work we begin with the model built in Ref.[16], adding to it the necessary components to model the alternativebiofuel scenarios (as noted in each section below). In addition, we use
Table 1Annual feedstocks for China and India biofuel production.Source: [1] and [2].
Feedstocks (1000 Gg) 2006 2007 2008 2009 2010 2011 2012 2013 2014 2015
China EthanolCorn 3233 3385 3608 3614 3641 3645 3563 3389 3381 3570Wheat 1050 1050 1050 1050 1050 1050 1050 1050 1050 1050Sorghum 0 0 0 0 0 0 0 0 90 360Cassava 0 0 364 467 392 336 336 392 504 504Corn cobs 0 0 0 0 0 0 0 240 250 260BiodieselWCO 267 344 522 578 556 722 889 1055 1108 512
India EthanolMolasses 417 208 1521 1271 1592 1458 2854BiodieselWCO 35 38 42 48 50 55 60Animal fats 3 6 6 7 7 6 5Other oils 30 50 58 60 65 65 70
Note: WCO is waste cooking oil.
Fig. 2. India biofuel production and consumption.Source: [1].
J. Beckman et al. Biomass and Bioenergy 108 (2018) 258–264
260
the most recent Global Trade Analysis Project (GTAP) database (set to2011), splitting biofuels into three types: grain-based ethanol, sugar-based ethanol, and biodiesel. Note that India's ethanol production willbe from all sugar, based on these modeling assumptions. See the sup-plementary material for more explanation of the model.
Because biofuel production in China and India has increased since2011, we conduct an updating procedure to bring the model to 2015.Another important change since 2011 is the decrease in global oilprices, which alters the incentives for biofuel production. In addition,we update agricultural commodity prices used for biofuel feedstocks.The updating procedure follows the approach by Ref. [17], who showthat by shocking population, labor supply, capital, investment andproductivity changes, along with the relevant energy price and biofuelpolicy shocks, the resulting equilibrium offers a reasonable approx-imation to key features of the more recent economy. Actual, historicalchanges are provided by the literature for population, GDP, and com-modity prices changes. Updates to labor supply, capital, investment,and productivity are calculated based on [18]. See Table 2 for theexogenous shocks used to update the model.
3.1. Scenarios
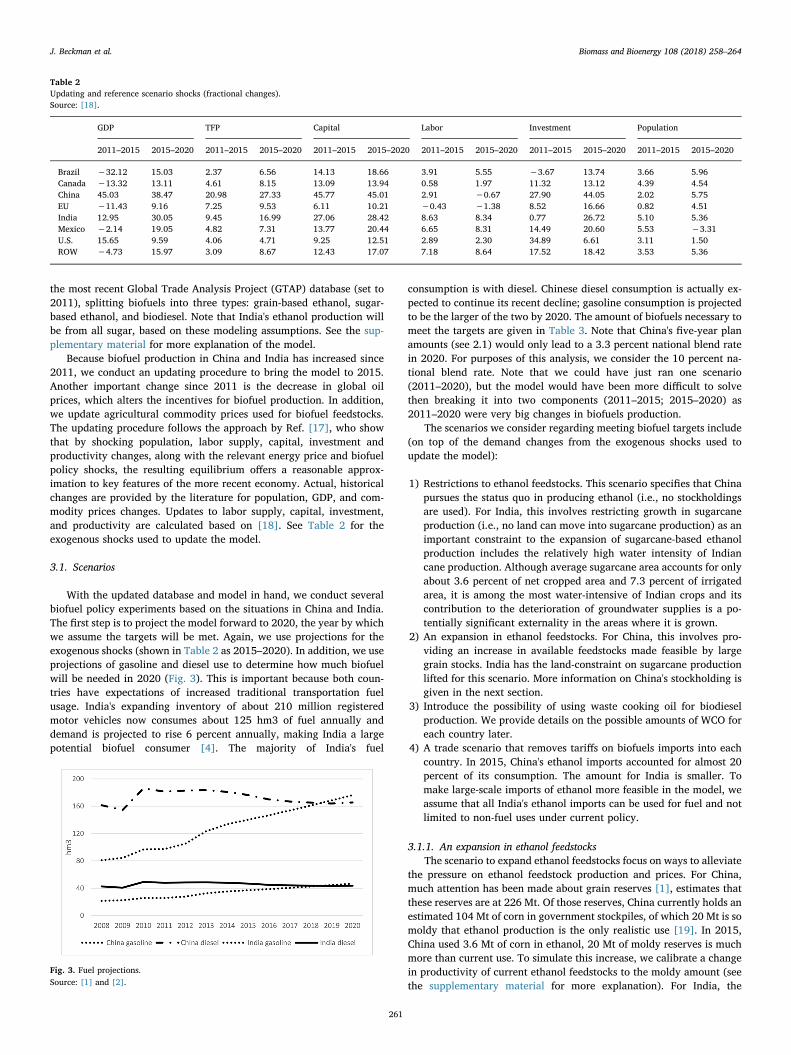
With the updated database and model in hand, we conduct severalbiofuel policy experiments based on the situations in China and India.The first step is to project the model forward to 2020, the year by whichwe assume the targets will be met. Again, we use projections for theexogenous shocks (shown in Table 2 as 2015–2020). In addition, we useprojections of gasoline and diesel use to determine how much biofuelwill be needed in 2020 (Fig. 3). This is important because both coun-tries have expectations of increased traditional transportation fuelusage. India's expanding inventory of about 210 million registeredmotor vehicles now consumes about 125 hm3 of fuel annually anddemand is projected to rise 6 percent annually, making India a largepotential biofuel consumer [4]. The majority of India's fuel
consumption is with diesel. Chinese diesel consumption is actually ex-pected to continue its recent decline; gasoline consumption is projectedto be the larger of the two by 2020. The amount of biofuels necessary tomeet the targets are given in Table 3. Note that China's five-year planamounts (see 2.1) would only lead to a 3.3 percent national blend ratein 2020. For purposes of this analysis, we consider the 10 percent na-tional blend rate. Note that we could have just ran one scenario(2011–2020), but the model would have been more difficult to solvethen breaking it into two components (2011–2015; 2015–2020) as2011–2020 were very big changes in biofuels production.
The scenarios we consider regarding meeting biofuel targets include(on top of the demand changes from the exogenous shocks used toupdate the model):
1) Restrictions to ethanol feedstocks. This scenario specifies that Chinapursues the status quo in producing ethanol (i.e., no stockholdingsare used). For India, this involves restricting growth in sugarcaneproduction (i.e., no land can move into sugarcane production) as animportant constraint to the expansion of sugarcane-based ethanolproduction includes the relatively high water intensity of Indiancane production. Although average sugarcane area accounts for onlyabout 3.6 percent of net cropped area and 7.3 percent of irrigatedarea, it is among the most water-intensive of Indian crops and itscontribution to the deterioration of groundwater supplies is a po-tentially significant externality in the areas where it is grown.
2) An expansion in ethanol feedstocks. For China, this involves pro-viding an increase in available feedstocks made feasible by largegrain stocks. India has the land-constraint on sugarcane productionlifted for this scenario. More information on China's stockholding isgiven in the next section.
3) Introduce the possibility of using waste cooking oil for biodieselproduction. We provide details on the possible amounts of WCO foreach country later.
4) A trade scenario that removes tariffs on biofuels imports into eachcountry. In 2015, China's ethanol imports accounted for almost 20percent of its consumption. The amount for India is smaller. Tomake large-scale imports of ethanol more feasible in the model, weassume that all India's ethanol imports can be used for fuel and notlimited to non-fuel uses under current policy.
3.1.1. An expansion in ethanol feedstocksThe scenario to expand ethanol feedstocks focus on ways to alleviate
the pressure on ethanol feedstock production and prices. For China,much attention has been made about grain reserves [1], estimates thatthese reserves are at 226 Mt. Of those reserves, China currently holds anestimated 104 Mt of corn in government stockpiles, of which 20 Mt is somoldy that ethanol production is the only realistic use [19]. In 2015,China used 3.6 Mt of corn in ethanol, 20 Mt of moldy reserves is muchmore than current use. To simulate this increase, we calibrate a changein productivity of current ethanol feedstocks to the moldy amount (seethe supplementary material for more explanation). For India, the
Table 2Updating and reference scenario shocks (fractional changes).Source: [18].
GDP TFP Capital Labor Investment Population
2011–2015 2015–2020 2011–2015 2015–2020 2011–2015 2015–2020 2011–2015 2015–2020 2011–2015 2015–2020 2011–2015 2015–2020
Brazil −32.12 15.03 2.37 6.56 14.13 18.66 3.91 5.55 −3.67 13.74 3.66 5.96Canada −13.32 13.11 4.61 8.15 13.09 13.94 0.58 1.97 11.32 13.12 4.39 4.54China 45.03 38.47 20.98 27.33 45.77 45.01 2.91 −0.67 27.90 44.05 2.02 5.75EU −11.43 9.16 7.25 9.53 6.11 10.21 −0.43 −1.38 8.52 16.66 0.82 4.51India 12.95 30.05 9.45 16.99 27.06 28.42 8.63 8.34 0.77 26.72 5.10 5.36Mexico −2.14 19.05 4.82 7.31 13.77 20.44 6.65 8.31 14.49 20.60 5.53 −3.31U.S. 15.65 9.59 4.06 4.71 9.25 12.51 2.89 2.30 34.89 6.61 3.11 1.50ROW −4.73 15.97 3.09 8.67 12.43 17.07 7.18 8.64 17.52 18.42 3.53 5.36
Fig. 3. Fuel projections.Source: [1] and [2].
J. Beckman et al. Biomass and Bioenergy 108 (2018) 258–264
261

restriction on the amount of land allocated for sugarcane production islifted in this scenario.
3.1.2. Biodiesel feedstocksFor biodiesel, waste cooking oil is an oil-based substance consisting
of edible vegetable matter that has been used in the preparation offoods and is no longer suitable for human consumption. WCO has beenused as an ingredient in animal feed in some countries as well as aninput into soap and other industries [20]. As noted by Zhang et al. [21],converting WCO into biodiesel represents a three-win solution, dealingsimultaneously with food security, environmental issues, and energysecurity. As pointed out in Kalam et al. [22], disposing of WCO intodrains or sewers leads to blockages, and if dumped in municipal solidwaste landfills or into municipal sewage treatment plants it createsoperation problems along with pollution of water and soil.
The scope for waste cooking oil is not known with certainty, but ifsignificant amounts of waste cooking oil can be recycled as biodiesel,substitute for some share of petroleum imports, and also reduce GHGemissions, WCO could be a win-win-win outcome. While much of theedible oil used by households and small-scale enterprises may not beaccessible for recycling, that used by restaurants and commercial pro-cessors might be available for recycling as biodiesel. We simulate theuse of waste cooking oil for biodiesel production based on our calcu-lations for available feedstocks. See the supporting material for moreinformation on how we arrive at the estimates of waste cooking oilavailability.
4. Results
As discussed previously, we project the database forward to 2020 byproviding updates to demand and supply forces. Results are presentedfor China, India, and the Rest of the World; detailed results for otheragricultural commodities or regions (Brazil, Canada, the EU, Mexico,and the U.S. are disaggregated in the database) are available upon re-quest. Emission reductions from replacing traditional transportationfuels with biofuels will be the same across all scenarios (since eachcountry is meeting a consumption target), thus the focus of the results ison changes to production, prices, and trade of biofuels and their mainfeedstocks.
4.1. Restrictions to ethanol feedstocks
This scenario fulfills the biofuel targets assuming the status quo inChina, while restricting the amount of land that can be used for su-garcane production in India. For China, the imposition of the 10 percentethanol target leads to an increase in ethanol production (Table 4), asproduction increases from 3.1 hm3 to 17.4 hm3. China imports a por-tion of ethanol consumption (1.8 hm3), but ultimately the largest in-crease is in domestic production. This increase in ethanol productionleads to an increase in the domestic price of ethanol of 31 percent.Although China was the 3rd largest producer of ethanol in 2015, theirproduction was only about 3 percent of global production. Assumingglobal production stays the same, China's share would be much larger(16 percent) in 2020; thus their increase in ethanol price transmits to
global prices (19 percent). To produce more ethanol requires additionalfeedstocks, coarse grain production increases by 19 percent. Table 4indicates that the demand changes from the exogenous shocks leads toan increase in coarse grains production of almost 12 percent. Thuswhen combined with biofuel targets, the population and incomechanges are responsible for the largest share of feedstock changes (63percent). The price of coarse grains increases in the ROW, but thischange is less than that for China. Much of the increase in the ROWcoarse grain price is embedded in the demand shocks. That is, the priceincreases by 48 percent with exogenous shocks and 57 percent whenbiofuel targets are added. Biodiesel production in China increases aswell to meet their target; in addition, their production of the feedstock(vegetable oil) also increases. The 15 percent increase is greater thanthe increase from the demand shocks (9 percent), even though thebiodiesel target is only 2 percent.
For India, ethanol production increases by 1235 percent to meettheir 10 percent target. Restricting the amount of land for sugarcaneleads to a small increase in sugarcane production, as there is still anincrease due to the agricultural productivity shocks from the 2020projection. Because ethanol production must occur, the amount of su-garcane allocated to the ethanol sector increases and the amount ofsugarcane used for most other activities decreases. The largest users ofsugar in India are the processed food industries and beverages and to-bacco, these sectors have a positive increase in use (due to the demandprojections) but all other sectors have a decrease. In addition, there is alarge decrease in exports of processed sugar in India of 67 percent inthis scenario. For reference, there was a reduction in sugar exports dueto the demand projections of 21 percent. The biodiesel target is evenlarger than that for ethanol (and base biodiesel production is smaller),biodiesel production in India increases by almost 15,000 percent. Thisdictates that a lot of resources must be reallocated to the vegetable oilsector, production increases by 156 percent. This pushes up vegetableoil prices in India. With the exogenous shocks only, prices increase by32 percent, with the mandate they increase by 165 percent. This, andthe increase in food demand from the exogenous shocks, leads to in-creases in food prices in India that are much larger than those for anyother country. China and India are the two largest importers of vege-table oils, but there is a reduction in vegetable oil imports for Chinacompared to the exogenous shocks as all vegetable oils used for bio-diesel production are domestically sourced. On the other hand, Indiahas a large increase in imports from meeting the biodiesel target.
4.2. Increasing ethanol feedstocks
The work from the supplementary material indicates that moldyfeedstocks could supplant 13 percent of the coarse grains need to pro-duce ethanol in China. The ethanol restriction scenario led to an in-crease in coarse grains production of 19 percent, or an increase of 7percent compared to the demand projections. Now, coarse grains pro-duction increases 18 percent. This increase in feedstock availabilityputs less pressure on prices and also results in less imports of coarsegrains into China. If we had used the entire stock of corn reserves toproduce ethanol, the amount of feedstocks necessary would have beeneven less. However, whether it is only the moldy reserves or the entire
Table 3Model scenarios.Source: [1] and [2].
Biofuel Actual blendrate (2015)
Targetblend rate
2011 biofuelproduction (dam3)
2015 biofuelproduction (dam3)
Target biofuelconsumption (dam3)
Additional biofuel tomeet target (dam3)
Tariff, value added tax,consumption tax
China Ethanol 2.60% 10% 2567 3078 19,329 15,541 40%, 17%, 5%Biodiesel 0.10% 2% 220 511 3350 1580 6.5%, 17%, 5%
India Ethanol 2.30% 10% 360 669 5039 2995 26.42%Biodiesel 0.08% 20% 30 121 16,826 16,641 26.42%
J. Beckman et al. Biomass and Bioenergy 108 (2018) 258–264
262
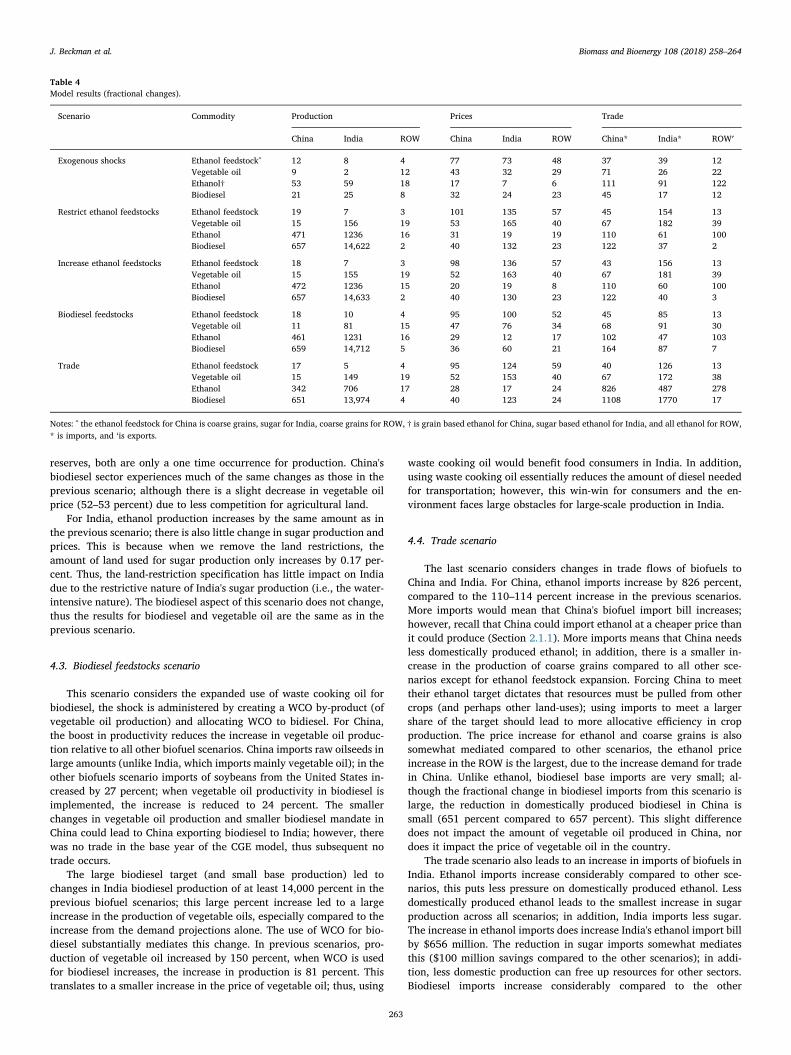
reserves, both are only a one time occurrence for production. China'sbiodiesel sector experiences much of the same changes as those in theprevious scenario; although there is a slight decrease in vegetable oilprice (52–53 percent) due to less competition for agricultural land.
For India, ethanol production increases by the same amount as inthe previous scenario; there is also little change in sugar production andprices. This is because when we remove the land restrictions, theamount of land used for sugar production only increases by 0.17 per-cent. Thus, the land-restriction specification has little impact on Indiadue to the restrictive nature of India's sugar production (i.e., the water-intensive nature). The biodiesel aspect of this scenario does not change,thus the results for biodiesel and vegetable oil are the same as in theprevious scenario.
4.3. Biodiesel feedstocks scenario
This scenario considers the expanded use of waste cooking oil forbiodiesel, the shock is administered by creating a WCO by-product (ofvegetable oil production) and allocating WCO to bidiesel. For China,the boost in productivity reduces the increase in vegetable oil produc-tion relative to all other biofuel scenarios. China imports raw oilseeds inlarge amounts (unlike India, which imports mainly vegetable oil); in theother biofuels scenario imports of soybeans from the United States in-creased by 27 percent; when vegetable oil productivity in biodiesel isimplemented, the increase is reduced to 24 percent. The smallerchanges in vegetable oil production and smaller biodiesel mandate inChina could lead to China exporting biodiesel to India; however, therewas no trade in the base year of the CGE model, thus subsequent notrade occurs.
The large biodiesel target (and small base production) led tochanges in India biodiesel production of at least 14,000 percent in theprevious biofuel scenarios; this large percent increase led to a largeincrease in the production of vegetable oils, especially compared to theincrease from the demand projections alone. The use of WCO for bio-diesel substantially mediates this change. In previous scenarios, pro-duction of vegetable oil increased by 150 percent, when WCO is usedfor biodiesel increases, the increase in production is 81 percent. Thistranslates to a smaller increase in the price of vegetable oil; thus, using
waste cooking oil would benefit food consumers in India. In addition,using waste cooking oil essentially reduces the amount of diesel neededfor transportation; however, this win-win for consumers and the en-vironment faces large obstacles for large-scale production in India.
4.4. Trade scenario
The last scenario considers changes in trade flows of biofuels toChina and India. For China, ethanol imports increase by 826 percent,compared to the 110–114 percent increase in the previous scenarios.More imports would mean that China's biofuel import bill increases;however, recall that China could import ethanol at a cheaper price thanit could produce (Section 2.1.1). More imports means that China needsless domestically produced ethanol; in addition, there is a smaller in-crease in the production of coarse grains compared to all other sce-narios except for ethanol feedstock expansion. Forcing China to meettheir ethanol target dictates that resources must be pulled from othercrops (and perhaps other land-uses); using imports to meet a largershare of the target should lead to more allocative efficiency in cropproduction. The price increase for ethanol and coarse grains is alsosomewhat mediated compared to other scenarios, the ethanol priceincrease in the ROW is the largest, due to the increase demand for tradein China. Unlike ethanol, biodiesel base imports are very small; al-though the fractional change in biodiesel imports from this scenario islarge, the reduction in domestically produced biodiesel in China issmall (651 percent compared to 657 percent). This slight differencedoes not impact the amount of vegetable oil produced in China, nordoes it impact the price of vegetable oil in the country.
The trade scenario also leads to an increase in imports of biofuels inIndia. Ethanol imports increase considerably compared to other sce-narios, this puts less pressure on domestically produced ethanol. Lessdomestically produced ethanol leads to the smallest increase in sugarproduction across all scenarios; in addition, India imports less sugar.The increase in ethanol imports does increase India's ethanol import billby $656 million. The reduction in sugar imports somewhat mediatesthis ($100 million savings compared to the other scenarios); in addi-tion, less domestic production can free up resources for other sectors.Biodiesel imports increase considerably compared to the other
Table 4Model results (fractional changes).
Scenario Commodity Production Prices Trade
China India ROW China India ROW China* India* ROW′
Exogenous shocks Ethanol feedstockˆ 12 8 4 77 73 48 37 39 12Vegetable oil 9 2 12 43 32 29 71 26 22Ethanol† 53 59 18 17 7 6 111 91 122Biodiesel 21 25 8 32 24 23 45 17 12
Restrict ethanol feedstocks Ethanol feedstock 19 7 3 101 135 57 45 154 13Vegetable oil 15 156 19 53 165 40 67 182 39Ethanol 471 1236 16 31 19 19 110 61 100Biodiesel 657 14,622 2 40 132 23 122 37 2
Increase ethanol feedstocks Ethanol feedstock 18 7 3 98 136 57 43 156 13Vegetable oil 15 155 19 52 163 40 67 181 39Ethanol 472 1236 15 20 19 8 110 60 100Biodiesel 657 14,633 2 40 130 23 122 40 3
Biodiesel feedstocks Ethanol feedstock 18 10 4 95 100 52 45 85 13Vegetable oil 11 81 15 47 76 34 68 91 30Ethanol 461 1231 16 29 12 17 102 47 103Biodiesel 659 14,712 5 36 60 21 164 87 7
Trade Ethanol feedstock 17 5 4 95 124 59 40 126 13Vegetable oil 15 149 19 52 153 40 67 172 38Ethanol 342 706 17 28 17 24 826 487 278Biodiesel 651 13,974 4 40 123 24 1108 1770 17
Notes: ˆ the ethanol feedstock for China is coarse grains, sugar for India, coarse grains for ROW, † is grain based ethanol for China, sugar based ethanol for India, and all ethanol for ROW,* is imports, and ‘is exports.
J. Beckman et al. Biomass and Bioenergy 108 (2018) 258–264
263

scenarios (especially 4.1 which assumed the status quo for India bio-diesel), this has an impact on India's domestic biodiesel production.That is, in scenario 4.1 production increased by 14,622 percent, withchanges to trade, production increases by 13,973 percent. The increasein imports also puts less pressure on the price of biodiesel compared toscenario 4.1; in addition, India produces and imports less vegetable oil.
5. Conclusions
The on-set of large-scale biofuel production in the United States andother countries has been named as a contributing factor to the recentbouts of agricultural commodity price volatility. Although biofuelswere not the only cause of this volatility, the use of agricultural feed-stocks for energy has heightened the awareness of the food versus fueldebate. For countries with large populations, e.g. China and India, thefood versus fuel debate takes on added significance if they were to meettheir biofuel targets. Rising populations and incomes could increasefood demand and bid up food prices, adding biofuel targets on top ofthat could push agricultural commodity prices much higher. However,if these countries are to use biofuel production as a way of reducingGHG emissions or as a source for energy independence, decisions needto be made on using agricultural feedstocks for food or fuel. Resultsfrom this work indicate that there are several options to relieve thepressure on agricultural commodity prices if biofuel targets are to bemet. Trade is one source; however, using existing stocks for ethanol orincreasing the amount of waste cooking oil for biodiesel provide largerimpacts on prices and production. That is, with limits on feedstocks thatcan be used for biofuel production and limited scope (land, water, etc.,)for expanding conventional feedstock production, these two countriesmay have to rely on trade and recycling wasted cooking oil to meetbiofuel targets in the short-to medium-term. Since domestic productionof biofuel is limited, the chances of trade displacing jobs or creatingwelfare losses are small. In fact, trade in biofuels, along with rules oforigin compatible with these countries comparative advantage, may notonly spur much needed foreign investment, job/wage growth, but alsoreduce emissions. Emerging waste management strategies in thesecountries, especially in urban centers, can be altered to tap the wastedcooking oil from industrial and service sectors. For instance, an in-centive such as a liter of blended motor fuel for every 10 liters of wastedcooking oil might motivate intermediaries to facilitate this arbitrage.The public sector has also a food-safety incentive to limit additionalfood uses of wasted cooking oil. In the long-run, both China and Indiacould make a push to increase biofuel production through unconven-tional pathways or technological change. All four biofuel scenarios re-duce emissions from using traditional transportation fuels; however, thetradeoffs between reducing emissions or increasing energy in-dependence and increasing politically-sensitive food insecurity suggeststrade and recycling as near-term options, while investments in tech-nology can address the need in the long-term.
What is touched upon briefly in the results, is the competition forresources among agricultural commodities. Rising populations and in-comes mean more land might be needed for agricultural production andproducing biofuels will accelerate the demand for agricultural land. Inthe land-use component of the CGE model, crop land, pasture land, andforest land compete for acreage; crop and pasture land increase in all ofour scenarios. This is at the expense of forest land. However, there is
another competing issue not captured in this analysis, which is thereduction of GHG emissions. If countries such as China and India usebiofuels to help reduce GHG emissions from traditional transportationfuel usage, there is the real risk that land will need to be taken fromforests, which could lead to offsetting GHG emissions. Along with thefood versus fuel aspect of this analysis, future work should also in-tegrate a complete energy policy framework in their analysis, takinginto account all GHG reduction pathways specified in the ParisAgreement.
Appendix A. Supplementary data
Supplementary data related to this article can be found at http://dx.doi.org/10.1016/j.biombioe.2017.11.018.
References
[1] A. Aradhey, India biofuels Annual: 2016, GAIN Report No. IN6088 ForeignAgricultural Service, United States Department of Agriculture, 2016.
[2] A. Anderson-Sprecher, J. Ji, China biofuels Annual: 2015, GAIN Report No.CH15030 Foreign Agricultural Service, United States Department of Agriculture,2015.
[3] United Nations Framework Convention on Climate Change (UNFCCC), EnhancedActions on Climate Change: China's Intended Nationally Determined Contributions,(2015).
[4] UNFCCC, India's Intended Nationally Determined Contribution: Working towardsClimate Justice, (2015).
[5] F. Wang, X. Shu, Geospatial analysis for utilizing the marginal land in regionalbiofuel industry: a case study in Guangdong Province, China, Biomass Bioenerg. 83(2015) 302–310.
[6] H. Qui, L. Sun, X. Xu, Y. Cai, J. Bai, Potentials of crop residues for commercialenergy production in China: a geographic and economic analysis, Biomass Bioenerg.64 (2014) 110–123.
[7] S. Sasmal, V. Goud, K. Mohanty, Characterization of biomasses available in theregion of North-East India for production of biofuels, Biomass Bioenerg. 45 (2012)212–220.
[8] C. Lavanya, I.Y.L.N. Murthy, G. Nagaraj, N. Mutka, Prospects of castor (Ricinuscommunis L.) genotypes for biodiesel production in India, Biomass Bioenerg. 39(2012) 204–209.
[9] J. Beckman, Biofuel Use in International Markets: the Importance of Trade,Economic Information Bulletin No. 144, Economic Research Service, United StatesDepartment of Agriculture, 2015.
[10] W. Chen, F. Wu, J. Zhang, Potential production of non-food biofuels in China,Renew. Energ 85 (2016) 939–944.
[11] E. Carter, Biofuels baseline: situation & projects through 2026, 2017 InternationalBiofuels Baseline, Foreign Agricultural Service, USDA, 2017.
[13] M. Landes, Indian Sugar Sector Cycles Down, Poised to Rebound, Outlook No.SSSM-260–01, Economic Research Service, USDA, 2010.
[14] Government of India (GOI), Agricultural Statistics at a Glance 2014, Ministry ofAgriculture, Department of Agriculture and Cooperation, 2014.
[15] P. Purohit, S. Dhar, Biofuel Roadmap for India, UNEP DTU Partnership,Copenhagen, 2015 Technical University of Denmark.
[16] J. Beckman, T. Hertel, F. Taheripour, W. Tyner, Structural change in the biofuelsera, Eur. Rev. Agriecon 39 (1) (2012) 137–156.
[17] J. Beckman, T. Hertel, W. Tyner, Validating energy-oriented CGE models, EnergEcon. 33 (2011) 799–806.
[18] J. Fouré, A. Bénassy-Quéré, L. Fontagné, Modelling the world economy at the 2050horizon, Econ. Transit 21 (4) (2013) 617–654.
[19] A. Anderson-Sprecher, J. Ji, Huge Stocks Challenge Grain Policy, GAIN Report No.CH16002 Foreign Agricultural Service, USDA, 2016.
[20] C. Sheinbaum-Pardo, A. Calderon-Irazoque, M. Ramirez-Suarez, Potential of bio-diesel from waste cooking oil in Mexico, Biomass Bioenerg. 56 (2013) 230–238.
[21] H. Zhang, Q. Wang, S. Mortimer, Waste cooking oil as an energy resource: review ofChinese policies, Renew. Sust. Energ Rev. 16 (7) (2012) 5225–5231.
[22] M. Kalam, H. Masjuki, M. Jayed, A. Liaquat, Emission and performance char-acteristics of an indirect ignition diesel engine fueled with waste cooking oil, Energ36 (1) (2011) 397–402.
J. Beckman et al. Biomass and Bioenergy 108 (2018) 258–264
264