GAINS ASIA - ledsgp.org
54
___ 1 GAINS ASIA SCENARIOS FOR COST-EFFECTIVE CONTROL OF AIR POLLUTION AND GREENHOUSE GASES IN CHINA Markus Amann, Jiang Kejun, Hao Jiming, Shuxiao Wang, Wei Wei, Xing Jia and Zhang Chuying, Imrich Bertok, Jens Borken, Janusz Cofala, Chris Heyes, Lena Hoglund, Zbigniew Klimont, Pallav Purohit, Peter Rafaj, Wolfgang Schöpp, Geza Toth, Fabian Wagner, Wilfried Winiwarter November 2008
Transcript of GAINS ASIA - ledsgp.org

___ 1
GAINS ASIA SCENARIOS FOR COST-EFFECTIVE CONTROL OF AIR POLLUTION AND GREENHOUSE GASES IN CHINA Markus Amann, Jiang Kejun, Hao Jiming, Shuxiao Wang, Wei Wei, Xing Jia and Zhang Chuying, Imrich Bertok, Jens Borken, Janusz Cofala, Chris Heyes, Lena Hoglund, Zbigniew Klimont, Pallav Purohit, Peter Rafaj, Wolfgang Schöpp, Geza Toth, Fabian Wagner, Wilfried Winiwarter
November 2008

___ 2
The GAINS-Asia model integrates a number of established economic and environmental models developed by international experts at the following institutions:
IIASA International Institute for Applied Systems Analysis Laxenburg, Austria
ERI Energy Research Institute Beijing, China
TERI The Energy and Resources Institute Delhi, India
JRC-IES Institute for Environment and Sustainability of the Joint Research Centre of the European Union Ispra, Italy
UBERN The University of Bern Bern, Switzerland
The research was funded by The Sixth Framework Program (FP6) of the European Union.
Further information:
GAINS International Institute for Applied Systems Analysis (IIASA) Schlossplatz 1 A-2361 Laxenburg Austria Tel: +43 2236 807 Email: [email protected] Web: http://gains.iiasa.ac.at
The views and opinions expressed herein do not necessarily represent the positions of IIASA or its collaborating and supporting organizations.

___ 1
Executive Summary
Current economic growth will counteract ongoing efforts to improve air quality problems in China unless pollution control laws are significantly upgraded.
Current and future economic growth in China will counteract ongoing efforts to improve air quality through controls of sulphur dioxide (SO2) emissions from large stationary sources and nitrogen oxide (NOx) emissions from vehicles. Unless further air pollution policies are implemented, the increase in coal consumption to fuel additional industrial production and provide more electricity to a wealthier population will largely compensate the positive effects of current efforts to control SO2 emissions in China. The lack of regulations for controlling emissions of NOx from large stationary sources is expected to lead to a 30% increase in China’s NOx emissions, despite the tight emission control legislation that has been recently imposed on mobile sources. Consequently, without further air pollution control policies, negative impacts on human health and vegetation that are currently felt across China will not substantially improve in the coming decades. For instance, it is estimated that present exposure to fine particulate matter (PM2.5) is shortening life expectancy of the Chinese population by approximately 40 (21-53) months, and it would in a business-as-usual case remain at that level for the coming decades. Emissions of greenhouse gases that contribute to global climate change would increase by approximately 80% by 2030.
Advanced emission control technologies are available to maintain acceptable levels of air quality despite the pressure from growing economic activities.
Yet, advanced emission control technologies are available to maintain acceptable levels of air quality despite the pressure from growing economic activities. Full application of advanced technical end-of-pipe emission control measures in China would lead to substantial improvements in air quality. It is estimated that negative health impacts could be reduced by 43% by 2030 by applying such advanced emission control technology to all large sources in China. However, such an undifferentiated across-the-board approach would impose significant burdens on the economy, involving an additional expense of 0.63% of GDP.
___ 2
A cost-effective strategy can reduce costs for air pollution control by up to 80% compared to conventional approaches.
The GAINS (Greenhouse gas – Air pollution Interactions and Synergies) model can identify cost-effective portfolios of emission control measures that achieve improvements in environmental impacts at least cost. A cost-effective emission control strategy developed with the GAINS optimization tool, which selectively allocates specific reduction measures across economic sectors, pollutants and regions, would achieve equal air quality improvements at only 20% of the costs of a conventional across-the-board approach. An integral element of such an air pollution control strategy will be measures to eliminate indoor pollution from the combustion of solid fuels. The investment will also reduce crop losses by around 50% and have far-ranging positive impacts on the environment, but will not result in positive side-effects on greenhouse gas emissions.
A smart mix of measures that includes actions to reduce energy consumption can further cut air pollution control costs, and achieve lower greenhouse gas emissions.
Well-designed air pollution control strategies can also reduce emissions of greenhouse gases. GAINS demonstrates that low carbon strategies result in lower emissions of SO2, NOx and PM at no additional costs. GAINS estimates that each percent of CO2 reduction will typically reduce health impacts from fine particulate air pollution by 1%.
This also means that, for achieving given targets on ambient air quality, the cost of air pollution can be further reduced by adopting certain low carbon measures. A GAINS scenario demonstrates that the additional costs of some climate-friendly measures, e.g., energy efficiency improvements, co-generation of heat and power, fuel substitution, integrated coal gasification combined cycle (IGCC) plants, etc., are more than compensated for by savings in air pollution control equipment. By selecting a smart mix of measures to simultaneously cut air pollution and greenhouse gas emissions, China can almost halve air pollution control costs as well as lower greenhouse gas emissions by 8%.
For policymakers, industry, NGOs and researchers wishing for more information and to conduct independent analyses, the GAINS-Asia model and documentation are freely available online at http://gains.iiasa.ac.at

___ 3
Table of Contents
1 Introduction ........................................................................................................... 5
2 Emissions and air quality impacts in 2005................................................................ 7
2.1.1 An Emission inventory for 2005................................................................. 7
2.2 Air quality .................................................................................................... 13
2.2.1 Ambient concentrations of PM2.5............................................................ 13
2.2.2 concentrations of ground-level ozone........................................................ 16
2.3 Air quality impacts ........................................................................................ 16
2.3.1 Health Impacts from outdoor pollution ..................................................... 16
2.3.2 Health impacts from indoor pollution ....................................................... 18
2.3.3 Crop losses from Ground-level ozone ........................................................ 19
3 The baseline projection up to 2030 ........................................................................ 20
3.1 Macro-economic development and energy consumption..................................... 20
3.2 Baseline projections for air pollution emissions ................................................ 22
3.3 Baseline projections of air quality and health impacts....................................... 26
4 Alternative policy scenarios .................................................................................... 30
4.1 Uniform application of advanced emission control technologies for large sources. 30
4.2 Cost-effective allocation of end-of-pipe air pollution controls ............................. 36
4.3 Cost-effective air pollution reductions including structural changes .................... 42
4.4 Air pollution control through greenhouse gas mitigation strategies ...................... 46
5 Conclusions.......................................................................................................... 50

___ 4
About the authors This report is the result of cooperation between scientists at the International Institute for Applied Systems Analysis (IIASA) in Laxenburg, Austria, the Energy Research Institute (ERI) in Beijing, China, and the Tsinghua University, Beijing, China.
At IIASA, the work was carried out by a team of IIASA’s Atmospheric Pollution and Economic Development programme, led by Markus Amann. Team members include Imrich Bertok, Jens Borken, Janusz Cofala, Chris Heyes, Lena Hoglund, Zbigniew Klimont, Pallav Purohit, Peter Rafaj, Wolfgang Schöpp, Geza Toth, Fabian Wagner and Wilfried Winiwarter.
The team at ERI, led by Jiang Kejun, included Deng Yixiang and Zhuang Xing.
At Tsinghua University, the team was led by Hao Jiming and Wang Shuxiao and included Wei Wei, Xing Jia and Zhang Chuying.

___ 5
1 Introduction Since the 1980s China has experienced rapid economic development with average growth rates of 9.8 percent/year (ADB, 2007). The Chinese government aims at a continuation of the rapid economic development in the next decades, striving for an increase in per-capita income by a factor of five (in Market Exchange Rates) up to 2030. Thereby, total GDP would grow by a factor of six, given that the population is likely to increase to almost 1.5 billion people. These trends would transform China into one of the largest economies in the world. Even under the assumption that the envisaged growth in economic output will decouple from the growth in energy consumption, current projections suggest a doubling of Chinese energy consumption up to 2030 (IEA, 2007). Unless effective countermeasures are taken, these trends will further intensify the pressure on the atmosphere at the local, regional and global scales.
It will be a formidable task for Asian policy makers to further advance human wellbeing through continued economic development while providing acceptable levels of air quality to the citizens and assuring sustainable conditions for vegetation and ecosystems. At the same time, the envisaged growth in Asian greenhouse gas emissions will seriously challenge efforts of the world community to control global climate change.
For a number of historic reasons, response strategies to air pollution and climate change are often addressed by different policy institutions. However, there is growing recognition that a comprehensive and combined analysis of air pollution and climate change could reveal important synergies of emission control measures (Swart et al., 2004), which could be of high policy relevance. Insight into the multiple benefits of control measures could make emission controls economically more viable, both in industrialized and developing countries. While scientific understanding on many individual aspects of air pollution and climate change has considerably increased in the last years, little attention has been paid to a holistic analysis of the interactions between both problems (Barker et al., 2007).
The Greenhouse gas – Air pollution Interactions and Synergies (GAINS) model has been developed as a tool to identify emission control strategies that achieve given targets on air quality and greenhouse gas emissions at least cost. GAINS considers measures for the full range of precursor emissions that cause negative effects on human health via the exposure of fine particles and ground-level ozone, damage to vegetation via excess deposition of acidifying and eutrophying compounds, as well as the six greenhouse gases considered in the Kyoto protocol. In addition, it also considers how specific mitigation measures simultaneously influence different pollutants. Thereby, GAINS allows for a comprehensive and combined analysis of air pollution and climate change mitigation strategies, which reveals important synergies and trade-offs between these policy areas. This state-of-the-art interdisciplinary model builds on a scientific tool that has already helped European governments slash air pollution across the continent without compromising economic development (Hordijk and Amann, 2007).

___ 6
Under the EU Sixth Framework Programme on Research (FP6), an international team of research institutions has implemented the GAINS model for India and China. The research team, headed by the International Institute for Applied Systems Analysis (IIASA, Laxenburg, Austria), included the Chinese Energy Research Institute (ERI, Beijing, China), Tsinghua University (Beijing, China), The Energy and Resource Institute (TERI, Delhi, India), the Institute for Environment and Sustainability of the Joint Research Centre of the European Commission (IES-JRC, Ispra, Italy) and the University of Bern (Switzerland). The GAINS model with all databases is now freely accessible for interactive use at the Internet (http://gains.iiasa.ac.at).
This report presents a set of policy scenarios that explore cost-effective strategies for reducing health and vegetation impacts of poor air quality in China. As a starting point the report summarizes emissions and resulting air quality for the year 2005 as estimated by the GAINS model (Section 2). Adopting the projections of Chinese government on economic development up to 2030, Section 3 presents a baseline projection that outlines the likely development of emissions, air quality and health and vegetation impacts that would result from the full implementation of emission control measures as laid down in current Chinese legislation. Section 4 explores alternative emission control strategies for reducing air pollution impacts in the future. It examines the cost-effectiveness of (i) uniform application of advanced end-of-pipe emission control technologies to large sources, (ii) an optimized allocation of air pollution control measures that achieve the same environmental improvements at least cost, (iii) air pollution control strategies that also include structural changes in the energy system, and (iv) energy strategies that aim at reducing greenhouse gas emissions in China. Conclusions are drawn in Section 5.
This report focuses on the description of policy scenarios for China that have been developed with the GAINS-Asia model. The methodology of the GAINS-Asia model is documented in detail in a companion report (Amann et al., 2008b) that is available at http://gains.iiasa.ac.at. Policy scenarios for India are presented in a parallel report (Amann et al., 2008c). The interactive GAINS-Asia model is freely accessible on the Internet at http://gains.iiasa.ac.at.

___ 7
2 Emissions and air quality impacts in 2005 2.1.1 AN EMISSION INVENTORY FOR 2005
Based on energy statistics and information on fuel quality, the GAINS model estimates that in 2005 China emitted 31.5 million tons of SO2, 16.9 million tons of NOx, 17.9 million tons of PM10 which 12.7 million are in the form of PM2.5, 12.8 million tons of NH3 and 16.1 million tons of VOC into the atmosphere (Table 2.1).
For SO2, almost 90 percent of total emissions originated from power generation and industrial energy combustion. 24 percent of NOx emissions are estimated to emerge from mobile sources (10 percent from road traffic), while industrial sources contributed 43 percent and the power sector 27 percent. The largest sources of fine particles (PM2.5) were industrial plants (44 percent), while the domestic sector with its incomplete combustion of solid fuels, as the next largest source of fine particles, emitted 36 percent of PM2.5. Solid fuel combustion in households was also responsible for 70 percent of the anthropogenic emissions of volatile organic compounds, while NH3 emissions were predominantly released from agricultural activities (Figure 2.1).
Table 2.1: Estimates of emissions of air pollutants from anthropogenic sources in China in 2005, by sector (kilotons)
SECTOR SO2 NOx PM2.5 PM10 NH3 VOC COMBUSTION IN ENERGY AND TRANSFORMATION INDUSTRIES
15643 4558 919 2611 0 127
NON-INDUSTRIAL COMBUSTION PLANTS
2110 861 4572 4965 88 11109
COMBUSTION IN MANUFACTURING INDUSTRY
12015 7275 4233 5870 4 246
PRODUCTION PROCESSES 1327 71 1447 1986 169 2399 EXTRACTION AND DISTRIBUTION OF FOSSIL FUELS AND GEOTHERMAL ENERGY
0 0 40 397 0 553
SOLVENT AND OTHER PRODUCT USE
0 0 0 0 0 4853
ROAD TRANSPORT 92 1728 293 321 22 2192 OTHER MOBILE SOURCES AND MACHINERY
314 2407 184 194 1 889
WASTE TREATMENT AND DISPOSAL
0 0 163 163 782 473
AGRICULTURE 28 26 875 1376 11779 1038 TOTAL 31528 16926 12725 17883 12844 16069
In 2005 industrial energy combustion accounted for almost 50 percent of anthropogenic CO2 emissions in China, and power generation another 38 percent. The largest shares of CH4 emissions originated from coal mining and agricultural activities, while agriculture emitted most of N2O emissions (Table 2.2, Figure 2.2).

___ 8
Table 2.2: Estimates of Chinese emissions of greenhouse gases from anthropogenic sources in 2005, by sector
SECTOR CO2
(Mt) CH4 (kt)
N2O (kt)
All GHGs (Mt CO2eq)
COMBUSTION IN ENERGY AND TRANSFORMATION INDUSTRIES
2391 53 35 2403
NON-INDUSTRIAL COMBUSTION PLANTS
283 1379 37 324
COMBUSTION IN MANUFACTURING INDUSTRY
2988 127 29 3000
PRODUCTION PROCESSES 31 13 11 34 EXTRACTION AND DISTRIBUTION OF FOSSIL FUELS AND GEOTHERMAL ENERGY
188 24097 0 694
SOLVENT AND OTHER PRODUCT USE
0 0 26 8
ROAD TRANSPORT 258 120 15 265 OTHER MOBILE SOURCES AND MACHINERY
169 13 6 171
WASTE TREATMENT AND DISPOSAL
0 11156 66 255
AGRICULTURE 0 19072 1629 905 TOTAL 6308 56030 1854 8059
Based on provincial energy statistics and fuel characteristics, emissions are estimated for each province (Table 2.3). In general, the GAINS emission estimates compare well with other inventories from national and international sources. Detailed comparisons are provided in Amann et al., 2008b.

___ 9
0%
20%
40%
60%
80%
100%
SO2 NOx PM2.5 PM10 NH3 VOC
Sh
are
of
tota
l em
issi
on
s in
20
05 10: Agriculture
09: Waste treatment and disposal
08: Other mobile sources and machinery
07: Road transport
06: Solvent and other product use
05: Extraction and distribution of fossil fuelsand geothermal energy04: Production processes
03: Combustion in manufacturing industry
02: Non-industrial combustion plants
01: Combustion in energy andtransformation industries
Figure 2.1: Contributions of source sectors to total anthropogenic emissions of air pollutants in China in 2005
0%
10%
20%
30%
40%
50%
60%
70%
80%
90%
100%
CO2 CH4 N2O All GHGs
Sh
are
of
tota
l em
issi
on
s in
20
05 10: Agriculture
09: Waste treatment and disposal
08: Other mobile sources and machinery
07: Road transport
06: Solvent and other product use
05: Extraction and distribution of fossil fuelsand geothermal energy04: Production processes
03: Combustion in manufacturing industry
02: Non-industrial combustion plants
01: Combustion in energy andtransformation industries
Figure 2.2: Contributions of source sectors to total anthropogenic emissions of greenhouse gases in China in 2005

___ 10
Table 2.3: Emissions of air pollutants in 2005 by province (kilotons)
SO2 NOx PM2.5 PM10 NH3 VOC
ANHUI 1143 753 614 817 600 1018 BEIJING 450 285 115 174 65 151 CHONGQING 928 308 217 302 242 247 FUJIAN 458 323 175 272 276 134 GANSU 371 279 214 296 249 289 GUANGDONG 1706 1022 638 929 588 750 GUANGXI 737 312 397 504 497 575 GUIZHOU 758 285 234 344 389 256 HAINAN 62 64 107 122 91 259 HEBEI 2211 1170 941 1318 844 884 HEILONGJIANG 460 555 404 560 397 802 HENAN 1638 876 815 1143 1109 880 HONG KONG 21 213 17 20 6 49 HUBEI 1288 688 597 780 622 847 HUNAN 745 425 452 610 667 536 I. MONGOLIA 518 375 355 476 308 603 JIANGSU 2179 1220 1007 1396 793 1281 JIANGXI 536 316 329 493 396 355 JILIN 1830 943 574 841 330 643 LIAONING 1221 559 321 526 319 348 NINGXIA 316 115 76 116 65 91 QINGHAI 74 71 53 71 103 62 SHAANXI 912 337 270 397 268 361 SHANDONG 1337 815 212 374 70 188 SHANGHAI 2791 1393 1137 1544 997 1508 SHANXI 1927 709 470 779 266 216 SICHUAN 1773 566 854 1048 867 1505 TIANJIN 537 568 120 171 47 222 TIBET XIZANG 4 9 14 25 151 17 XINJIANG 397 240 157 221 307 245 YUNNAN 447 300 319 440 605 332 ZHEJIANG 1752 831 524 772 312 413 TOTAL 31528 16926 12725 17883 12844 16069

___ 11
Table 2.4: Emissions of greenhouse gases in 2005 by province
CO2 (Mt)
CH4 (kt)
N2O (kt)
all GHG (Mt CO2eq)
ANHUI 277 2405 89 355 BEIJING 116 320 11 126 CHONGQING 114 1042 34 146 FUJIAN 124 865 35 153 GANSU 104 953 42 137 GUANGDONG 383 2191 71 451 GUANGXI 108 1629 57 160 GUIZHOU 117 1895 48 171 HAINAN 14 275 11 24 HEBEI 448 2266 122 533 HEILONGJIANG 213 2708 63 290 HENAN 347 3858 162 478 HONG KONG 39 76 2 41 HUBEI 249 1858 80 313 HUNAN 149 2715 81 232 I. MONGOLIA 147 1003 53 184 JIANGSU 504 1490 109 569 JIANGXI 120 1582 46 168 JILIN 375 1516 55 424 LIAONING 248 3576 59 341 NINGXIA 52 418 12 64 QINGHAI 26 366 20 40 SHAANXI 136 2317 43 198 SHANDONG 237 2163 14 287 SHANGHAI 520 1834 167 610 SHANXI 325 5995 44 464 SICHUAN 185 3579 125 298 TIANJIN 121 402 9 132 TIBET XIZANG 2 326 23 16 XINJIANG 84 1534 53 132 YUNNAN 111 1859 73 172 ZHEJIANG 314 1013 42 349 TOTAL 6308 56030 1854 8059
To put these figures into an international perspective, Figure 2.3 and Figure 2.4 compare, on a per-capita basis, estimates for China with data for the United States of America, the European Union and India. While Chinese per-capita emissions are significantly lower than those of the United States, they are close (for NH3 and VOC) or higher (SO2 and PM2.5) than the per-capita emissions of the European Union. In contrast, however, per-capita greenhouse gas emissions of the EU are higher than those of China, underlining the effects of air pollution control measures that are in place in Europe.

___ 12
0
10
20
30
40
50
60
70
US
A
EU
Chi
na
Indi
a
US
A
EU
Chi
na
Indi
a
US
A
EU
Chi
na
Indi
a
US
A
EU
Chi
na
Indi
a
US
A
EU
Chi
na
Indi
a
SO2 NOx PM2.5 NH3 VOC
kg/c
apita
/yr
Power generation Domestic Industry Transport Other Agriculture
Figure 2.3: Per-capita emissions of air pollutants by sector in 2005
0
5
10
15
20
25
US
A
EU
Chi
na
Indi
a
US
A
EU
Chi
na
Indi
a
US
A
EU
Chi
na
Indi
a
US
A
EU
Chi
na
Indi
a
CO2 CH4 N2O All GHGs
t CO
2eq/
capi
ta/y
r
Power generation Domestic Industry Transport Other Agriculture
Figure 2.4: Per-capita emissions of greenhouse gases by sector in 2005

___ 13
2.2 Air quality For the emission inventory presented above, the GAINS model estimates air quality and resulting impacts on human health and environment.
2.2.1 AMBIENT CONCENTRATIONS OF PM2.5
Based on the detailed spatial and sectoral GAINS emission inventory, GAINS computes fields of ambient concentrations of PM2.5 with the help of source-receptor relationships derived from the TM5 model. The model computed contributions from (i) primary particulate matter released from anthropogenic sources, (ii) secondary inorganic aerosols formed from anthropogenic emissions of SO2, NOx and NH3, (iii) particulate matter from natural sources (soil dust, sea salt, biogenic sources). The health impact assessment associates only anthropogenic sources with negative health impacts. Figure 2.5 displays annual mean concentrations of PM2.5 in ambient air computed for the emissions of 2005.

___ 14
Figure 2.5: Ambient concentrations of PM2.5 computed for 2005. Top panel: all sources, bottom panel: PM2.5 only from anthropogenic emissions
The model-measurement comparison is shown in Figure 2.6. The small number of points in this graph and their quantised appearance indicate the relative scarcity of PM2.5 measurements suitable for the validation. The large spread in measured values corresponding to one GAINS estimate is caused by the use of data for different measurement locations and/or different years. The spread gives an indication of the variability in the measurements, all of which are compared with just one GAINS estimate for one grid cell.
The GAINS modelled estimate includes the basic average anthropogenic PM2.5 concentration for the relevant grid cell plus the calculated urban increment – if appropriate – plus an estimate of the fine fraction of the natural dust concentration. Although not perfect, the agreement with available measurements shows a reasonable match of GAINS estimates with the few available monitoring data for China. However, it should be pointed out that

___ 15
comparisons with measurements of individual PM2.5 components (e.g., sulphates, etc.) show good agreement with pollutants from anthropogenic sources, and suggest underestimates of the contribution from natural (e.g., biogenic) sources. As pointed out above, the health impact assessment in GAINS considers exposure to PM2.5 from anthropogenic sources only, so that this deficiency might be of less relevance for the calculation of health effects.
0
20
40
60
80
100
120
140
160
0 20 40 60 80 100 120 140 160
Measured [PM2.5]
GA
INS
PM
2.5 +
ui +
dus
t, μg
m-3
Figure 2.6: Comparison of GAINS estimates of PM2.5 with available PM2.5 measurements in Chinese cities. Open symbols represent rural sites for which no urban increment was applied to the GAINS estimate.

___ 16
2.2.2 CONCENTRATIONS OF GROUND-LEVEL OZONE
GAINS also estimates concentrations of ground-level ozone (annual mean concentrations are shown in Figure 2.7) and assesses resulting impacts on human health and crops using different ozone exposure metrics. Annual mean concentrations of ozone are computed in a range between 40 to 50 ppb in most parts of China. Higher concentrations are estimated for the western provinces.
Figure 2.7: Rural annual mean concentrations of ozone, computed for the emissions of 2005. Note that in cities ozone will be lower due to titration with local NOx emissions.
2.3 Air quality impacts
2.3.1 HEALTH IMPACTS FROM OUTDOOR POLLUTION
For the year 2005, GAINS estimates for the Chinese population a loss in statistical life expectancy attributable to outdoor exposure of PM2.5 of 39 months. Obviously, such a calculation is burdened with significant uncertainties, and sets of alternative assumptions result in a range from 21 to 53 months. Details about the methodology for calculating health impacts are provided in Amann et al., 2008a. It should be noted that the methodology adopted for GAINS associates only exposure to PM2.5 of anthropogenic origin with negative health effects, and does not, therefore, link particles from natural sources (soil dust, sea salt, vegetation, etc.) with reduced life expectancy. More details are provided in Amann et al., 2008b.
Since GAINS computes ambient concentration based on a detailed chemical transport model, it allocate the contributions to ambient PM2.5 concentrations to their different origins, both from natural and anthropogenic sources. It has been pointed out above that combustion of solid fuels in households constitutes in China a major source of PM emissions. Analysis shows that about 20 percent of the health impacts from outdoor exposure to PM2.5 can be linked to

___ 17
emissions from the combustion of solid fuels in households (Figure 2.8), which are responsible, in addition to their outdoor health effects, for serious health impacts through the exposure to indoor pollution.
Table 2.5: Loss in statistical life expectancy in China estimated for 2005 (months)
Central estimate Lower estimate Upper estimate Central estimate without
emissions from solid fuel
combustion in households
ANHUI 52.6 27.6 70.8 42.1 BEIJING 57.3 30.0 77.1 40.3 CHONGQING 54.3 28.5 73.1 46.4 FUJIAN 20.3 10.6 27.3 19.1 GANSU 15.4 8.0 20.7 13.5 GUANGDONG 32.7 17.1 44.0 28.8 GUANGXI 33.4 17.5 45.0 29.5 GUIZHOU 33.2 17.4 44.7 29.6 HAINAN 13.7 7.2 18.4 12.7 HEBEI 48.3 25.3 65.0 38.5 HEILONGJIANG 12.7 6.6 17.1 8.2 HENAN 54.5 28.5 73.3 45.9 HUBEI 48.4 25.3 65.1 40.4 HUNAN 43.8 22.9 58.9 38.0 INNER MONGOLIA 8.8 4.6 11.9 7.4 JIANGSU 53.9 28.2 72.6 44.9 JIANGXI 38.0 19.9 51.2 33.5 JILIN 22.2 11.6 29.9 14.2 LIAONING 31.6 16.6 42.6 22.8 NINGXIA 14.2 7.5 19.2 12.1 QINGHAI 13.2 6.9 17.7 9.8 SHAANXI 30.8 16.2 41.5 25.9 SHANDONG 49.0 25.6 65.9 40.1 SHANGHAI 51.9 27.2 69.9 47.4 SHANXI 33.5 17.6 45.2 29.8 SICHUAN 55.5 29.1 74.7 43.4 TIANJIN 50.9 26.7 68.6 40.8 TIBET XIZANG 1.8 1.0 2.5 1.8 XINJIANG 7.6 4.0 10.2 6.0 YUNNAN 17.1 9.0 23.1 15.6 ZHEJIANG 35.7 18.7 48.1 32.4 TOTAL 39.4 20.6 53.1 32.8

___ 18
0
10
20
30
40
50
60
Anh
ui
Bei
jing
Cho
ngqi
ng
Fujia
n
Gan
su
Gua
ngdo
ng
Gua
ngxi
Gui
zhou
Hai
nan
Heb
ei
Hei
long
jiang
Hen
an
Hub
ei
Hun
an
Inne
r M
ongo
lia
Jian
gsu
Jian
gxi
Jilin
Liao
ning
Nin
gxia
Qin
ghai
Sha
anxi
Sha
ndon
g
Sha
ngha
i
Sha
nxi
Sic
huan
Tian
jin
Tibe
t Xiz
ang
Xin
jiang
Yunn
an
Zhe
jiang
Chi
na
Mon
ths
From other sources From solid fuel combustion in households
Figure 2.8: Loss in statistical life expectancy that can be attributed to the outdoor exposure to PM2.5 in China in 2005, central estimate
2.3.2 HEALTH IMPACTS FROM INDOOR POLLUTION
The GAINS model estimates health impacts from indoor pollution resulting from solid fuel use in households, following the methodology employed for the Global Burden of Disease project of the World Health Organization (Smith et al., 2004). In line with the WHO methodology, GAINS calculations result in disability adjusted life years as the metric for health impacts. In contrast to outdoor effects, which are quantified only for the population older than 30 years, estimates of health impacts from indoor pollution also relate to children. Estimates for the year 2005 are presented in Table 2.6. It should be noted that comparability with the estimates for outdoor effects needs further work, including harmonization of underlying assumptions.

___ 19
Table 2.6: Disability adjusted life years (DALY) from indoor pollution, China 2005 (1000 DALYs/year)
2005 ALRI FROM INDOOR BURNING OF BIOMASS Children < 5 yrs 1454 COPD FROM INDOOR BURNING OF BIOMASS Women 1869 LUNG CANCER (FROM EXPOSURE TO COAL SMOKE) Women 209 COPD FROM INDOOR BURNING OF BIOMASS Men 1227 LUNG CANCER (FROM EXPOSURE TO COAL SMOKE) Men 279 TOTAL 5037
ALRI: Acute lower respiratory infections COPD: Chronic obstructive pulmonary disease
2.3.3 CROP LOSSES FROM GROUND-LEVEL OZONE
In addition to health impacts, GAINS estimates for a number of economically important agricultural crops (wheat, corn, rice, soy) potential crop losses that are attributable to ground-level ozone. There are some areas in China for which current ozone levels are likely to cause considerable losses in agricultural productivity. As an example, Figure 2.9 shows the spatial distribution of potential crop losses for wheat, which reaches in some areas of eastern China more than 20 percent.
Figure 2.9: Potential losses in wheat yield due to ground-level ozone in 2005, %
___ 20
3 The baseline projection up to 2030 3.1 Macro-economic development and energy consumption As a reference for the analysis of alternative policy scenarios, the Chinese Energy Research Institute has developed a baseline projection that reflects current Chinese expectations on (i) population projections of the National Population Development Strategy, (ii) the official Chinese industrial process forecasts, (iii) the 1997-2010 Land Plan Program of the Ministry of Land and Resource (2004), (iv) the national government’s development targets for renewable energy sources in the ‘11th Five Year Plan’, and (v) the IPAC-AIM/Local energy model.
The baseline scenario extrapolates business as usual assuming that existing policies on energy and environment will be continued and implemented. Technology progress keeps at a moderate level. International trading will increase and China’s economy will be integrated further into the global economy. Therefore, China could rely on international markets and energy imports to meet part of its energy supply needs.
Overall, the baseline scenario projects an increase of total GDP (in constant 2000 Yuans) by a factor of 10 between 2000 and 2030 (i.e., by eight percent per year), while total population would increase by 15 percent. This implies a growth in per-capita GDP from €1,275 in 2005 to €7,000, i.e., by a factor of 5.5 if measured in Market Exchange rates, or from €3,000 to €9,100, i.e., by a factor of three in terms of Purchasing Power Parity.
Such an economic growth will put heavy demand on the supply of energy. Under business-as-usual conditions, consumption of total primary energy is estimated to increase by a factor of 3.2 between 2005 and 2030, indicating a clear decoupling between economic growth and energy consumption as a consequence of the ongoing structural transformations in the Chinese economy.
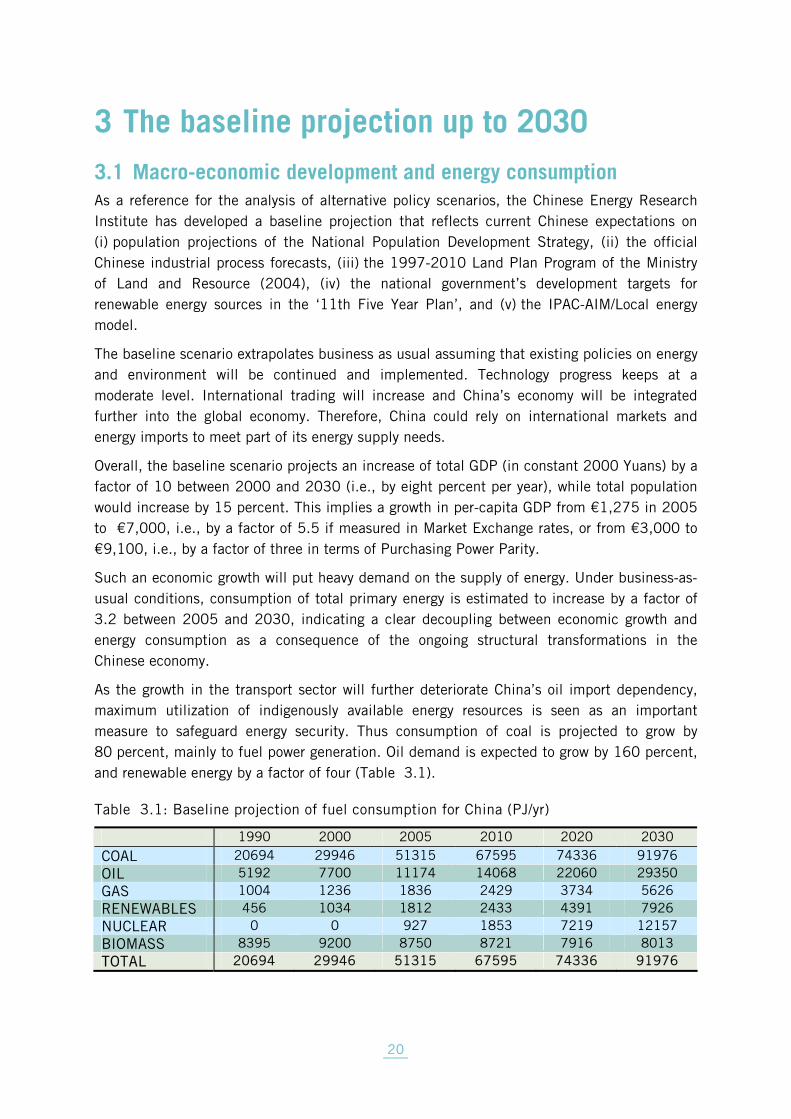
As the growth in the transport sector will further deteriorate China’s oil import dependency, maximum utilization of indigenously available energy resources is seen as an important measure to safeguard energy security. Thus consumption of coal is projected to grow by 80 percent, mainly to fuel power generation. Oil demand is expected to grow by 160 percent, and renewable energy by a factor of four (Table 3.1).
Table 3.1: Baseline projection of fuel consumption for China (PJ/yr)
1990 2000 2005 2010 2020 2030
COAL 20694 29946 51315 67595 74336 91976 OIL 5192 7700 11174 14068 22060 29350 GAS 1004 1236 1836 2429 3734 5626 RENEWABLES 456 1034 1812 2433 4391 7926 NUCLEAR 0 0 927 1853 7219 12157 BIOMASS 8395 9200 8750 8721 7916 8013 TOTAL 20694 29946 51315 67595 74336 91976
___ 21
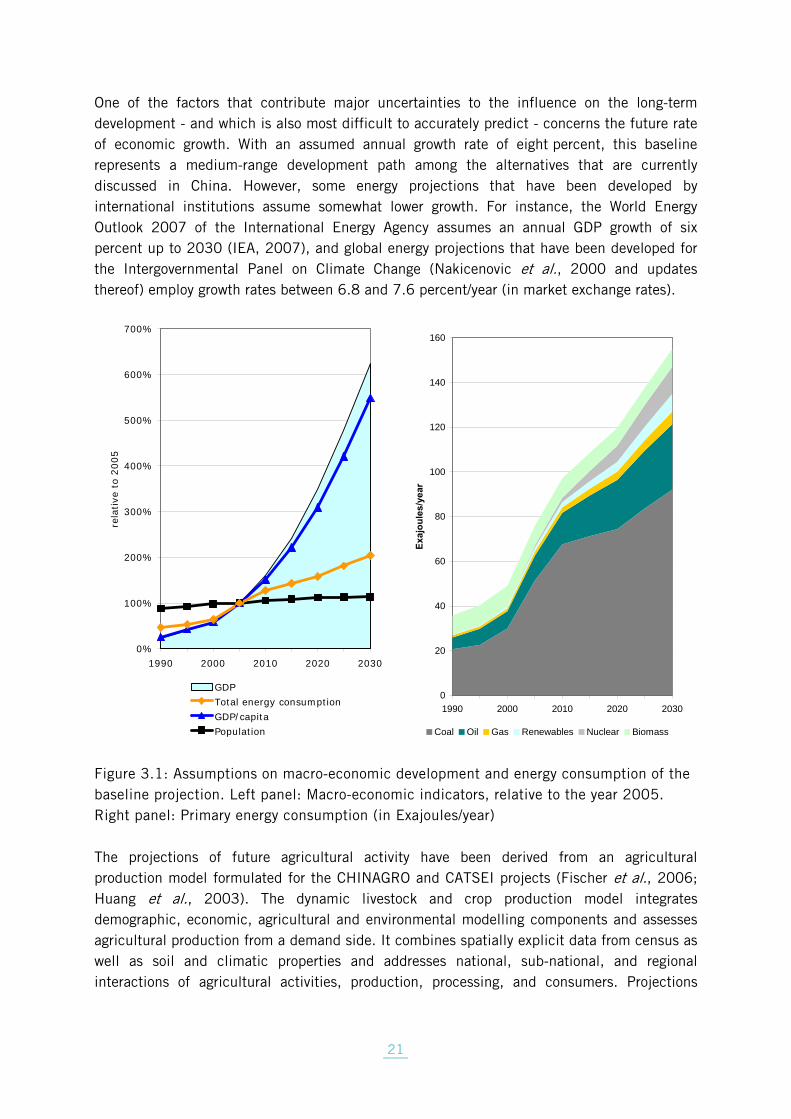
One of the factors that contribute major uncertainties to the influence on the long-term development - and which is also most difficult to accurately predict - concerns the future rate of economic growth. With an assumed annual growth rate of eight percent, this baseline represents a medium-range development path among the alternatives that are currently discussed in China. However, some energy projections that have been developed by international institutions assume somewhat lower growth. For instance, the World Energy Outlook 2007 of the International Energy Agency assumes an annual GDP growth of six percent up to 2030 (IEA, 2007), and global energy projections that have been developed for the Intergovernmental Panel on Climate Change (Nakicenovic et al., 2000 and updates thereof) employ growth rates between 6.8 and 7.6 percent/year (in market exchange rates).
0%
100%
200%
300%
400%
500%
600%
700%
1990 2000 2010 2020 2030
rela
tive
to
2005
GDPTotal energy consumptionGDP/capitaPopulation
0
20
40
60
80
100
120
140
160
1990 2000 2010 2020 2030
Exaj
oule
s/ye
ar
Coal Oil Gas Renewables Nuclear Biomass
Figure 3.1: Assumptions on macro-economic development and energy consumption of the baseline projection. Left panel: Macro-economic indicators, relative to the year 2005. Right panel: Primary energy consumption (in Exajoules/year)
The projections of future agricultural activity have been derived from an agricultural production model formulated for the CHINAGRO and CATSEI projects (Fischer et al., 2006; Huang et al., 2003). The dynamic livestock and crop production model integrates demographic, economic, agricultural and environmental modelling components and assesses agricultural production from a demand side. It combines spatially explicit data from census as well as soil and climatic properties and addresses national, sub-national, and regional interactions of agricultural activities, production, processing, and consumers. Projections

___ 22
include, on the scale of Chinese counties, numbers of each type of animals, milk production, and area of cultivated land, grassland and histosols, N fertilizer application, N input into agriculture from crop residues. The animal production is divided into grazing, industrial, special and traditional systems. Additional assumptions on the shares of liquid vs. solid systems had to be taken for each of the systems and animal types to match results with data useable in GAINS. The model has been applied to different economic growth scenarios in China, with different regional consequences in terms of population growth and urbanization.
The resulting growth rates differ by animal category, fertilizer type as well as by province. Total cattle numbers are expected not to change significantly until 2030, while the number of pigs and poultry are projected to increase by 30 and 60 percent, respectively. Fertilizer consumption is expected to grow by 20 percent (Figure 3.2).
0%
20%
40%
60%
80%
100%
120%
140%
160%
180%
2000 2005 2010 2015 2020 2025 2030
Rela
tive
to
20
05
Cattle Pigs Chicken Fertilizer use
Figure 3.2: Projections of agricultural activities for China
3.2 Baseline projections for air pollution emissions It is obvious that, as a consequence of sharply increasing fuel consumption in China, emissions of air pollutants and greenhouse gases will grow accordingly unless stricter measures for controlling emissions will be taken in the future. The exact level of future emissions will therefore be critically determined by the extent to which emissions will be controlled through targeted policy interventions.
To assess cost-effective policy interventions that maintain acceptable levels of air quality, a baseline projection is developed as a reference case. This baseline projection explores the likely development of air pollution and greenhouse gas emissions as well as their local

___ 23
impacts under the assumptions that (i) currently existing policies and regulations on air pollution control measures were fully implemented as foreseen, and (ii) that no additional measures were adopted. The baseline projection explicitly considers the impacts of the implementation of emission control measures for stationary and mobile sources as summarized in Table 3.2. It is assumed that the implementation of these measures will follow current practices.
Table 3.2: Emission control measures assumed in the baseline
Stationary sources Mobile sources
• Large combustion plants:
o Electrostatic precipitators (ESP) at large combustion plants to control emissions of particulate matter, with high removal efficiency (99%) for all plants built after 2005
o Less efficient ESP for large plants built before 2005
o Increasing penetration of flue gas desulphurization (FGD) after 2005 in new and existing plants
• Small to medium combustion plants in the power sector and industry:
o Cyclones or less efficient ESP for plants built before 2005
o Significant share of plants using low sulphur coal (0.6% S) already in 2005
o Increasing penetration of in-furnace sulphur controls (limestone injection) and to some extent also FGD after 2005 in new plants
• Two-wheelers:
o Euro-II (Stage-II) controls after 2003
o Euro-III (Stage-III) controls after 2006
• Light duty and heavy duty vehicles(*):
o Euro-1/I after 2000
o Euro-2/II after 2004
o Euro-3/III after 2006
o Euro-4/IV after 2010
o Euro V after 2012
• Off-road machinery (agricultural and construction):
o Euro-1/I after 2007
o Euro-2/II after 2009
• Low sulphur gasoline (10 ppm) from 2010
• Low sulphur diesel (10 ppm) from 2010
*) ln larger cities (e.g., Beijing, Shanghai) implementation of some measures occurs up to two years earlier
With full implementation of the legislation on air pollution emissions as outlined in Table 3.2, emissions of SO2 should stabilize approximately at the 2005 levels up to 2030 (Figure 3.3). Phase-out of solid fuels from small sources in households will gradually reduce primary emissions of PM2.5, so that they should be 10 percent lower in 2030. In contrast, current legislation will not be sufficient to prevent further increases in NOx. While the introduction of stringent legislation on mobile sources will compensate for further growth in transport volumes, emissions from large stationary sources in the power sector and in industry are expected to increase significantly. In total, it is expected that Chinese NOx emissions would be 50 percent higher in 2030 than today. Significant growth in mineral N-fertilizer application and livestock and no change in agricultural practice will result in an increase of

___ 24
NH3 emissions by 30 percent For VOC, declining emissions from the combustion of solid fuels in households are likely to be compensated by higher emissions from solvents and industrial activities.
0%
20%
40%
60%
80%
100%
120%
140%
160%19
90
2000
2010
2020
2030
1990
2000
2010
2020
2030
1990
2000
2010
2020
2030
1990
2000
2010
2020
2030
1990
2000
2010
2020
2030
SO2 NOx PM2.5 NH3 VOC
Rela
tive
to
20
05
Power generation Industry Domestic Transport Agriculture Other
Figure 3.3: Baseline projection of air pollutant emissions in China 1990-2030 by sector. Emissions are scaled to the level of total emissions in 2005.
In contrast to air pollutants, the lack of effective mitigation measures will lead to a strong increase in greenhouse gas emissions (Figure 3.4). The projected increase in economic activities would multiply CO2 emissions by more than a factor of four. CH4 and N2O emissions, which originate mainly from agricultural activities, are expected to increase by 50 percent. As a consequence, total greenhouse gas emissions would triple.

___ 25
0%
20%
40%
60%
80%
100%
120%
140%
160%
180%
200%
1990
2000
2010
2020
2030
1990
2000
2010
2020
2030
1990
1995
2000
2005
2010
2015
2020
2025
2030
1990
1995
2000
2005
2010
2015
2020
2025
2030
CO2 CH4 N2O All GHGs
Rela
tive
to
20
05
Power generation Industry Domestic Transport Agriculture Other
Figure 3.4: Baseline projection of greenhouse gas emissions in China 1990-2030 by sector. Emissions are scaled to the level of total emissions in 2005.
It is important to realize that the baseline emission projection assumes as an integral part the implementation of dedicated emission control measures as listed in Table 3.2. Thus, the baseline projection takes into consideration that significant economic resources will be spent for air pollution control. For 2005, the costs of implemented pollution control measures are estimated at €14.6 billion or 0.37 percent of the GDP. About half of the costs emerged for control of PM emissions from industrial facilities, one quarter for PM and SO2 controls in the power sector and 17 percent for controlling emissions from road transport. In 2030, implementation of current emission control laws would involve costs of €90 billion, or 0.68 percent of GDP (expressed in PPP).
Table 3.3: Air pollution control costs in 2005 and 2030 in China
2005 2030 baseline billion €/yr % of GDP billion €/yr % of GDP POWER GENERATION 4.0 0.10% 15.7 0.12% INDUSTRY 7.6 0.19% 21.9 0.16% DOMESTIC 0.4 0.01% 0.6 0.00% TRANSPORT 2.5 0.06% 52.2 0.39% AGRICULTURE 0.0 0.00% 0.0 0.00% TOTAL 14.6 0.37% 90.4 0.68% GDP (PPP) 3947 13342
___ 26
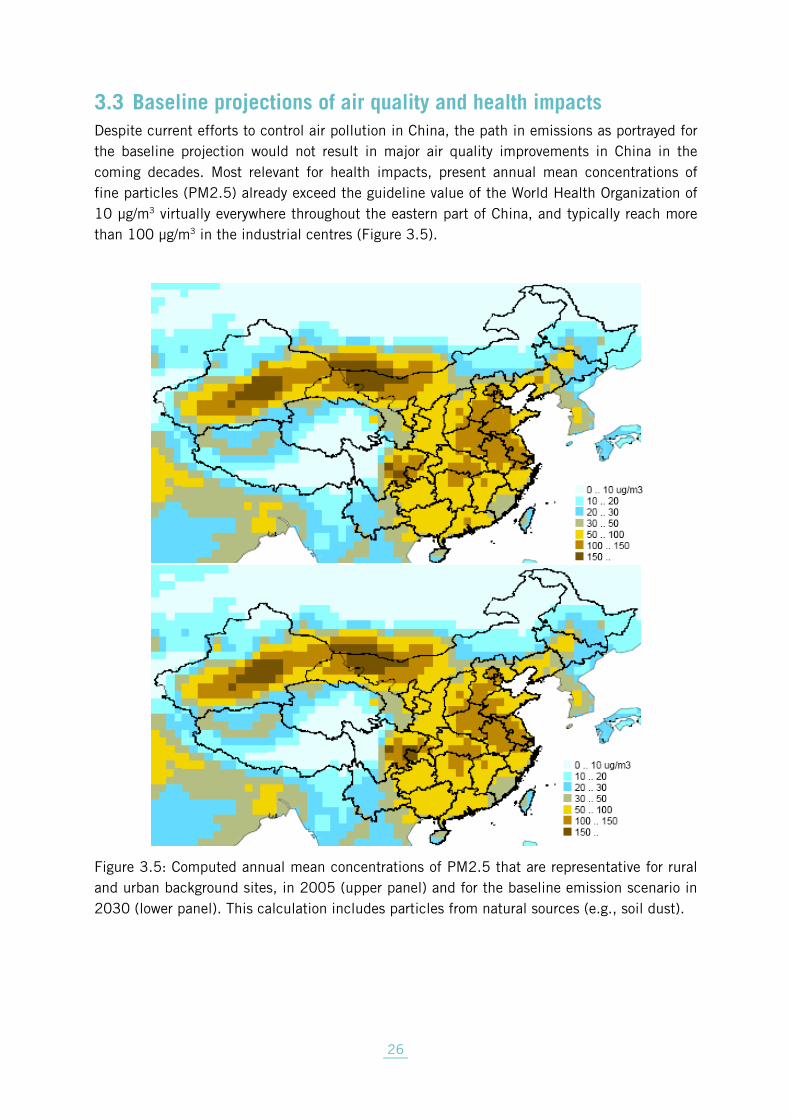
3.3 Baseline projections of air quality and health impacts Despite current efforts to control air pollution in China, the path in emissions as portrayed for the baseline projection would not result in major air quality improvements in China in the coming decades. Most relevant for health impacts, present annual mean concentrations of fine particles (PM2.5) already exceed the guideline value of the World Health Organization of 10 μg/m3 virtually everywhere throughout the eastern part of China, and typically reach more than 100 μg/m3 in the industrial centres (Figure 3.5).
Figure 3.5: Computed annual mean concentrations of PM2.5 that are representative for rural and urban background sites, in 2005 (upper panel) and for the baseline emission scenario in 2030 (lower panel). This calculation includes particles from natural sources (e.g., soil dust).

___ 27
This stagnation in ambient PM2.5 concentrations will not allow significant improvements in health impacts from outdoor pollution. For all of China, loss in statistical life expectancy that can be attributed to the exposure to PM2.5 from anthropogenic sources will remain in 2030 at 39 (21-53) months. Spatial variations in ambient PM2.5 concentrations lead to significant differences in health impacts across China; by in 2030, life shortening in Chongqing would amount to more than 60 (31-80) months, in contrast to Tibet for which 2 (1-3) months are calculated (Figure 3.6).
0
10
20
30
40
50
60
Anh
ui
Bei
jing
Cho
ngqi
ng
Fujia
n
Gan
su
Gua
ngdo
ng
Gua
ngxi
Gui
zhou
Hai
nan
Heb
ei
Hei
long
jiang
Hen
an
Hub
ei
Hun
an
Inne
r M
ongo
lia
Jian
gsu
Jian
gxi
Jilin
Liao
ning
Nin
gxia
Qin
ghai
Sha
anxi
Sha
ndon
g
Sha
ngha
i
Sha
nxi
Sic
huan
Tian
jin
Tibe
t Xiz
ang
Xin
jiang
Yunn
an
Zhe
jiang
Chi
na
Mon
ths
2005 2030 CLE
Figure 3.6: Loss in statistical life expectancy attributable to the outdoor exposure of fine particulate matter computed for 2005 and the 2030 baseline projection (central estimate)
While for an individual Chinese citizen loss in statistical life expectancy would remain at current levels in the coming two decades, total health impacts from outdoor pollution would increase. This is caused by the general growth in the Chinese population and enhanced by the ongoing aging process of the society, which will increase the number of people older than 30 years for which health impacts are estimated, from 687 million in 2005 to 925 million in 2030. Together, these factors will increase the total number of life years that are lost due to outdoor pollution from 56 to 76 million years lost/year.
In contrast to outdoor sources, health impacts from indoor pollution are expected to decline by about 40 percent despite growing population (Table 3.4). This is a direct consequence of the phase-out of solid fuel combustion in households that is assumed in the baseline energy projection. Although the reduced consumption of solid fuels in households will cause less health impacts from indoor exposure, it will cause higher health damage through outdoor
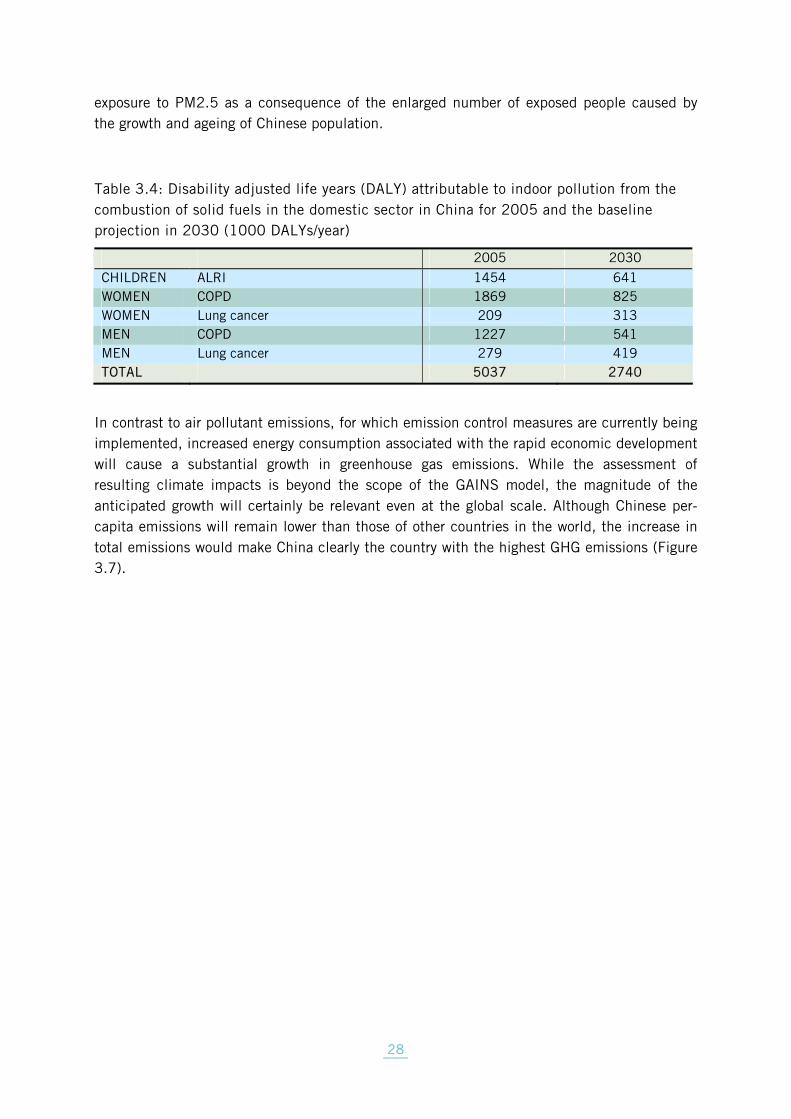
___ 28
exposure to PM2.5 as a consequence of the enlarged number of exposed people caused by the growth and ageing of Chinese population.
Table 3.4: Disability adjusted life years (DALY) attributable to indoor pollution from the combustion of solid fuels in the domestic sector in China for 2005 and the baseline projection in 2030 (1000 DALYs/year)
2005 2030
CHILDREN ALRI 1454 641 WOMEN COPD 1869 825 WOMEN Lung cancer 209 313 MEN COPD 1227 541 MEN Lung cancer 279 419 TOTAL 5037 2740
In contrast to air pollutant emissions, for which emission control measures are currently being implemented, increased energy consumption associated with the rapid economic development will cause a substantial growth in greenhouse gas emissions. While the assessment of resulting climate impacts is beyond the scope of the GAINS model, the magnitude of the anticipated growth will certainly be relevant even at the global scale. Although Chinese per-capita emissions will remain lower than those of other countries in the world, the increase in total emissions would make China clearly the country with the highest GHG emissions (Figure 3.7).

___ 29
0
2
4
6
8
10
12
14
USA EU China India USA EU China India
2005 Baseline projections for 2030
Gt
CO
2eq
Power generation Industry Domestic Transport Agriculture Other
Figure 3.7: Greenhouse gas emissions of the USA, EU, China and India, 2005 and baseline projections for 2030, by sector

___ 30
4 Alternative policy scenarios As demonstrated in the preceding section, current emission control legislation will not be sufficient to substantially improve air quality in China. It will be shown in this section that application of a wide range of available measures that are not yet required by Chinese law can reduce emissions and thereby lead to better air quality. Thus, there is a wide field of possible policy interventions to achieve more sustainable living conditions in terms of air quality. However, there are significant differences in the effectiveness and costs of the available measures, so that ill-designed pollution control strategies might place unnecessary burdens on the economy.
This section explores the cost-effectiveness of alternative emission control strategies. It should be emphasized that the choice of the appropriate balance between the environmental ambition level and the willingness of a society to spend economic resources for achieving such levels is a genuinely political decision and certainly beyond the scope of a scientific analysis. Therefore, the scenarios presented in this paper illustrate basic features of different conceptual approaches towards improved air quality, and the power of an integrated perspective on pollution control that could substantially reduce the expenditure of economic resources compared to conventional approaches.
4.1 Uniform application of advanced emission control technologies for large sources
As shown before, with the presently expected economic growth the current implementation schedule of further emission control measures will not be sufficient for reducing air pollution in China.
Industrialized countries in the West have demonstrated that the growth in air pollution emission can be successfully decoupled from economic growth through the application of advanced end-of-pipe emission control technologies. Such measures include, inter alia, flue gas desulfurization to reduce SO2 emissions, selective catalytic reduction to reduce NOx emissions from large boilers, high-efficiency devices to control particle emissions from boilers and industrial processes, and advanced control technologies for light and heavy duty vehicles. Such control measures are widely applied in industrialized countries, and often requested from all installations in order to avoid distortion of economic competitiveness across different companies.
A scenario is analyzed which assumes for 2030 the full implementation of the above mentioned measures to all relevant emission sources in China. Thereby, the scenario explores a situation where advanced end-of-pipe technologies for controlling SO2, NOx and PM emissions for large stationary sources in the power sector and industry) and for light and heavy duty vehicles are applied in all of China. However, no further controls beyond current legislation are assumed for VOC emissions and for the domestic sector. Such a widespread and undiscriminating application of advanced emission control technologies could substantially reduce future emissions in China below the baseline case (Table 4.1). In particular, SO2 emissions could be cut by more than half compared to 2005; NOx emissions

___ 31
could be one third lower than in 2005, and PM2.5 emissions would be cut by two thirds. However, the across-the-board application of advanced technologies comes at certain costs. By 2030, air pollution control costs would increase to €174 billion/yr, or 1.3 percent of the GDP. While this is substantially higher than the €90 billion/yr (0.68% of GDP) of the current legislation case, it should be remembered that the underlying economic projection for 2030 assumes GDP to grow by 450 percent (in Market Exchange Rates) or by 200 percent (based on Purchasing Power Parity).
Table 4.1: Emissions (kt) and control costs (billion €/yr) of the Advanced Control Technology (ACT) scenario in 2030 compared to the Current Legislation (CLE) scenario and the estimates for the year 2005
SO2 NOx PM2.5 Costs 2005 2030 2005 2030 2005 2030 2005 2030 CLE ACT CLE ACT CLE ACT CLE ACT POWER 15.6 10.8 2.9 4.6 7.6 2.3 0.9 1.7 0.3 4.0 15.7 26.5INDUSTRY 13.3 17.5 9.3 7.3 11.6 5.2 5.7 5.3 1.0 7.6 21.9 52.4DOMESTIC 2.1 2.8 2.8 0.9 0.9 0.9 4.6 2.7 2.7 0.4 0.6 0.9 TRANSPORT 0.4 0.5 0.0 4.1 4.3 2.3 0.5 0.3 0.2 2.5 52.2 90.7AGRICULT. 0.0 0.0 0.0 0.0 0.0 0.0 0.9 0.9 0.2 0.0 0.0 0.3 OTHER 0.0 0.0 0.0 0.0 0.0 0.0 0.2 0.3 0.2 0.0 0.0 3.1 TOTAL 31.5 31.6 15.0 16.9 24.4 10.7 12.7 11.1 4.6 14.6 90.4 173.8 % OF GDP 0.37% 0.68% 1.30%
While such a pollution control strategy would involve considerable economic resources, it also results in significant health and environmental benefits. Population-weighted ambient concentrations of PM2.5 would decline from 80 μg/m3 in the baseline case to 45 μg/m3 (Figure 4.1). Thereby, by 2030 cleaner air would reduce the loss in statistical life expectancy attributable to fine particles from 39 months in the current legislation case to 22 (12-30) months. Since the strategy focuses on controls of large emission sources, however, health impacts from indoor pollution would not be affected. (Table 4.4).

___ 32
Figure 4.1: Ambient concentrations of PM2.5 computed for the Current Legislation (CLE) case in 2030 (top panel) and the Advanced Control Technology (ACT) case (bottom panel), including dust from natural sources
The reductions in precursor emissions would also lead to lower concentrations of ground-level ozone, and thereby to less health impacts and crop damage. The changes in emissions (especially of NOx) would lead to an increase in the cases of premature deaths that are attributable to the exposure to ground-level ozone by more than 10 percent between 2005 and 2030. In contrast, application of advanced control technologies would reduce health impacts from ozone by 20 percent compared to 2005, or 28 percent if compared to the baseline projection (Table 4.2).

___ 33
Table 4.2: Cases of premature deaths that are attributable to the exposure to ground-level ozone, for 2005, the Baseline scenario in 2030 and the ACT scenario
2005 Baseline scenario 2030
Advanced control technology, 2030
ANHUI 2410 2661 2075 BEIJING 457 494 396 CHONGQING 759 859 520 FUJIAN 1299 1515 1036 GANSU 799 965 596 GUANGDONG 2335 2666 1874 GUANGXI 1269 1464 882 GUIZHOU 1063 1261 688 HAINAN 279 311 222 HEBEI 3069 3282 2583 HEILONGJIANG 158 195 126 HENAN 3626 3885 2863 HUBEI 2201 2470 1657 HUNAN 2604 2926 1931 INNER MONGOLIA 630 747 515 JIANGSU 2962 3327 2695 JIANGXI 1577 1841 1231 JILIN 497 559 425 LIAONING 1706 1844 1495 NINGXIA 142 172 110 QINGHAI 162 196 129 SHAANXI 1378 1621 1032 SHANDONG 4277 4536 3655 SHANGHAI 408 501 372 SHANXI 1446 1615 1180 SICHUAN 2810 3044 1975 TIANJIN 286 308 236 TIBET XIZANG 121 127 120 XINJIANG 342 393 299 YUNNAN 900 1011 705 ZHEJIANG 1529 1748 1359 TOTAL 43497 48539 34980
In addition, lower emissions also reduce concentrations of ground-level ozone and thereby impacts on human health and vegetation. As an example, Figure 4.2 compares potential crop losses for wheat, which would be halved by the measures of the ACT scenario.

___ 34
Table 4.3: Potential losses of agricultural production due to ground-level ozone, for the year 2005 and the Current Legislation (CLE) and Advanced Control Technology (ACT) scenarios in 2030, (in kilotons)
Rice Wheat Soybean 2005 CLE ACT 2005 CLE ACT 2005 CLE ACT ANHUI 305 355 263 525 593 448 68 77 54 BEIJING 1 1 1 149 161 117 1 1 1 CHONGQING 69 80 43 55 67 35 5 6 3 FUJIAN 108 137 75 13 15 10 0 0 0 GANSU 1 1 0 163 203 114 3 4 2 GUANGDONG 160 197 112 3 4 2 0 0 0 GUANGXI 110 139 65 4 4 3 1 1 0 GUIZHOU 56 75 30 66 80 40 2 3 0 HAINAN 9 11 5 0 0 0 0 0 0 HEBEI 10 11 8 1513 1613 1161 46 50 36 HEILONGJIANG 3 4 2 10 14 8 21 29 14 HENAN 64 72 47 1186 1323 901 92 102 67 HUBEI 449 511 325 231 254 168 43 53 28 HUNAN 639 761 445 31 34 21 4 5 2 I. MONGOLIA 0 1 0 148 177 118 1 2 1 JIANGSU 197 230 176 630 715 572 65 76 57 JIANGXI 464 587 333 13 15 11 2 3 1 JILIN 2 2 2 18 21 15 33 41 26 LIAONING 5 6 4 137 147 110 28 33 24 NINGXIA 5 7 3 65 81 48 0 0 0 QINGHAI 0 0 0 16 22 10 0 0 0 SHAANXI 6 8 4 326 387 225 24 31 15 SHANDONG 3 3 2 3037 3287 2449 92 100 74 SHANGHAI 7 9 6 6 8 5 2 3 2 SHANXI 0 0 0 281 315 210 6 7 4 SICHUAN 258 292 166 267 298 173 24 27 15 TIANJIN 1 1 1 95 102 73 5 5 4 TIBET-X. 0 0 0 0 0 0 0 0 0 XINJIANG 0 0 0 61 67 57 0 0 0 YUNNAN 23 25 18 150 157 135 1 1 0 ZHEJIANG 251 299 220 49 57 42 5 5 4 TOTAL 3205 3822 2355 9248 10219 7280 573 666 434

___ 35
Figure 4.2: Potential crop losses for wheat computed for the Current Legislation (CLE) case in 2030 (top panel) and the Advanced Control Technology (ACT) case (bottom panel)
In summary, full application of advanced emission control measures to large sources could substantially reduce emissions in the future, which would lead to significantly improved air quality and lower air pollution damage to human health, agricultural crops and the natural environment (Table 4.4).

___ 36
Table 4.4: Comparison of impact indicators for the Current Legislation (CLE) and Advanced Control Technology (ACT) scenarios in 2030, compared to the estimates for 2005
2005 2030 CLE
2030 ACT
LOSS IN STATISTICAL LIFE EXPECTANCY Months 39.4 39.2 22.4 YEARS OF LIFE LOST (YOLLS) FROM OUTDOOR POLLUTION
Million years/yr 56.4 75.6 43.1
DISABILITY ADJUSTED LIFE YEARS FROM INDOOR POLLUTION
Million years/yr 5.0 2.7 2.7
CASES OF PREMATURE DEATHS FROM GROUND-LEVEL OZONE
1000 cases/yr 45.5 48.5 35.0
POTENTIAL CROP LOSS FOR RICE Million tons/yr 3.2 3.8 2.4 POTENTIAL CROP LOSS FOR WHEAT Million tons/yr 9.2 10.2 7.3 POTENTIAL CROP LOSS FOR SOYBEAN Million tons/yr 0.6 0.7 0.4
4.2 Cost-effective allocation of end-of-pipe air pollution controls As shown above, full application of advanced emission control technology that is currently available on the world market can substantially reduce air pollution impacts in China. However, while such a uniform across-the-board strategy would cut, for instance, the loss in statistical life expectancy by 43 percent compared to the baseline case, its implementation would require substantial costs and would increase the share of air pollution control costs in total GDP from 0.37 percent in 2005 to 1.3 percent in 2030. Although this fraction is small in comparison to the projected increase in China’s total GDP (+240 percent in PPP between 2005 and 2030), it is higher than what industrialized countries typically spend on air pollution controls.
Numerous policy applications of the RAINS model in Europe have demonstrated that a uniform across-the-board application of advanced emission control measures is usually not a cost-effective way of improving air quality, and that a carefully selected portfolio of measures can achieve the same health and environmental benefits at much lower costs. The GAINS optimization offers a practical tool for a systematic search for a balance of measures across economic sectors and locations that attain exogenously specified environmental targets at least cost.
To explore the potential cost savings from such an approach for China, an alternative emission control scenario has been developed that identifies the cost-effective portfolio of measures that achieves the same health benefits as would result from the across-the-board application of advanced control technologies (i.e., the ACT case as described above). This scenario assumes the same levels of economic activities (i.e., energy consumption, traffic volumes, industrial production, and agricultural activities) as the baseline projection and explores alternative allocations of air pollution emission control measures that achieve the same number of life years lost from PM2.5 as computed for the ACT scenario at lower overall costs. The calculation assumes that measures that are laid down in current Chinese air pollution

___ 37
legislation will be maintained, so that only additional measures that are currently not legally required are considered.
Table 4.5: Emissions in 2030, for the Current Legislation (CLE) case, the scenario with across-the-board application of advanced control technologies (ACT) and the cost-effective allocation determined with the GAINS model (OPT), kilotons
SO2 NOx PM2.5 CLE ACT OPT CLE ACT OPT CLE ACT OPT POWER GENERATION
10758 2933 3265 7592 2342 4646 1650 276 505
INDUSTRY 17499 9259 11648 11645 5232 6189 5340 993 1428 DOMESTIC 2769 2769 1814 905 888 905 2728 2728 1409 TRANSPORT 529 18 529 4251 2252 4251 279 176 279 AGRICULTURE 26 0 0 24 0 0 878 150 153 OTHER 0 0 0 0 0 0 258 248 247 TOTAL 31581 14978 17256 24417 10714 15990 11133 4571 4020
To increase the cost-effectiveness of the control strategy, the allocation of emission control measures across pollutants, economic sectors and provinces is adjusted. In terms of pollutants, the cost minimizing approach reduces less SO2 and NOx emissions compared to the uniform ACT case, but puts higher emphasis on the control of PM emissions (Table 4.5).
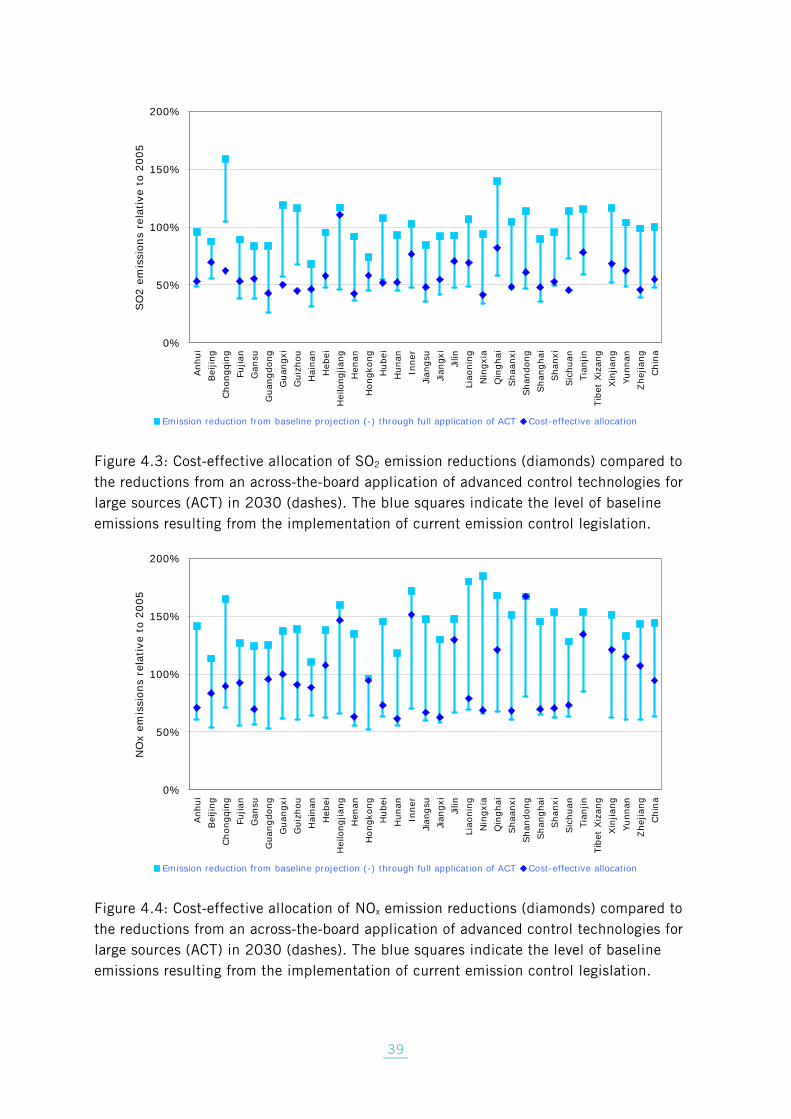
Cost savings can also be accrued by emphasizing measures at sources that make the largest contribution to population exposure, and relieving the pressure on other sources that contribute less. There is a large cost saving potential by a geographical reallocation of further control measures, to reflect differences in population densities across China and regional differences in the control potentials and costs for different pollutants. Table 4.6 compares the cost-effective allocation of measures for SO2, NOx and PM emissions across provinces with the distribution resulting from an across-the-board application of advanced emission control technologies. Differences are represented in graphical form in Figure 4.3 to Figure 4.5.

___ 38
Table 4.6: Air pollution emissions by province for 2005 and 2030, for the Current legislation (CLE) baseline projection, the case with across-the-board application of advanced control technologies for large sources (ACT) and the cost-effective allocation determined with the GAINS model (OPT), in kilotons
SO2 NOx PM2.5 2005 CLE ACT OPT 2005 CLE ACT OPT 2005 CLE ACT OPT ANHUI 1143 1095 556 607 753 1064 459 534 614 498 263 162 BEIJING 450 394 248 314 285 323 152 238 115 111 67 35 CHONGQING 928 1474 973 578 308 508 220 275 217 191 79 61 FUJIAN 458 409 176 243 323 410 181 298 175 155 52 61 GANSU 371 309 141 205 279 347 158 195 214 168 74 76 GUANGDONG 1706 1431 441 730 1022 1280 543 978 638 486 189 195 GUANGXI 737 877 422 370 312 428 193 312 397 281 139 165 GUIZHOU 758 881 514 340 285 396 172 259 234 215 105 93 HAINAN 62 42 19 29 64 70 41 56 107 58 46 29 HEBEI 2211 2108 1059 1279 1170 1613 728 1258 941 827 315 217 HEILONGJIANG 460 538 213 509 555 886 364 814 404 339 185 229 HENAN 1638 1504 601 696 876 1182 488 553 815 713 224 159 HONGKONG 21 16 10 12 213 205 111 201 17 15 10 14 HUBEI 1288 1386 705 666 688 1000 435 503 597 472 213 152 HUNAN 745 693 336 389 425 501 235 261 452 391 177 174 I. MONGOLIA 518 533 246 397 375 645 264 568 355 303 152 96 JIANGSU 2179 1844 768 1048 1220 1798 731 817 1007 881 323 214 JIANGXI 536 493 222 293 316 410 184 198 329 294 122 119 JILIN 1830 1695 869 1291 943 1395 630 1224 574 523 238 146 LIAONING 1221 1302 596 845 559 1007 388 441 321 346 120 216 NINGXIA 316 296 108 131 115 212 76 79 76 86 27 27 QINGHAI 74 103 43 61 71 120 48 86 53 64 19 23 SHAANXI 912 954 427 440 337 510 206 231 270 281 113 77 SHANDONG 1337 1520 625 814 815 1362 658 1362 212 284 97 92 SHANGHAI 2791 2506 993 1339 1393 2026 908 971 1137 917 332 229 SHANXI 1927 1839 952 1016 709 1087 445 501 470 499 123 104 SICHUAN 1773 2019 1284 806 566 726 357 415 854 571 337 225 TIANJIN 537 620 315 420 568 873 481 763 120 123 57 42 TIBET XIZANG 4 39 10 39 9 75 24 73 14 28 11 28 XINJIANG 397 463 205 271 240 364 149 291 157 144 61 94 YUNNAN 447 465 216 278 300 399 181 345 319 262 109 139 ZHEJIANG 1752 1731 687 802 831 1194 502 890 524 607 193 327 TOTAL 31528 31581 14978 172561692624417107141599012725 11133 4 5 7 1 4 0 2 0
___ 39
0%
50%
100%
150%
200%
Anh
uiBei
jing
Cho
ngqi
ngFu
jian
Gan
suG
uang
dong
Gua
ngxi
Gui
zhou
Hai
nan
Heb
eiH
eilo
ngjia
ngH
enan
Hon
gkon
gH
ubei
Hun
anIn
ner
Jian
gsu
Jian
gxi
Jilin
Liao
ning
Nin
gxia
Qin
ghai
Sha
anxi
Sha
ndon
gSha
ngha
iSha
nxi
Sic
huan
Tian
jinTi
bet
Xiz
ang
Xin
jiang
Yunn
anZhe
jiang
Chi
na
SO
2 em
issi
ons
rela
tive
to
2005
Emission reduction from baseline projection (-) through full application of ACT Cost-effective allocation
Figure 4.3: Cost-effective allocation of SO2 emission reductions (diamonds) compared to the reductions from an across-the-board application of advanced control technologies for large sources (ACT) in 2030 (dashes). The blue squares indicate the level of baseline emissions resulting from the implementation of current emission control legislation.
0%
50%
100%
150%
200%
Anh
uiBei
jing
Cho
ngqi
ngFu
jian
Gan
suG
uang
dong
Gua
ngxi
Gui
zhou
Hai
nan
Heb
eiH
eilo
ngjia
ngH
enan
Hon
gkon
gH
ubei
Hun
anIn
ner
Jian
gsu
Jian
gxi
Jilin
Liao
ning
Nin
gxia
Qin
ghai
Sha
anxi
Sha
ndon
gSha
ngha
iSha
nxi
Sic
huan
Tian
jinTi
bet
Xiz
ang
Xin
jiang
Yunn
anZhe
jiang
Chi
na
NO
x em
issi
ons
rela
tive
to
2005
Emission reduction from baseline projection (-) through full application of ACT Cost-effective allocation
Figure 4.4: Cost-effective allocation of NOx emission reductions (diamonds) compared to the reductions from an across-the-board application of advanced control technologies for large sources (ACT) in 2030 (dashes). The blue squares indicate the level of baseline emissions resulting from the implementation of current emission control legislation.

___ 40
0%
50%
100%
150%
200%
Anh
uiBei
jing
Cho
ngqi
ngFu
jian
Gan
suG
uang
dong
Gua
ngxi
Gui
zhou
Hai
nan
Heb
eiH
eilo
ngjia
ngH
enan
Hon
gkon
gH
ubei
Hun
anIn
ner
Jian
gsu
Jian
gxi
Jilin
Liao
ning
Nin
gxia
Qin
ghai
Sha
anxi
Sha
ndon
gSha
ngha
iSha
nxi
Sic
huan
Tian
jinTi
bet
Xiz
ang
Xin
jiang
Yunn
anZhe
jiang
Chi
na
PM2.
5 em
issi
ons
rela
tive
to
2005
Emission reduction from baseline projection (-) through full application of ACT Cost-effective allocation
Figure 4.5: Cost-effective allocation of PM2.5 emission reductions (diamonds) compared to the reductions from an across-the-board application of advanced control technologies for large sources (ACT) in 2030 (dashes). The blue squares indicate the level of baseline emissions resulting from the implementation of current emission control legislation.
In terms of sectors, a cost-effective approach allocates more resources to control emissions from households. This transfer acknowledges the fact that (i) there is a significant potential for cheap emission reductions in the domestic sector that are not employed in the ACT strategy which focuses on emissions from large sources such as power plants and industrial boilers, and (ii) that emissions from low-level sources such as households make a larger contribution to population exposure than emissions from the high stacks of large sources. The environmental benefits of these additional controls of emissions from households allow less stringent emission controls in the power sector, which reduces the additional costs (on top of the CLE case) in this sector by one third. Also the need for pollution controls for industrial sources is substantially reduced, with costs declining by 75 percent. Further tightening of emission standards for mobile sources beyond what is already required by current legislation, though technically possible, turns out to be an economically inefficient means for improving health effects of air pollution as long as basic measures for controlling household emissions are not adopted. Overall, in such a cost-effective allocation, costs of additional measures that would cut health impacts by 43 percent would be 80 percent lower than in the case where advanced emission control technologies are applied to all sources across the board (Table 4.7).

___ 41
Table 4.7: Emission control costs by sector in 2030, for the Current Legislation (CLE) case, the scenario with across-the-board application of advanced control technologies (ACT) and the cost-effective allocation determined with the GAINS model (OPT), in billion €/yr
Total air pollution control costs Costs of additional measures on top of current legislation
CLE ACT OPT ACT OPT POWER GENERATION
15.7 26.5 22.7 10.8 6.9
INDUSTRY 21.9 52.4 29.7 30.5 7.8 DOMESTIC 0.6 0.9 3.4 0.3 2.9 TRANSPORT 52.2 90.7 52.2 38.5 0.0 AGRICULTURE 0.0 0.3 0.0 0.3 0.0 OTHER 0.0 3.1 0.1 3.1 0.1 TOTAL COSTS 90.4 173.8 108.1 83.5 17.7 % OF GDP 0.68% 1.30% 0.81% 0.63% 0.13%
0.0%
0.1%
0.2%
0.3%
0.4%
0.5%
0.6%
0.7%
Uniform application of advanced end-of-pipe technologies
Same health impacts, GAINS cost-effectiveness optimization
Cos
ts o
f fu
rthe
r ai
r po
llution
mea
sure
s in
203
0(%
of
GD
P (P
PP))
Power generation Industry Domestic Transport Other
Figure 4.6: Costs of additional emission controls (beyond the measures required by current legislation) of the ACT scenario (left column) and the cost-effective allocation determined with the GAINS model (right column) in the year 2030. Both scenarios achieve a 43 percent reduction in health effects from PM pollution.
___ 42
4.3 Cost-effective air pollution reductions including structural changes
It has been demonstrated in the above scenario that a targeted allocation of emission controls can lead to substantial cost savings. Obviously, the extent of possible cost savings is determined, inter alia, by the available scope for re-arranging emission control measures. In general, a larger scope for re-allocations increases the potential for cost savings. The portfolio of measures that is considered in the scenario above includes air pollution control measures in all sectors, and the cost savings of the optimized solution are achieved through re-allocation of these measures across sectors, pollutants and provinces.
However, air pollution emissions can be reduced not only through end-of-pipe measures. In general, air pollution emissions also decline if levels of anthropogenic activities that generate air pollution are reduced. Such changes could happen through technical measures, such as improved energy combustion efficiency, energy savings through, e.g., improved insulation, co-generation of heat and electricity, and through substitution of polluting fuels by cleaner fuels. Lower activity levels could also result from non-technical, behavioural changes, such as changes in transport modes, use of smaller vehicles, less living area heated, etc.
Since these non-technical measures require changes in personal life styles, they were traditionally beyond the portfolio of air quality managers. This also applies to most of the technical interventions that imply structural changes in the energy systems with direct implications on national energy policies. With growing concern about greenhouse gas emissions, however, such measures are now increasingly considered by policy makers who deal with the negative impacts of emissions to the atmosphere.
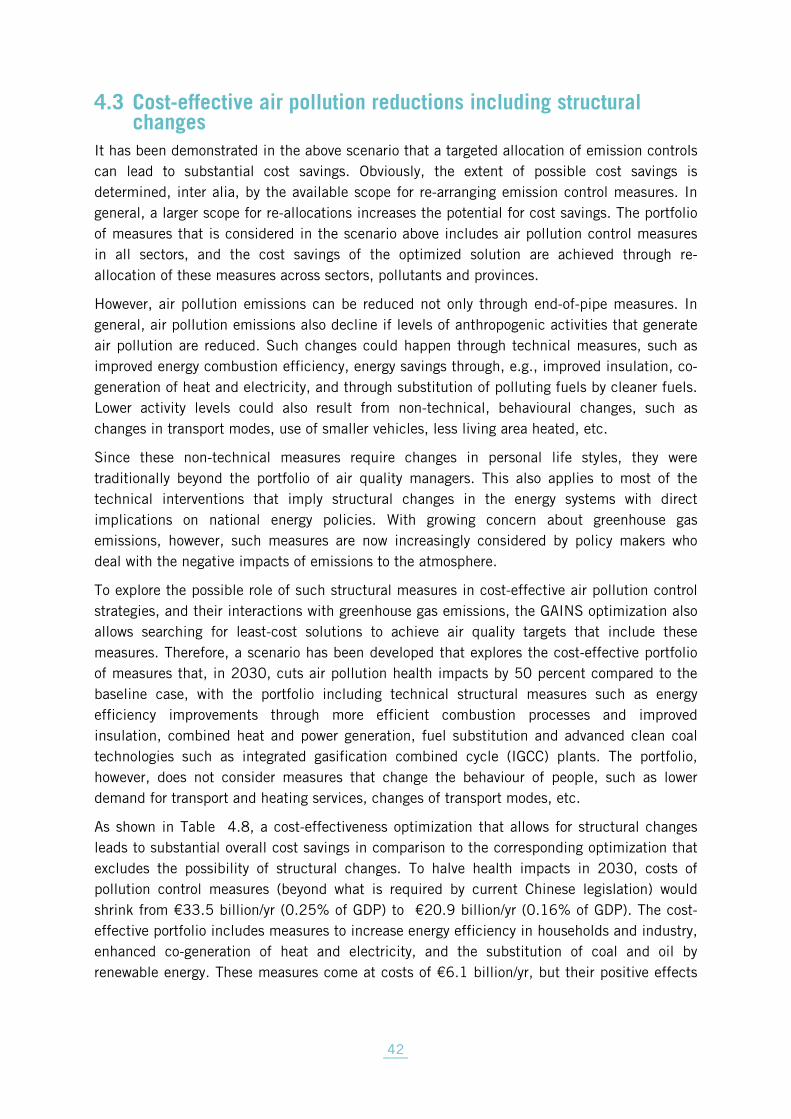
To explore the possible role of such structural measures in cost-effective air pollution control strategies, and their interactions with greenhouse gas emissions, the GAINS optimization also allows searching for least-cost solutions to achieve air quality targets that include these measures. Therefore, a scenario has been developed that explores the cost-effective portfolio of measures that, in 2030, cuts air pollution health impacts by 50 percent compared to the baseline case, with the portfolio including technical structural measures such as energy efficiency improvements through more efficient combustion processes and improved insulation, combined heat and power generation, fuel substitution and advanced clean coal technologies such as integrated gasification combined cycle (IGCC) plants. The portfolio, however, does not consider measures that change the behaviour of people, such as lower demand for transport and heating services, changes of transport modes, etc.
As shown in Table 4.8, a cost-effectiveness optimization that allows for structural changes leads to substantial overall cost savings in comparison to the corresponding optimization that excludes the possibility of structural changes. To halve health impacts in 2030, costs of pollution control measures (beyond what is required by current Chinese legislation) would shrink from €33.5 billion/yr (0.25% of GDP) to €20.9 billion/yr (0.16% of GDP). The cost-effective portfolio includes measures to increase energy efficiency in households and industry, enhanced co-generation of heat and electricity, and the substitution of coal and oil by renewable energy. These measures come at costs of €6.1 billion/yr, but their positive effects

___ 43
on air pollution emissions reduce the costs for further end-of-pipe air pollution control equipment that is required to meet the health target to €14.7 billion/yr (Figure 4.7).
Table 4.8: Costs of emission control measures for the GAINS optimization with air pollution measures only (left column) and the optimization with structural changes (billion €/yr)
GAINS optimization with end-of-pipe air
pollution control measures only
GAINS optimization with
structural measures
END-OF-PIPE AIR POLLUTION CONTROL MEASURES:
LARGE PLANTS, SO2 CONTROLS 13.7 2.8 LARGE PLANTS, NOX CONTROLS 9.9 6.1 LARGE PLANTS, PM CONTROLS 7.1 5.2 HOUSEHOLDS, PM CONTROL 2.9 0.6 SUB-TOTAL 33.5 14.7 STRUCTURAL MEASURES: ELECTRICITY SAVINGS, RENEWABLE ENERGY 0.6 CO-GENERATION OF HEAT AND POWER 2.9 ENERGY EFFICIENCY, INDUSTRY 0.4 ENERGY EFFICIENCY, HOUSEHOLDS 2.2 SUB-TOTAL 6.1 TOTAL 33.5 20.9

___ 44
0
5
10
15
20
25
30
35
GAINS optimization withair pollution end-of-pipe
measures only
Same health impacts,GAINS optimization
including greenhouse gasmitigation measuresC
osts
for
red
ucin
g he
alth
impa
cts
from
air p
ollu
tion
by
50%
(b
n €
in 2
030)
GHG measures:
Energy efficiency, households
Energy efficiency, industry
Co-generation of heat andpowerElectricity savings, renewableenergyAir pollution controls:
Households, PM control
Large Plants, PM controls
Large Plants, NOx controls
Large Plants, SO2 controls
Figure 4.7: Costs for reducing health effects of air pollution in 2030 by 50 percent. Note that the optimization that includes greenhouse gas mitigation measures results in eight percent less CO2 emissions as a side-benefit of air pollution control.
Inclusion of structural measures in the portfolio allow further reductions of primary particulate matter (PM2.5) beyond what end-of-pipe measures alone could deliver (Table 4.9). Given the fixed targets on health effects, the nine percent lower PM2.5 emissions relax the requirements for SO2 and NOx controls, so that emissions of these pollutants could be 10 percent higher than in the end-of-pipe only case. This reduced need for cuts in SO2 and NOx emissions, together with the lower baseline emissions of SO2 and NOx, lead to more than 50 percent lower emission control costs.
It is important to mention that, because these structural measures reduce the levels of energy consumption, they also lead to lower greenhouse gas emissions. Therefore, the inclusion of structural measures in the pollution control portfolio leads, as a side-effect, to eight percent lower CO2 emissions.
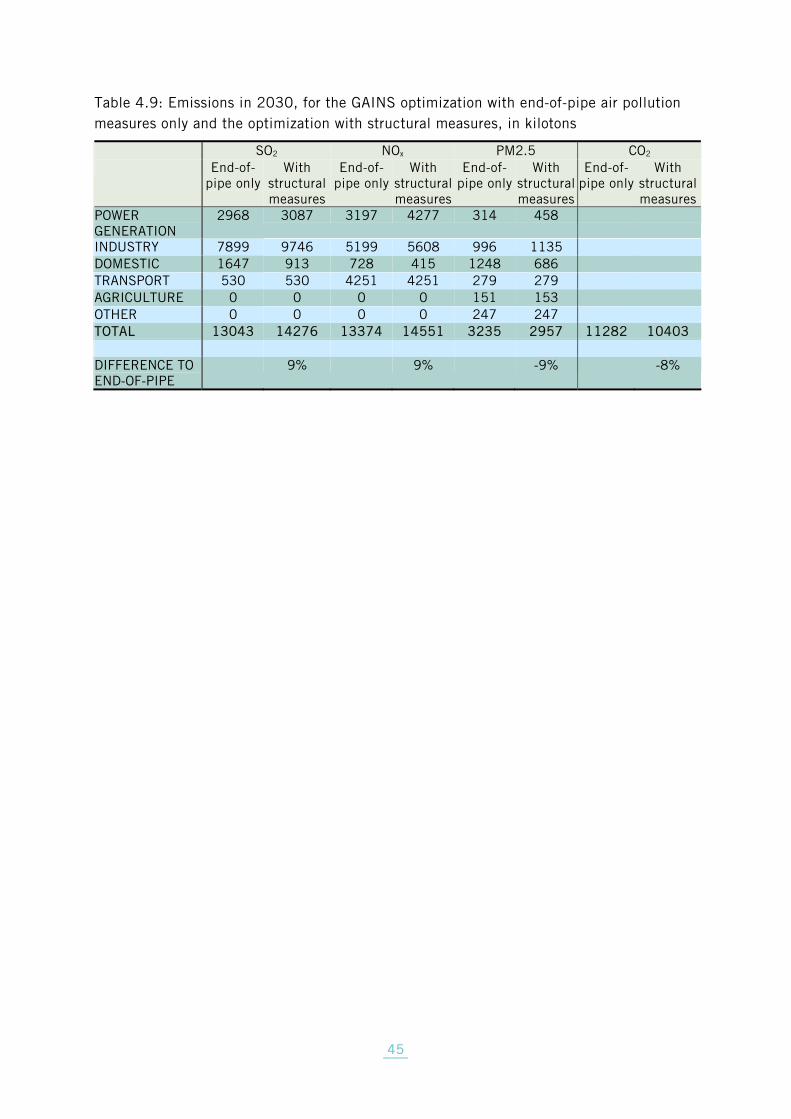
___ 45
Table 4.9: Emissions in 2030, for the GAINS optimization with end-of-pipe air pollution measures only and the optimization with structural measures, in kilotons
SO2 NOx PM2.5 CO2 End-of-
pipe only With
structural measures
End-of-pipe only
With structural measures
End-of-pipe only
With structural measures
End-of-pipe only
With structural measures
POWER GENERATION
2968 3087 3197 4277 314 458
INDUSTRY 7899 9746 5199 5608 996 1135 DOMESTIC 1647 913 728 415 1248 686 TRANSPORT 530 530 4251 4251 279 279 AGRICULTURE 0 0 0 0 151 153 OTHER 0 0 0 0 247 247 TOTAL 13043 14276 13374 14551 3235 2957 11282 10403 DIFFERENCE TO END-OF-PIPE
9% 9% -9% -8%

___ 46
4.4 Air pollution control through greenhouse gas mitigation strategies
As demonstrated above, certain greenhouse gas mitigation measures form part of a cost-effective portfolio of air pollution control measures. The question arises to what extent a strategy that aims at reducing greenhouse gas emissions would create positive co-benefits on air quality.
A scenario has been developed by the Chinese Energy Research Institute that outlines an alternative development of the energy system that responds to increased concerns on energy supply security and local environmental pressure. While the underlying assumptions on population growth and economic development are identical to those of the Baseline projection, the Alternative scenario quantifies the consequences of a wide range of practical policy interventions that aim at a more sustainable development path of the Chinese economy. The scenario assumes wide adoption of regulations and financial incentives to promote energy conservation and renewable energy and to accelerate the conversion of the Chinese economy towards less energy intensive industries. In particular, it is assumed that active promotion of new technologies and new efficiency standards for new buildings will increase energy efficiency in the end use sectors. New taxes on vehicles and energy consumption will reduce the growth in transport and energy demand, and the share of public transport in cities will be increased by 10-15 percent in 2030. The scenario also assumes the introduction of fuel-efficient vehicles (hybrid vehicle, compact cars, advanced diesel cars). The combustion efficiency of coal-fired power plants will increase to 40 percent by 2030.
With these assumptions, the Alternative scenario projects for 2030 26 percent less coal and 10 percent less oil consumption than the Baseline case. Natural gas consumption is 44 percent higher, and biomass use is increased by nine percent (Table 4.10, Figure 4.8).
Table 4.10: Fuel consumption in China in 2005 and in 2030, for the Baseline projection and the Alternative scenario (PJ)
2005 2030 Baseline projection 2030 Alternative scenario COAL 51315 91976 67985 OIL 11174 29350 26410 GAS 1836 5626 8094 RENEWABLES 1812 7926 8086 NUCLEAR 927 12157 12157 BIOMASS 8750 8013 8726 TOTAL 51315 91976 67985
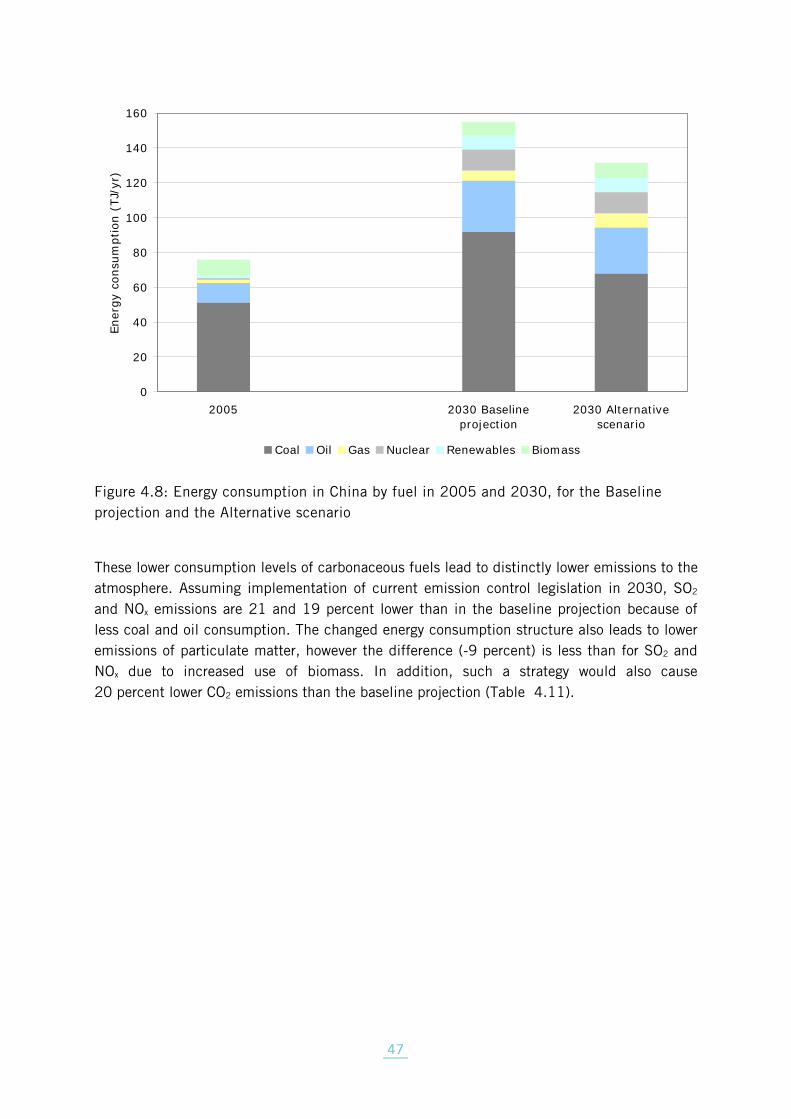
___ 47
0
20
40
60
80
100
120
140
160
2005 2030 Baselineprojection
2030 Alternativescenario
Ener
gy c
onsu
mpt
ion
(TJ/
yr)
Coal Oil Gas Nuclear Renewables Biomass
Figure 4.8: Energy consumption in China by fuel in 2005 and 2030, for the Baseline projection and the Alternative scenario
These lower consumption levels of carbonaceous fuels lead to distinctly lower emissions to the atmosphere. Assuming implementation of current emission control legislation in 2030, SO2 and NOx emissions are 21 and 19 percent lower than in the baseline projection because of less coal and oil consumption. The changed energy consumption structure also leads to lower emissions of particulate matter, however the difference (-9 percent) is less than for SO2 and NOx due to increased use of biomass. In addition, such a strategy would also cause 20 percent lower CO2 emissions than the baseline projection (Table 4.11).

___ 48
Table 4.11: Emissions of the Baseline projection and the Alternative scenario in 2030
SO2
(kt) NOx (kt)
PM2.5 (kt)
CO2 (Mt)
Baseline Alternative Baseline Alternative Baseline Alternative Baseline AlternativePOWER GENERATION
10758 8349 7592 5711 1650 1259 4802 3599
INDUSTRY 17499 14215 11645 9819 5340 5085 4716 3973 DOMESTIC 2769 1870 905 766 2728 2426 465 341 TRANSPORT 529 441 4251 3535 279 229 962 834 AGRICULT. 26 26 24 24 878 878 0 0 OTHER 0 0 0 0 258 258 336 253 TOTAL 31581 24901 24417 19855 11133 10136 11282 9001 DIFFERENCE TO BASELINE
-21% -19% -9% -20%
Obviously, such lower emissions cause lower health impacts through reduced levels of PM2.5 in ambient air. It is estimated that the Alternative scenario reduces the loss in statistical life expectancy that is attributable to PM2.5 to 34 (18-46) months, compared to 39 (21-53) months of the Baseline projection, i.e., by 13 percent.
It should be mentioned that these lower emissions and health impacts occur as a mere side benefit of the assumed energy policy measures, and not of stricter air pollution emission control legislation. In fact, such an alternative energy strategy would reduce costs for implementing current air pollution legislation by €13 billion/yr or 0.1 percent of GDP (Table 4.12 These saving are caused by the lower levels of coal and oil consumption which also require fewer installations of air pollution control equipment.
Table 4.12: Air pollution control costs for implementing current Chinese legislation to the activity levels of the Baseline projections and the Alternative scenario in 2030 (billion €/yr)
Baseline projection Alternative scenario POWER GENERATION 15.7 11.8 INDUSTRY 21.9 18.4 DOMESTIC 0.6 0.4 TRANSPORT 52.2 46.9 AGRICULTURE 0.0 0.0 OTHER 0.0 0.0 TOTAL 90.4 77.5 % OF GDP 0.68% 0.58%
At the moment the differences in costs between an energy policy that follows the Baseline projection and a strategy along the lines of the Alternative scenario cannot be quantified with the GAINS model. However, a comprehensive evaluation of the costs and benefits of these policy alternatives must include the cost savings from reduced air pollution controls as well as the health (and climate) benefits that result from lower emissions (Figure 4.9).

___ 49
0%
50%
100%
150%
200%
SO2 NOx PM2.5 Healthimpactsfrom airpollution
Costs ofair
pollutioncontrol
CO2
Rela
tive
to
20
05
Baseline projection Alternative scenario
Figure 4.9: Comparison of key indicators of the Baseline projection and the Alternative scenario for 2030

___ 50
5 Conclusions Current and future economic growth in China will counteract ongoing efforts to improve air quality through controls of sulphur dioxide (SO2) emissions from large stationary sources and nitrogen oxide (NOx) emissions from vehicles. Unless further air pollution policies are implemented, the increase in coal consumption that should fuel additional industrial production and provide more electricity to a wealthier population will largely compensate the positive effects of current efforts to control SO2 emissions in China. The lack of regulations for controlling emissions of NOx from large stationary sources is expected to lead to a 30 percent increase in China’s NOx emissions despite the tight emission control legislation that has been recently imposed for mobile sources. Thereby, without further air pollution control policies, negative impacts on human health and vegetation that are currently felt across China will not substantially improve in the coming decades. For instance, it is estimated that present exposure to fine particulate matter (PM2.5) is shortening life expectancy of the Chinese population by approximately 40 (21-53) months, and that it would stay at that level in a business-as-usual case for the coming decades. Emissions of greenhouse gases that contribute to global climate change would increase by approximately 80 percent by 2030.
Yet, advanced emission control technologies are available to maintain acceptable levels of air quality despite the pressure from growing economic activities. Fully applying existing technical end-of-pipe emission control measures in China can lead to substantial improvements in air quality. It is estimated that negative health impacts could be reduced by 43 percent by 2030 by applying such advanced emission control technology to all large sources in China. However, such an undifferentiated across-the-board approach would impose significant burdens on the economy, involving an additional expense of 0.63 percent of GDP.
In contrast, a cost-effective emission control strategy developed with the GAINS optimization tool that selectively allocates specific reduction measures across economic sectors, pollutants and regions, could achieve equal air quality improvements at only 20 percent of the costs of a conventional across-the-board approach. An integral element of such an air pollution control strategy will be measures to eliminate indoor pollution from the combustion of solid fuels. The investment will also reduce crop losses by around 50 percent and have far ranging positive impacts on the environment, but will not result in positive side-effects on greenhouse gas emissions.
Well-designed air pollution control strategies can also reduce emissions of greenhouse gases. An optimized scenario developed with the GAINS model demonstrates that low carbon strategies result in lower emissions of sulphur dioxide (SO2), nitrogen oxides (NOx) and fine particulate matter (PM) at no additional costs. GAINS estimates that each percent of CO2 reduction will typically reduce health impacts from fine particulate (PM) air pollution by one percent.
This also means that, for achieving given targets on ambient air quality, the cost of air pollution can be further reduced by adopting certain low carbon measures. A GAINS scenario

___ 51
demonstrates that the additional costs of some climate-friendly measures, e.g., energy efficiency improvements, co-generation of heat and power, fuel substitution, integrated coal gasification combined cycle (IGCC) plants, etc., are more than compensated for by savings in air pollution control equipment. By selecting a smart mix of measures to simultaneously cut air pollution and greenhouse gas emissions, China can almost halve air pollution control costs as well as lower greenhouse gas emissions by eight percent.
For policymakers, industry, NGOs and researchers wishing for more information and to conduct independent analyses, the GAINS-Asia model and documentation is freely available online at http://gains.iiasa.ac.at.

___ 52
References
ADB (2007). Key Indicators 2007: Inequality in Asia. Asian Development Bank, Manila, Philippines, http://www.adb.org/Documents/Books/Key_Indicators/2007/default.asp
Amann, M., I. Bertok, J. Borken, A. Chambers, J. Cofala, F. Dentener, C. Heyes, L. Hoglund, Z. Klimont, P. Purohit, P. Rafaj, W. Schöpp, G. Toth, F. Wagner and W. Winiwarter (2008a). GAINS-ASIA. A tool to combat air pollution and climate change simultaneously. Methodology report. International Institute for Applied Systems Analysis (IIASA), Laxenburg, Austria,
Amann, M., I. Bertok, J. Borken, A. Chambers, J. Cofala, F. Dentener, C. Heyes, J. Kejun, Z. Klimont, M. Makowski, R. Matur, P. Purohit, P. Rafaj, R. Sandler, W. Schöpp, F. Wagner and W. Winiwarter (2008b). GAINS-Asia. A tool to combat air pollution and climate change simultaneously., International Institute for Applied Systems Analysis (IIASA), Laxenburg, Austria,
Amann, M., R. Mathur, I. Bertok, J. Borken, J. Cofala, C. Heyes, Z. Klimont, P. Purohit, P. Rafaj, W. Schöpp, F. Wagner and W. Winiwarter (2008c). GAINS-Asia. Scenarios for cost-effective control of air pollution and greenhouse gases in India. International Institute for Applied Systems Analysis (IIASA), Laxenburg, Austria,
Barker, T., I. Bashmakov, A. Alharti, M. Amann, L. Cifuentes, J. Drexhage, M. Duan, O. Edenhofer, B. Flannery, M. Grubb, M. Hoogwijk, F. Ibitoye, C. J. Jepma, W. A. Pizer and K. Yamaji (2007). Mitigation from a cross-sectoral perspective. Climate Change 2007: Mitigation. Contribution of Working Group III to the Fourth Assessment Report of the Intergovernmental Panel on Climate Change. Cambridge, UK and New York, USA, Cambridge University Press.
Fischer, G., T. Ermolieva and H. van Velthuizen (2006). Livestock Production and Environmental Risks in China: Scenarios to 2030., International Institute for Applied Systems Analysis (IIASA), Laxenburg, Austria,
Hordijk, L. and M. Amann (2007). How Science and Policy Combined to Combat Air Pollution Problems. Environmenal Policy and Law 37(4): 336-340.
Huang, J., L. Zhang, Q. Li and H. Qiu (2003). CHINAGRO project: National and Regional Economic Development Scenarios for China's Food Economy Projections in the Early 21st Century., Center for Chinese Agricultural Policy, Chinese Academy of Sciences. , Beijing, China,
IEA (2007). World Energy Outlook. International Energy Agency, Paris, France, Nakicenovic, N., R. Swart, N. Nakicenovic, J. Alcamo, G. Davis, B. d. Vries, J. Fenhann, S.
Gaffin, K. Gregory and A. Gruebler (2000). Special Report on Emissions Scenarios. ISBN 0-521-80493-0, Working Group III of the Intergovernmental Panel on Climate Change (IPCC), Cambridge University Press, Cambridge, UK,
Smith, K. R., S. Mehta and M. M. Feuz (2004). Indoor air pollution from household solid fuel use. Comparative quantification of health risks: Global and regional burden of disease attributable to selected major risk factors. M. Ezzati, A. D. Lopez, A. Rodgers and C.J.L. Murray. Geneva, Switzerland, World Health Organization: 1435–1493.
Swart, R., M. Amann, F. Raes and W. Tuinstra (2004). A Good Climate for Clean Air: Linkages between Climate Change and Air Pollution. An Editorial Essay. Climatic Change 66(3): 263-269.