Gaining Insights to the importation of food to Sri Lanka ... · Gaining Insights to the importation...
6
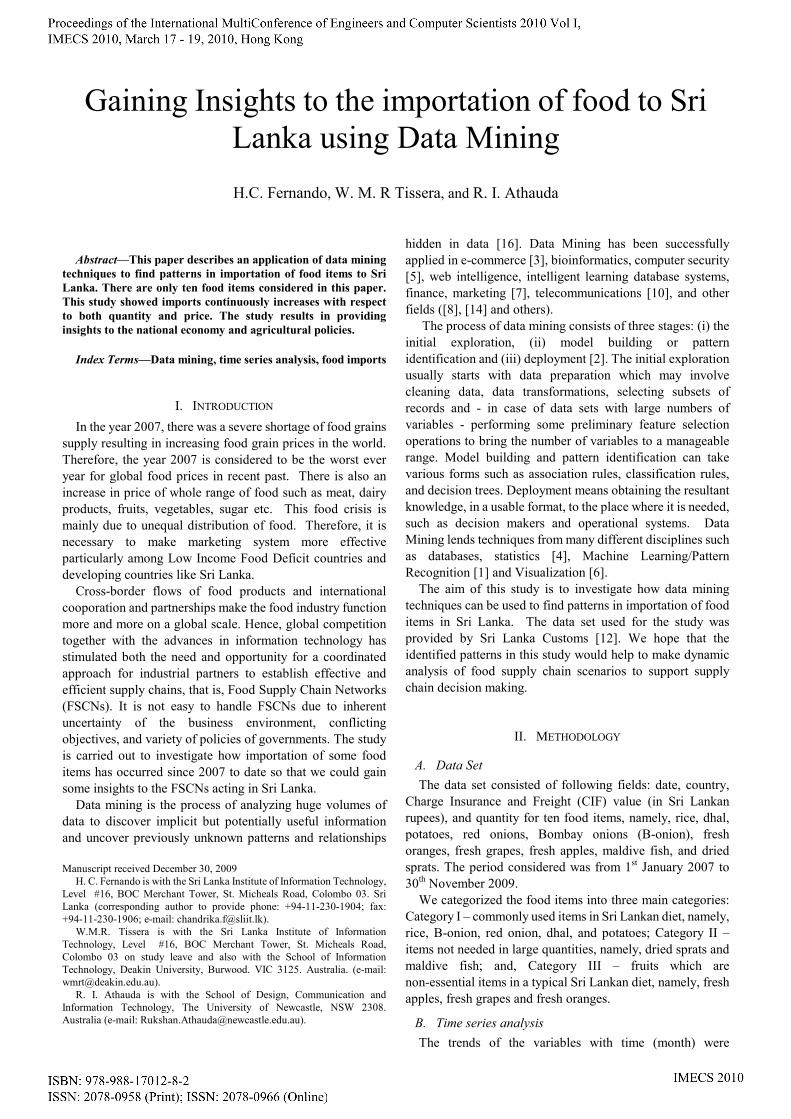
Abstract—This paper describes an application of data mining techniques to find patterns in importation of food items to Sri Lanka. There are only ten food items considered in this paper. This study showed imports continuously increases with respect to both quantity and price. The study results in providing insights to the national economy and agricultural policies. Index Terms—Data mining, time series analysis, food imports I. INTRODUCTION In the year 2007, there was a severe shortage of food grains supply resulting in increasing food grain prices in the world. Therefore, the year 2007 is considered to be the worst ever year for global food prices in recent past. There is also an increase in price of whole range of food such as meat, dairy products, fruits, vegetables, sugar etc. This food crisis is mainly due to unequal distribution of food. Therefore, it is necessary to make marketing system more effective particularly among Low Income Food Deficit countries and developing countries like Sri Lanka. Cross-border flows of food products and international cooporation and partnerships make the food industry function more and more on a global scale. Hence, global competition together with the advances in information technology has stimulated both the need and opportunity for a coordinated approach for industrial partners to establish effective and efficient supply chains, that is, Food Supply Chain Networks (FSCNs). It is not easy to handle FSCNs due to inherent uncertainty of the business environment, conflicting objectives, and variety of policies of governments. The study is carried out to investigate how importation of some food items has occurred since 2007 to date so that we could gain some insights to the FSCNs acting in Sri Lanka. Data mining is the process of analyzing huge volumes of data to discover implicit but potentially useful information and uncover previously unknown patterns and relationships Manuscript received December 30, 2009 H. C. Fernando is with the Sri Lanka Institute of Information Technology, Level #16, BOC Merchant Tower, St. Micheals Road, Colombo 03. Sri Lanka (corresponding author to provide phone: +94-11-230-1904; fax: +94-11-230-1906; e-mail: [email protected]). W.M.R. Tissera is with the Sri Lanka Institute of Information Technology, Level #16, BOC Merchant Tower, St. Micheals Road, Colombo 03 on study leave and also with the School of Information Technology, Deakin University, Burwood. VIC 3125. Australia. (e-mail: [email protected]). R. I. Athauda is with the School of Design, Communication and Information Technology, The University of Newcastle, NSW 2308. Australia (e-mail: [email protected]). hidden in data [16]. Data Mining has been successfully applied in e-commerce [3], bioinformatics, computer security [5], web intelligence, intelligent learning database systems, finance, marketing [7], telecommunications [10], and other fields ([8], [14] and others). The process of data mining consists of three stages: (i) the initial exploration, (ii) model building or pattern identification and (iii) deployment [2]. The initial exploration usually starts with data preparation which may involve cleaning data, data transformations, selecting subsets of records and - in case of data sets with large numbers of variables - performing some preliminary feature selection operations to bring the number of variables to a manageable range. Model building and pattern identification can take various forms such as association rules, classification rules, and decision trees. Deployment means obtaining the resultant knowledge, in a usable format, to the place where it is needed, such as decision makers and operational systems. Data Mining lends techniques from many different disciplines such as databases, statistics [4], Machine Learning/Pattern Recognition [1] and Visualization [6]. The aim of this study is to investigate how data mining techniques can be used to find patterns in importation of food items in Sri Lanka. The data set used for the study was provided by Sri Lanka Customs [12]. We hope that the identified patterns in this study would help to make dynamic analysis of food supply chain scenarios to support supply chain decision making. II. METHODOLOGY A. Data Set The data set consisted of following fields: date, country, Charge Insurance and Freight (CIF) value (in Sri Lankan rupees), and quantity for ten food items, namely, rice, dhal, potatoes, red onions, Bombay onions (B-onion), fresh oranges, fresh grapes, fresh apples, maldive fish, and dried sprats. The period considered was from 1 st January 2007 to 30 th November 2009. We categorized the food items into three main categories: Category I – commonly used items in Sri Lankan diet, namely, rice, B-onion, red onion, dhal, and potatoes; Category II – items not needed in large quantities, namely, dried sprats and maldive fish; and, Category III – fruits which are non-essential items in a typical Sri Lankan diet, namely, fresh apples, fresh grapes and fresh oranges. B. Time series analysis The trends of the variables with time (month) were Gaining Insights to the importation of food to Sri Lanka using Data Mining H.C. Fernando, W. M. R Tissera, and R. I. Athauda
Transcript of Gaining Insights to the importation of food to Sri Lanka ... · Gaining Insights to the importation...
Abstract—This paper describes an application of data mining
techniques to find patterns in importation of food items to Sri
Lanka. There are only ten food items considered in this paper.
This study showed imports continuously increases with respect
to both quantity and price. The study results in providing
insights to the national economy and agricultural policies.
Index Terms—Data mining, time series analysis, food imports
I. INTRODUCTION
In the year 2007, there was a severe shortage of food grains
supply resulting in increasing food grain prices in the world.
Therefore, the year 2007 is considered to be the worst ever
year for global food prices in recent past. There is also an
increase in price of whole range of food such as meat, dairy
products, fruits, vegetables, sugar etc. This food crisis is
mainly due to unequal distribution of food. Therefore, it is
necessary to make marketing system more effective
particularly among Low Income Food Deficit countries and
developing countries like Sri Lanka.
Cross-border flows of food products and international
cooporation and partnerships make the food industry function
more and more on a global scale. Hence, global competition
together with the advances in information technology has
stimulated both the need and opportunity for a coordinated
approach for industrial partners to establish effective and
efficient supply chains, that is, Food Supply Chain Networks
(FSCNs). It is not easy to handle FSCNs due to inherent
uncertainty of the business environment, conflicting
objectives, and variety of policies of governments. The study
is carried out to investigate how importation of some food
items has occurred since 2007 to date so that we could gain
some insights to the FSCNs acting in Sri Lanka.
Data mining is the process of analyzing huge volumes of
data to discover implicit but potentially useful information
and uncover previously unknown patterns and relationships
Manuscript received December 30, 2009
H. C. Fernando is with the Sri Lanka Institute of Information Technology,
Level #16, BOC Merchant Tower, St. Micheals Road, Colombo 03. Sri
Lanka (corresponding author to provide phone: +94-11-230-1904; fax:
+94-11-230-1906; e-mail: [email protected]).
W.M.R. Tissera is with the Sri Lanka Institute of Information
Technology, Level #16, BOC Merchant Tower, St. Micheals Road,
Colombo 03 on study leave and also with the School of Information
Technology, Deakin University, Burwood. VIC 3125. Australia. (e-mail:
R. I. Athauda is with the School of Design, Communication and
Information Technology, The University of Newcastle, NSW 2308.
Australia (e-mail: [email protected]).
hidden in data [16]. Data Mining has been successfully
applied in e-commerce [3], bioinformatics, computer security
[5], web intelligence, intelligent learning database systems,
finance, marketing [7], telecommunications [10], and other
fields ([8], [14] and others).
The process of data mining consists of three stages: (i) the
initial exploration, (ii) model building or pattern
identification and (iii) deployment [2]. The initial exploration
usually starts with data preparation which may involve
cleaning data, data transformations, selecting subsets of
records and - in case of data sets with large numbers of
variables - performing some preliminary feature selection
operations to bring the number of variables to a manageable
range. Model building and pattern identification can take
various forms such as association rules, classification rules,
and decision trees. Deployment means obtaining the resultant
knowledge, in a usable format, to the place where it is needed,
such as decision makers and operational systems. Data
Mining lends techniques from many different disciplines such
as databases, statistics [4], Machine Learning/Pattern
Recognition [1] and Visualization [6].
The aim of this study is to investigate how data mining
techniques can be used to find patterns in importation of food
items in Sri Lanka. The data set used for the study was
provided by Sri Lanka Customs [12]. We hope that the
identified patterns in this study would help to make dynamic
analysis of food supply chain scenarios to support supply
chain decision making.
II. METHODOLOGY
A. Data Set
The data set consisted of following fields: date, country,
Charge Insurance and Freight (CIF) value (in Sri Lankan
rupees), and quantity for ten food items, namely, rice, dhal,
potatoes, red onions, Bombay onions (B-onion), fresh
oranges, fresh grapes, fresh apples, maldive fish, and dried
sprats. The period considered was from 1st January 2007 to
30th November 2009.
We categorized the food items into three main categories:
Category I – commonly used items in Sri Lankan diet, namely,
rice, B-onion, red onion, dhal, and potatoes; Category II –
items not needed in large quantities, namely, dried sprats and
maldive fish; and, Category III – fruits which are
non-essential items in a typical Sri Lankan diet, namely, fresh
apples, fresh grapes and fresh oranges.
B. Time series analysis
The trends of the variables with time (month) were
Gaining Insights to the importation of food to Sri
Lanka using Data Mining
H.C. Fernando, W. M. R Tissera, and R. I. Athauda

analyzed using time series analysis. SQL Server [11], [17]
(see Tools section below) provides the facility to perform
time series analysis using Autoregressive tree model (ART)
[9]. An ART is a piecewise linear autoregressive model. The
boundaries are defined by a decision tree and leaves of the
decision tree contain linear autoregressive models. An ART
(p) model is an ART model in which each leaf of the decision
tree contains AR (p) model, and the split variables for the
decision tree are chosen from among the previous p variables
in the time series. ART (p) models are more powerful than AR
models because they can model non-linear relationships in
time series data [15]. ART models are particularly suitable
for data mining because of the computationally efficient
methods available for learning from data. Also, the resulting
models yield accurate forecasts and are easily interpretable.
ART (p) model is given by:
i
i
p
j
ijtiji
L
iitptti
L
itptt ybm�yyyfyyyf
Φ
=
−=
Φ
−−=
−− ∑+∏=∏=1
2
11
11 ),(),,...,(),,...,( σθθ
where L is the number of leaves, ),...,( 1 Lθθθ = , and
),,...,,(2
1 iipiii bbm σθ = , are the model parameters for the linear
regression at leaf il , Li ,...,1= .
C. Tools
Microsoft SQL Server [11], [17] is a powerful Database
Management System (DBMS) that offers different DM
algorithms and techniques and is user friendly. We used
Microsoft SQL Server 2005 for our analysis work.
III. RESULTS
A. Preliminary Analysis
This section presents our preliminary analysis and results.
The quantity of rice imported shows an unusual increase
from September 2007 to March 2008 but this pattern has not
repeated during the same period thereafter (Fig. 1). Sri Lanka
has been able to reduce the quantity of imported rice
significantly (Fig. 1).
Figure 1. Graph of quantity by food item
The highest portion of the total CIF value is for dhal. It has
increased from 26.8% of total CIF in 2007 to 40% of total CIF
in 2009 (Fig. 2).
Figure 2. Graph of percentage of total CIF value by food item
In general (except for B-onion and potatoes), CIF value per
kg has increased in 2009 compared to 2007 (Fig. 3).
However, there are changes in 2008 to this trend. For certain
food items, (i.e. rice, red onion, B-onion and potatoes) CIF
per kg has decreased in 2008 compared to 2007. In other
situations (i.e. dhal, dried sprats, maldive fish, apple, grapes
and oranges), the CIF per kg has increased in 2008 compared
to 2007 (see Fig. 3).
Figure 3. Graph of CIF value per kg by food item
Among the food items of the Category I (Fig. 4), CIF value
per kg for dhal has increased considerably. Also, in the
months between July and September 2009, Sri Lanka has not
imported red onions.
Figure 4. CIF values per kg for Category I items
CIF values per kg for dried sprats and maldive fish are
comparatively high. The CIF value of dried sprats varies from
127.92 rupees per kg in 2007 to 142.63 rupees per kg in 2009.
Maldive fish shows a drastic change in the price amounting to
181.29 rupees in 2007 to 509.54 rupees in 2009. Although,
the quantity of maldive fish decreases from January 2007 to
November 2009, the CIF value increases by 186% of that of
2007 (see Fig. 5).

Figure 5.CIF values per kg for Category II items
We observe a slight increase in the CIF per kg for fruits –
Category III (see Fig. 6). The quantity has increased despite
the increase in CIF per kg. Nearly 5% of total CIF value is
spent on importing these three fruits during this period.
Figure 6.CIF values per kg for Category III items
B. Time-series Analysis using ART
This section presents the time series analysis performed
using ART [9] for each food item considered in this study.
The analysis was performed on quantity in kg and CIF value
per kg for each food item. This allows us observe the patterns
existing in importation of food items. Also, we can predict the
recent future.
Rice: The decision tree for the quantity of rice has two
distinct nodes; one node represents the period of January
2007 to February 2008 and the other node thereafter. This
implies that the importation of rice has significantly changed
after February 2008.
During 2007, the quantity of rice imported per month has
been about 15134940 kg. After 2008, it has reduced to
2586950 kg which accounts for about 83% reduction in
quantity of rice imported (Table I).
The decision tree splits into two different nodes by CIF value
and not by time for rice. Therefore, we see that there are two
distinct regions, depending on whether the CIF value of the
previous month is less than 76.189 rupees, or greater than or
equal to 76.189 rupees (Fig. 8).
Although the decision tree splits into two different nodes by
CIF value, the two models show that the current CIF value
only depends on that of previous month. We need to consider
only the very recent past when determining the current CIF
value of rice (Table II).
B-onions: The decision tree for the quantity of B-onions
has only a single node. Hence, we have only one model to
represent the quantity of imported B-onions (Table III). Also,
the quantity depends only on that of 2 years ago and one year
ago. This implies that the pattern does not fluctuate frequently
and the predicted values for immediate future clearly follow
the same pattern (Fig. 9).
Figure 9. Graph of quantity of B-onions by time
The decision tree for the CIF value of B-onions has only a
single node. It only depends on previous month and six
months before (Table IV).
Red Onions: The decision tree for the quantity of red
onions has only a single node. Hence, we have only one model
to represent the quantity of imported red onions for the entire
period. The quantity of red onion has no history other than the
quantity of previous month (Table V).
Table I. ART model for quantity of rice
Region ART model
Time N >= 13.173 Quantity = 2586950.798 + 0.183 *
Quantity(-3) + 0.059 * Quantity(-1)
Time N < 13.173 Quantity = 15134940.376 -1.254 *
Quantity(-3)
Figure 7. Decision Tree of ART model for quantity of rice
Table III. ART model for quantity of B-onions
ART model
Quantity = -36522.062 + 0.791 * Quantity(-24) + 0.213 * Quantity(-12)
Table IV. ART model for CIF value per kg of B-onion
ART model
CIF Value = 24.943 -0.491 * CIF Value(-6) + 0.650 * CIF Value(-1)
Figure 8. Decision Tree of ART model for CIF value per kg of rice
Table II. ART model for CIF value per kg of rice
Region ART model
CIF Value-1 >= 76.189 CIF Value = 34.430 + 0.461 * CIF Value(-1)
CIF Value-1 < 76.189 CIF Value = 21.423 + 0.695 * CIF Value(-1)
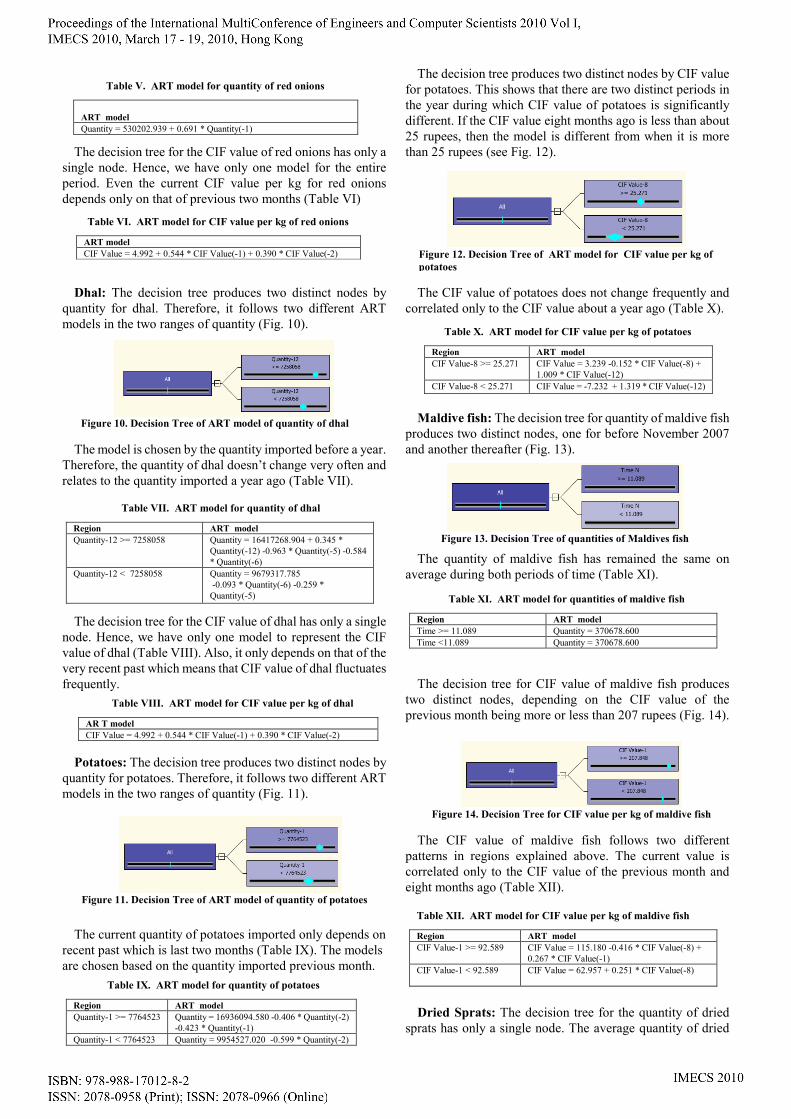
The decision tree for the CIF value of red onions has only a
single node. Hence, we have only one model for the entire
period. Even the current CIF value per kg for red onions
depends only on that of previous two months (Table VI)
Dhal: The decision tree produces two distinct nodes by
quantity for dhal. Therefore, it follows two different ART
models in the two ranges of quantity (Fig. 10).
The model is chosen by the quantity imported before a year.
Therefore, the quantity of dhal doesn’t change very often and
relates to the quantity imported a year ago (Table VII).
The decision tree for the CIF value of dhal has only a single
node. Hence, we have only one model to represent the CIF
value of dhal (Table VIII). Also, it only depends on that of the
very recent past which means that CIF value of dhal fluctuates
frequently.
Potatoes: The decision tree produces two distinct nodes by
quantity for potatoes. Therefore, it follows two different ART
models in the two ranges of quantity (Fig. 11).
The current quantity of potatoes imported only depends on
recent past which is last two months (Table IX). The models
are chosen based on the quantity imported previous month.
The decision tree produces two distinct nodes by CIF value
for potatoes. This shows that there are two distinct periods in
the year during which CIF value of potatoes is significantly
different. If the CIF value eight months ago is less than about
25 rupees, then the model is different from when it is more
than 25 rupees (see Fig. 12).
The CIF value of potatoes does not change frequently and
correlated only to the CIF value about a year ago (Table X).
Maldive fish: The decision tree for quantity of maldive fish
produces two distinct nodes, one for before November 2007
and another thereafter (Fig. 13).
The quantity of maldive fish has remained the same on
average during both periods of time (Table XI).
The decision tree for CIF value of maldive fish produces
two distinct nodes, depending on the CIF value of the
previous month being more or less than 207 rupees (Fig. 14).
The CIF value of maldive fish follows two different
patterns in regions explained above. The current value is
correlated only to the CIF value of the previous month and
eight months ago (Table XII).
Dried Sprats: The decision tree for the quantity of dried
sprats has only a single node. The average quantity of dried
Table V. ART model for quantity of red onions
ART model
Quantity = 530202.939 + 0.691 * Quantity(-1)
Table VI. ART model for CIF value per kg of red onions
ART model
CIF Value = 4.992 + 0.544 * CIF Value(-1) + 0.390 * CIF Value(-2)
Figure 10. Decision Tree of ART model of quantity of dhal
Table VII. ART model for quantity of dhal
Region ART model
Quantity-12 >= 7258058 Quantity = 16417268.904 + 0.345 *
Quantity(-12) -0.963 * Quantity(-5) -0.584
* Quantity(-6)
Quantity-12 < 7258058 Quantity = 9679317.785
-0.093 * Quantity(-6) -0.259 *
Quantity(-5)
Figure 12. Decision Tree of ART model for CIF value per kg of
potatoes
Table X. ART model for CIF value per kg of potatoes
Region ART model
CIF Value-8 >= 25.271 CIF Value = 3.239 -0.152 * CIF Value(-8) +
1.009 * CIF Value(-12)
CIF Value-8 < 25.271 CIF Value = -7.232 + 1.319 * CIF Value(-12)
Table VIII. ART model for CIF value per kg of dhal
AR T model
CIF Value = 4.992 + 0.544 * CIF Value(-1) + 0.390 * CIF Value(-2)
Figure 11. Decision Tree of ART model of quantity of potatoes
Table IX. ART model for quantity of potatoes
Region ART model
Quantity-1 >= 7764523 Quantity = 16936094.580 -0.406 * Quantity(-2)
-0.423 * Quantity(-1)
Quantity-1 < 7764523 Quantity = 9954527.020 -0.599 * Quantity(-2)
Figure 13. Decision Tree of quantities of Maldives fish
Figure 14. Decision Tree for CIF value per kg of maldive fish
Table XII. ART model for CIF value per kg of maldive fish
Region ART model
CIF Value-1 >= 92.589 CIF Value = 115.180 -0.416 * CIF Value(-8) +
0.267 * CIF Value(-1)
CIF Value-1 < 92.589 CIF Value = 62.957 + 0.251 * CIF Value(-8)
Table XI. ART model for quantities of maldive fish
Region ART model
Time >= 11.089 Quantity = 370678.600
Time <11.089 Quantity = 370678.600

sprats is about 3378307 and it only depends on the
corresponding figure for three months earlier (Table XIII).
The decision tree produces two distinct nodes by time for
CIF value per kg for dried sprats. Before October 2008, the
CIF value is significantly different from other time (Fig. 15).
There has been noteworthy increase in the CIF value per kg
of the dried sprats in September 2008. Also, it does not
change frequently and only has a history of one month (Table
XIV).
Fresh apples: The decision tree for the quantity of fresh
apples has only a single node. The average quantity of apples
is about 2173433 and it only depends on the corresponding
figure for two months earlier.
The decision tree for the CIF value of fresh apples has two
distinct nodes. If the CIF value of the previous month is less
than 35 rupees, it defines one region; otherwise, the other
region (Fig. 16).
This shows that in one period apples are cheap compared to
other times of the year. Anyway, the current CIF value is only
related to that of the last month in both periods (Table XVI).
Fresh grapes: There has been a significant change in
quantity of fresh grapes depending on whether the quantity six
months ago is less than 290982 kg or not (Fig. 17).
The quantity of fresh grapes imported has been governed by
two models for the two regions produced in the decision tree.
It is constant for one region and only varies upon the value six
months ago for the other region (Table XVII).
There have been two regions for the CIF value of fresh
grapes too. The regions are defined as CIF value of the
previous month is less than 93 rupees or not (Fig. 16).
The ART model for the region of more than 93 rupees
includes the CIF values 8 months ago and one month ago.
But, in the other region, it only depends on the value of eight
months ago. The CIF value does not frequently change when
the value is low. When it is high, the value tends to change
frequently as it has a bearing only on the value of previous
month (Table XVIII).
Fresh oranges: The current value of the quantity of fresh
oranges imported differs by the quantity imported six months
ago. This shows that the demand for oranges is not the same
throughout the year. There is a period in which the demand is
higher than 314278 kg (Fig. 19).
The quantity imported follows two different models for the
two regions produced in the decision tree. In the region where
demand is higher, the model depends only on the quantity
imported 6 months and 1 year ago. In the other region, it only
depends on the value 6 months ago (Table XIX).
Table XIII. ART model for quantity of dried sprats
ART model
Quantity = 3378307.738 -0.604 * Quantity(-3)
Table XIV. ART model for CIF value per kg of dried sprats
Region ART model
Time > = 21.673 CIF Value = 63.676 + 0.552 * CIF Value(-1)
Time < 21.673 CIF Value = 54.691 + 0.566 * CIF Value(-1)
Figure 15. Decision Tree of ART model CIF value per kg of
dried sprats
Figure 16. Decision Tree of ART model CIF value per kg of fresh
apples
Table XVI. ART model for CIF value per kg of fresh apples
Region ART model
CIF Value-1 >= 35.202 CIF Value = 11.950 + 0.728 * CIF Value(-1)
CIF Value-1 < 35.202 CIF Value = 7.002 + 0.812 * CIF Value(-1)
Figure 17. Decision Tree of ART model of quantity of fresh
grapes
Table XVII. ART model for quantities of fresh grapes
Region ART model
Quantity-6 >= 298982 Quantity = 397682.569 -0.149 *
Quantity(-6)
Quantity-6 < 298982 Quantity = 303908.724
Figure 18. Decision Tree of ART model of CIF value per kg of
fresh grapes
Table XVIII. ART model for CIF value per kg of fresh grapes
Region ART model
CIF Value-1 >= 92.589 CIF Value = 115.180 -0.416 * CIF Value(-8) +
0.267 * CIF Value(-1)
CIF Value-1 < 92.589 CIF Value = 62.957 + 0.251 * CIF Value(-8)
Figure 19. Decision Tree of ART model of quantity of fresh
oranges
Table XV. ART model for quantities of fresh apples
ART model
Quantity = 2173433.103 -0.393 * Quantity(-2)
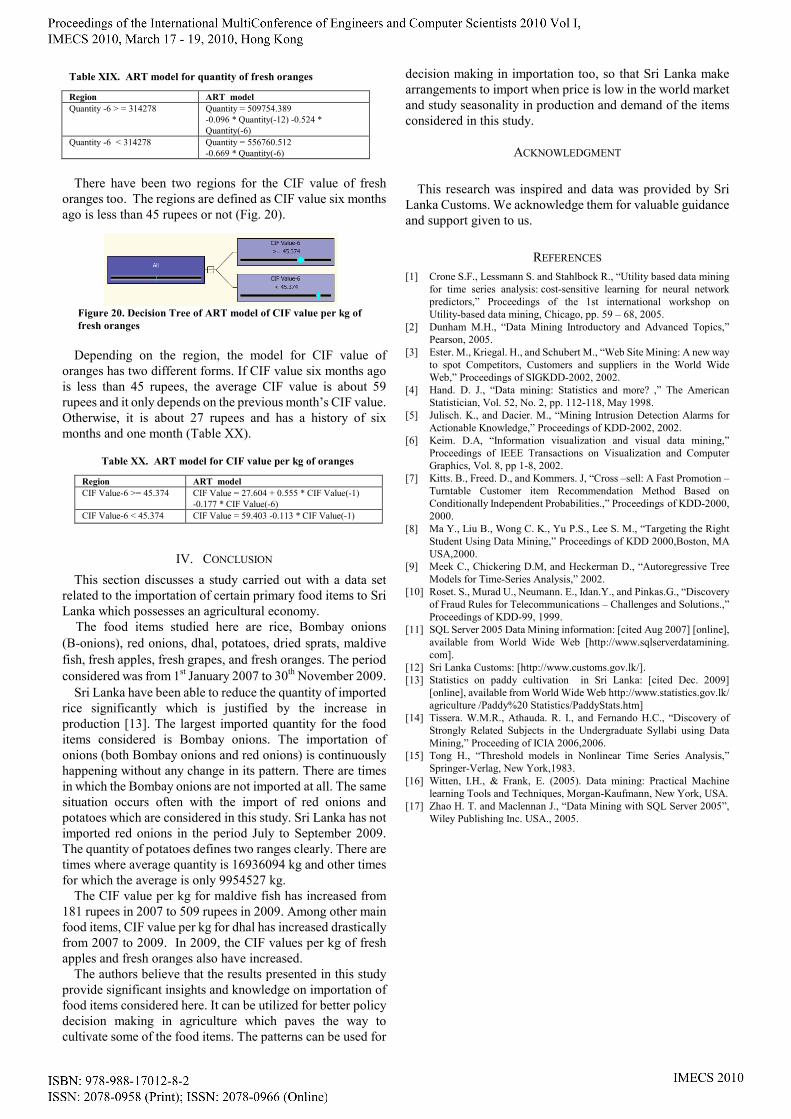
There have been two regions for the CIF value of fresh
oranges too. The regions are defined as CIF value six months
ago is less than 45 rupees or not (Fig. 20).
Depending on the region, the model for CIF value of
oranges has two different forms. If CIF value six months ago
is less than 45 rupees, the average CIF value is about 59
rupees and it only depends on the previous month’s CIF value.
Otherwise, it is about 27 rupees and has a history of six
months and one month (Table XX).
IV. CONCLUSION
This section discusses a study carried out with a data set
related to the importation of certain primary food items to Sri
Lanka which possesses an agricultural economy.
The food items studied here are rice, Bombay onions
(B-onions), red onions, dhal, potatoes, dried sprats, maldive
fish, fresh apples, fresh grapes, and fresh oranges. The period
considered was from 1st January 2007 to 30
th November 2009.
Sri Lanka have been able to reduce the quantity of imported
rice significantly which is justified by the increase in
production [13]. The largest imported quantity for the food
items considered is Bombay onions. The importation of
onions (both Bombay onions and red onions) is continuously
happening without any change in its pattern. There are times
in which the Bombay onions are not imported at all. The same
situation occurs often with the import of red onions and
potatoes which are considered in this study. Sri Lanka has not
imported red onions in the period July to September 2009.
The quantity of potatoes defines two ranges clearly. There are
times where average quantity is 16936094 kg and other times
for which the average is only 9954527 kg.
The CIF value per kg for maldive fish has increased from
181 rupees in 2007 to 509 rupees in 2009. Among other main
food items, CIF value per kg for dhal has increased drastically
from 2007 to 2009. In 2009, the CIF values per kg of fresh
apples and fresh oranges also have increased.
The authors believe that the results presented in this study
provide significant insights and knowledge on importation of
food items considered here. It can be utilized for better policy
decision making in agriculture which paves the way to
cultivate some of the food items. The patterns can be used for
decision making in importation too, so that Sri Lanka make
arrangements to import when price is low in the world market
and study seasonality in production and demand of the items
considered in this study.
ACKNOWLEDGMENT
This research was inspired and data was provided by Sri
Lanka Customs. We acknowledge them for valuable guidance
and support given to us.
REFERENCES
[1] Crone S.F., Lessmann S. and Stahlbock R., “Utility based data mining
for time series analysis: cost-sensitive learning for neural network
predictors,” Proceedings of the 1st international workshop on
Utility-based data mining, Chicago, pp. 59 – 68, 2005.
[2] Dunham M.H., “Data Mining Introductory and Advanced Topics,”
Pearson, 2005.
[3] Ester. M., Kriegal. H., and Schubert M., “Web Site Mining: A new way
to spot Competitors, Customers and suppliers in the World Wide
Web,” Proceedings of SIGKDD-2002, 2002.
[4] Hand. D. J., “Data mining: Statistics and more? ,” The American
Statistician, Vol. 52, No. 2, pp. 112-118, May 1998.
[5] Julisch. K., and Dacier. M., “Mining Intrusion Detection Alarms for
Actionable Knowledge,” Proceedings of KDD-2002, 2002.
[6] Keim. D.A, “Information visualization and visual data mining,”
Proceedings of IEEE Transactions on Visualization and Computer
Graphics, Vol. 8, pp 1-8, 2002.
[7] Kitts. B., Freed. D., and Kommers. J, “Cross –sell: A Fast Promotion –
Turntable Customer item Recommendation Method Based on
Conditionally Independent Probabilities.,” Proceedings of KDD-2000,
2000.
[8] Ma Y., Liu B., Wong C. K., Yu P.S., Lee S. M., “Targeting the Right
Student Using Data Mining,” Proceedings of KDD 2000,Boston, MA
USA,2000.
[9] Meek C., Chickering D.M, and Heckerman D., “Autoregressive Tree
Models for Time-Series Analysis,” 2002.
[10] Roset. S., Murad U., Neumann. E., Idan.Y., and Pinkas.G., “Discovery
of Fraud Rules for Telecommunications – Challenges and Solutions.,”
Proceedings of KDD-99, 1999.
[11] SQL Server 2005 Data Mining information: [cited Aug 2007] [online],
available from World Wide Web [http://www.sqlserverdatamining.
com].
[12] Sri Lanka Customs: [http://www.customs.gov.lk/].
[13] Statistics on paddy cultivation in Sri Lanka: [cited Dec. 2009]
[online], available from World Wide Web http://www.statistics.gov.lk/
agriculture /Paddy%20 Statistics/PaddyStats.htm]
[14] Tissera. W.M.R., Athauda. R. I., and Fernando H.C., “Discovery of
Strongly Related Subjects in the Undergraduate Syllabi using Data
Mining,” Proceeding of ICIA 2006,2006.
[15] Tong H., “Threshold models in Nonlinear Time Series Analysis,”
Springer-Verlag, New York,1983.
[16] Witten, I.H., & Frank, E. (2005). Data mining: Practical Machine
learning Tools and Techniques, Morgan-Kaufmann, New York, USA.
[17] Zhao H. T. and Maclennan J., “Data Mining with SQL Server 2005”,
Wiley Publishing Inc. USA., 2005.
Table XIX. ART model for quantity of fresh oranges
Region ART model
Quantity -6 > = 314278 Quantity = 509754.389
-0.096 * Quantity(-12) -0.524 *
Quantity(-6)
Quantity -6 < 314278 Quantity = 556760.512
-0.669 * Quantity(-6)
Figure 20. Decision Tree of ART model of CIF value per kg of
fresh oranges
Table XX. ART model for CIF value per kg of oranges
Region ART model
CIF Value-6 >= 45.374 CIF Value = 27.604 + 0.555 * CIF Value(-1)
-0.177 * CIF Value(-6)
CIF Value-6 < 45.374 CIF Value = 59.403 -0.113 * CIF Value(-1)