GAINESVILLE REGIONAL UTILITIES 2018 TEN-YEAR ... - gru.com 2018 TYSP.pdf · Gainesville Regional...
52
GAINESVILLE REGIONAL UTILITIES 2018 TEN-YEAR SITE PLAN Submitted to: The Florida Public Service Commission April 1, 2018
Transcript of GAINESVILLE REGIONAL UTILITIES 2018 TEN-YEAR ... - gru.com 2018 TYSP.pdf · Gainesville Regional...

GAINESVILLE REGIONAL UTILITIES
2018 TEN-YEAR SITE PLAN
Submitted to:
The Florida Public Service Commission
April 1, 2018

____________________________
i
Table of Contents
INTRODUCTION ....................................................................................................... 1 1. DESCRIPTION OF EXISTING FACILITIES ......................................................... 2
1.1 GENERATION ............................................................................................. 2 1.1.1 Generating Units ................................................................................ 3 1.1.2 Generating Plant Sites ....................................................................... 4
1.2 TRANSMISSION .......................................................................................... 5 1.2.1 The Transmission Network ................................................................. 5 1.2.2 Transmission Lines ............................................................................ 6 1.2.3 State Interconnections ........................................................................ 6
1.3 DISTRIBUTION ............................................................................................ 7 1.4 WHOLESALE ENERGY ............................................................................... 8 1.5 DISTRIBUTED GENERATION ..................................................................... 8
Figure 1.1 GRU Electric Facilities….…………..…………………………………….10 Figure 1.2 GRU Electric System One-Line Diagram .......................................... 11 Schedule 1 Existing Generating Facilities .......................................................... 12 Table 1.1 Transmission Liine Ratings Summer Power Flow Limits .................... 13 Table 1.2 Substation Transformation and Circuits ............................................. 14
2. FORECAST OF ELECTRIC ENERGY AND DEMAND REQUIREMENTS ........ 15
2.1 FORECAST ASSUMPTIONS AND DATA SOURCES ............................... 15 2.2 FORECASTS OF NUMBER OF CUSTOMERS, ENERGY SALES AND
SEASONAL PEAK DEMANDS .................................................................. 17 2.2.1 Residential Sector ........................................................................... 17 2.2.2 General Service Non-Demand Sector ............................................. 19 2.2.3 General Service Demand Sector ..................................................... 21 2.2.4 Large Power Sector ......................................................................... 22 2.2.5 Outdoor Lighting Sector ................................................................... 23 2.2.6 Wholesale Energy Sales ................................................................. 23 2.2.7 Total System Sales, Net Energy for Load, Seasonal Peak Demands
and Conservation Impacts ............................................................... 24 2.3 ENERGY SOURCES AND FUEL REQUIREMENTS ................................. 25
2.3.1 Fuels Used by System ..................................................................... 25 2.3.2 Purchased Power Agreements ........................................................ 25
2.4 DEMAND-SIDE MANAGEMENT ............................................................... 26 2.4.1 Demand-Side Management Programs ............................................ 26 2.4.2 Demand-Side Management Methodology and Results ................... 27 2.4.3 Supply Side Programs ..................................................................... 27
2.5 FUEL PRICE FORECAST ASSUMPTIONS ............................................... 28 2.5.1 Coal ................................................................................................. 28 2.5.2 Natural Gas ..................................................................................... 29 2.5.3 Biomass ........................................................................................... 30
ii
History and Forecast of Energy Consumption and Number of Customers by Customer Class Schedule 2.1 .............................................................................................. 31 Schedule 2.2 .............................................................................................. 32 Schedule 2.3 .............................................................................................. 33 History and Forecast of Peak Demand - MW Schedule 3.1 Summer ................................................................................ 34 Schedule 3.2 Winter ................................................................................... 35 History and Forecast of Net Energy for Load - GWH Schedule 3.3 .............................................................................................. 36 Previous Year and 2-Year Forecast of Peak Demand and Net Energy for Load Schedule 4 ................................................................................................. 37 Fuel Requirements
Schedule 5 ................................................................................................. 38 Energy Sources (GWH) Schedule 6.1 .............................................................................................. 39 Energy Sources (%)
Schedule 6.2 .............................................................................................. 40 3. FORECAST OF FACILITIES REQUIREMENTS ................................................ 41
3.1 GENERATION RETIREMENTS ................................................................. 41 3.2 RESERVE MARGIN AND SCHEDULED MAINTENANCE ........................ 41 3.3 GENERATION ADDITIONS ....................................................................... 41 3.4 DISTRIBUTION SYSTEM ADDITIONS ...................................................... 41
Forecast of Capacity, Demand, and Scheduled Maintenance at Time of Peak Schedule 7.1 Summer ................................................................................ 43 Schedule 7.2 Winter ................................................................................... 44
Planned and Prospective Generating Facility Additions and Changes Schedule 8 ................................................................................................. 45
4. ENVIRONMENTAL AND LAND USE INFORMATION ....................................... 46
4.1. DESCRIPTION OF POTENTIAL SITES FOR NEW GENERATING FACILITIES ................................................................................................ 46
4.2 DESCRIPTION OF PREFERRED SITES FOR NEW GENERATING FACILITIES ................................................................................................ 46 4.2.1 Land Use and Environmental Features ........................................... 46 4.2.2 Air Emissions ................................................................................... 47
Deerhaven Generating Site Location Map ......................................................... 48
1
INTRODUCTION
The 2018 Ten-Year Site Plan for Gainesville Regional Utilities (GRU) is
submitted to the Florida Public Service Commission pursuant to Section 186.801,
Florida Statutes. The contents of this report conform to information requirements
listed in Form PSC/RAD 043-E, as specified by Rule 25-22.072, Florida
Administrative Code. The four sections of the 2018 Ten-Year Site Plan are:
Description of Existing Facilities
Forecast of Electric Energy and Demand Requirements
Forecast of Facilities Requirements
Environmental and Land Use Information
Gainesville Regional Utilities (GRU) is a municipal electric, natural gas, water,
wastewater, and telecommunications utility system, owned and operated by the City
of Gainesville, Florida. The GRU retail electric system service area includes the City
of Gainesville and the surrounding urban area. The highest net integrated peak
demand recorded to date on GRU's electrical system was 481 Megawatts on August
8, 2007.
2
1. DESCRIPTION OF EXISTING FACILITIES
Gainesville Regional Utilities (GRU) operates a fully vertically-integrated
electric power production, transmission, and distribution system (herein referred to
as "the System"), and is wholly owned by the City of Gainesville. In addition to retail
electric service, GRU also provides wholesale electric service to the Cities of
Alachua (Alachua) and Winter Park, and transmission service to Seminole Electric
Cooperative (Seminole). GRU's distribution system serves its retail territory of
approximately 124 square miles and an average of 97,245 customers during 2017.
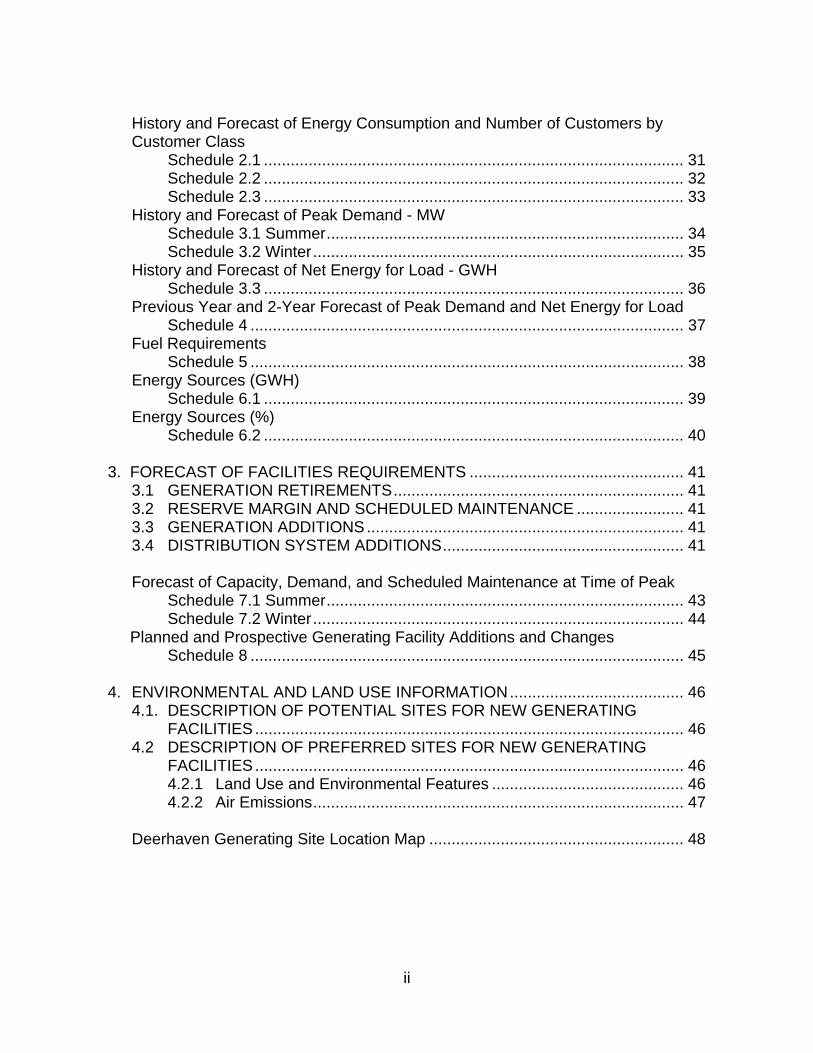
The general locations of GRU electric facilities and the electric system service area
are shown in Figure 1.1.
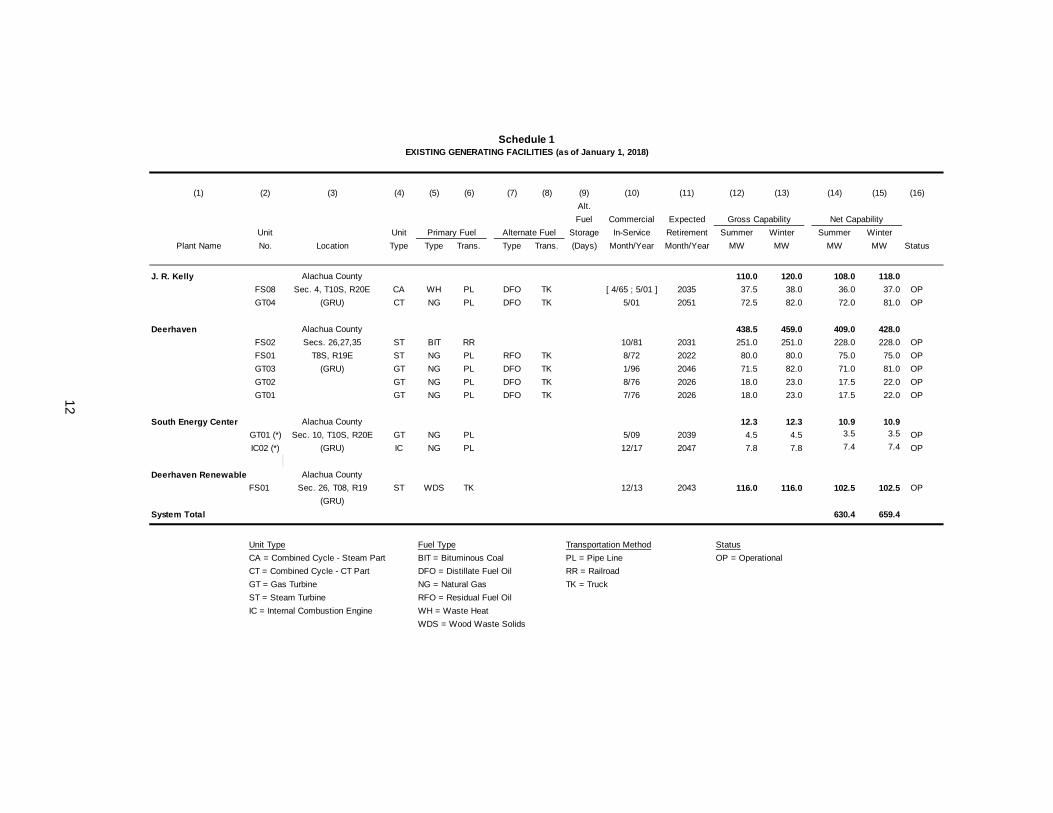
1.1 GENERATION The existing generating facilities operated by GRU are tabulated in Schedule
1 at the end of this section. The present Summer Net Continuous Capacity is 630.4
MW and the Winter Net Continuous Capacity is 659.4 MW. Currently, the System's
energy is produced by three fossil fuel steam turbines1, one of which is part of a
combined cycle unit; a biomass steam turbine; five combustion turbines, three of
which are simple cycle, one which can generate in either simple or combined cycle
mode, and one which provides distributed generation; and an internal combustion
engine which also provides distributed generation.
The System has three primary generating plant sites: Deerhaven (DH),
Deerhaven Renewable (DHR), and John R. Kelly (JRK). These sites are shown on
Figure 1.
1 One steam turbine, JRK steam turbine (ST) 8, operates only in combined cycle with JRK combustion
turbine (CT) 4. As CT4 is fossil fueled, the steam created by the heat recovery steam generator (HRSG) into
which it exhausts when in combined cycle mode is produced by fossil fuel. Therefore ST8 is indirectly driven by
fossil fuel. No capability exists to directly burn fossil fuel to produce steam for ST8.
3
1.1.1 Generating Units2
1.1.1.1 Simple Cycle Steam and Combined Cycle Units. The System's two
simple cycle steam turbines and one combined cycle steam turbine are powered by
fossil fuels3. The System also consists of a biomass simple cycle steam turbine. The
two simple cycle fossil-fueled steam turbines comprise 48% of the System's Net
Summer Continuous Capacity and produced 55% of the electric energy supplied by
the System in 2017. The combined cycle unit, which includes a heat recovery steam
generator (HRSG), steam turbine/generator, and combustion turbine/generator,
comprise 17.1% of the System's Net Summer Continuous Capacity and produced
42% of the electric energy supplied by the System in 2017. DH 2 (228 MW) and JRK
CC1 (108 MW) have historically been used for base load purposes, while DH 1 (75
MW) was more commonly used for intermediate loading. The addition of 102.5 MW
of biomass power by purchased power agreement (PPA) in 2013 resulted in
seasonal operation and increased load cycling of DH 2. It also resulted in increased
off/on cycling of JRK CC1 and reduced capacity factor of DH 1. With the purchase of
the biomass facility in November 2017, the role of the biomass unit and the other
units is being reviewed.
1.1.1.2 Simple Cycle Combustion Gas Turbines. The System's four
industrial combustion turbines that operate only in simple cycle comprise 17.4% of
the System's Summer Net generating capacity and produced approximately 2% of
the electric energy supplied by the System in 2017. Three of these simple cycle
combustion turbines are utilized for peaking purposes only as their energy
conversion efficiencies are considerably lower than steam or combined cycle units.
Simple cycle combustion turbines are advantageous in that they can be started and
2 All MW ratings are Summer Net continuous capacity unless otherwise stated.
3 One steam turbine, JRK steam turbine (ST) 8, operates only in combined cycle with JRK combustion
turbine (CT) 4. As CT4 is fossil fueled, the steam created by the heat recovery steam generator (HRSG) into
which it exhausts when in combined cycle mode is produced by fossil fuel. Therefore ST8 is indirectly driven by
fossil fuel. No capability exists to directly burn fossil fuel to produce steam for ST8.
4
placed online quickly. The fourth combustion turbine operates to serve base load as
part of a combined heat and power facility at the South Energy Center, further
described in Section 1.5. The combustion turbine mentioned in 1.1.1.1 that is used
majority of the time in combined cycle can be operated in simple cycle to provide for
peaking power.
1.1.1.3 Reciprocating Internal Combustion Engine. The System's began
operation of a 7.4 MW natural gas-fired internal combustion engine in December
2017 at the South Energy Center. The engine is used in a combined heat and power
application, where the engine’s waste heat is captured to make steam and hot water
for an academic medical campus.
1.1.1.4 Environmental Considerations. The System's steam turbines utilize
recirculating cooling towers with a mechanical draft for the cooling of condensed
steam. DH 2 has an Air Quality Control System (AQCS) consisting of a “hot-side”
electrostatic precipitator for the removal of fly ash, a selective catalytic reduction
system (SCR) to reduce NOx, a dry recirculating flue gas desulfurization unit to
reduce acid gases, sulfur dioxide (SO2) and mercury (Hg), and a fabric filter
baghouse to reduce particulates. The Deerhaven site operates with zero liquid
discharge (ZLD) to surface waters.
1.1.2 Generating Plant Sites
The locations of the System’s generating plant sites are shown on Figure 1.1.
1.1.2.1 John R. Kelly Plant. The Kelly Station is located in southeast
Gainesville near the downtown business district, and consists of one combined cycle
unit and the associated cooling facilities, fuel storage, pumping equipment,
transmission and distribution equipment.

5
1.1.2.2 Deerhaven Plant. The Deerhaven Station is located six miles
northwest of Gainesville. The facility consists of two steam turbines, three gas
turbines, and the associated cooling facilities, fuel storage, pumping equipment and
transmission equipment. DH 2 is coal-fired and the site includes the coal unloading
and storage facilities.
1.1.2.3 Deerhaven Renewable Plant. The Deerhaven Renewable biomass-
fueled generation facility is located northwest of the Deerhaven Generating Station.
GRU purchased this 102.5 MW generating unit in November 2017. The facility
consists of one steam turbine, the associated cooling facilities, and biomass
unloading and storage facilities.
1.2 TRANSMISSION 1.2.1 The Transmission Network
GRU's bulk electric power transmission network (System) consists of a 230
kV radial and a 138 kV loop connecting the following:
1) GRU's three primary generating stations,
2) GRU's ten distribution substations,
3) One 230 kV and two 138 kV interties with Duke Energy Florida (DEF),
4) A 138 kV intertie with Florida Power and Light Company (FPL),
5) A radial interconnection with Clay at Farnsworth Substation, and
6) A loop-fed interconnection with the City of Alachua at Alachua No. 1
Substation.
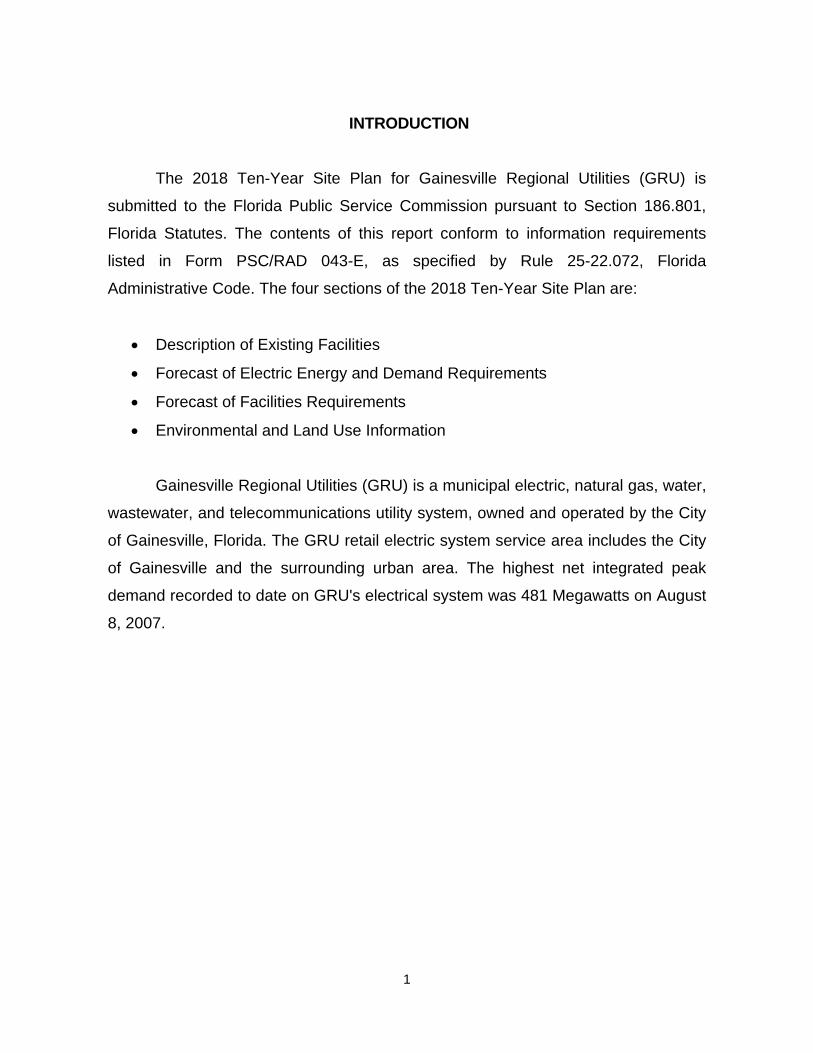
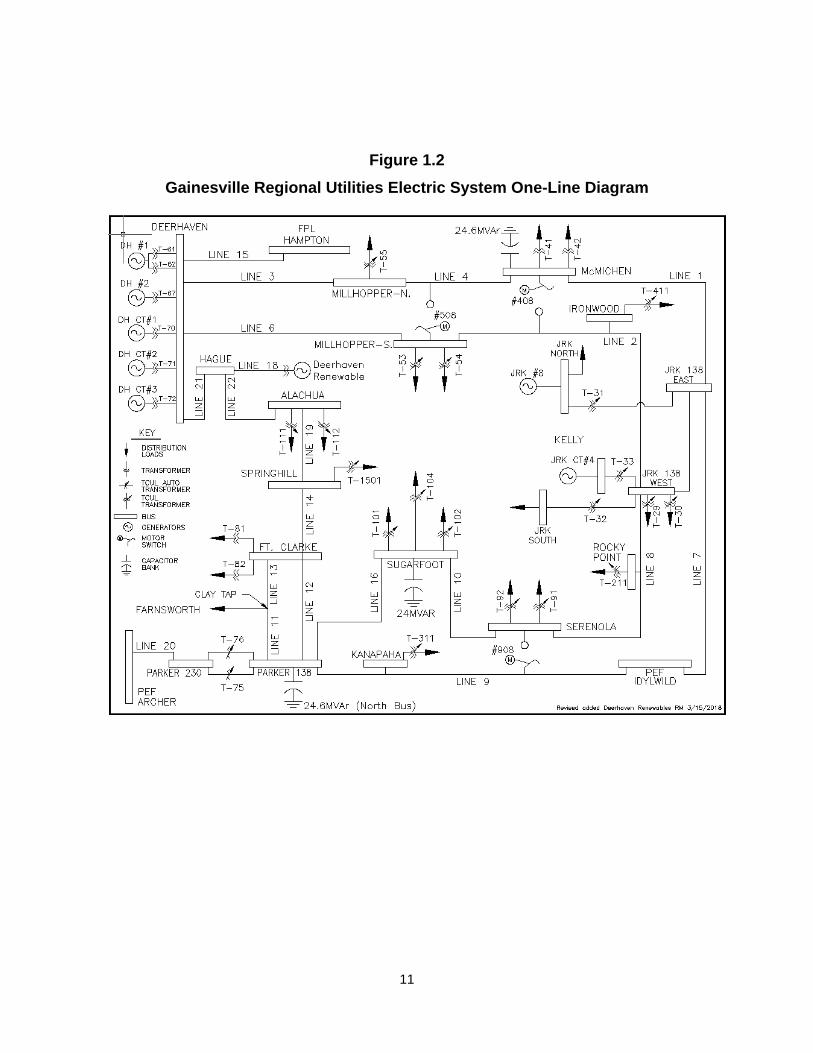
Refer to Figure 1.1 for line geographical locations and Figure 1.2 for electrical
connectivity and line numbers.
6
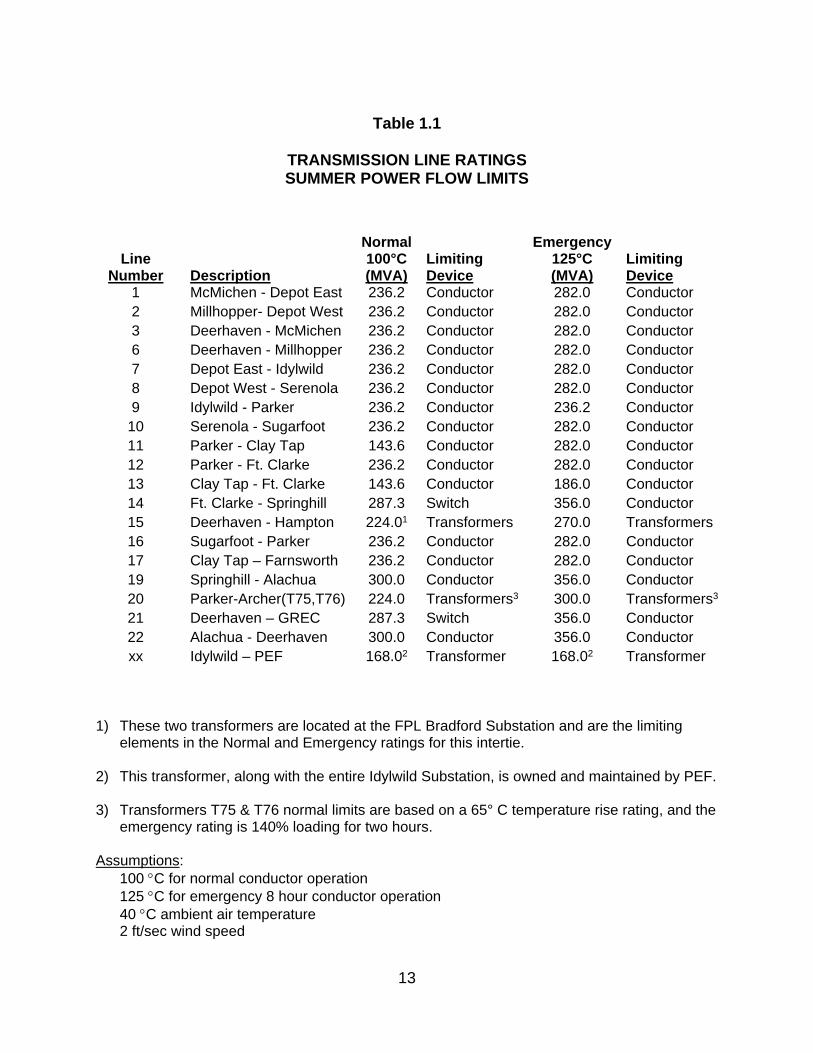
1.2.2 Transmission Lines The ratings for all of GRU's transmission lines are given in Table 1.1, and
Figure 1.2 shows a one-line diagram of GRU's electric system. The criteria for
normal and emergency loading are:
Normal loading: conductor temperature not to exceed 100° C (212° F).
Emergency 8 hour loading: conductor temperature not to exceed 125° C
(257°F).
The present transmission network consists of the following: Line Circuit Miles Conductor
138 kV double circuit 80.08 795 MCM ACSR 26/7
138 kV single circuit 16.86 1192 MCM ACSR 45/7
138 kV single circuit 20.61 795 MCM ACSR 26/7
230 kV single circuit 2.53 795 MCM ACSR 26/7
Total 120.08
GRU participates in Florida Reliability Coordinating Council, Inc. (FRCC)
studies that analyze multi-level contingencies. Contingencies are occurrences that
depend on changes or uncertain conditions and, as used here, represent various
equipment failures that may occur.
1.2.3 State Interconnections
The System is currently interconnected with DEF and FPL at four separate
points. The System interconnects with DEF's Archer Substation via a 230 kV
transmission line to the System's Parker Road Substation with 224 MVA of
transformation capacity from 230 kV to 138 kV. The addition of a third 112 MVA
transformer at the Parker Substation is planned, and is expected to be in service by
December 2018. The System also interconnects with DEF's Idylwild Substation with
two separate circuits via their 168 MVA 138/69 kV transformer. The System
interconnects with FPL via a 138 kV tie between FPL's Hampton Substation and the
System's Deerhaven Substation. This interconnection has a transformation capacity
7
at Bradford Substation of 224 MVA. All listed capacities are based on normal (Rating
A) capacities.
The System is planned, operated, and maintained to be in compliance with all
FERC, NERC, and FRCC requirements to assure the integrity and reliability of
Florida’s Bulk Electric System (BES).
1.3 DISTRIBUTION
The System has seven loop-fed and three radial distribution substations
connected to the transmission network: Ft. Clarke, Kelly, McMichen, Millhopper,
Serenola, Springhill, Sugarfoot, Ironwood, Kanapaha, and Rocky Point substations,
respectively. Parker Road is GRU’s only 230 kV transmission voltage substation.
The locations of these substations are shown on Figure 1.1.
The seven loop-fed distribution substations are connected to the 138 kV bulk
power transmission network with feeds that prevent the outage of a single
transmission line from causing any outages in the distribution system. Ironwood,
Kanapaha and Rocky Point are served by a single tap to the 138 kV network which
would require distribution switching to restore customer power if the single
transmission line tapped experienced an outage. GRU serves its retail customers
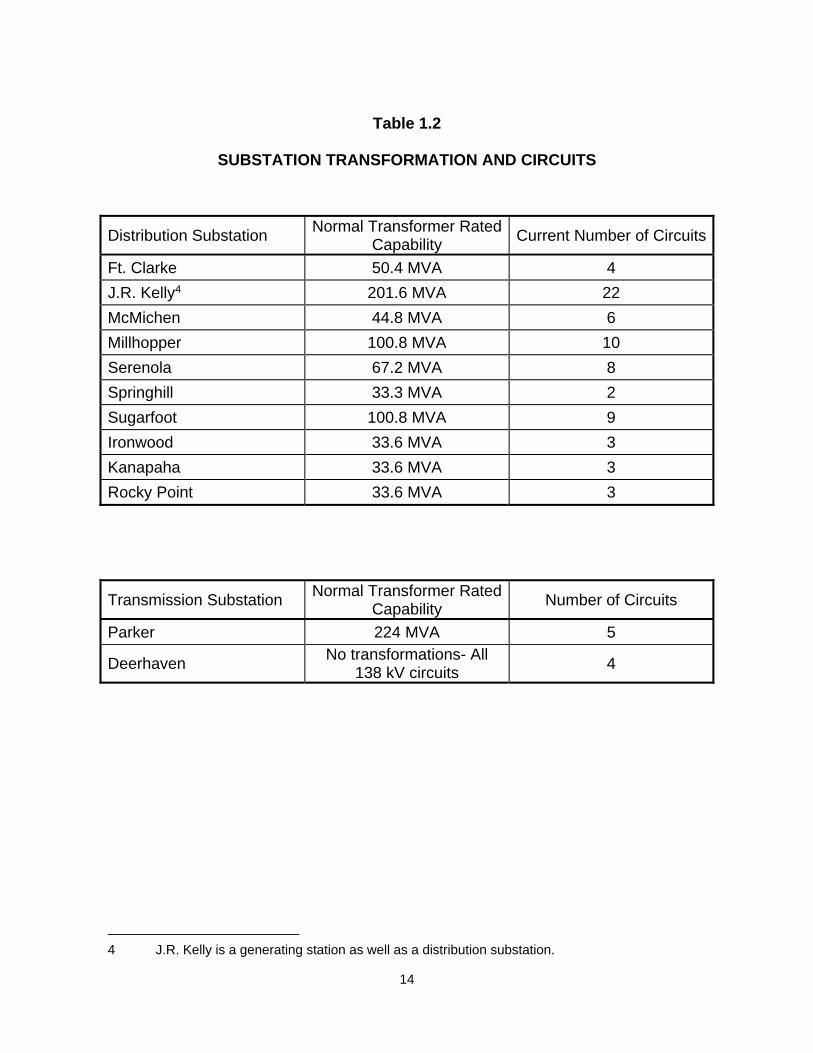
through a 12.47 kV distribution network. The distribution substations, their present
rated transformer capabilities, and the number of circuits for each are listed in Table
1.2. The System has three Power Delivery Substations (PDS) with single 33.6 MVA
transformers that are directly radial-tapped to the looped 138 kV system. The
Springhill Substation consists of one 33.3 MVA transformer served by a loop-fed
SEECO pole-mounted switch. Ft. Clarke, Kelly, McMichen, and Serenola
substations currently consist of two transformers of nearly equal size, allowing these
stations to be loaded under normal conditions to 80 percent of the capabilities shown
in Table 1.2. Millhopper and Sugarfoot Substations currently consist of three
transformers of equal size allowing both of these substations to be loaded under
normal conditions to 100 percent of the capability shown in Table 1.2. One of the two
8
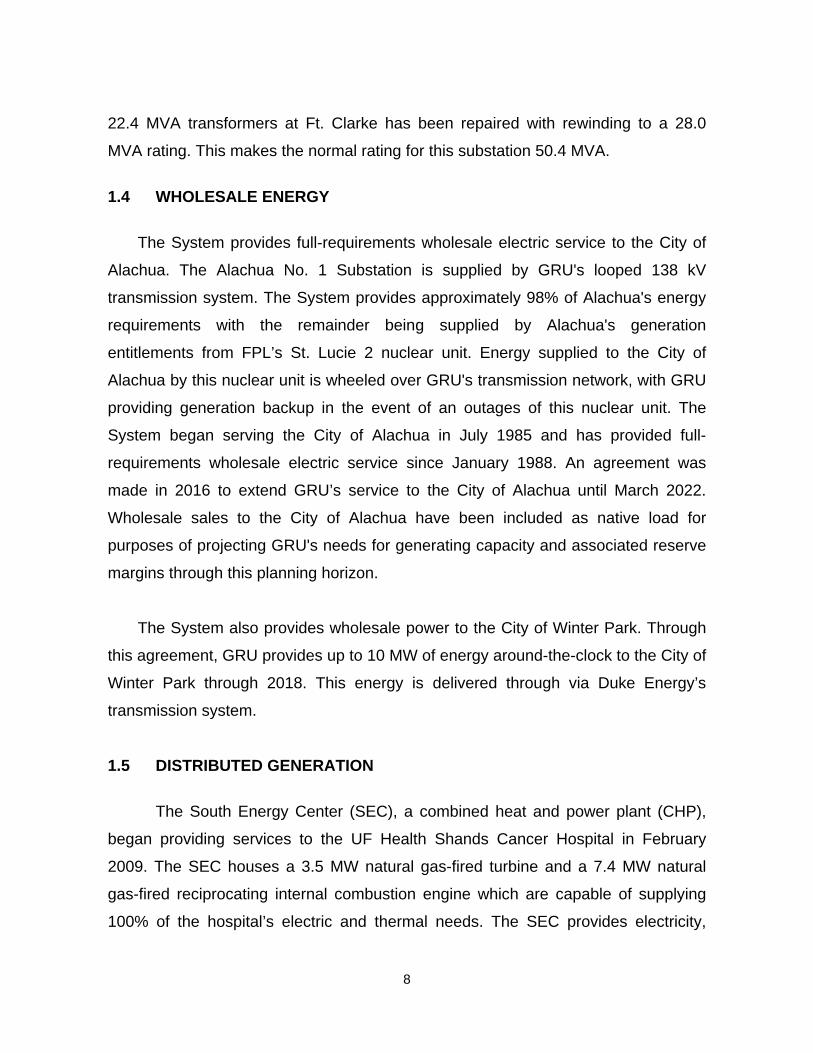
22.4 MVA transformers at Ft. Clarke has been repaired with rewinding to a 28.0
MVA rating. This makes the normal rating for this substation 50.4 MVA.
1.4 WHOLESALE ENERGY
The System provides full-requirements wholesale electric service to the City of
Alachua. The Alachua No. 1 Substation is supplied by GRU's looped 138 kV
transmission system. The System provides approximately 98% of Alachua's energy
requirements with the remainder being supplied by Alachua's generation
entitlements from FPL’s St. Lucie 2 nuclear unit. Energy supplied to the City of
Alachua by this nuclear unit is wheeled over GRU's transmission network, with GRU
providing generation backup in the event of an outages of this nuclear unit. The
System began serving the City of Alachua in July 1985 and has provided full-
requirements wholesale electric service since January 1988. An agreement was
made in 2016 to extend GRU’s service to the City of Alachua until March 2022.
Wholesale sales to the City of Alachua have been included as native load for
purposes of projecting GRU's needs for generating capacity and associated reserve
margins through this planning horizon.
The System also provides wholesale power to the City of Winter Park. Through
this agreement, GRU provides up to 10 MW of energy around-the-clock to the City of
Winter Park through 2018. This energy is delivered through via Duke Energy’s
transmission system.
1.5 DISTRIBUTED GENERATION
The South Energy Center (SEC), a combined heat and power plant (CHP),
began providing services to the UF Health Shands Cancer Hospital in February
2009. The SEC houses a 3.5 MW natural gas-fired turbine and a 7.4 MW natural
gas-fired reciprocating internal combustion engine which are capable of supplying
100% of the hospital’s electric and thermal needs. The SEC provides electricity,

9
chilled water, steam, heating hot water, and the storage and delivery of medical
gases to the hospital. The unique design is at least 75% efficient at primary fuel
conversion to useful energy and greatly reduces emissions compared to traditional
generation. The facility is designed to provide electric power into the GRU
distribution system when its capacity is not totally utilized by the hospital.

10
Figure 1.1
Gainesville Regional Utilities Electric Facilities
11
Figure 1.2
Gainesville Regional Utilities Electric System One-Line Diagram
12
Schedule 1
(1) (2) (3) (4) (5) (6) (7) (8) (9) (10) (11) (12) (13) (14) (15) (16)
Alt.
Fuel Commercial Expected
Unit Unit Primary Fuel Alternate Fuel Storage In-Service Retirement Summer Winter Summer Winter
Plant Name No. Location Type Type Trans. Type Trans. (Days) Month/Year Month/Year MW MW MW MW Status
J. R. Kelly Alachua County 110.0 120.0 108.0 118.0
FS08 Sec. 4, T10S, R20E CA WH PL DFO TK [ 4/65 ; 5/01 ] 2035 37.5 38.0 36.0 37.0 OP
GT04 (GRU) CT NG PL DFO TK 5/01 2051 72.5 82.0 72.0 81.0 OP
Deerhaven Alachua County 438.5 459.0 409.0 428.0
FS02 Secs. 26,27,35 ST BIT RR 10/81 2031 251.0 251.0 228.0 228.0 OP
FS01 T8S, R19E ST NG PL RFO TK 8/72 2022 80.0 80.0 75.0 75.0 OP
GT03 (GRU) GT NG PL DFO TK 1/96 2046 71.5 82.0 71.0 81.0 OP
GT02 GT NG PL DFO TK 8/76 2026 18.0 23.0 17.5 22.0 OP
GT01 GT NG PL DFO TK 7/76 2026 18.0 23.0 17.5 22.0 OP
South Energy Center Alachua County 12.3 12.3 10.9 10.9
GT01 (*) Sec. 10, T10S, R20E GT NG PL 5/09 2039 4.5 4.5 3.5 3.5 OP
IC02 (*) (GRU) IC NG PL 12/17 2047 7.8 7.8 7.4 7.4 OP
Deerhaven Renewable Alachua County
FS01 Sec. 26, T08, R19 ST WDS TK 12/13 2043 116.0 116.0 102.5 102.5 OP
(GRU)
System Total 630.4 659.4
Unit Type Fuel Type Transportation Method Status
CA = Combined Cycle - Steam Part BIT = Bituminous Coal PL = Pipe Line OP = Operational
CT = Combined Cycle - CT Part DFO = Distillate Fuel Oil RR = Railroad
GT = Gas Turbine NG = Natural Gas TK = Truck
ST = Steam Turbine RFO = Residual Fuel Oil
IC = Internal Combustion Engine WH = Waste Heat
WDS = Wood Waste Solids
Gross Capability Net Capability
EXISTING GENERATING FACILITIES (as of January 1, 2018)
13
Table 1.1
TRANSMISSION LINE RATINGS SUMMER POWER FLOW LIMITS
Line Number Description
Normal 100°C (MVA)
Limiting Device
Emergency 125°C (MVA)
Limiting Device
1 McMichen - Depot East 236.2 Conductor 282.0 Conductor 2 Millhopper- Depot West 236.2 Conductor 282.0 Conductor 3 Deerhaven - McMichen 236.2 Conductor 282.0 Conductor 6 Deerhaven - Millhopper 236.2 Conductor 282.0 Conductor 7 Depot East - Idylwild 236.2 Conductor 282.0 Conductor 8 Depot West - Serenola 236.2 Conductor 282.0 Conductor 9 Idylwild - Parker 236.2 Conductor 236.2 Conductor
10 Serenola - Sugarfoot 236.2 Conductor 282.0 Conductor 11 Parker - Clay Tap 143.6 Conductor 282.0 Conductor 12 Parker - Ft. Clarke 236.2 Conductor 282.0 Conductor 13 Clay Tap - Ft. Clarke 143.6 Conductor 186.0 Conductor 14 Ft. Clarke - Springhill 287.3 Switch 356.0 Conductor 15 Deerhaven - Hampton 224.01 Transformers 270.0 Transformers 16 Sugarfoot - Parker 236.2 Conductor 282.0 Conductor 17 Clay Tap – Farnsworth 236.2 Conductor 282.0 Conductor 19 Springhill - Alachua 300.0 Conductor 356.0 Conductor 20 Parker-Archer(T75,T76) 224.0 Transformers3 300.0 Transformers3
21 Deerhaven – GREC 287.3 Switch 356.0 Conductor 22 Alachua - Deerhaven 300.0 Conductor 356.0 Conductor xx Idylwild – PEF 168.02 Transformer 168.02 Transformer
1) These two transformers are located at the FPL Bradford Substation and are the limiting
elements in the Normal and Emergency ratings for this intertie. 2) This transformer, along with the entire Idylwild Substation, is owned and maintained by PEF. 3) Transformers T75 & T76 normal limits are based on a 65° C temperature rise rating, and the
emergency rating is 140% loading for two hours. Assumptions:
100 C for normal conductor operation 125 C for emergency 8 hour conductor operation 40 C ambient air temperature 2 ft/sec wind speed
14
Table 1.2
SUBSTATION TRANSFORMATION AND CIRCUITS
Distribution Substation Normal Transformer Rated
Capability Current Number of Circuits
Ft. Clarke 50.4 MVA 4
J.R. Kelly4 201.6 MVA 22
McMichen 44.8 MVA 6
Millhopper 100.8 MVA 10
Serenola 67.2 MVA 8
Springhill 33.3 MVA 2
Sugarfoot 100.8 MVA 9
Ironwood 33.6 MVA 3
Kanapaha 33.6 MVA 3
Rocky Point 33.6 MVA 3
Transmission Substation Normal Transformer Rated
Capability Number of Circuits
Parker 224 MVA 5
Deerhaven No transformations- All
138 kV circuits 4
4 J.R. Kelly is a generating station as well as a distribution substation.

15
2. FORECAST OF ELECTRIC ENERGY AND DEMAND REQUIREMENTS
Section 2 includes documentation of GRU's forecast of number of customers,
energy sales and seasonal peak demands; a forecast of energy sources and fuel
requirements; and an overview of GRU's involvement in demand-side management
programs.
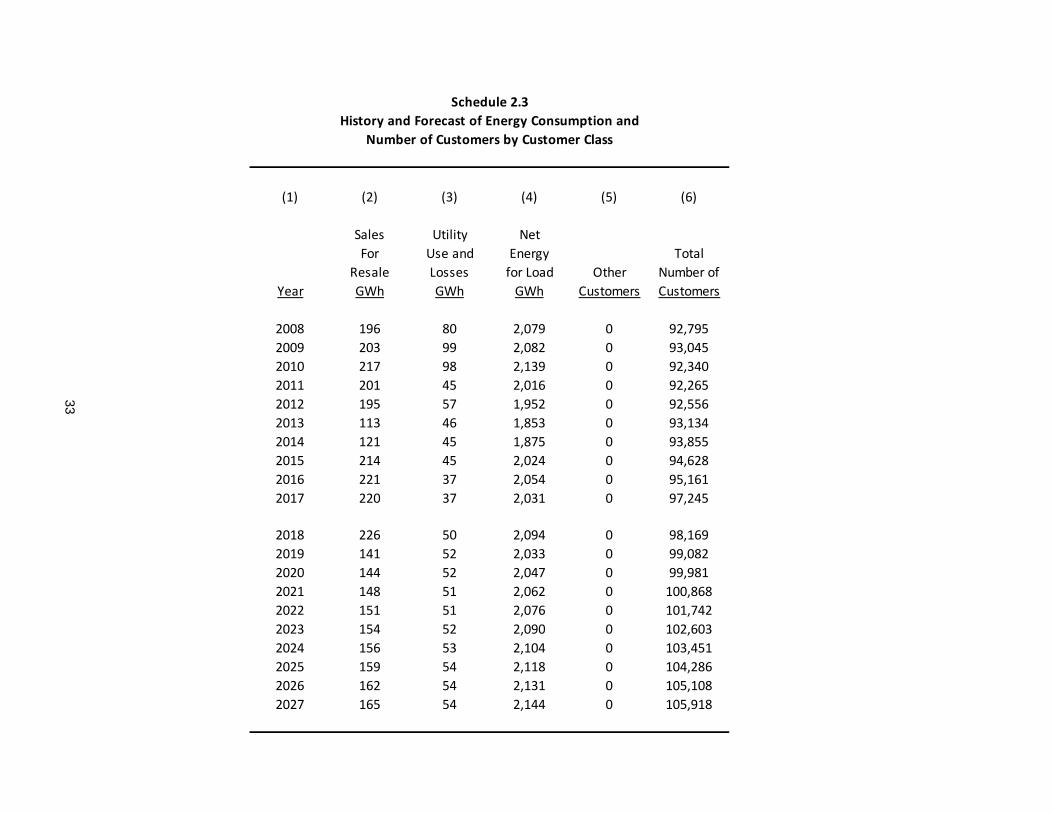
The accompanying tables provide historical and forecast information for
calendar years 2008-2027. Energy sales and number of customers are tabulated in
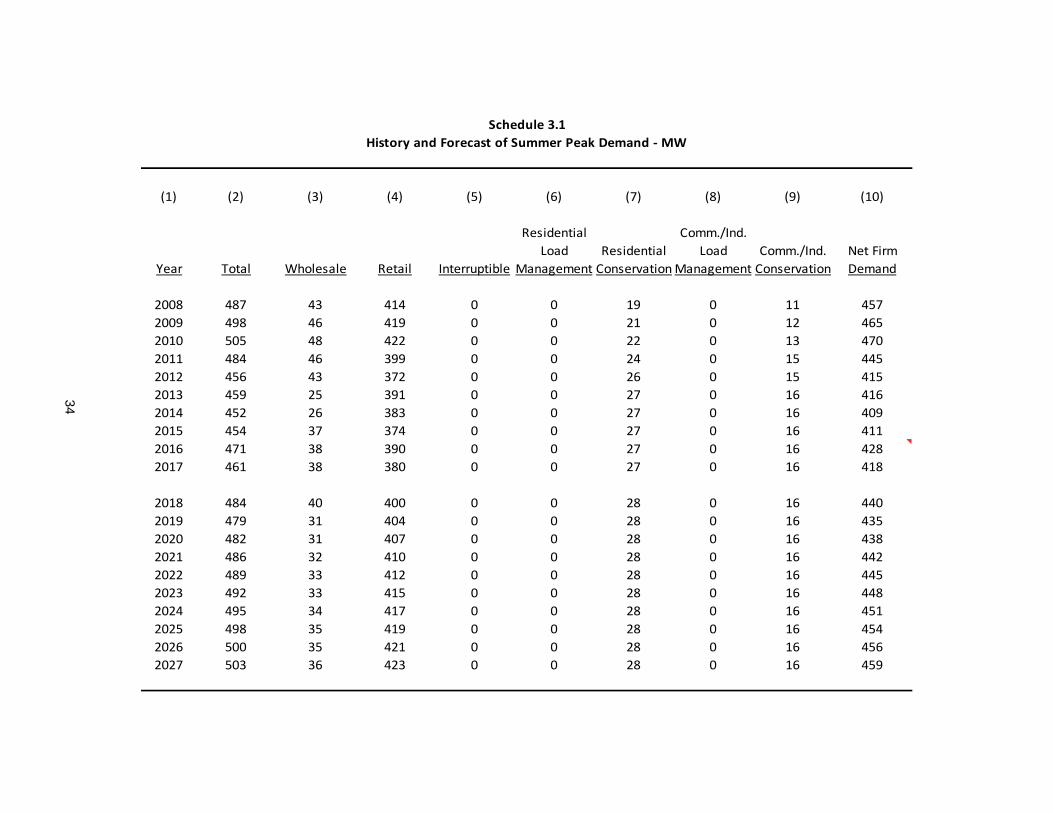
Schedules 2.1, 2.2, and 2.3. Schedule 3.1 gives summer peak demand for the base
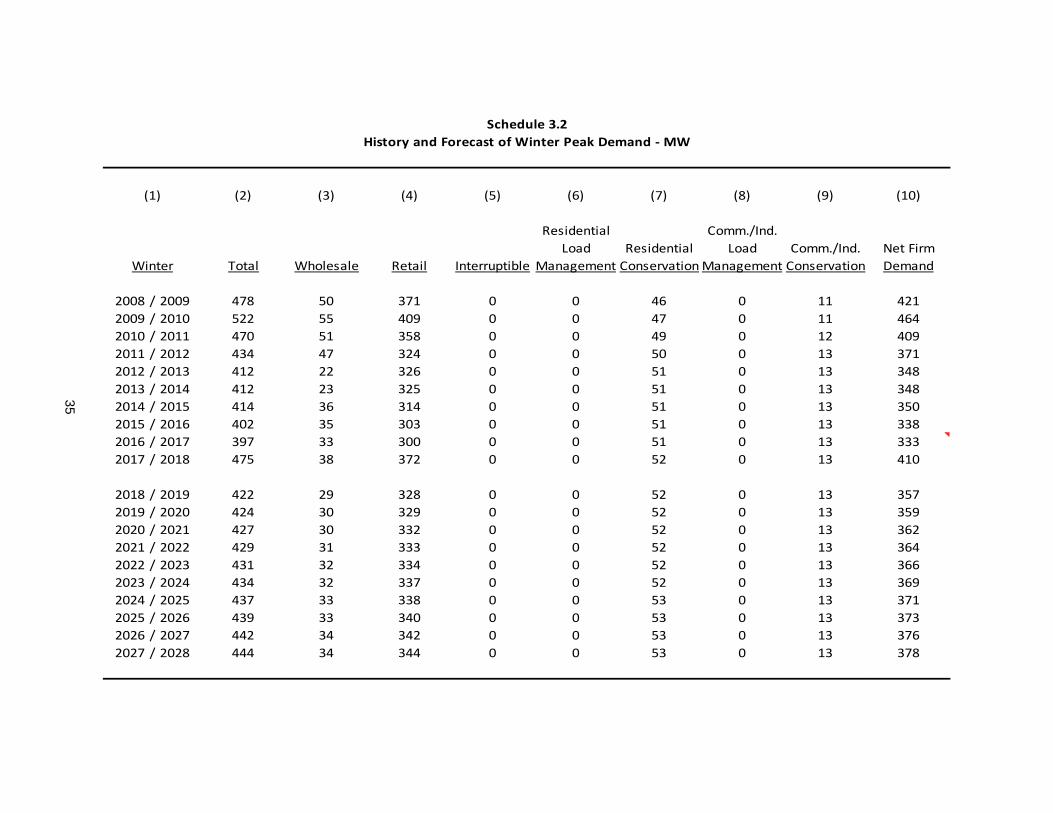
case forecast by reporting category. Schedule 3.2 presents winter peak demand for
the base case forecast by reporting category. Schedule 3.3 presents net energy for
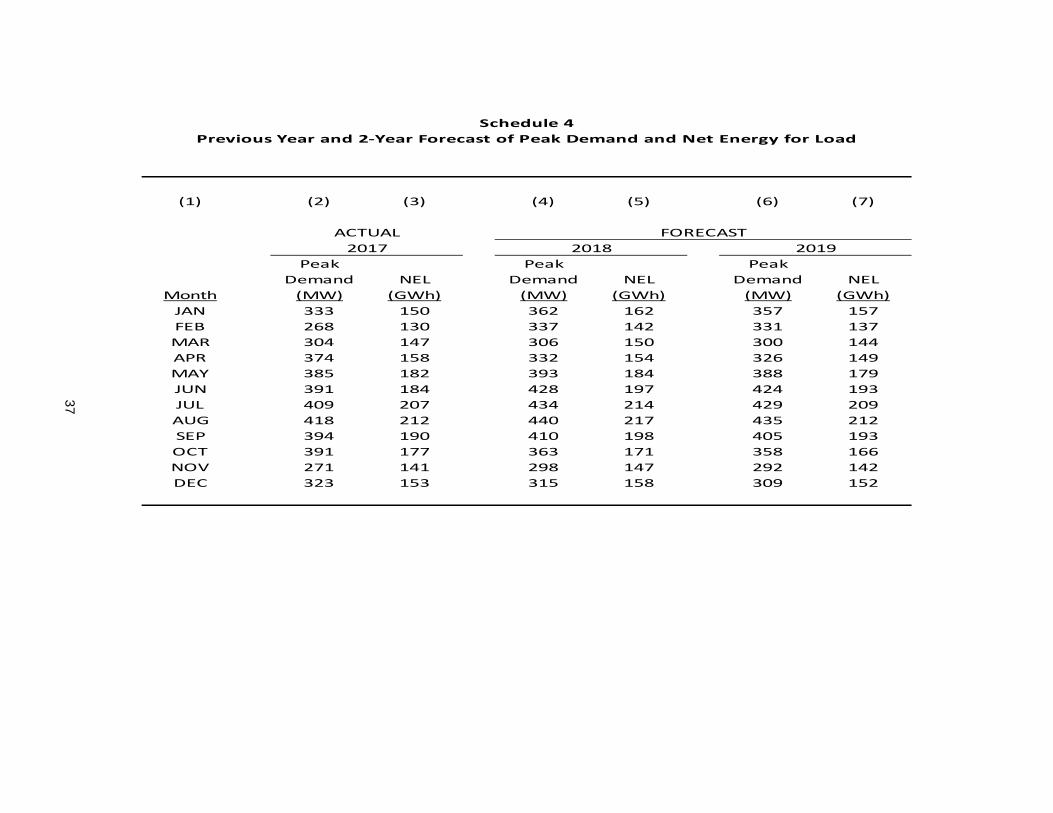
load for the base case forecast by reporting category. Short-term monthly load data
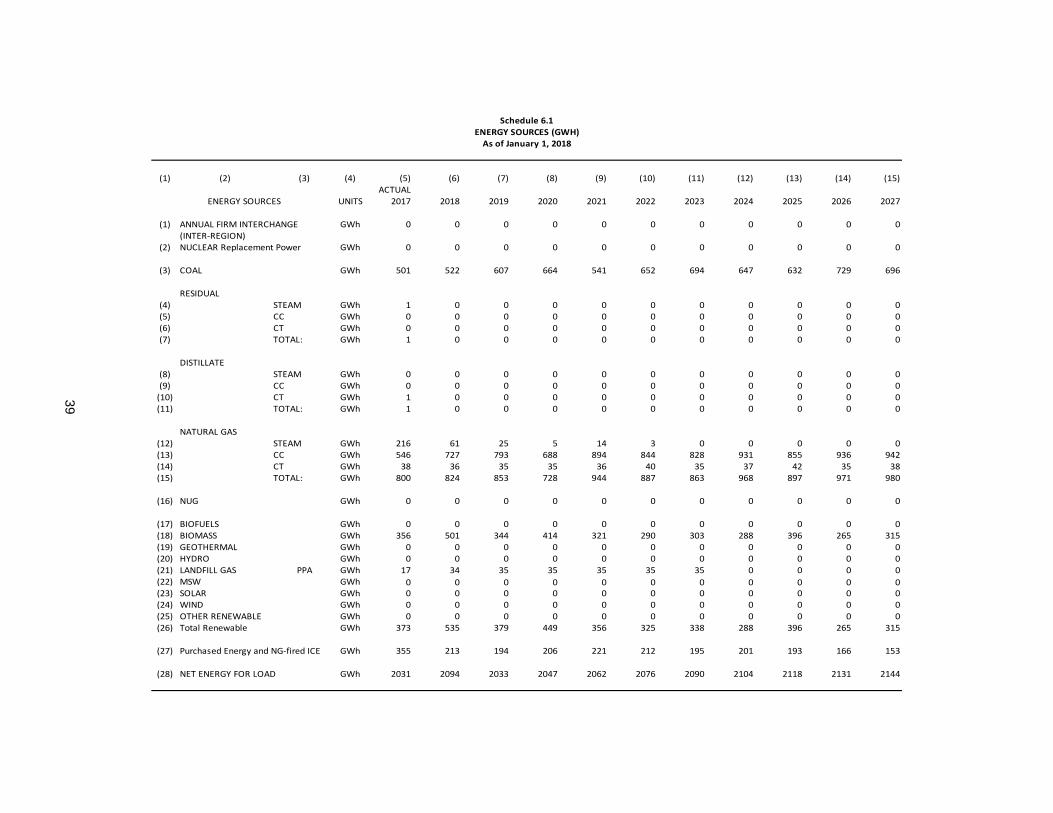
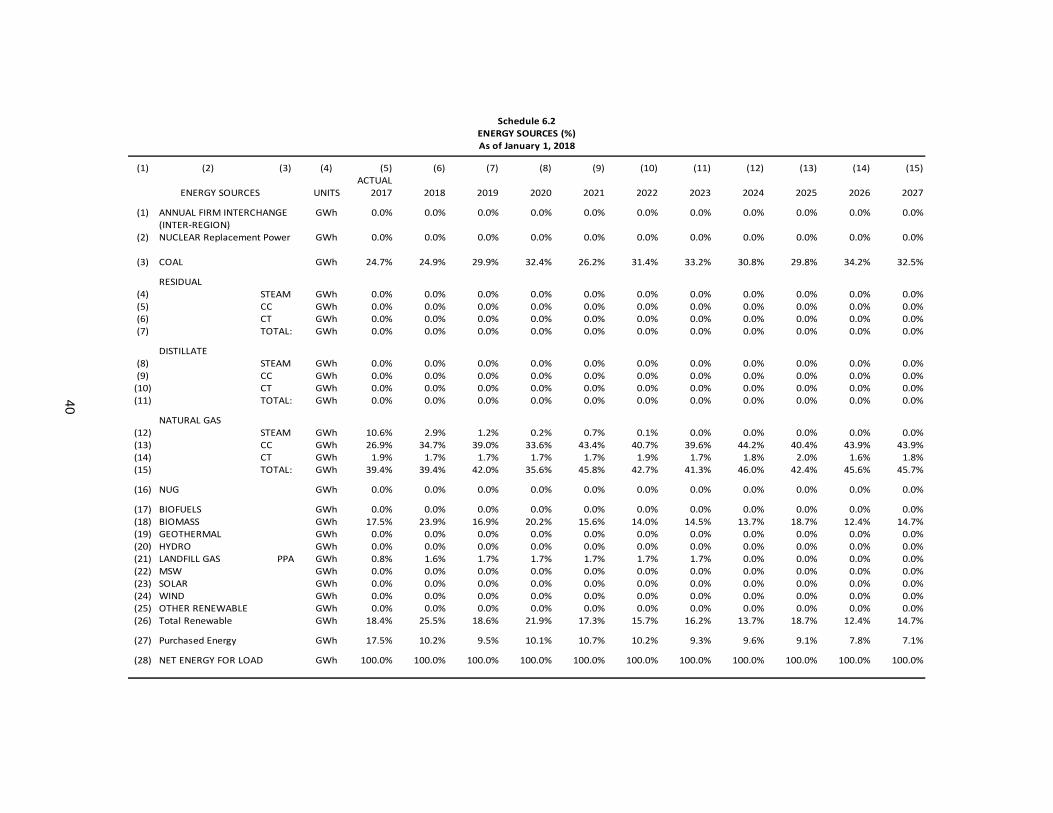
is presented in Schedule 4. Projected sources of energy for the System, by method
of generation, are shown in Schedule 6.1. The percentage breakdowns of energy
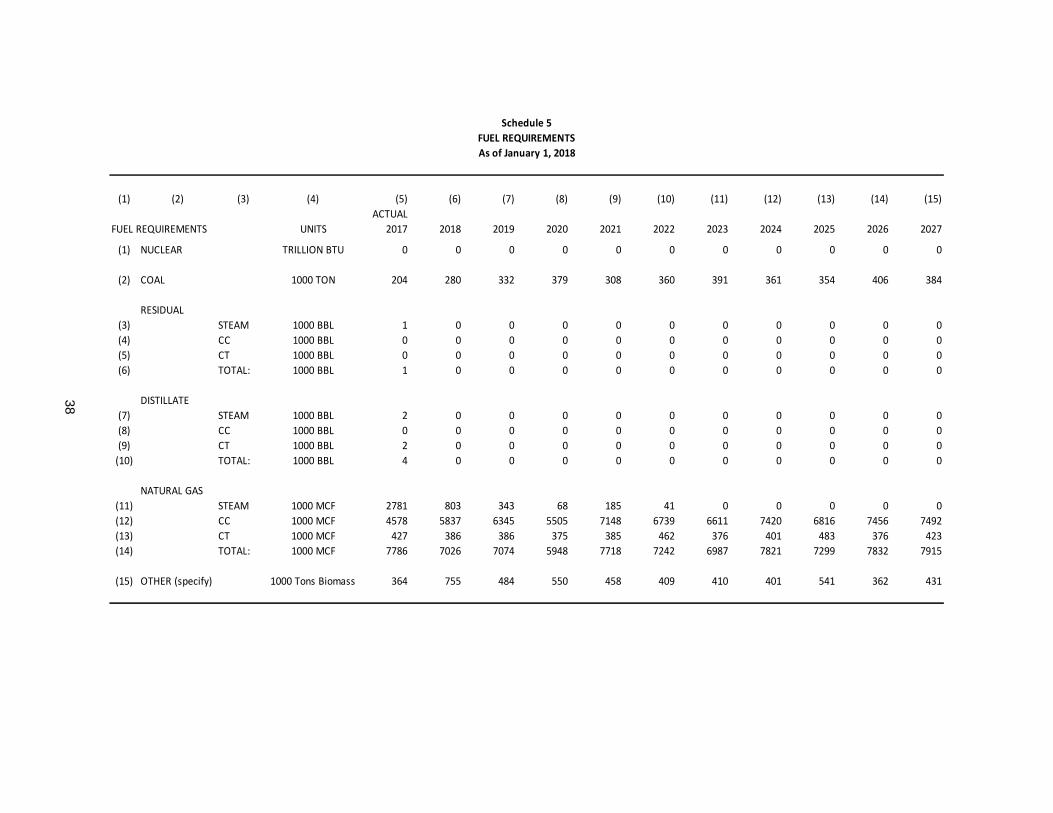
sources shown in Schedule 6.1 are given in Schedule 6.2. The quantities of fuel
expected to be used to generate the energy requirements shown in Schedule 6.1
are given by fuel type in Schedule 5.
2.1 FORECAST ASSUMPTIONS AND DATA SOURCES
(1) All regression analyses were based on annual data. Historical data was compiled for calendar years 1970 through 2017. System data, such as net energy for load, seasonal peak demands, customer counts and energy sales, was obtained from GRU records and sources.
(2) Estimates and projections of Alachua County population were based
on population data published by The Bureau of Economic and Business Research at the University of Florida. Population projections used in GRU’s forecast were based on the average of projections from BEBR Bulletins 171, 174, 177 and 180, and Florida Estimates of Population 2017 .
(3) Historical weather data was used to fit regression models. The forecast
assumes normal weather conditions. Normal heating degree days and

16
cooling degree days equal the mean of data reported to NOAA by the Gainesville Municipal Airport station from 1984-2017.
(4) All income and price figures were adjusted for inflation, and indexed to
a base year of 2017, using the U.S. Consumer Price Index for All Urban Consumers from the U.S. Department of Labor, Bureau of Labor Statistics. Inflation is assumed to average approximately 2.25% per year for each year of the forecast.
(5) The U.S. Department of Commerce, Bureau of Economic Analysis,
provided historical estimates of total personal income. Forecast values of total personal income were obtained from IHS Global Insight.
(6) Historical estimates of household size were obtained from BEBR
Bulletin 179 (December 2017), and projections were estimated from a logarithmic trend analysis of historical estimates.
(7) The U.S. Department of Labor, Bureau of Labor Statistics, provided
historical estimates of non-farm employment. Forecast values of non-farm employment were obtained from IHS Global Insight.
(8) Retail electric prices for each billing rate category were assumed to
increase at a nominal rate of approximately 2.5% per year. Prices are expressed in dollars per 1,000 kWh.
(9) Estimates of energy and demand reductions resulting from planned
demand-side management programs (DSM) were subtracted from all retail forecasts. GRU has been involved in formal conservation efforts since 1980. The forecast reduces energy sales and seasonal demands by the projected conservation impacts, net of cumulative impacts from 1980-2017. GRU's involvement with DSM is described in more detail later in this section.
(10) Sales to The City of Alachua were assumed to continue through the
duration of this forecast. The agreement to serve Alachua is in effect through March 2022. Alachua’s ownership of FPL nuclear capacity supplied approximately 2.4% of its annual energy requirements in 2017.
(11) GRU will supply 10 MW of base load energy to the City of Winter Park
from 2015 through 2018.
17
2.2 FORECASTS OF NUMBER OF CUSTOMERS, ENERGY SALES AND SEASONAL PEAK DEMANDS
Number of customers, energy sales and seasonal peak demands were
forecast from 2018 through 2027. Separate energy sales forecasts were developed
for each of the following customer segments: residential, general service non-
demand, general service demand, large power, outdoor lighting, sales to the City of
Alachua, and sales to the City of Winter Park. Separate forecasts of number of
customers were developed for residential, general service non-demand, general
service demand and large power retail rate classifications. The basis for these
independent forecasts originated with the development of least-squares regression
models. All modeling was performed in-house using the Statistical Analysis System
(SAS)5. The following text describes the regression equations utilized to forecast
energy sales and number of customers.
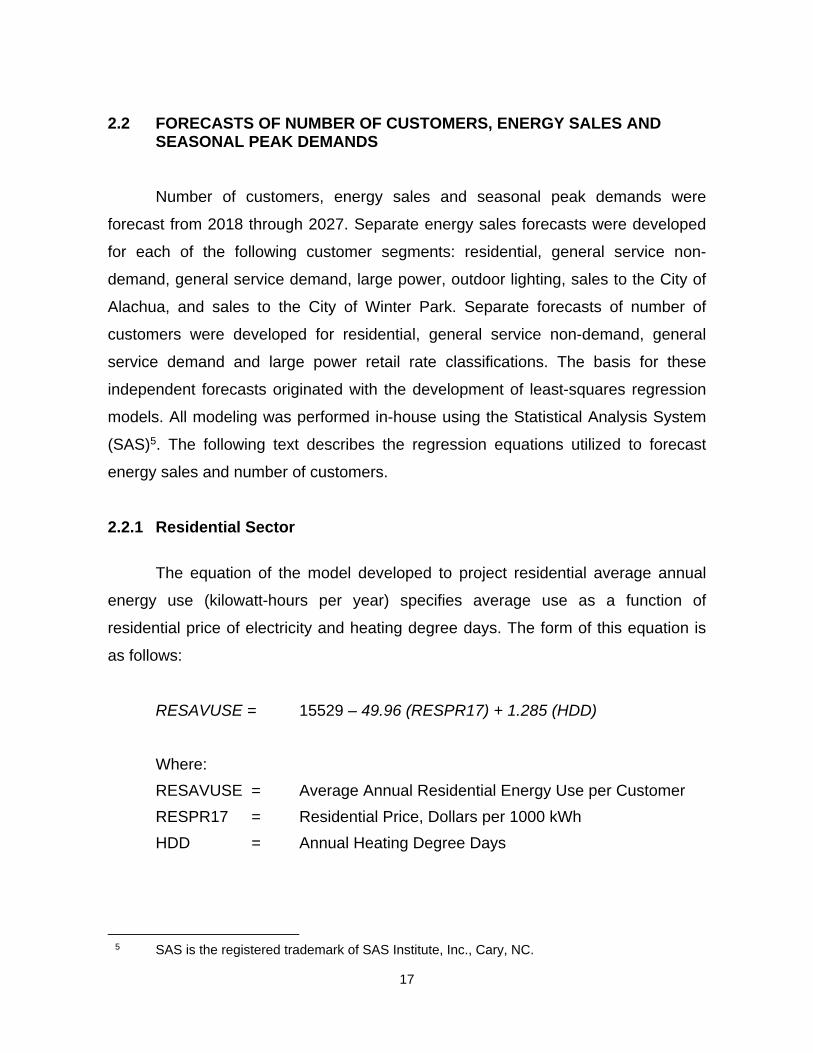
2.2.1 Residential Sector
The equation of the model developed to project residential average annual
energy use (kilowatt-hours per year) specifies average use as a function of
residential price of electricity and heating degree days. The form of this equation is
as follows:
RESAVUSE = 15529 – 49.96 (RESPR17) + 1.285 (HDD)
Where:
RESAVUSE = Average Annual Residential Energy Use per Customer
RESPR17 = Residential Price, Dollars per 1000 kWh
HDD = Annual Heating Degree Days
5 SAS is the registered trademark of SAS Institute, Inc., Cary, NC.
18
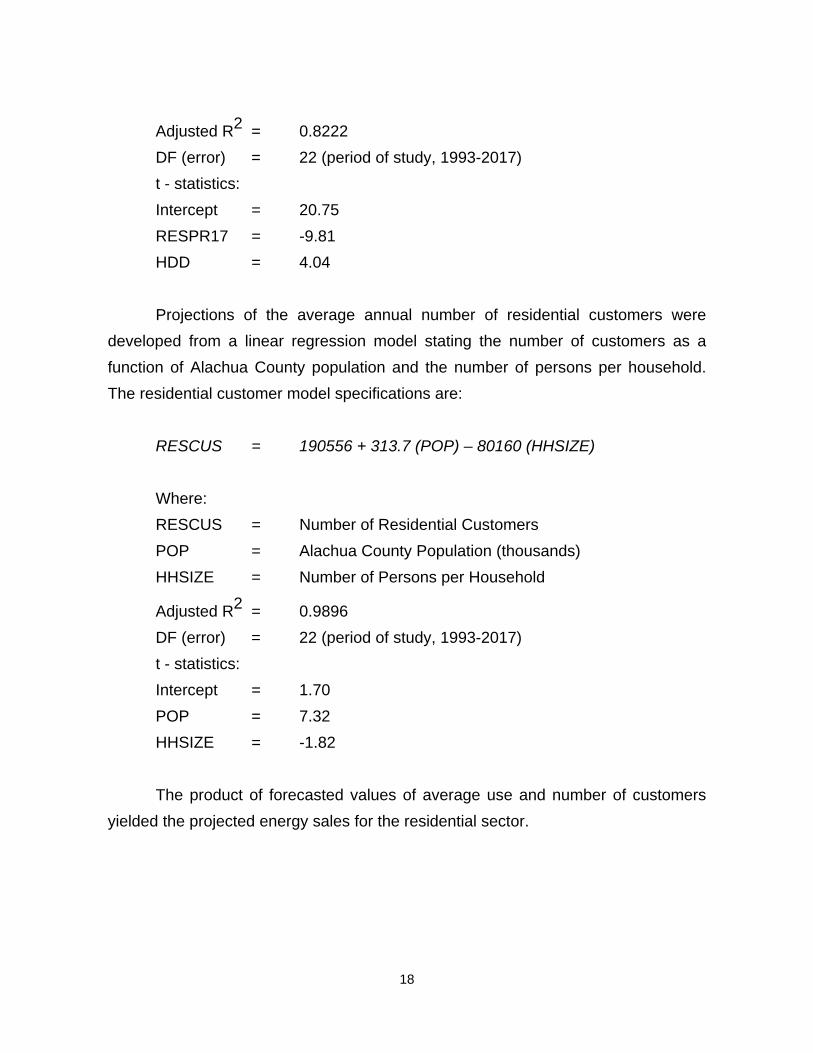
Adjusted R2 = 0.8222
DF (error) = 22 (period of study, 1993-2017)
t - statistics:
Intercept = 20.75
RESPR17 = -9.81
HDD = 4.04
Projections of the average annual number of residential customers were
developed from a linear regression model stating the number of customers as a
function of Alachua County population and the number of persons per household.
The residential customer model specifications are:
RESCUS = 190556 + 313.7 (POP) – 80160 (HHSIZE)
Where:
RESCUS = Number of Residential Customers
POP = Alachua County Population (thousands)
HHSIZE = Number of Persons per Household
Adjusted R2 = 0.9896
DF (error) = 22 (period of study, 1993-2017)
t - statistics:
Intercept = 1.70
POP = 7.32
HHSIZE = -1.82
The product of forecasted values of average use and number of customers
yielded the projected energy sales for the residential sector.
19
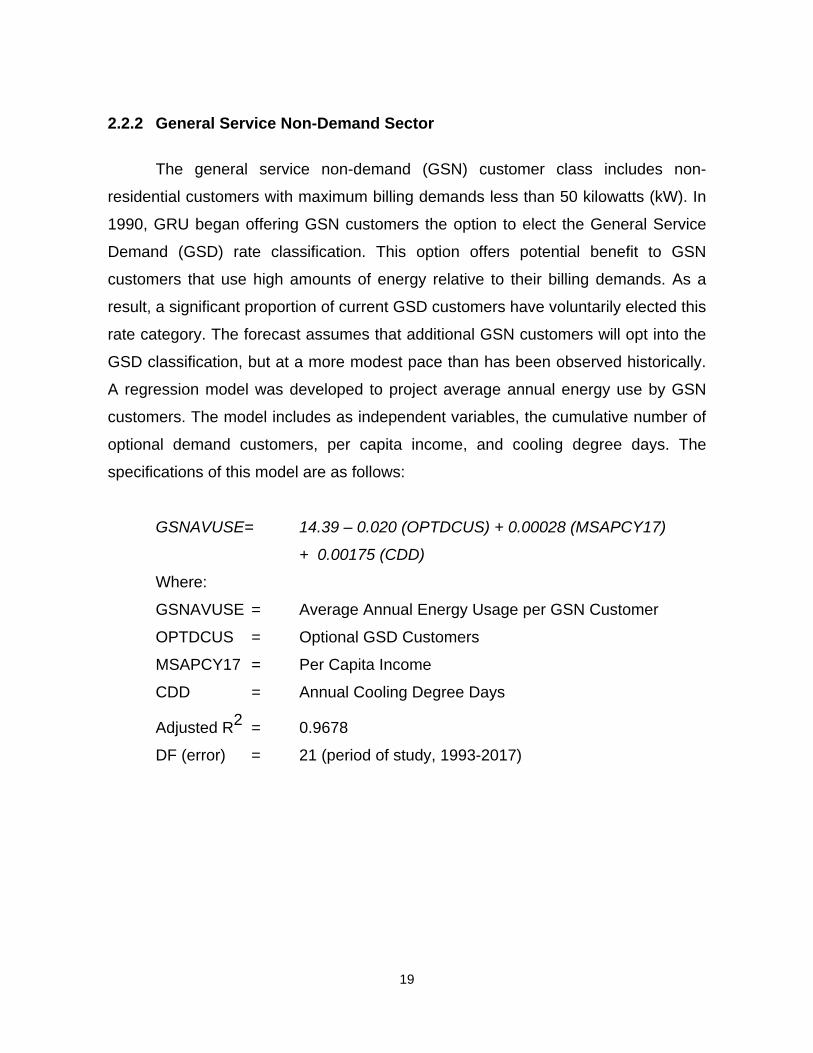
2.2.2 General Service Non-Demand Sector
The general service non-demand (GSN) customer class includes non-
residential customers with maximum billing demands less than 50 kilowatts (kW). In
1990, GRU began offering GSN customers the option to elect the General Service
Demand (GSD) rate classification. This option offers potential benefit to GSN
customers that use high amounts of energy relative to their billing demands. As a
result, a significant proportion of current GSD customers have voluntarily elected this
rate category. The forecast assumes that additional GSN customers will opt into the
GSD classification, but at a more modest pace than has been observed historically.
A regression model was developed to project average annual energy use by GSN
customers. The model includes as independent variables, the cumulative number of
optional demand customers, per capita income, and cooling degree days. The
specifications of this model are as follows:
GSNAVUSE= 14.39 – 0.020 (OPTDCUS) + 0.00028 (MSAPCY17)
+ 0.00175 (CDD)
Where:
GSNAVUSE = Average Annual Energy Usage per GSN Customer
OPTDCUS = Optional GSD Customers
MSAPCY17 = Per Capita Income
CDD = Annual Cooling Degree Days
Adjusted R2 = 0.9678
DF (error) = 21 (period of study, 1993-2017)
20
t - statistics:
Intercept = 3.82
OPTDCUS = -13.85
MSAPCY17 = 2.96
CDD = 2.58
The number of general service non-demand customers was projected using
an equation specifying customers as a function of Alachua County population and
the addition of a group of individually metered cable amplifiers that were previously
bulk metered. The specifications of the general service non-demand customer model
are as follows:
GSNCUS = -2442 + 45.9 (POP) + 0.74 (COXTRAN)
Where:
GSNCUS = Number of General Service Non-Demand Customers
POP = Alachua County Population (thousands)
COXTRAN = Cable TV Meters
Adjusted R2 = 0.9934
DF (error) = 22 (period of study, 1993-2017)
t - statistics:
Intercept = -7.90
POP = 32.09
COXTRAN = 4.90
Forecasted energy sales to general service non-demand customers were
derived from the product of projected number of customers and the projected
average annual use per customer.
21
2.2.3 General Service Demand Sector
The general service demand customer class includes non-residential
customers with average billing demands generally of at least 50 kW but less than
1,000 kW. Average annual energy use per customer was projected using an
equation specifying average use as a function of the cumulative number of optional
demand customers, non-farm employment, cooling degree days, and an indicator
variable representing a change in eligibility criteria for the large power rate category.
Average energy use projections for general service demand customers result from
the following model:
GSDAVUSE= 382.9 – 0.24 (OPTDCUS) + 0.87 (MSA_NF)
+ 0.030 (CDD) + 39.4 (POLICY)
Where:
GSDAVUSE = Average Annual Energy Use by GSD Customers
OPTDCUS = Optional GSD Customers
MSA_NF = Non-Farm Employment
CDD = Cooling Degree Days
POLICY = Eligibility Indicator Variable
Adjusted R2 = 0.9291
DF (error) = 20 (period of study, 1993-2017)
t - statistics:
Intercept = 8.15
OPTDCUS = -12.36
MSA_NF = 2.68
CDD = 3.18
POLICY = 6.53
The annual average number of customers was projected using a regression
model that includes Alachua County population. The specifications of the general
service demand customer model are as follows:

22
GSDCUS = -1112 + 9.38 (POP)
Where:
GSDCUS = Number of General Service Demand Customers
POP = Alachua County Population (thousands)
Adjusted R2 = 0.9563
DF (error) = 23 (period of study, 1993-2017)
t - statistics:
Intercept = -11.89
POP = 22.95
The forecast of energy sales to general service demand customers was the
resultant product of projected number of customers and projected average annual
use per customer.
2.2.4 Large Power Sector
The large power customer class currently includes twelve customers that maintain
an average monthly billing demand of at least 1,000 kW. The forecast of large power
energy sales was developed via analysis of each individual account. Recent
historical energy sales were examined for the presence of any trends in usage
patterns. For two of the twelve customers, estimated impacts of known expansions
were incorporated into their projected sales. With the exception of these two
customer expansions, the forecast of sales to large power customers is held
constant through the forecast horizon.
The number of customers in the large power sector is expected to remain
constant at 12 customers. Future forecasts will incorporate known, specific changes
within this sector when and if they are identified.

23
2.2.5 Outdoor Lighting Sector
The outdoor lighting sector consists of streetlight, traffic light, and rental light
accounts. Outdoor lighting energy sales account for approximately 1.3% of total
energy sales. Outdoor lighting energy sales were held constant at current levels in
this forecast.
2.2.6 Wholesale Energy Sales
The System provides full requirements wholesale electric service to the City
of Alachua. Approximately 2.4% of Alachua's 2017 energy requirements were met
through generation entitlements of nuclear generating units operated by FPL. The
agreement to provide wholesale power to Alachua is in effect through March 2022.
Energy sales to the City of Alachua are considered part of the System’s native load
for facilities planning through the forecast horizon.
Energy Sales to Alachua were estimated using a model including Alachua
County population, heating degree days, and cooling degree days as the
independent variables. The model used to develop projections of sales to the City of
Alachua is of the following form:
ALAMWh = -262910 + 1386 (POP) + 12.0 (HDD) + 8.7 (CDD)
Where:
ALAMWh = Energy Sales to the City of Alachua (MWh)
POP = Alachua County Population (000’s)
HDD = Heating Degree Days
CDD = Cooling Degree Days
Adjusted R2 = 0.9804
DF (error) = 20 (period of study, 1994-2017)
24
t - statistics:
Intercept = -15.9
POP = 32.1
HDD = 3.03
CDD = 1.82
GRU is also selling base load energy to the City of Winter Park from 2015
through 2018. The agreement calls for Winter Park to purchase 10 MW for all but
500 hours each year, when they may purchase as little as 5 MW.
2.2.7 Total System Sales, Net Energy for Load, Seasonal Peak Demands and Conservation Impacts
The forecast of total system energy sales was derived by summing energy
sales projections for each customer class; residential, general service non-demand,
general service demand, large power, outdoor lighting, and sales for resale. Net
energy for load (NEL) was then forecast by applying a delivered efficiency factor for
the System to total energy sales. The projected delivered efficiency factor used in
this forecast is 0.9750. Historical delivered efficiencies were examined from the past
25 years to make this determination. The impact of energy savings from
conservation programs was accounted for in energy sales to each customer class,
prior to calculating NEL.
The forecasts of seasonal peak demands were derived from forecasts of
annual NEL. Winter peak demands are expected to occur in January of each year,
and summer peak demands are expected to occur in August. The average ratio of
the most recent 25 years' monthly NEL for January and August, as a portion of
annual NEL, was applied to projected annual NEL to obtain estimates of January
and August NEL over the forecast horizon. The medians of the past 25 years' load
factors for January and August were applied to January and August NEL projections,
yielding seasonal peak demand projections. Forecast seasonal peak demands
include the net impacts from planned conservation programs.

25
2.3 ENERGY SOURCES AND FUEL REQUIREMENTS
2.3.1 Fuels Used by System
Presently, the System is capable of using coal, woody biomass, natural gas,
residual oil, and distillate oil to satisfy its fuel requirements. Since the completion of
the Deerhaven 2 coal-fired unit, the System has relied upon coal to fulfill much of its
fuel requirements. However, with lower natural gas prices, and subsequent fuel
switching, natural gas has become the largest portion of generation fuel. Because
the System participates in interchange sales and purchases, and because fuel
prices constantly change, actual consumption of these fuels will likely differ from the
base case requirements indicated in Schedule 5.
2.3.2 Purchased Power Agreements
2.3.2.1 G2 Energy Baseline Landfill Gas. GRU entered a 15-year contract
with G2 Energy Marion, LLC and began receiving 3 MW of landfill gas fueled
capacity in January 2009. G2 completed a capacity expansion of 0.8 MW in May
2010, bringing net output to 3.8 MW. G2 is located within DEF’s distribution system,
and GRU receives approximately 3.7 MW net of distribution and transmission
losses.
2.3.2.2 Solar Feed-In Tariff. In March of 2009, GRU became the first utility
in the United States to offer a European-style solar feed-in tariff (FIT). Under this
program, GRU agrees to purchase 100% of the solar power produced from any
qualified private generator at a fixed rate for a contract term of 20 years. GRU’s FIT
costs are recovered through fuel adjustment charges, and have been limited to 4
MW of installed capacity per year. Through the end of 2013, approximately 18.6 MW
were constructed under the Solar FIT program. The program was originally
scheduled to add capacity through 2016, although no additions were allocated after
2013.
26
2.4 DEMAND-SIDE MANAGEMENT
2.4.1 Demand-Side Management Programs
Demand and energy forecasts outlined in this Ten-Year Site Plan include
impacts from GRU’s Demand-Side Management (DSM) programs. The System
forecast reflects the incremental impacts of DSM measures, net of cumulative
impacts from 1980 through 2017.
During 2014 budget deliberations, GRU management and the Gainesville City
Commission agreed to eliminate the majority of programs offering financial
incentives in an effort to cut costs and keep prices down for customers. The
effectiveness of historical measures is reflected in usage data. Over the past 10
years, residential usage per customer has declined 0.70% per year and non-
residential usage per customer has declined 0.81% per year.
DSM direct services currently available to the System’s residential customers
include energy and water surveys, allowances for whole house energy efficiency
improvements under the Low-income Energy Efficiency Program Plus (LEEPplus),
and natural gas rebates for new construction and conversions in existing homes for
water heating, central heating, clothes drying and cooking appliances. An on-line
energy survey is available that allows customers to perform a self-survey using their
actual usage data.
Energy and water surveys are available at no cost to the System’s non-
residential customers. Rebates for natural gas water heating are also available to
GRU’s non-residential customers.

27
The System continues to offer standardized interconnection procedures and
net meter billing for both residential and non-residential customers who install
photovoltaic solar systems on their homes or businesses.
GRU has also produced numerous factsheets, publications, and videos which
are available at no charge to customers and which assist them in making informed
decisions affecting their consumption.
2.4.2 Demand-Side Management Methodology and Results
Energy and demand savings resulting from DSM program implementation
have been estimated using a combination of techniques, including engineering
calculations, pre and post billing analysis, and measurement and verification for
specific measures. Known interactions between measures and programs were
accounted for where possible. From 1980 through 2017, GRU estimates that utility-
sponsored DSM programs reduced energy sales by 219 GWh and lowered summer
peak demand by 43 MW. In the forecast period, DSM related savings are projected
to be very small relative to system load due to the scaling back of programs in this
and future years’ budgets.
2.4.3 Supply Side Programs
The System has undertaken several initiatives to improve the adequacy and
reliability of the transmission and distribution systems. GRU purchases overhead
and underground transformers that exceed the efficiency specified by the NEMA TP-
1 Standard. GRU has improved the feeder system by reconductoring feeders from
4/0 Copper to 795 MCM aluminum overhead conductor. In specific areas the feeders
have been installed underground using 1000 MCM underground cable. GRU adds
capacitors on its distribution feeders where necessary to support a high system-wide
power factor. Starting in 2012 to present day, GRU has conducted a Cable
Restoration Project, where direct-buried underground primary cables installed prior
28
to 1980 are injected with a solution that restores the insulation of the cable and
extends the cable’s useful life. Efforts have been made to increase segmentation of
feeders by adding more fusing stages, which reduces the number of customers
behind any one device. This reduces the number of customers affected by any one
outaged device. Efforts in distribution automation have included adding reclosers
and automated switches, which decreases outage times by enabling GRU’s system
operators to remotely switch customers to adjacent feeders when outages occur.
2.5 FUEL PRICE FORECAST ASSUMPTIONS
GRU relies on coal and natural gas as primary fuels used to meet its
generation needs. The System now also includes woody biomass as a major fuel
source. Both heavy and light fuel oils are used as backup for natural gas-fired
generation, although in practice they are seldom used. Since the operation of CR3
was discontinued, nuclear fuel is no longer part of the System’s fuel mix. GRU
consults a number of reputable sources such as EIA, PIRA, Argus Coal Daily, Platts
Gas Daily, Coaldesk, and the NYMEX futures market when assessing expected
future commodity fuel prices. Costs associated with transporting coal and natural
gas to GRU’s generating stations are specific to arrangements with transportation
entities. Coal is transported to GRU by CSX rail, and natural gas is transported over
the Florida Gas Transmission Company (FGT) pipeline system.
2.5.1 Coal
Coal was used to generate approximately 28.6% of the energy produced by
the system in calendar year 2017. Thus far, GRU has purchased low sulfur and
medium sulfur, high Btu eastern coal for use in Deerhaven Unit 2. In 2009,
Deerhaven Unit 2 was retrofitted with an air quality control system, which was added
as a means of complying with new environmental regulations. Following this retrofit,
Deerhaven Unit 2 is able to utilize coals with up to approximately 2.9% sulfur
content. Given the impact of impending environmental regulations on coal

29
generating units, reduced demand, and depressed prompt prices for Central
Appalachian (CAPP) coal, GRU has continued to purchase relatively high quality
Eastern coals. Rates available under GRU’s rail transport contract also provide an
incentive for GRU to purchase and transport its coal supplies on the East Coast. The
forecast of coal prices is based on a blend of low sulfur and medium sulfur CAPP
coal. GRU’s forecast of coal pricing assumes that 2018 and 2019 coal procurement
will primarily consist of high quality CAPP coals. GRU does not expect the favorable
economics of rail transported CAPP coal to be diminished in the near term. Although
not included in its forecast pricing, GRU continues to evaluate the economics of
Illinois Basin and Northern Appalachian (NAPP) coal supply. Pricing of these coals
was sourced from Argus Coal Daily and CoalDesk publications. GRU has a contract
with CSXT for delivery of coal to the Deerhaven plant site through 2019. Rates for
coal transportation are based on the terms of GRU’s existing rail contract and
historical rates of escalation under the contract. A step increase in the delivered coal
price is expected in 2020 resulting from higher transportation costs.
In addition to the commodity price of coal and rail transport expense, GRU’s
delivered price of coal also incorporates the cost of environmental commodities
(pebble lime and urea) required for combustion of coal in compliance with
environmental regulations.
2.5.2 Natural Gas
GRU procures natural gas for power generation and for distribution by its
Local Distribution Company (LDC). In 2017, GRU purchased approximately 11.4
million MMBtu for use by both systems. GRU power plants used 83% of the total
purchased for GRU during 2017, while the LDC used the remaining 17%. Natural
gas was used to produce approximately 64.1% of the energy produced by GRU’s
electric generating units during calendar year 2016.
30
GRU purchases natural gas via arrangements with producers and marketers
connected with the FGT interstate pipeline. GRU’s delivered cost of natural gas
includes the commodity component, FGT’s fuel charge, FGT’s usage
(transportation) charge, FGT's reservation (capacity) charge, and basis adjustments.
Commodity fuel cost projections were based on closing NYMEX natural gas futures
prices for the Henry Hub.
2.5.3 Biomass
On November 7, 2017, GRU purchased a biomass plant from the owners with
whom GRU held a 30-year Purchase Power Agreement (PPA). From November 7th,
biomass was used to generate approximately 7.2% of the total energy produced by
the system in calendar year 2017.
GRU procures woody biomass consisting mainly of forest residue from
logging operations and urban wood waste from within a 100-mile radius of the plant.
The major portion of biomass fuel is secured by contracts of varying lengths with the
remainder purchased on a spot basis to take advantage of opportunity fuel. The
forecast of biomass prices is based on contract prices escalated by forecasts of the
Producer Price Index for diesel and the Consumer Price Index.
31
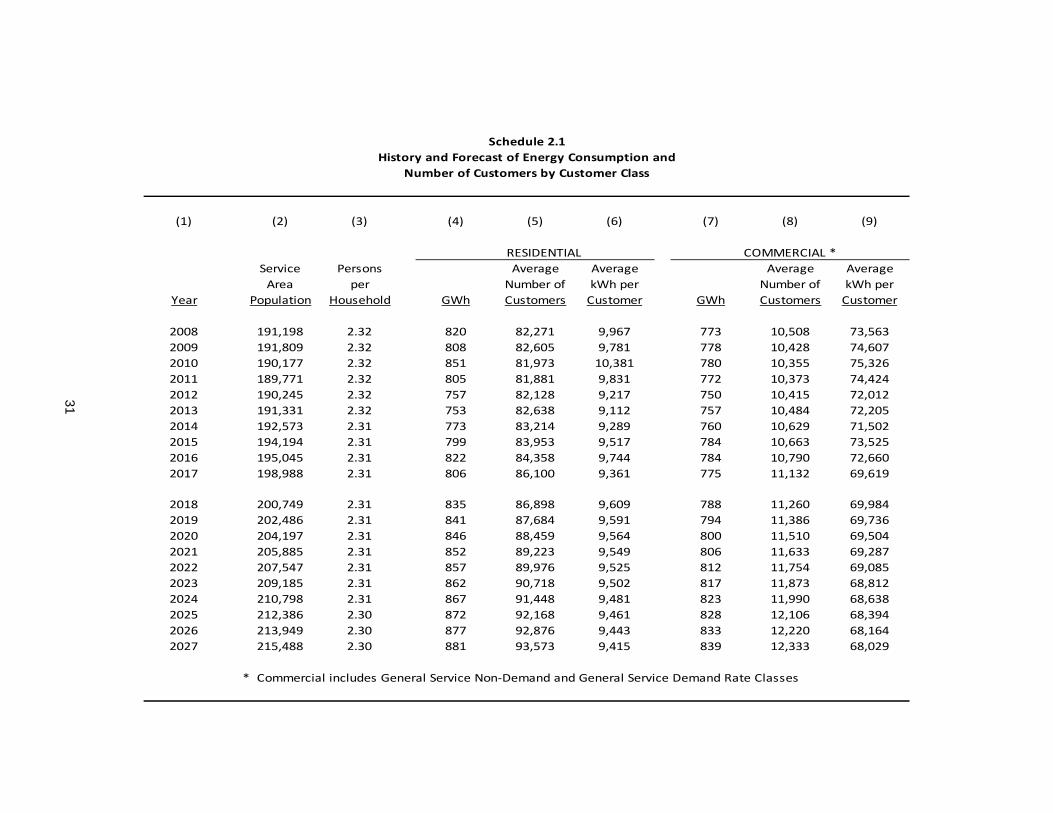
Schedule 2.1History and Forecast of Energy Consumption and
Number of Customers by Customer Class
(1) (2) (3) (4) (5) (6) (7) (8) (9)
RESIDENTIAL COMMERCIAL *Service Persons Average Average Average AverageArea per Number of kWh per Number of kWh per
Year Population Household GWh Customers Customer GWh Customers Customer
2008 191,198 2.32 820 82,271 9,967 773 10,508 73,5632009 191,809 2.32 808 82,605 9,781 778 10,428 74,6072010 190,177 2.32 851 81,973 10,381 780 10,355 75,3262011 189,771 2.32 805 81,881 9,831 772 10,373 74,4242012 190,245 2.32 757 82,128 9,217 750 10,415 72,0122013 191,331 2.32 753 82,638 9,112 757 10,484 72,2052014 192,573 2.31 773 83,214 9,289 760 10,629 71,5022015 194,194 2.31 799 83,953 9,517 784 10,663 73,5252016 195,045 2.31 822 84,358 9,744 784 10,790 72,6602017 198,988 2.31 806 86,100 9,361 775 11,132 69,619
2018 200,749 2.31 835 86,898 9,609 788 11,260 69,9842019 202,486 2.31 841 87,684 9,591 794 11,386 69,7362020 204,197 2.31 846 88,459 9,564 800 11,510 69,5042021 205,885 2.31 852 89,223 9,549 806 11,633 69,2872022 207,547 2.31 857 89,976 9,525 812 11,754 69,0852023 209,185 2.31 862 90,718 9,502 817 11,873 68,8122024 210,798 2.31 867 91,448 9,481 823 11,990 68,6382025 212,386 2.30 872 92,168 9,461 828 12,106 68,3942026 213,949 2.30 877 92,876 9,443 833 12,220 68,1642027 215,488 2.30 881 93,573 9,415 839 12,333 68,029
* Commercial includes General Service Non‐Demand and General Service Demand Rate Classes
32
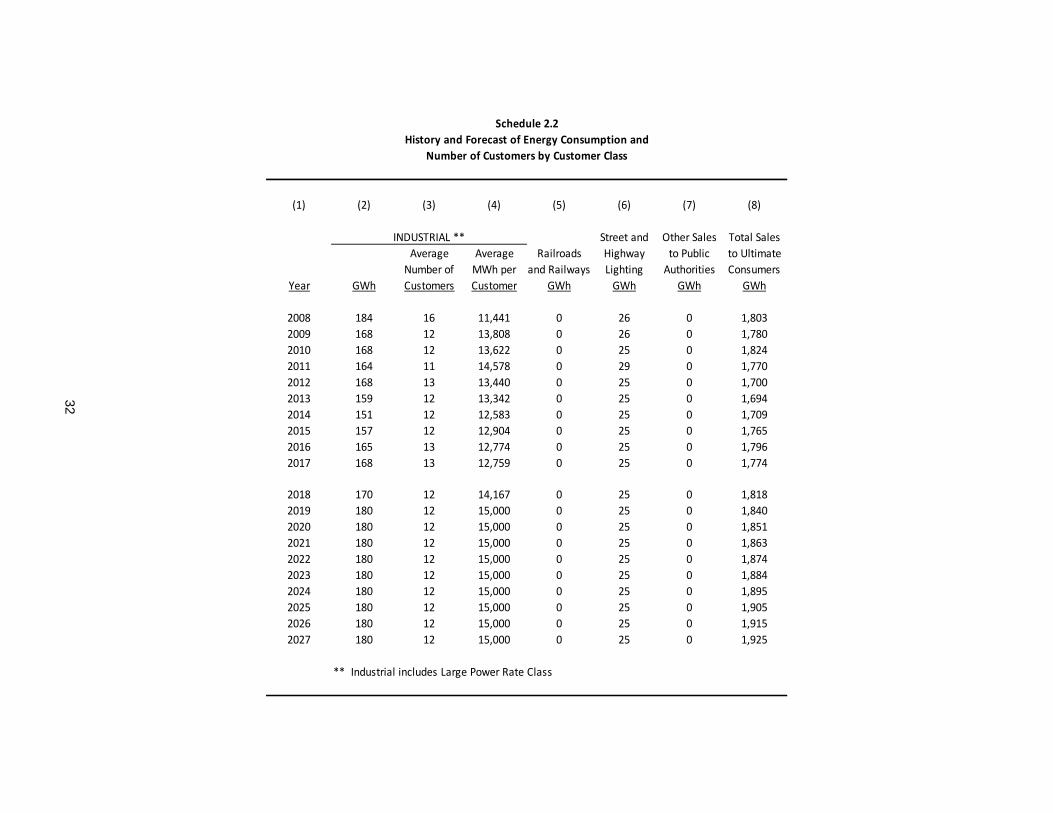
Schedule 2.2History and Forecast of Energy Consumption and
Number of Customers by Customer Class
(1) (2) (3) (4) (5) (6) (7) (8)
INDUSTRIAL ** Street and Other Sales Total SalesAverage Average Railroads Highway to Public to UltimateNumber of MWh per and Railways Lighting Authorities Consumers
Year GWh Customers Customer GWh GWh GWh GWh
2008 184 16 11,441 0 26 0 1,8032009 168 12 13,808 0 26 0 1,7802010 168 12 13,622 0 25 0 1,8242011 164 11 14,578 0 29 0 1,7702012 168 13 13,440 0 25 0 1,7002013 159 12 13,342 0 25 0 1,6942014 151 12 12,583 0 25 0 1,7092015 157 12 12,904 0 25 0 1,7652016 165 13 12,774 0 25 0 1,7962017 168 13 12,759 0 25 0 1,774
2018 170 12 14,167 0 25 0 1,8182019 180 12 15,000 0 25 0 1,8402020 180 12 15,000 0 25 0 1,8512021 180 12 15,000 0 25 0 1,8632022 180 12 15,000 0 25 0 1,8742023 180 12 15,000 0 25 0 1,8842024 180 12 15,000 0 25 0 1,8952025 180 12 15,000 0 25 0 1,9052026 180 12 15,000 0 25 0 1,9152027 180 12 15,000 0 25 0 1,925
** Industrial includes Large Power Rate Class
33
Schedule 2.3History and Forecast of Energy Consumption and
Number of Customers by Customer Class
(1) (2) (3) (4) (5) (6)
Sales Utility NetFor Use and Energy Total
Resale Losses for Load Other Number ofYear GWh GWh GWh Customers Customers
2008 196 80 2,079 0 92,7952009 203 99 2,082 0 93,0452010 217 98 2,139 0 92,3402011 201 45 2,016 0 92,2652012 195 57 1,952 0 92,5562013 113 46 1,853 0 93,1342014 121 45 1,875 0 93,8552015 214 45 2,024 0 94,6282016 221 37 2,054 0 95,1612017 220 37 2,031 0 97,245
2018 226 50 2,094 0 98,1692019 141 52 2,033 0 99,0822020 144 52 2,047 0 99,9812021 148 51 2,062 0 100,8682022 151 51 2,076 0 101,7422023 154 52 2,090 0 102,6032024 156 53 2,104 0 103,4512025 159 54 2,118 0 104,2862026 162 54 2,131 0 105,1082027 165 54 2,144 0 105,918
34
Schedule 3.1History and Forecast of Summer Peak Demand ‐ MW
(1) (2) (3) (4) (5) (6) (7) (8) (9) (10)
Residential Comm./Ind.Load Residential Load Comm./Ind. Net Firm
Year Total Wholesale Retail Interruptible Management ConservationManagement Conservation Demand
2008 487 43 414 0 0 19 0 11 4572009 498 46 419 0 0 21 0 12 4652010 505 48 422 0 0 22 0 13 4702011 484 46 399 0 0 24 0 15 4452012 456 43 372 0 0 26 0 15 4152013 459 25 391 0 0 27 0 16 4162014 452 26 383 0 0 27 0 16 4092015 454 37 374 0 0 27 0 16 4112016 471 38 390 0 0 27 0 16 4282017 461 38 380 0 0 27 0 16 418
2018 484 40 400 0 0 28 0 16 4402019 479 31 404 0 0 28 0 16 4352020 482 31 407 0 0 28 0 16 4382021 486 32 410 0 0 28 0 16 4422022 489 33 412 0 0 28 0 16 4452023 492 33 415 0 0 28 0 16 4482024 495 34 417 0 0 28 0 16 4512025 498 35 419 0 0 28 0 16 4542026 500 35 421 0 0 28 0 16 4562027 503 36 423 0 0 28 0 16 459
35
Schedule 3.2History and Forecast of Winter Peak Demand ‐ MW
(1) (2) (3) (4) (5) (6) (7) (8) (9) (10)
Residential Comm./Ind.Load Residential Load Comm./Ind. Net Firm
Winter Total Wholesale Retail Interruptible Management ConservationManagement Conservation Demand
2008 / 2009 478 50 371 0 0 46 0 11 4212009 / 2010 522 55 409 0 0 47 0 11 4642010 / 2011 470 51 358 0 0 49 0 12 4092011 / 2012 434 47 324 0 0 50 0 13 3712012 / 2013 412 22 326 0 0 51 0 13 3482013 / 2014 412 23 325 0 0 51 0 13 3482014 / 2015 414 36 314 0 0 51 0 13 3502015 / 2016 402 35 303 0 0 51 0 13 3382016 / 2017 397 33 300 0 0 51 0 13 3332017 / 2018 475 38 372 0 0 52 0 13 410
2018 / 2019 422 29 328 0 0 52 0 13 3572019 / 2020 424 30 329 0 0 52 0 13 3592020 / 2021 427 30 332 0 0 52 0 13 3622021 / 2022 429 31 333 0 0 52 0 13 3642022 / 2023 431 32 334 0 0 52 0 13 3662023 / 2024 434 32 337 0 0 52 0 13 3692024 / 2025 437 33 338 0 0 53 0 13 3712025 / 2026 439 33 340 0 0 53 0 13 3732026 / 2027 442 34 342 0 0 53 0 13 3762027 / 2028 444 34 344 0 0 53 0 13 378

36
Schedule 3.3History and Forecast of Net Energy for Load ‐ GWH
(1) (2) (3) (4) (5) (6) (7) (8) (9)
Residential Comm./Ind. Utility Use Net Energy LoadYear Total Conservation Conservation Retail Wholesale & Losses for Load Factor %
2008 2,230 110 41 1,804 196 79 2,079 52%2009 2,248 117 49 1,781 203 98 2,082 51%2010 2,319 124 56 1,825 217 97 2,139 52%2011 2,212 133 63 1,770 201 45 2,016 52%2012 2,162 142 68 1,700 195 57 1,952 54%2013 2,068 145 70 1,695 113 45 1,853 51%2014 2,091 146 70 1,709 121 45 1,875 52%2015 2,241 147 70 1,765 214 45 2,024 56%2016 2,271 147 70 1,796 221 37 2,054 56%2017 2,249 148 70 1,773 220 38 2,031 57%
2018 2,312 148 70 1,818 226 50 2,094 56%2019 2,252 149 70 1,841 141 51 2,033 53%2020 2,266 149 70 1,852 144 51 2,047 53%2021 2,282 150 70 1,863 148 51 2,062 53%2022 2,296 150 70 1,873 151 52 2,076 53%2023 2,311 151 70 1,884 154 52 2,090 53%2024 2,325 151 70 1,895 156 53 2,104 53%2025 2,339 151 70 1,906 159 53 2,118 53%2026 2,353 152 70 1,916 162 53 2,131 53%2027 2,366 152 70 1,925 165 54 2,144 53%
37
Schedule 4Previous Year and 2‐Year Forecast of Peak Demand and Net Energy for Load
(1) (2) (3) (4) (5) (6) (7)
ACTUAL FORECAST2017 2018 2019
Peak Peak PeakDemand NEL Demand NEL Demand NEL
Month (MW) (GWh) (MW) (GWh) (MW) (GWh)JAN 333 150 362 162 357 157FEB 268 130 337 142 331 137MAR 304 147 306 150 300 144APR 374 158 332 154 326 149MAY 385 182 393 184 388 179JUN 391 184 428 197 424 193JUL 409 207 434 214 429 209AUG 418 212 440 217 435 212SEP 394 190 410 198 405 193OCT 391 177 363 171 358 166NOV 271 141 298 147 292 142DEC 323 153 315 158 309 152
38
Schedule 5FUEL REQUIREMENTSAs of January 1, 2018
(1) (2) (3) (4) (5) (6) (7) (8) (9) (10) (11) (12) (13) (14) (15)ACTUAL
UNITS 2017 2018 2019 2020 2021 2022 2023 2024 2025 2026 2027
(1) NUCLEAR TRILLION BTU 0 0 0 0 0 0 0 0 0 0 0
(2) COAL 1000 TON 204 280 332 379 308 360 391 361 354 406 384
RESIDUAL(3) STEAM 1000 BBL 1 0 0 0 0 0 0 0 0 0 0(4) CC 1000 BBL 0 0 0 0 0 0 0 0 0 0 0(5) CT 1000 BBL 0 0 0 0 0 0 0 0 0 0 0(6) TOTAL: 1000 BBL 1 0 0 0 0 0 0 0 0 0 0
DISTILLATE(7) STEAM 1000 BBL 2 0 0 0 0 0 0 0 0 0 0(8) CC 1000 BBL 0 0 0 0 0 0 0 0 0 0 0(9) CT 1000 BBL 2 0 0 0 0 0 0 0 0 0 0(10) TOTAL: 1000 BBL 4 0 0 0 0 0 0 0 0 0 0
NATURAL GAS(11) STEAM 1000 MCF 2781 803 343 68 185 41 0 0 0 0 0(12) CC 1000 MCF 4578 5837 6345 5505 7148 6739 6611 7420 6816 7456 7492(13) CT 1000 MCF 427 386 386 375 385 462 376 401 483 376 423(14) TOTAL: 1000 MCF 7786 7026 7074 5948 7718 7242 6987 7821 7299 7832 7915
(15) OTHER (specify) 1000 Tons Biomass 364 755 484 550 458 409 410 401 541 362 431
FUEL REQUIREMENTS
39
Schedule 6.1ENERGY SOURCES (GWH)As of January 1, 2018
(1) (2) (3) (4) (5) (6) (7) (8) (9) (10) (11) (12) (13) (14) (15)ACTUAL
ENERGY SOURCES UNITS 2017 2018 2019 2020 2021 2022 2023 2024 2025 2026 2027
(1) ANNUAL FIRM INTERCHANGE GWh 0 0 0 0 0 0 0 0 0 0 0(INTER‐REGION)
(2) NUCLEAR Replacement Power GWh 0 0 0 0 0 0 0 0 0 0 0
(3) COAL GWh 501 522 607 664 541 652 694 647 632 729 696
RESIDUAL(4) STEAM GWh 1 0 0 0 0 0 0 0 0 0 0(5) CC GWh 0 0 0 0 0 0 0 0 0 0 0(6) CT GWh 0 0 0 0 0 0 0 0 0 0 0(7) TOTAL: GWh 1 0 0 0 0 0 0 0 0 0 0
DISTILLATE(8) STEAM GWh 0 0 0 0 0 0 0 0 0 0 0(9) CC GWh 0 0 0 0 0 0 0 0 0 0 0(10) CT GWh 1 0 0 0 0 0 0 0 0 0 0(11) TOTAL: GWh 1 0 0 0 0 0 0 0 0 0 0
NATURAL GAS(12) STEAM GWh 216 61 25 5 14 3 0 0 0 0 0(13) CC GWh 546 727 793 688 894 844 828 931 855 936 942(14) CT GWh 38 36 35 35 36 40 35 37 42 35 38(15) TOTAL: GWh 800 824 853 728 944 887 863 968 897 971 980
(16) NUG GWh 0 0 0 0 0 0 0 0 0 0 0
(17) BIOFUELS GWh 0 0 0 0 0 0 0 0 0 0 0(18) BIOMASS GWh 356 501 344 414 321 290 303 288 396 265 315(19) GEOTHERMAL GWh 0 0 0 0 0 0 0 0 0 0 0(20) HYDRO GWh 0 0 0 0 0 0 0 0 0 0 0(21) LANDFILL GAS PPA GWh 17 34 35 35 35 35 35 0 0 0 0(22) MSW GWh 0 0 0 0 0 0 0 0 0 0 0(23) SOLAR GWh 0 0 0 0 0 0 0 0 0 0 0(24) WIND GWh 0 0 0 0 0 0 0 0 0 0 0(25) OTHER RENEWABLE GWh 0 0 0 0 0 0 0 0 0 0 0(26) Total Renewable GWh 373 535 379 449 356 325 338 288 396 265 315
(27) Purchased Energy and NG‐fired ICE GWh 355 213 194 206 221 212 195 201 193 166 153
(28) NET ENERGY FOR LOAD GWh 2031 2094 2033 2047 2062 2076 2090 2104 2118 2131 2144
40
Schedule 6.2ENERGY SOURCES (%)As of January 1, 2018
(1) (2) (3) (4) (5) (6) (7) (8) (9) (10) (11) (12) (13) (14) (15)ACTUAL
ENERGY SOURCES UNITS 2017 2018 2019 2020 2021 2022 2023 2024 2025 2026 2027
(1) ANNUAL FIRM INTERCHANGE GWh 0.0% 0.0% 0.0% 0.0% 0.0% 0.0% 0.0% 0.0% 0.0% 0.0% 0.0%(INTER‐REGION)
(2) NUCLEAR Replacement Power GWh 0.0% 0.0% 0.0% 0.0% 0.0% 0.0% 0.0% 0.0% 0.0% 0.0% 0.0%
(3) COAL GWh 24.7% 24.9% 29.9% 32.4% 26.2% 31.4% 33.2% 30.8% 29.8% 34.2% 32.5%
RESIDUAL(4) STEAM GWh 0.0% 0.0% 0.0% 0.0% 0.0% 0.0% 0.0% 0.0% 0.0% 0.0% 0.0%(5) CC GWh 0.0% 0.0% 0.0% 0.0% 0.0% 0.0% 0.0% 0.0% 0.0% 0.0% 0.0%(6) CT GWh 0.0% 0.0% 0.0% 0.0% 0.0% 0.0% 0.0% 0.0% 0.0% 0.0% 0.0%(7) TOTAL: GWh 0.0% 0.0% 0.0% 0.0% 0.0% 0.0% 0.0% 0.0% 0.0% 0.0% 0.0%
DISTILLATE(8) STEAM GWh 0.0% 0.0% 0.0% 0.0% 0.0% 0.0% 0.0% 0.0% 0.0% 0.0% 0.0%(9) CC GWh 0.0% 0.0% 0.0% 0.0% 0.0% 0.0% 0.0% 0.0% 0.0% 0.0% 0.0%(10) CT GWh 0.0% 0.0% 0.0% 0.0% 0.0% 0.0% 0.0% 0.0% 0.0% 0.0% 0.0%(11) TOTAL: GWh 0.0% 0.0% 0.0% 0.0% 0.0% 0.0% 0.0% 0.0% 0.0% 0.0% 0.0%
NATURAL GAS(12) STEAM GWh 10.6% 2.9% 1.2% 0.2% 0.7% 0.1% 0.0% 0.0% 0.0% 0.0% 0.0%(13) CC GWh 26.9% 34.7% 39.0% 33.6% 43.4% 40.7% 39.6% 44.2% 40.4% 43.9% 43.9%(14) CT GWh 1.9% 1.7% 1.7% 1.7% 1.7% 1.9% 1.7% 1.8% 2.0% 1.6% 1.8%(15) TOTAL: GWh 39.4% 39.4% 42.0% 35.6% 45.8% 42.7% 41.3% 46.0% 42.4% 45.6% 45.7%
(16) NUG GWh 0.0% 0.0% 0.0% 0.0% 0.0% 0.0% 0.0% 0.0% 0.0% 0.0% 0.0%
(17) BIOFUELS GWh 0.0% 0.0% 0.0% 0.0% 0.0% 0.0% 0.0% 0.0% 0.0% 0.0% 0.0%(18) BIOMASS GWh 17.5% 23.9% 16.9% 20.2% 15.6% 14.0% 14.5% 13.7% 18.7% 12.4% 14.7%(19) GEOTHERMAL GWh 0.0% 0.0% 0.0% 0.0% 0.0% 0.0% 0.0% 0.0% 0.0% 0.0% 0.0%(20) HYDRO GWh 0.0% 0.0% 0.0% 0.0% 0.0% 0.0% 0.0% 0.0% 0.0% 0.0% 0.0%(21) LANDFILL GAS PPA GWh 0.8% 1.6% 1.7% 1.7% 1.7% 1.7% 1.7% 0.0% 0.0% 0.0% 0.0%(22) MSW GWh 0.0% 0.0% 0.0% 0.0% 0.0% 0.0% 0.0% 0.0% 0.0% 0.0% 0.0%(23) SOLAR GWh 0.0% 0.0% 0.0% 0.0% 0.0% 0.0% 0.0% 0.0% 0.0% 0.0% 0.0%(24) WIND GWh 0.0% 0.0% 0.0% 0.0% 0.0% 0.0% 0.0% 0.0% 0.0% 0.0% 0.0%(25) OTHER RENEWABLE GWh 0.0% 0.0% 0.0% 0.0% 0.0% 0.0% 0.0% 0.0% 0.0% 0.0% 0.0%(26) Total Renewable GWh 18.4% 25.5% 18.6% 21.9% 17.3% 15.7% 16.2% 13.7% 18.7% 12.4% 14.7%
(27) Purchased Energy GWh 17.5% 10.2% 9.5% 10.1% 10.7% 10.2% 9.3% 9.6% 9.1% 7.8% 7.1%
(28) NET ENERGY FOR LOAD GWh 100.0% 100.0% 100.0% 100.0% 100.0% 100.0% 100.0% 100.0% 100.0% 100.0% 100.0%

41
3. FORECAST OF FACILITIES REQUIREMENTS
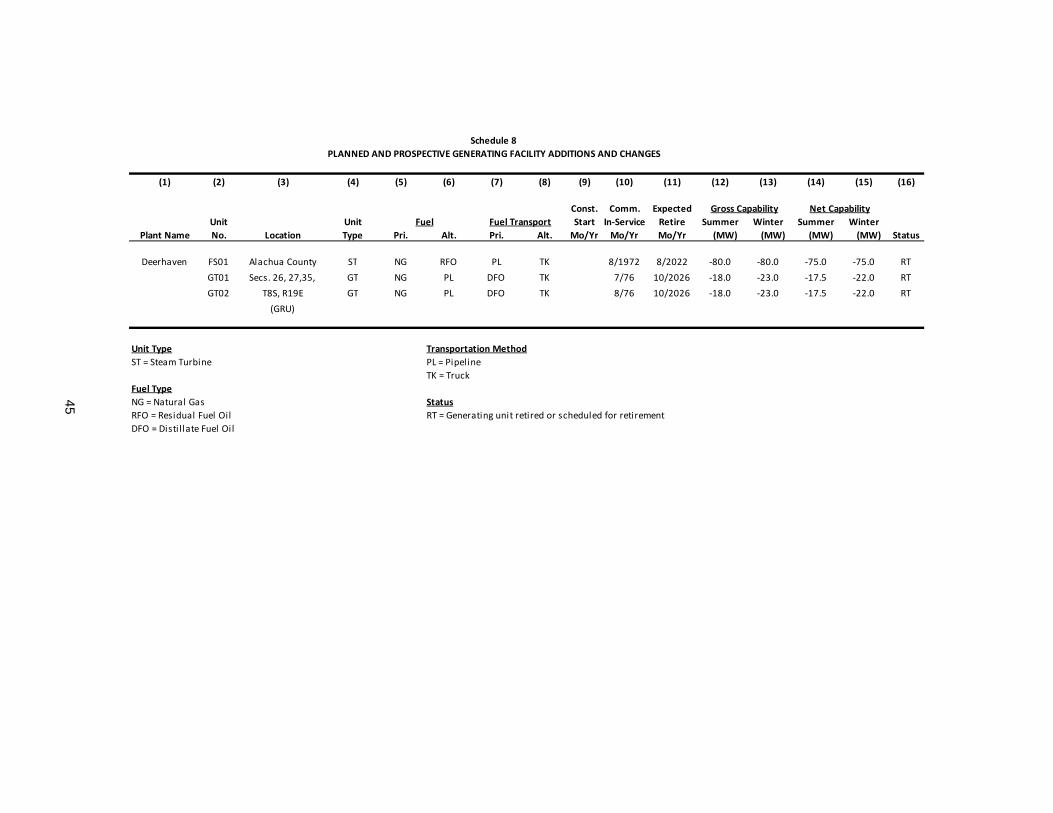
3.1 GENERATION RETIREMENTS
Deerhaven fossil steam unit #1 and combustion turbines #1 and #2 are
scheduled for retirement in 2022 and 2026, respectively. These planned changes to
the System’s generation mix are tabulated in Schedule 8.
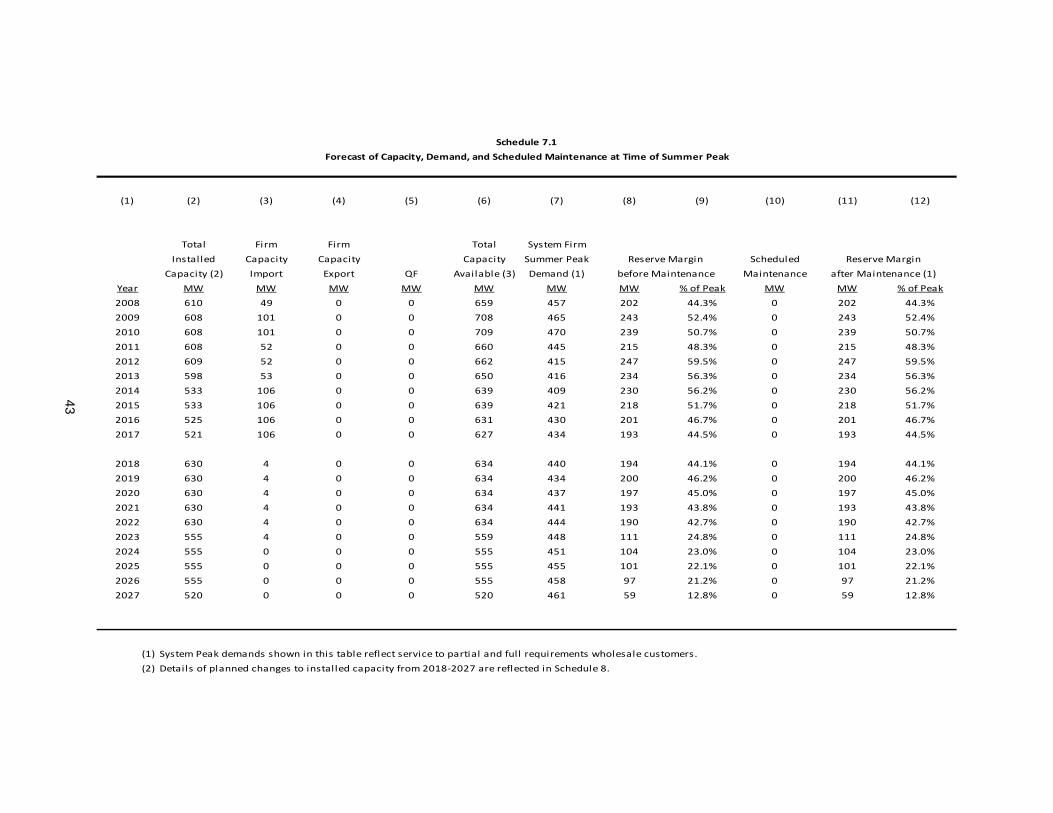
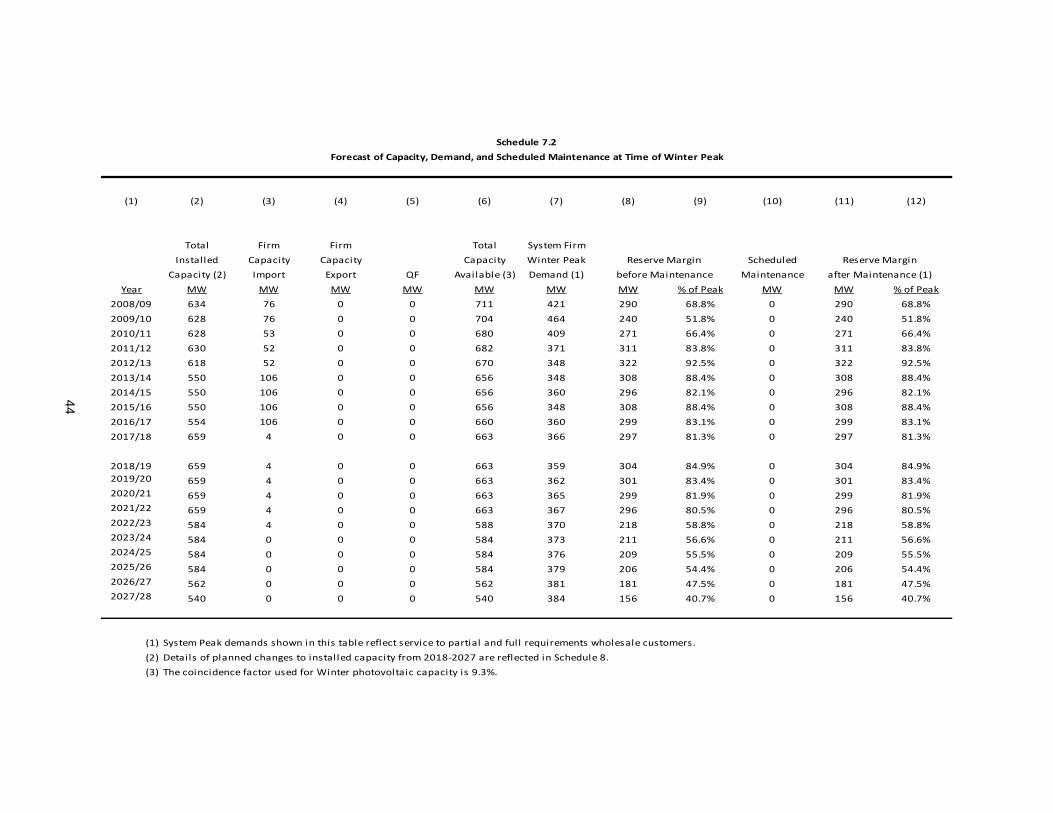
3.2 RESERVE MARGIN AND SCHEDULED MAINTENANCE
GRU uses a planning criterion of 15% capacity reserve margin (suggested for
emergency power pricing purposes by Florida Public Service Commission Rule 25-
6.035). Available generating capacities are compared with System summer peak
demands in Schedule 7.1 and System winter peak demands in Schedule 7.2. Higher
peak demands in summer and lower unit operating capacities in summer result in
lower reserve margins during the summer season than in winter. In consideration of
existing resources, expected future purchases, and savings impacts from
conservation programs, GRU expects to maintain a summer reserve margin in
excess of 15% over the next 10 years. Although GRU’s current generation capacity
and scheduled unit retirements will only provide a 15% reserve margin through
2026, GRU is evaluating additional generation and energy sources that will be in
place by 2026 to bring GRU’s reserve margin above 15% for 2027.
3.3 GENERATION ADDITIONS
GRU has been issued a construction permit for the installation of a nominal
50 MW of peaking power in 2018, if required. The need, timing and technology of
this peaking power addition are under evaluation.
3.4 DISTRIBUTION SYSTEM ADDITIONS
Up to five new, compact power delivery systems (PDS) were planned for the
GRU system in 1999. Three of the four - Rocky Point, Kanapaha, and Ironwood -

42
were installed by 2003. A fourth PDS, Springhill, was brought on-line in January
2011; a third circuit from Springhill is anticipated as forecasted load develops in
2020. In addition, a second transformer is scheduled to be installed here in 2023.
The fifth PDS, known at this time as the Northwest Sub, is planned for addition to
the System in 2024. This PDS will be located in the 2000 block of NW 53rd Avenue.
These new compact-power delivery systems have been planned to redistribute the
load from the existing substations as new load centers grow and develop within the
System.
The Rocky Point, Kanapaha, and Ironwood PDS utilize single 33 MVA class
transformers that are radial-tapped to the System’s looped 138 kV system. These
three radial- tapped substation all have remote controlled motor operated tie
reclosers to remotely switch distribution load in a matter of minutes. The Springhill
Substation consists of one 33 MVA class transformer served by a loop fed pole-
mounted switch. Each PDS consists of one (or more) 138/12.47 kV, 33 MVA class,
wye-wye substation transformer with a maximum of eight distribution circuits. The
proximity of these new PDS’s to existing area substations will allow for backup in the
event of a substation transformer failure.
43
Schedule 7.1Forecast of Capacity, Demand, and Scheduled Maintenance at Time of Summer Peak
(1) (2) (3) (4) (5) (6) (7) (8) (9) (10) (11) (12)
Total Firm Firm Total System FirmInstalled Capacity Capacity Capacity Summer Peak Reserve Margin Scheduled Reserve Margin
Capacity (2) Import Export QF Available (3) Demand (1) before Maintenance Maintenance after Maintenance (1)Year MW MW MW MW MW MW MW % of Peak MW MW % of Peak2008 610 49 0 0 659 457 202 44.3% 0 202 44.3%2009 608 101 0 0 708 465 243 52.4% 0 243 52.4%2010 608 101 0 0 709 470 239 50.7% 0 239 50.7%2011 608 52 0 0 660 445 215 48.3% 0 215 48.3%2012 609 52 0 0 662 415 247 59.5% 0 247 59.5%2013 598 53 0 0 650 416 234 56.3% 0 234 56.3%2014 533 106 0 0 639 409 230 56.2% 0 230 56.2%2015 533 106 0 0 639 421 218 51.7% 0 218 51.7%2016 525 106 0 0 631 430 201 46.7% 0 201 46.7%2017 521 106 0 0 627 434 193 44.5% 0 193 44.5%
2018 630 4 0 0 634 440 194 44.1% 0 194 44.1%2019 630 4 0 0 634 434 200 46.2% 0 200 46.2%2020 630 4 0 0 634 437 197 45.0% 0 197 45.0%2021 630 4 0 0 634 441 193 43.8% 0 193 43.8%2022 630 4 0 0 634 444 190 42.7% 0 190 42.7%2023 555 4 0 0 559 448 111 24.8% 0 111 24.8%2024 555 0 0 0 555 451 104 23.0% 0 104 23.0%2025 555 0 0 0 555 455 101 22.1% 0 101 22.1%2026 555 0 0 0 555 458 97 21.2% 0 97 21.2%2027 520 0 0 0 520 461 59 12.8% 0 59 12.8%
(1) System Peak demands shown in this table reflect service to partial and full requirements wholesale customers.(2) Details of planned changes to installed capacity from 2018‐2027 are reflected in Schedule 8.
44
Schedule 7.2Forecast of Capacity, Demand, and Scheduled Maintenance at Time of Winter Peak
(1) (2) (3) (4) (5) (6) (7) (8) (9) (10) (11) (12)
Total Firm Firm Total System FirmInstalled Capacity Capacity Capacity Winter Peak Reserve Margin Scheduled Reserve Margin
Capacity (2) Import Export QF Available (3) Demand (1) before Maintenance Maintenance after Maintenance (1)Year MW MW MW MW MW MW MW % of Peak MW MW % of Peak
2008/09 634 76 0 0 711 421 290 68.8% 0 290 68.8%2009/10 628 76 0 0 704 464 240 51.8% 0 240 51.8%2010/11 628 53 0 0 680 409 271 66.4% 0 271 66.4%2011/12 630 52 0 0 682 371 311 83.8% 0 311 83.8%2012/13 618 52 0 0 670 348 322 92.5% 0 322 92.5%2013/14 550 106 0 0 656 348 308 88.4% 0 308 88.4%2014/15 550 106 0 0 656 360 296 82.1% 0 296 82.1%2015/16 550 106 0 0 656 348 308 88.4% 0 308 88.4%2016/17 554 106 0 0 660 360 299 83.1% 0 299 83.1%2017/18 659 4 0 0 663 366 297 81.3% 0 297 81.3%
2018/19 659 4 0 0 663 359 304 84.9% 0 304 84.9%2019/20 659 4 0 0 663 362 301 83.4% 0 301 83.4%2020/21 659 4 0 0 663 365 299 81.9% 0 299 81.9%2021/22 659 4 0 0 663 367 296 80.5% 0 296 80.5%2022/23 584 4 0 0 588 370 218 58.8% 0 218 58.8%2023/24 584 0 0 0 584 373 211 56.6% 0 211 56.6%2024/25 584 0 0 0 584 376 209 55.5% 0 209 55.5%2025/26 584 0 0 0 584 379 206 54.4% 0 206 54.4%2026/27 562 0 0 0 562 381 181 47.5% 0 181 47.5%2027/28 540 0 0 0 540 384 156 40.7% 0 156 40.7%
(1) System Peak demands shown in this table reflect service to partial and full requirements wholesale customers.(2) Details of planned changes to installed capacity from 2018‐2027 are reflected in Schedule 8.(3) The coincidence factor used for Winter photovoltaic capacity is 9.3%.
45
Schedule 8PLANNED AND PROSPECTIVE GENERATING FACILITY ADDITIONS AND CHANGES
(1) (2) (3) (4) (5) (6) (7) (8) (9) (10) (11) (12) (13) (14) (15) (16)
Const. Comm. Expected Gross Capability Net CapabilityUnit Unit Fuel Fuel Transport Start In‐Service Retire Summer Winter Summer Winter
Plant Name No. Location Type Pri. Alt. Pri. Alt. Mo/Yr Mo/Yr Mo/Yr (MW) (MW) (MW) (MW) Status
Deerhaven FS01 Alachua County ST NG RFO PL TK 8/1972 8/2022 ‐80.0 ‐80.0 ‐75.0 ‐75.0 RTGT01 Secs. 26, 27,35, GT NG PL DFO TK 7/76 10/2026 ‐18.0 ‐23.0 ‐17.5 ‐22.0 RTGT02 T8S, R19E GT NG PL DFO TK 8/76 10/2026 ‐18.0 ‐23.0 ‐17.5 ‐22.0 RT
(GRU)
Unit Type Transportation MethodST = Steam Turbine PL = Pipeline
TK = TruckFuel TypeNG = Natural Gas StatusRFO = Residual Fuel Oil RT = Generating unit retired or scheduled for retirementDFO = Disti l late Fuel Oil

46
4. ENVIRONMENTAL AND LAND USE INFORMATION
4.1 DESCRIPTION OF POTENTIAL SITES FOR NEW GENERATING FACILITIES
Currently, there are no new potential generation sites planned. GRU has been
issued a construction permit for up to approximately 50 MW of generation at the
existing Deerhaven generation site, but GRU has not yet evaluated what type of
generation, if any, will be added to the Deerhaven generating facility.
4.2 DESCRIPTION OF PREFERRED SITES FOR NEW GENERATING FACILITIES
Any additional system generation is expected to be sited at the existing
Deerhaven site. Evaluation of the need for future generation is in progress.
4.2.1 Land Use and Environmental Features
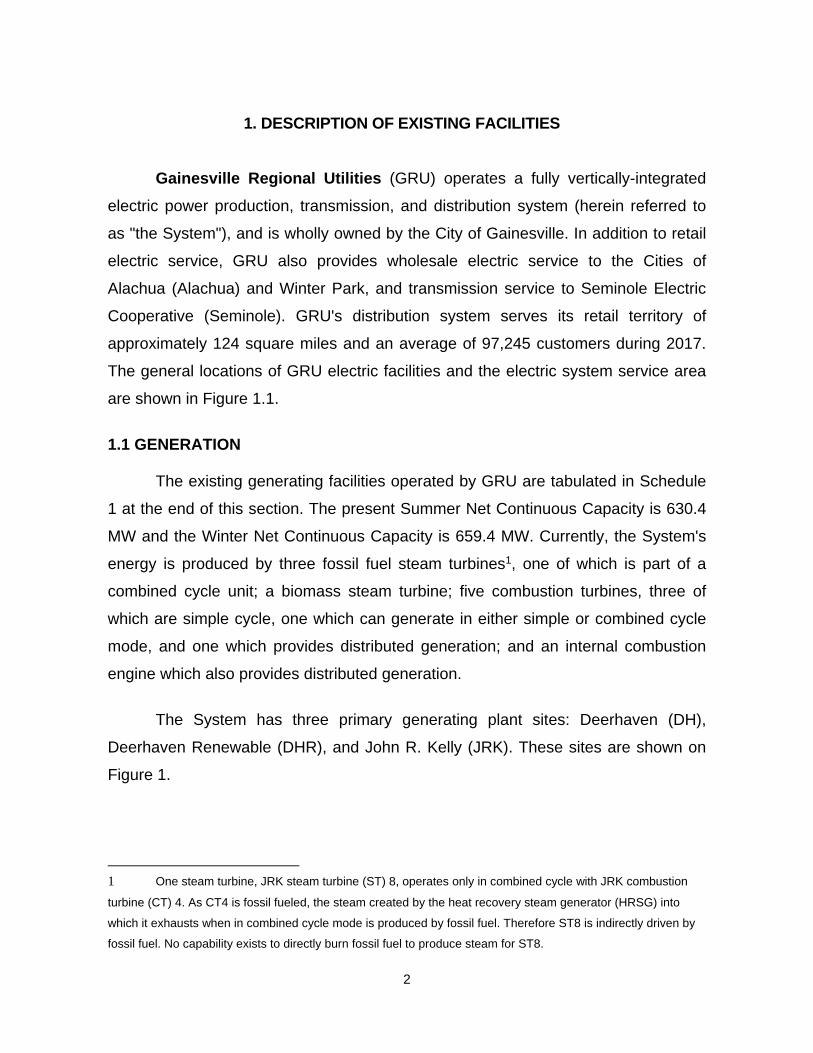
The location of the site is indicated on Figures 1.1 (see Section 1) and 4.1.
The existing land use of the certified portion of the Deerhaven site is industrial (i.e.,
electric power generation and transmission and ancillary uses such as fuel storage
and conveyance, water withdrawal, combustion product handling and disposal, and
forest management). The areas acquired since 2002 have been annexed into the
City of Gainesville. The site is a PS, Public Services and Operations District, zoned
property. Surrounding land uses are primarily rural or agricultural with some low-
density residential development. The Deerhaven site encompasses approximately
3,474 acres.
The Deerhaven Generating Station plant site is located in the Suwannee River
Water Management District. Water for potable use is supplied via the City’s potable
water system. Groundwater is extracted from the Floridian aquifer. Process
wastewater is currently collected, treated and reused on-site. The site has zero

47
discharge of process wastewater to surface and ground waters. GRU uses a brine
concentrator/spray dryer and off-site disposal of solid wastewater treatment by-
products.
4.2.2 Air Emissions
Any generation technology installed at the Deerhaven site will meet all
applicable standards for all pollutants regulated for the category of emissions unit.

48
Figure 4.1
Deerhaven Generating Site