Gain-of-Function NH787 Ethylmethanesulfonate Mutant of ...
38
Gain-of-Function NH787 Ethylmethanesulfonate Mutant of Nagina22 Rice Variety Confers Augmented PUE Poli Yugandhar Icar- Indian Institute of Rice research Nallamothu Veronica Icar- Indian Institute of Rice research Hao Ai Nanjing Agricultural University Muddapuram Deeksha Goud Amity University Xiaowen Wang Nanjing Agricultural University Desiraju Subrahmanyam Icar- Indian Institute of Rice research Mangrauthia Satendra Icar- Indian Institute of Rice research Jain Ajay ( [email protected] ) Amity University Research Article Keywords: NH787, Nagina22, EMS, CRISPR Posted Date: February 25th, 2021 DOI: https://doi.org/10.21203/rs.3.rs-235542/v1 License: This work is licensed under a Creative Commons Attribution 4.0 International License. Read Full License Version of Record: A version of this preprint was published at Scientiヲc Reports on April 28th, 2021. See the published version at https://doi.org/10.1038/s41598-021-88419-w.
Transcript of Gain-of-Function NH787 Ethylmethanesulfonate Mutant of ...
Gain-of-Function NH787 EthylmethanesulfonateMutant of Nagina22 Rice Variety ConfersAugmented PUEPoli Yugandhar
Icar- Indian Institute of Rice researchNallamothu Veronica
Icar- Indian Institute of Rice researchHao Ai
Nanjing Agricultural UniversityMuddapuram Deeksha Goud
Amity UniversityXiaowen Wang
Nanjing Agricultural UniversityDesiraju Subrahmanyam
Icar- Indian Institute of Rice researchMangrauthia Satendra
Icar- Indian Institute of Rice researchJain Ajay ( [email protected] )
Amity University
Research Article
Keywords: NH787, Nagina22, EMS, CRISPR
Posted Date: February 25th, 2021
DOI: https://doi.org/10.21203/rs.3.rs-235542/v1
License: This work is licensed under a Creative Commons Attribution 4.0 International License. Read Full License
Version of Record: A version of this preprint was published at Scienti�c Reports on April 28th, 2021. Seethe published version at https://doi.org/10.1038/s41598-021-88419-w.

1
Gain-of-function NH787 ethylmethanesulfonate mutant of Nagina22 rice variety confers 1
augmented PUE 2
3
Poli Yugandhar1, Nallamothu Veronica
1, Hao Ai
2, Muddapuram Deeksha Goud
3, Xiaowen 4
Wang2, Desiraju Subrahmanyam
1, Mangrauthia Satendra K
1,** & Jain Ajay
3,* 5
6 1 ICAR-Indian Institute of Rice Research, Hyderabad, 500030, India.
2State Key Laboratory 7
of Crop Genetics and Germplasm Enhancement, Key Laboratory of Plant Nutrition and 8
Fertilization in Low-Middle Reaches of the Yangtze River, Ministry of Agriculture, Nanjing 9
Agricultural University, 210095, Nanjing, China. 3Amity Institute of Biotechnology, Amity 10
University Rajasthan, Jaipur, India.Correspondence and requests for materials should be 11
addressed to A.J. (email: [email protected]) 12
⁎ Corresponding author, ** Co-corresponding author 13
14
Rice (Oryza sativa L.), a major dietary source, is often cultivated in soils poor in 15
available inorganic orthophosphate (Pi), which is a pivotal nutrient for growth and 16
development. Poor soils are amended by phosphorus (P) fertilizer, which is derived 17
from the non-renewable rock phosphate reserves. Therefore, there is a need for 18
developing rice varieties with high productivity under low P conditions. At the ICAR-19
IIRR, ethyl methanesulfonate (EMS) mutagenized rice genotype Nagina22 (N22) were 20
screened for high grain yield in Pi-deprived soil, which led to the identification of ~10 21
gain-of-function mutants including NH787. Here, detailed comparative 22
morphophysiological, biochemical, and molecular analyses of N22 and NH787 were 23
carried out in hydroponics and potting soil under different Pi regimes. Under Pi-24
deprived conditions, compared with N22, NH787 exhibited higher root and vegetative 25
biomass, the number of tillers, and grain yield. The augmented agronomic traits of 26
NH787 were corroborated with significantly higher photosynthetic rate, pollen fertility, 27
stigma receptivity, and the activities of antioxidant enzymes superoxide dismutase 28
(SOD) and catalase (CAT). Further, several genes involved in the maintenance of Pi 29
homeostasis (GPH) were differentially regulated. The study thus revealed a wide-30
spectrum influence of the mutation in NH787 that contributed towards its higher Pi use 31
efficiency. 32
33
Rice (Oryza sativa) is the staple food and a major source of dietary energy supply for more 34
than half of the world’s 7.8 billion population (www.worldometers.info/world-population). 35
Rice is consumed ∼90% in Asia (www.irri.org/rice-today). China is the world's 36
biggest rice producer among the top 20 rice-producing countries in the world of which 70% 37
are from Asia (Fig. 1A; Table 1). India is the second-largest producer and consumer of rice 38
with ~44 million hectares under cultivation and West Bengal, Punjab, and Uttar Pradesh are 39
the top three states in rice production1 (Fig. 1B; www.agriexchange.apeda.gov.in). The world 40
population is projected to reach 9.7 billion by 2050 (www. populationpyramid.net/2050) and 41
the per cent increase in population in some of the rice-producing Asian countries ranges from 42
1.8% (Nepal), 15.81% (India) to 34.65% (Pakistan) (Table 1). Therefore, scaling up rice 43
production to achieve sustainable food security for the burgeoning population is warranted. 44
Phosphorus (P), one of the essential macroelements, is a building block of various organic 45
molecules such as ATP, nucleic acids, and phospholipids, and also plays a key role in energy 46
transfer, signal transduction, metabolic pathways, and thus indispensable for the proper 47
growth and development of plants2-6
. In the rhizosphere, P is largely available in the form of 48
inorganic orthophosphate (Pi) and its acquisition by the roots and subsequent translocation to 49

2
various parts of the plants is mediated by a suite of Pi transporters7-9
. However, rice is often 50
cultivated in a rain-fed system on soils subjected to various abiotic stresses including poor 51
availability and/or fixing of P, which adversely affects yield potential10, 11
. Rice in India is 52
normally produced in soils poor in Pi availability and largely amended by application of P 53
fertilizer12, 13
(Fig. 1C). P fertilizer is produced from the non-renewable and finite rock 54
phosphate (phosphorite) reserves likely to be exhausted in the next 50-100 years at the 55
current rate of its usage across the globe14
. Therefore, there is an urgent need to identify or 56
develop rice varieties with higher Pi use efficiency (PUE) under low P conditions15, 16
. 57
Sequencing of the whole rice genome, its relatively small genome, and an efficient 58
transformation system has made it a favored model monocotyledonous plant 17-19
. The 59
arduous task of the post-genomic era has been to systematically evaluate the function of an 60
array of diverse genes involved in the maintenance of Pi homeostasis (GPH) in rice. Loss-of-61
function mutagenesis (T-DNA and Tos17)-mediated reverse genetics has significantly 62
contributed to the functional genomics of rice20,21
. RNA interference (RNAi)-mediated gene-63
silencing has also been an attractive approach for functional genomics22
. A programmable 64
CRISPR/Cas9 system emerged as a promising molecular tool for genome editing23
and 65
Jennifer Doudna and Emmanuelle Charpentier were eventually awarded the 2020 Nobel prize 66
in Chemistry for developing this versatile technology. CRISPR/Cas9 system is now a favored 67
technology for generating transgene-free rice plants24
-26
. Gain-of-function mutagenesis is an 68
alternative approach based on the ectopic overexpression of transgenes under the control of a 69
strong constitutive CaMV35S or ubiquitin promoter27
. Functional characterization of several 70
GPH by reverse and/or forward genetic approach has thus led to the identification of several 71
key positive and negative regulators of sensing and signaling cascades governing the 72
maintenance of Pi homeostasis3,6,28
(Table 2). However, plants generated by these forward 73
and reverse genetics approaches are often deemed as a potential transgene and are regulated 74
by stringent country-specific ethical legislations, and often fail to comply with the biosafety 75
regulations29-31
. Although CRISPR-edited rice was considered to comply with the regulatory 76
approval for commercial applications24
, recently Court of Justice of the European Union 77
(CJEU) has clubbed them with GM plants32-34
. One of the classical controversial cases is the 78
Golden rice, which was engineered to produce seeds enriched with ß- carotene to mitigate 79
vitamin A deficiency in the millions of poor people35
but has been embroiled in polarized 80
debate over its ethicality36
. On the contrary, mutation breeding by exposure to mutagens such 81
as ethyl methanesulfonate (EMS) or irradiation (X-rays) are environmentally benign, have 82
good safety records, and are not regulated worldwide29
. EMS- induced mutagenesis is an 83
attractive strategy for inducing genetic variations in the genome37-38
and has facilitated in the 84
development of a rich repository of rice mutants that exhibit tolerance to different biotic 85
and/or abiotic stresses39
. Nagina22 (N22), an upland and short aus genotype, is tolerant of 86
heat and drought 40-41
. An initiative was launched by the Department of Biotechnology 87
(DBT), Govt. of India, for generating EMS-mutagenized M2 populations (~85,000) in the 88
background of N2241
. At the ICAR-IIRR, efforts are underway for more than a decade to 89
screen N22 EMS mutants that exhibited altered PUE under field condition, which led to the 90
identification of several loss-of-function and gain-of-function mutants42-47
. Among these 91
mutants, detailed morphophysiological and molecular analyses were carried out for the loss-92
of-function mutant NH101, which revealed several traits that were affected contributing 93
towards its lower PUE compared with wild-type N2247
. 94
However, gain-of-function N22 mutant that shows significantly higher PUE has not been 95
characterized as yet. Therefore, in this study, detailed comparative morphophysiological, 96
biochemical, and molecular analyses of N22 and NH787 mutant was carried out in 97

3
hydroponics and potting soil under different Pi regimes. The analysis revealed several traits 98
that contributed towards the higher PUE of the gain-of-function NH787 mutant. 99
100
Materials and Methods 101
Plant materials and experimental conditions. Rice (Oryza sativa L. ssp indica) genotype 102
Nagina22 (N22) were mutagenized with ethyl methanesulfonate (EMS) and several gain-of-103
function mutants i.e., NH363, NH514, NH686, NH719, NH776, and NH787 were identified, 104
which exhibited high grain yield in Pi-deprived soil under field condition compared with 105
N2245
. From these gain-of-function mutants, NH787 was selected for detailed 106
morphophysiological, biochemical, and molecular analyses. About 15 seeds each of N22 and 107
NH787 seeds were placed equidistant on a Pteri plate lined with germination paper soaked 108
with deionized distilled water and wrapped in aluminum foil and kept for germination in a 109
growth chamber (28-30 °C) for 4 d. N22 and NH787 seedlings showed significant variation 110
in their radicle length. Therefore, the seedlings were scanned and their radicle was measured 111
by employing the ImageJ program48
and only those in the range of 2-3 cm were selected and 112
transferred to the hydroponic system as described49
containing P+ (0.3 mM NaH2PO4) and P- 113
(0 mM NaH2PO4) media as described50
for 7 d. For the pot experiment, N22 and NH787 were 114
grown initially under normal soil conditions for 14 d. Subsequently, the seedlings were 115
transplanted in earthen pots which were filled with 8 kg of normal soil (P+) and low P soil 116
(P-) with the Olsen P values of 24 kg/ha and 1.8 kg/ha for P+ and P- soil, respectively. P+ 117
and P- soils were fertilized as described47
. 118
119
Quantitative analysis of the root traits. Seedlings grown in the hydroponic system were 120
removed along with the mesh after 7 d treatment under P+ and P- conditions and placed in an 121
inverted position in a Petri plate containing a pool of water. Under the stereomicroscope, 122
roots were separated at the shoot: hypocotyls junction and transferred to a Petri plate 123
containing 1% (w/v) agar. Adventitious, seminal, and lateral roots were spread gently with a 124
camel hair brush to ensure non-overlapping of different root traits for revealing the root 125
system architecture (RSA). Spread out roots was then scanned at 1000 dpi using a desktop 126
scanner. Scanned images were then used for documenting the number and length of different 127
root traits by using the ImageJ program48
. 128
129
Quantitative analysis of agronomic traits. Plants grown in potting soil (P+ and P-) up to 130
maturity were quantitatively analyzed for the growth performance, biomass and length of 131
root, vegetative biomass, number of tillers, filled spikelets/panicle, unfilled spikelets/panicle, 132
grain weight, and yield as described47
. 133
134
Quantitative analysis of physiological traits. Plants were grown in potting soil (P+ and P-) 135
up to 50% flowering and flag leaf was assayed for photosynthetic rate [PN], stomatal 136
conductance [gs], intercellular CO2 concentration [Ci], and transpiration rate [E]) by using 137
portable photosynthesis system LI-6400XT (LI-COR Biosciences, USA) set at 1,200 μmol 138
m–2
s–1
photosynthetically active radiation (PAR) and 387 ± 6 ppm CO2 concentration. 139
Coefficient of photochemical quenching (qP), coefficient of non-photochemical quenching 140
(qN), electron transport rate (ETR), and maximum efficiency of PSII photochemistry 141
(Fv/Fm) were quantified by employing portable chlorophyll fluorometer PAM-2100 (Heinz 142
Walz GmbH, Germany). Chlorophyll a, b and carotenoids were extracted and their 143
concentrations were quantified as described51,52
. 144
145

4
Quantification of soluble Pi. Harvested root and shoot were rinsed thoroughly 4-5 times 146
with deionized distilled water, blotted dry gently, frozen in liquid nitrogen, ground to a fine 147
powder, and stored at -80 ºC till further use. Ground tissue (~ 25 mg) was homogenized in 148
200 μl of 1% (v/v) glacial acetic acid, vortexed, and centrifuged at 10,000 rpm for 10 min to 149
remove the debris. The supernatant was collected for the quantification of soluble Pi by 150
phosphomolybdate colorimetric assay as described53
. 151
152
Quantification of APase enzyme activity. APase enzyme activity was quantified as 153
described54
with minor modifications. Freshly harvested root and shoot tissues (~0.1 g) were 154
ground in a chilled citrate buffer (0.1 M, pH 5.2), centrifuged at 12,000 rpm at 4°C for 15 155
min, and the supernatant was assayed for APase enzyme activity. The reaction mixture 156
comprised 0.1 ml supernatant, 0.4 ml chilled citrate buffer (0.1 M, pH 5.2), and 0.5 ml p-157
nitrophenol (pNP) (10 mM, pH 5.2). The reaction mixture was incubated at room temperature 158
for 10 min and the reaction was then terminated by adding 2 ml of Na2CO3 (0.2 M). The 159
standard curve was prepared with the known concentrations of pNP and APase enzyme 160
activity was computed by estimating the accumulation of pNP at 405 nm. 161
162
Quantification of antioxidant enzyme activities. Freshly harvested root and shoot tissues 163
(~0.1 g) were ground in phosphate buffer (0.1 M, pH 7.5) containing EDTA (0.5 mM) and 164
centrifuged at 12,000 rpm at 4°C for 15 min. The supernatant was collected for assaying the 165
activities of different antioxidant enzymes. Superoxide dismutase (SOD) was assayed as 166
described55
.The reaction mixture (1.5 ml phosphate buffer [100 mM, pH 7.8], 0.2 ml 167
methionine [200 mM], and 0.1 ml each of the plant extract, Na2CO3 [1.5 M], EDTA [3.0 168
mM], NBT [2.25 mM], and riboflavin [60 μM]) was incubated under a fluorescent lamp (15 169
W) for 15 min. SOD activity was determined by a 50% decrease in the absorbance at 560 nm 170
due to rapid inhibition of O2− with NBT. Peroxidase (POD) activity was assayed as 171
described56
. The reaction mixture comprised 1.0 ml phosphate buffer (100 mM, pH 6.1), 0.5 172
ml each of guaiacol (96 mM), H2O2 (12 mM), and 0.1 ml of the enzyme extract. The 173
absorbance was taken at 470 nm at different time intervals (0, 1, 2, and 3 min). Catalase 174
(CAT) was assayed as described57
. The reaction mixture comprised 1.5 ml phosphate buffer 175
(100 mM, pH 7.0), 0.5 ml H2O2 (75 mM), and 0.05 ml of the enzyme extract. A temporal 176
disappearance of H2O2 was recorded at an interval of 30 sec for 2 min at 240 nm. Ascorbate 177
peroxidase (APX) activity was assayed as described58
. The root and shoot tissues were 178
ground in a solution containing 1.5 ml phosphate buffer (100 mM, pH 7.0) containing 179
ascorbic acid (1 mM), and EDTA (0.5 mM). The solution was centrifuged at 12,000 rpm at 4 180
°C for 20 min and the supernatant was collected for the assay. The reaction mixture 181
comprised 1.5 ml phosphate buffer (100 mM, pH 7.0), 0.1 ml each of EDTA (3.0 mM), H2O2 182
(3.0 mM), 0.5 ml ascorbic acid (3 mM), and 0.05 ml of the enzyme extract. The APX activity 183
was measured by monitoring the gradual decrease in the absorbance value at an interval of 30 184
sec for 2 min at 290 nm. 185
186
Quantification of H2O2 content. H2O2 content was estimated as described59
. Freshly 187
harvested root and shoot tissues (~0.5 g) were ground in 10 ml of trichloroacetic acid, 188
centrifuged at 12, 000 rpm at 4 °C for 15 min, and the supernatant was collected for the 189
assay. The reaction mixture comprised 0.5 ml of phosphate buffer (10 mM, pH 7.0), 2 ml of 190
KI (1 M), and 0.5 ml of the supernatant. The reaction mixture was vortexed for 1 min, 191
incubated in dark for 30 min, and H2O2 content was quantified at 390 nm. 192
193

5
Assay for pollen viability and stigma receptivity. The anthers from the spikelets, collected 194
just before anthesis, were crushed in Lugol's (I2-KI) solution and observed under a light 195
stereomicroscope as described60
. Sterile and fertile pollens were unstained and stained, 196
respectively and their images were captured using a compound microscope (10X). For 197
determining the stigma receptivity, florets were collected an hour after anthesis, stigma was 198
carefully dissected, and incubated in ethyl alcohol: acetic acid (3:1, v/v) for an hour. Stigma 199
was then incubated in 70% ethanol (v/v) at 10oC for 10 min, transferred to NaOH (7 N) for 200
45 min, stained with aniline blue (0.005%, w/v) for 2 min, and washed 2-3 times with 201
distilled water. Images of the stained stigma were captured by using a compound microscope 202
(10X). 203
204
Quality traits in N22 and NH787 under different Pi regimes. Harvested grains were 205
threshed, cleaned, and dried at 45ºC for 3 d to achieve identical moisture content. Grains (~ 206
25 g) were dehulled using a sheller (Satake Co. Ltd. Japan). The hulling rate was 207
computed as described61
. Brown rice was milled by employing Pearlest grain polisher (Kett, 208
USA) and the milling rate was calculated as described61
. The head rice recovery was 209
calculated by weighing polished rice and separating head rice (≥ ¾ length of the brown 210
rice) manually from the broken fractions. Gel consistency (GC) was computed as described62
. 211
Gelatinization temperature was calculated based on the alkali spread score of the milled rice 212
as described61
. Amylose content was estimated from the ground rice flour calorimetrically as 213
described63
. Length, width, and area of grains were measured by using the ImageJ program 48
. 214
215
qRT-PCR analysis. Total RNA (~2 μg) was isolated from the ground tissue using Trizol 216
reagent and treated with RNase-free DNase. First-strand cDNA was synthesized by using 217
oligo (dT)-18 primer and Superscript IITM
Reverse Transcriptase (Invitrogen). OsActin 218
(OsRac1; LOC_Os03g50885) was used as an internal control. The qRT-PCR analysis was 219
performed in triplicate using SYBR Premix Ex Taq™II (TaKaRa) in a StepOnePlus™ Real-220
time PCR system (Applied Biosystems). Relative expression levels of the genes were 221
computed by the 2–ΔΔC
T method of relative quantification64
. Gene-specific primers are listed 222
in Supplementary Table 1. 223
224
Statistical analysis. Two-way analysis of variance (ANOVA) was performed using an open-225
source software R65
with agricolae package. Statistical significance of the parameter means 226
was determined by performing Fisher's LSD test to test the statistical significance. 227
228
Results and discussion 229
Selection of the uniformly grown seedlings for treatment under different Pi regimes in a 230
hydroponic system. Easy-to-assemble, element-contamination-free, and aseptic hydroponics 231
is a suitable system for documenting the developmental responses of different root traits of 232
the wild-type and mutant rice seedlings grown under different Pi regimes45,47,49
. The seed area 233
of N22 and NH787 was documented by employing the ImageJ program48
. There was no 234
significant variation in the seed area of N22 and NH787 (Fig. S1a). Relatively, the seed area 235
was marginally higher (~5%) in N22 EMS mutant NH101 47
. This suggested a variable effect 236
of EMS mutagenesis on the seed area of N22 mutants. Seeds (~20) of N22 and NH787 were 237
placed equidistant on a Pteri plate lined with germination paper soaked with deionized 238
distilled water, wrapped in aluminum foil, and maintained in a growth chamber (28-30 °C) 239
for 4 d. Rice seed with radicle length > 0.5 cm was considered germinated47
. The images of 240
the germinated seedlings (~200 each of N22 and NH787) spread over 10 Petri dishes were 241
captured by using a desktop scanner (Fig. S1b). A significant variation was apparent in the 242

6
radicle length of the germinated seedlings of both N22 and NH787. Earlier studies had 243
suggested selecting only those rice seedlings whose radicle length falls within a fairly 244
comparable size range (~2-3 cm) for subsequent transfer to a hydroponic system under 245
different Pi regime to circumvent any erroneous interpretations47,49
. In the model plant 246
Arabidopsis thaliana also, the selection of uniformly grown seedlings with primary root 247
length in the range of ~1.5-2.5 cm was recommended to minimize the effect of intrinsic 248
variability on the subsequent treatments under different Pi regimes66-68
. Therefore, the radicle 249
length of the germinated N22 and NH787seedlings was measured by using the ImageJ 250
program48
and categorized into different groups based on their radicle length (Fig. S1c). The 251
size distribution pattern ofN22 and NH787radicle length is represented by the red (≤ 0.5 cm), 252
black (0.51-2.0 cm), green (2.01-3.00 cm), and yellow (3.01-5.5) histograms, which exhibited 253
a typical Gaussian curve and a noticeable variation between the genotypes. The number of 254
seedlings with the radicle length in the size range of 2.01-3.00 cm was significantly higher 255
(49.38%) in NH787compared with N22 (21.88%). These seedlings were eventually selected 256
for transfer to the hydroponic system containing P+ and P- media and the rest of the seedlings 257
(< 2.01 cm and > 3.00 cm) were discarded (Fig. S1d). 258
259
Responses of ontogenetically distinct root traits under different Pi regimes in a 260
hydroponic system. The root system of rice comprises ontogenetically distinct 261
embryonically developed primary and seminal roots that play a pivotal role during the 262
seedling stage and post-embryonically developed adventitious roots constituting the bulk of 263
the functional root system in a mature plant69,70
. N22 and NH787 seedlings (4-d-old) with 264
radicle in the size range of 2.01-3.00 cm were transferred to the hydroponic system 265
containing P+ and P- medium and grown for 7 d. After the treatment, roots of N22 and 266
NH787 were separated at the shoot: hypocotyl junction and spread gently to reveal the 267
architectural details of the embryonically and post-embryonically developed traits under P+ 268
and P- conditions. Images of the spread-out roots were captured by using a desktop scanner 269
and the ImageJ program48
was then used for the quantitative documentation of the effects of 270
P+ (Fig. S2B) and P- (Fig. 2B-G) treatments on different root traits. There was a significant 271
reduction (31.23 %) in the primary root length (PRL) of N22 under P- condition (data not 272
shown) and the result was consistent with earlier studies on N2247,49,71
. On the contrary, PRL 273
of NH787 was comparable under P+ and P- conditions (data not shown). Although PRL of 274
N22 and NH787 was comparable under P+ condition, it was significantly higher (21.56%) in 275
the latter compared with the former under P- condition (Fig. 2A, B). The number of lateral 276
roots (NLR) was significantly reduced (47.31%) in NH787compared with N22 under P+ 277
condition(Fig. S2A, B) but was comparable under P- condition (data not shown). Pi 278
deficiency triggered a significant reduction (72.01%) in the total length of the lateral roots 279
(TLLR) on primary, seminal, and adventitious roots of N22 (data not shown) and agreed with 280
earlier studies on N2247,49
. Relatively, Pi deficiency-mediated reduction of TLLR in NH787 281
was 48.64%, which was significantly lower compared with N22 (data not shown). This 282
suggested that the effect of Pi deficiency on TLLR was more aggravated on N22 than 283
NH787.Although TLLR of N22 and NH787 was comparable under P+ condition (Fig. S2A), 284
it was significantly higher (43.42%) in the latter compared with the former under P- condition 285
(Fig. 2A, C). In rice, elongation of the seminal root plays a pivotal role in the acquisition of 286
nutrients such as Pi and nitrogen (N)72
. Therefore, the effect of Pi deficiency was investigated 287
on the number (NSR) and length (TLSR) of N22 and NH787. The effect of Pi deficiency was 288
evident on the developmental response of the seminal roots of N22, which was revealed by 289
significant reductions by 90.03 % and 84.68% in their NSR) and TLSR, respectively 290
compared with P+ condition (data not shown) and was congruent with studies on N2247,49
. 291

7
The effects of Pi deficiency on both NSR and TLSR of NH787 was relatively less aggravated 292
and resulted in reductions by 69.88% and 55.99%, respectively (data not shown). NSR and 293
TLSR of N22 and NH787 were comparable under P+ condition (Fig. S2a). However, under 294
P- condition the NSR and TLSR of NH787were 2.6-fold and 2.9-fold higher, respectively 295
compared with N22 (Fig. 2A, D, E). Pi deficiency has also been shown to exert an attenuating 296
influence on the seminal root length of rice varieties O. rufipogon (IRGC 105491) and 297
Curinga72
. The total length of adventitious roots (TLAR) increased significantly (25.52%) in 298
N22 during Pi deficiency (data not shown) and the result was in agreement with earlier 299
studies on N2247,49
. Relatively, the increase in TLAR was only 12.29% in Pi-deprived 300
NH787(data not shown).TLAR of N22 and NH787 was comparable under P+ condition (Fig. 301
2A) but was significantly higher (65.53%) in the latter compared with the former under P- 302
condition (Fig. 2A, F).Finally, the total root length (TRL) was computed by summation of 303
PRL, TLLR, TLSR, and TLAR. Pi deficiency exerted a significant (63.38%) attenuating 304
effect on the TRL of N22 (data not shown). Earlier studies also reported the inhibitory effect 305
of Pi deficiency on TRL of rice varieties N2247,49
and IR64 (transgenics [null] and NILs with 306
[+] or without [–] Pup1)10
. Comparatively, the effect of Pi deprivation was less aggravated on 307
TRL of NH787 and exhibited a 36.74% reduction compared with P+ condition (data not 308
shown). Although TRL of N22 and NH787 was comparable under P+ condition (Fig. S2A), it 309
was significantly higher (65.68%) in the latter compared with the former under P- condition 310
(Fig. 2A-G). Together, the detailed analyses of different root traits revealed that the effects of 311
Pi deficiency were more aggravated on N22 than NH787. Further, the Pearson correlation 312
was used for identifying the linear relationship between the variables based on the standard 313
deviation from the raw data and the covariance values obtained and represented as a 314
correlogram. Pearson correlation highlights the variables in a data set based on the degree of 315
association among the variables that are correlated positively or negatively with the best. 316
Therefore, Pearson correlation analysis was carried out to determine the relationship across 317
the developmental responses of the ontogenetically distinct root traits of N22 and NH787 318
under different Pi regimes (Fig. S2C, Fig. 2H). Under P+ condition, TLLR was positively and 319
significantly correlated with TRL and NSR in N22, whereas a significant positive correlation 320
was observed between NLR, TLLR, and TRL and NAR and TLAR in NH787 (Fig. S2C). 321
Under P- condition, NSR and TLSR in N22, and TLSR, NAR, TLAR, and TRL in NH787 322
exhibited a significant positive correlation (Fig. 2H). The analysis revealed that NSR, TLSR, 323
and TLLR were positively and significantly correlated with TRL in both Pi-deprived N22 and 324
NH787.A correlogram representing Pearson correlation has also been used in earlier studies 325
on various morpho-biochemical traits at various developmental stages of N22 and its EMS 326
mutants under different Pi regimes43,44,47
. 327
328
Effects of different Pi regimes on various morpho-agronomic traits of N22 and NH787 329
grown to maturity in potting soil. Growth performance and the morpho-agronomic traits of 330
N22 and NH787 plants grown to maturity (50% flowering) in Pi-replete (P+) and low Pi (P-) 331
potting soil were determined (Fig. S3, Fig. 3). Pi deficiency exerted inhibitory effects on 332
various morpho-agronomic traits of both N22 and NH787, which resulted in stunted 333
phenotype, and significant reductions in the root biomass (N22 [88.37%], NH787[24.59%]), 334
vegetative biomass (N22 [73.48%], NH787[12.03%]), filled spikelets/panicle (N22 [50.18%], 335
NH787[17.53%]), 100 grain weight (N22 [25.00%], NH787[8.69%]), and yield (N22 336
[83.08%], NH787[23.59%]) (data not shown). Whereas, during Pi deficiency the unfilled 337
spikelets/panicle was significantly higher in N22 (52.74%) but was comparable in NH787 338
with P+ condition (data not shown). It was evident from the analysis that the effects of Pi 339
deprivation were relatively more aggravated in N22 than NH787. Earlier studies also reported 340

8
the inhibitory effects of Pi deficiency on various morpho-agronomic traits of N22 and its 341
EMS mutants 42-44,46,47,71
. Under P+ condition, there was no apparent difference in the 342
phenotype of N22 and NH787 (Fig. S3A). However, the phenotype of the root, panicles, and 343
grain was more robust in NH787compared with N22 (Fig. S3B-D). This was reflected in 344
significantly higher root biomass (41.86%), vegetative biomass (19.70%), filled 345
spikelets/panicle (89.79%), 100-grain weight (15.00%), and yield (36.96%) of NH787 346
compared with N22 (Fig. S3 E-G, I, J). On the contrary, unfilled spikelets/panicle was 347
significantly higher (61.64%) in N22 compared with NH787 (Fig. S3H). However, under P+ 348
condition the root length and number of tillers in N22 and NH787 were comparable (data not 349
shown). Further, Pearson analysis revealed a positive and significant correlation of yield with 350
root and vegetative biomass, number of tillers, and filled spikelets/panicle in both N22 and 351
NH787 under P+ condition (Fig. S3K). Under P- condition, the phenotypes of the plant, root, 352
panicles, and grain were more robust in NH787 than N22 (Fig. 3A-D). The phenotypic 353
observation was substantiated with significantly higher root biomass (9.2 folds), root length 354
(12.21%), vegetative biomass (3.9 folds), number of tillers (2.37 folds), filled 355
spikelets/panicle (3.15 folds), 100-grain weight (40.00%), and yield (6.42 folds) of NH787 356
compared with N22 (Fig. 3E-I, K, I). However, unfilled spikelets/panicle was significantly 357
higher (73.99%) in N22 thanNH787 (Fig. 3J). Similar to P+ condition, under P- condition 358
also Pearson analysis showed a positive and significant correlation of yield with root and 359
vegetative biomass, number of tillers, and filled spikelets/panicle in both N22 and NH787 360
(Fig. 3H). 361
362
Photosynthetic and chlorophyll fluorescence traits of N22 and NH787 grown to 363
maturity in potting soil. Pi deficiency adversely affects photosynthetic and chlorophyll 364
fluorescence traits in rice73,74
. Therefore, photosynthetic and fluorescence traits were assayed 365
in N22 and NH787 grown to maturity under different Pi regimes (Fig. S4, Fig. 4). Pi 366
deficiency triggered significant reductions in the photosynthetic rate (PN)(N22 [21.84%], 367
NH787[26.39%]), stomatal conductance (gs) (N22 [88.24%], NH787[42.23%]),transpiration 368
rate (E)(N22 [15.31%], NH787[27.90%]), maximum efficiency of PSII photochemistry 369
(Fv/Fm)(N22 [15.79%], NH787[8.73%]),electron transport rate (ETR)(N22 [26.69%], 370
NH787[18.32%]),coefficient of photochemical quenching (qP)(N22 [21.26%], 371
NH787[11.26%]), and coefficient of non-photochemical quenching (qN)(N22 [28.66%], 372
NH787[15.60%])(data not shown). Earlier studies also reported the inhibitory effects of Pi 373
deficiency on various photosynthetic and chlorophyll fluorescence traits in the rice genotypes 374 73,74
and N22 and its EMS mutants43
. On the contrary, Pi deficiency excreted significant 375
increase in the contents of intercellular CO2 (Ci) (N22 [26.02%], NH787[26.32%]), 376
chlorophyll a(N22 [35.18%], NH787[16.53%]),chlorophyll b(N22 [32.47%], 377
NH787[28.70%]), and carotenoid(N22 [18.39%], NH787[7.22%]) (data not shown). The 378
result was consistent with an earlier study showing Pi deficiency-mediated elevated content 379
of Ci74
. Relatively, the augmenting effects of Pi deficiency on chlorophyll a, b, and 380
carotenoid were significantly lower in NH787compared with N22(data not shown).Under P+ 381
condition, PN(27.32%), gs(74.66%), Ci(3.99%), E(29.02%), Fv/Fm (3.79%),ETR (15.22%), 382
qN (14.03%), and contents of chlorophyll a(32.74%), chlorophyll b(16.75%), and 383
carotenoid(21.35%) were significantly higher in NH787 than N22 (Fig. S4A-J). A similar 384
trend was also observed during Pi deficiency where these values (PN[19.90%], gs[31.97%], 385
Ci[4.24%], E[9.83%], Fv/Fm [12.48%],ETR [28.39%], qP [15.67%], qN[2.46%], and 386
contents of chlorophyll a[14.42%], chlorophyll b[13.43%], and carotenoid[9.91%]) were 387
significantly higher in NH787compared with N22 (Fig. 4A-K).The analyses revealed that 388

9
NH787 maintained higher photosynthetic and chlorophyll fluorescence traits than N22 under 389
different Pi regimes (Fig. S4, Fig. 4). 390
391
Pi, Apase and the enzymes involved in ROS scavenging of N22 and NH787 grown to 392
maturity in potting soil. Pi deficiency exerts an attenuating effect on the concentration of Pi, 393
while its effect is augmenting on the activities of Apase and ROS scavenging pathway (APX, 394
CAT, H2O2, POD, and SOD) in the root and shoot of rice47
. Therefore, the concentration of 395
Pi and the activities of Apase and ROS scavenging enzymes were assayed in N22 and NH787 396
grown to maturity under different Pi regimes (Fig. S5, Fig. 5). Pi deficiency triggered 397
significant reductions in the concentration of Pi in the root (N22 [61.30%], NH787 [55.77%]) 398
and in shoot (N22 [66.86%], NH787 [65.31%]) (data not shown). The result was consistent 399
with earlier studies reporting Pi deficiency-mediated reduction in the concentration of Pi in 400
the root and shoot of N22 and its EMS mutants45,47
. It was apparent from this analysis that the 401
effect of Pi deficiency on the concentration of Pi in the root was relatively more aggravated in 402
N22 than NH787but was comparable in the shoot. Concentration of Pi in the root (P+ 403
[14.90%], P- [31.32%]) and shoot (P+ [15.22%], P- [20.60%]) were significantly higher in 404
NH787 than N22 (Fig. S5A, Fig. 5A). On the contrary, the activity of Apase increased 405
significantly during Pi deficiency in the root (N22 [2.17 fold], NH787 [2.86 fold]) and in the 406
shoot (N22 [4.31 fold], NH787 [4.46 fold]) (data not shown) and was coherent with earlier 407
studies on N22 and its EMS mutants46,47
. Although the augmenting effect of Pi deficiency on 408
Apase activity was significantly higher in the root of NH787compared with N22, it was 409
comparable in the shoot of these two genotypes. The activity of Apase in the root (P+ 410
[36.51%], P- [16.28%]) and shoot (P+ [22.17%], P- [19.50%]) were significantly higher in 411
N22 than NH787 (Fig. S5b, Fig. 5B). Significant augmenting effects of Pi deficiency were 412
also evident in the root and shoot of N22 and NH787 on different components of ROS 413
pathway comprising SOD (root [41.86% in N22 and 33.59% in NH787] and shoot [40.36% 414
in N22 and 50.19% in NH787]), H2O2 (root [2.87 fold in N22 and 2.97 fold in NH787] and 415
shoot [69.11% in N22 and 54.03% in NH787]), POD (root [40.03% in N22 and 44.97% in 416
NH787] and shoot [82.65% in N22 and 63.84% in NH787]), APX (root [77.63% in N22 and 417
44.16 % in NH787] and shoot [35.90% in N22 and 22.10% in NH787]), and CAT (root 418
[74.25% in N22 and 87.84% in NH787] and shoot [2.00 fold in N22 and 2.18 fold in 419
NH787]) (data not shown). The analysis revealed that the values in N22 were significantly 420
higher (root [SOD], shoot [H2O2and POD], and root and shoot [APX]) or lower (root [H2O2 421
and POD], shoot [SOD], and root and shoot [CAT]) compared with NH787 (data not shown). 422
Under P+ condition the values were significantly lower (root and shoot [H2O2 and POD] and 423
shoot [SOD]), higher (root and shoot [APX and CAT]), and non-significant (root [SOD]) in 424
NH787compared with N22 (Fig. S5C-G). Almost a similar trend was observed under P- 425
condition with values significantly lower (root and shoot [SOD, H2O2, and POD] and root 426
[CAT]) and higher (root and shoot [APX] and shoot [CAT]) in NH787compared with N22 427
(Fig. 5C-G). The results highlighted differential effects on ROS-mediated redox signaling 428
and oxidative stress in NH787compared with N22 under different Pi regimes. Earlier studies 429
also showed the Pi-dependent differential effects on ROS homeostasis in the EMS mutants of 430
N2243,47
. 431
432
Reproductive traits of N22 and NH787 grown to maturity in potting soil. In earlier 433
studies, significant inhibitory effects of Pi deficiency were observed on the yield potential of 434
N22 and its EMS mutants42-47
. Therefore, the effects of Pi deprivation were investigated on 435
the male reproductive traits of N22 and NH787 grown under different Pi regimes in a potting 436
soil up to maturity (Fig. 6). I2-KIstaining was used for determining the viability of pollen 437

10
collected after anthesis of N22 and NH787grown under P+ and P- conditions (Fig. 6A-D). 438
Pollen viability was significantly higher (P+ [14.73%], P- [23.76%]) in NH787compared with 439
N22, which suggested that Pi deficiency-mediated effect on pollen viability was more 440
aggravated in the latter than the former (Fig. 6A-E). Further, there were significant reductions 441
in the activities of SOD (P+ [29.48%], P- [29.64%]), POD (P+ [12.58%], P- [29.02%]), and 442
APX (P+ [5.48%], P- [13.63%]) in the anthers of NH787 compared with N22 irrespective of 443
Pi regimes (Fig. 6F-H). On the contrary, the activity of CAT in NH787 was significantly 444
lower and higher under P+ (19.05%) and P- (47.05%) conditions, respectively compared with 445
N22 (Fig. 6I). The analysis revealed differential effects on antioxidant enzyme activities of 446
N22 and NH787 under different Pi regimes. Further, the effects of Pi deficiency were 447
determined on various grain parameters of N22 and NH787 grown in P+ and P- potting soil 448
up to maturity(Fig.7). Single grain weight of N22 and NH787 collected from P+ and P- plants 449
were categorized into a week (6-10 mg and 10-15 mg) and robust (16-20 mg, 21-25 mg, and 450
26-30 mg) categories and the frequency of weight distribution pattern in these categories was 451
computed, which revealed a typical Gaussian curve (Fig.7A). Under P+ condition, the 452
frequency of single grain weight under different categories was comparable between N22 and 453
NH787 (Fig.7A). However, significant variation in the frequency of single grain weight was 454
observed under P- condition for N22compared with NH787ranging from higher (6-10 mg and 455
10-15 mg), lower (16-20 mg and 21-25 mg), and comparable (26-30 mg) values (Fig.7A). 456
The analysis revealed that NH787seeds were comparatively more robust than N22 when 457
grown under Pi-deprived condition. Under both P+ and P- conditions, several grain quality 458
parameters of NH787 were significantly higher than N22 comprising hulling (P+ [8.07%], P- 459
[24.18%]) (Fig.7B), milling (P+ [9.48%], P- [21.21%]) (Fig.7C), per cent head rice recovery 460
(P+ [11.79%], P- [26.54%]) (Fig.7D), per cent amylose content (P+ [18.23%], P- [2.21 fold]) 461
(Fig.7E), grain length (P+ [7.07%], P- [8.47%]) (Fig.7F), grain width (P+ [20.3%], P- 462
[27.71%]) (Fig.7G), and grain area (P+ [28.72%], P- [38.42%]) (Fig.7H). Different 463
parameters such as alkali spread value, gelatinization temperature, and gel consistency are 464
commonly used for determining the gain quality traits of rice75-77
. Therefore, alkali spread 465
value, gelatinization temperature, and gel consistency were assayed for the P+ and P- seeds of 466
N22 and NH787, which revealed that these traits were superior in the latter compared with 467
the former (Table S2). Although α-amylase activity in the spikelets of N22 and NH787 was 468
comparable under P+ condition, it was significantly lower in the latter compared with the 469
former under P- condition (Table S3). Low α-amylase activity in the rice spikelets has been 470
correlated with the grain weight and yield78,79
. Pearson correlation analysis was carried out to 471
determine the relationship across agronomical and quality traits (yield, TN, GA, GW, GL, 472
AC, HRR, milling, and hulling), pollen fertility (PF), and the activities of antioxidant 473
enzymes (CAT, APX, POD, and SOD) and α-amylase (AA) in the anther and spikelets of 474
N22 and NH787 under different Pi regimes (Fig. 8). Under P+ condition, a positive and 475
significant correlation in N22 was observed with yield, TN, AA, and AC and that of NH787 476
with yield, TN, PF, AC, and HRR. Whereas, under P- condition, a positive and significant 477
correlation in N22 was detected with yield, TN, APX, AA, AC, and hulling and that of 478
NH787 with yield, TN, PF, POD, APX, GA, GW, AC, and milling. The analysis revealed that 479
TN, AC, AA, POD, APX, and PF were correlated positively and significantly with the yield 480
of N22 and NH787under different Pi regimes. 481
482
Relative expression levels of GPH in N22 and NH787 grown to maturity in potting soil. 483
The qRT-PCR assay was employed to decipher Pi deficiency-mediated effects on the relative 484
expression levels of functionally diverse GPH in the roots ofN22 and NH787grown to 485
maturity in potting soil under P+ and P- conditions (Fig. 9). For this experiment, only those 486

11
GPH were selected, which had been functionally characterized either by overexpression 487
under the constitutive promoter or by mutation (T-DNA, Tos17, RNAi, or CRISPR-cas9) and 488
implicated in their tissue-specific pivotal roles in the sensing and signaling cascades 489
governing the maintenance of Pi homeostasis under Pi regimes (Table 2). In Pi-deprived 490
roots of NH787 compared with N22, the relative expression levels of several GPH were 491
significantly higher that are implicated in the transcriptional regulation of signaling pathway 492
(OsPHR280
), regulation by systemic and local Pi signaling and hormones (OsIPS81
), 493
regulation of Fe transport by integrating Pi and Zn deficiency signaling (OsPHO1;182
), 494
inhibition of Pi starvation responses by interacting with OsPHR2 in a Pi-dependent 495
manner(OsSPX283
), and uptake and/or mobilization of Pi by low-and high-affinity Pi 496
transporters (OsPht1;1, OsPht1;2, OsPht1;4, OsPht1;6, OsPht1;8, and OsPht1;950,84-89
(Fig. 497
9A). On the contrary, the relative expression levels of several GPH were significantly 498
reduced in Pi-deprived roots of NH787 compared with N22 that are involved in the uptake of 499
Pi by high-affinity Pi transporter (OsPht1;1087
), utilization of extracellular organic P 500
(OsPAP10a90
), regulation of the growth during Pi deficiency via a negative feedback loop 501
and by interacting with OsPHR2 in a Pi-dependent manner (OsSPX183,91
), regulation of Pi 502
starvation signal transduction (OsmiRNA399a92
), growth and development and maintenance 503
of Pi homeostasis (OsLPR593
), regulation of Pi starvation responses(OsPHO294
), and post-504
translational SUMOylation of proteins (OsSIZ195
) (Fig. 9B). In Arabidopsis thaliana, 505
electrophoretic mobility shift assay revealed the binding of the transcription factor PHR1 as a 506
dimer to an imperfect palindromic 8-bp sequence (5’-GNATATNC-3’) named as 507
PHR1binding sequence (P1BS) found in the promoter (2 kb upstream of ATG start codon) of 508
several genes involved in Pi deficiency-mediated responses96,97
. Therefore, the P1BS 509
(GNATATNC) motif was analysed in the promoter (3 kb upstream of ATG initiation site) of 510
the 17 GPH revealing its presence in 14 of them, which suggested their potential regulation 511
by OsPHR2 (Table 2). In this context, significantly higher relative expression of OsPHR2 in 512
Pi-deprived roots of NH787 compared with N22 (Fig. 9A) suggested its potential regulatory 513
influence on the expression of several GPH that play a pivotal role in the maintenance of Pi 514
homeostasis under different Pi regimes. 515
516
Conclusions 517
The results provided empirical evidence towards the differential effects of the EMS 518
mutagenesis on various morphophysiological, biochemical, and molecular traits of NH787 519
that conferred higher PUE under low Pi soil conditions compared with N22. NH787 is now 520
used as a donor in breeding programs for developing low P tolerant varieties with superior 521
grain quality and is also being evaluated in larger plots at multiple locations with variable 522
agroclimatic conditions. Effortsare also underway to identify the candidate genes in NH787 523
responsible for higher PUE by employing quantitative trait loci (QTL) mapping and the 524
MutMap approach in the F2 populations revealing a discernible phenotype98
. The MutMap 525
approach has been used in an earlier study for identifying the candidate genes conferring salt 526
tolerance in the F2 populations of EMS mutant hitomebore salt tolerant 1 (hst1) of rice 527
variety Hitomebore99
. 528
529
Ethics statement. The authors declare that the experiments comply with the current laws of 530
the country in which they were performed and in compliance with ethical standards. 531
532
Data availability 533
All data generated or analysed during this study are included in this published article (and its 534
Supplementary Information files). The sequence data is available on request. 535

12
536
References 537
1. Singh, S.K., Bhati, P.K., Sharma, A. & Sahu, V. Super hybrid rice in China and India: 538
current status and future prospects. Int. J. Agric. Biol. 17, 221-232 (2015). 539
2. Chien, P.-S., Chiang, C.-P., Leong, S.J. & Chiou, T.-J. Sensing and signaling of 540
phosphate starvation: from local to long distance. Plant Cell Physiol. 59, 1714-1722 541
(2018). 542
3. Chiou, T.-J. & Lin, S.-I. Signaling network in sensing phosphate availability in plants. 543
Annu. Rev. Plant Biol. 62, 185-206 (2011). 544
4. Crombez, H., Motte, H. & Beeckman, T. Tackling plant phosphate starvation by the 545
roots. Dev. Cell 48, 599-615 (2019). 546
5. Gutiérrez-Alanís, D., Ojeda-Rivera, J.O., Yong-Villalobos, L., Cárdenas-Torres, L. & 547
Herrera-Estrella, L. Adaptation to phosphate scarcity: tips from Arabidopsis roots. Trends 548
Plant Sci. 23, 721-730 (2018). 549
6. López-Arredondo, D.L., Leyva-González, M.A., González-Morales, S.I., López-Bucio, J. 550
& Herrera-Estrella, L. Phosphate nutrition: improving low-phosphate tolerance in crops. 551
Annu. Rev. Plant Biol. 65, 95-123 (2014). 552
7. Gu, M., Chen, A., Sun, S. & Xu, G. Complex regulation of plant phosphate transporters 553
and the gap between molecular mechanisms and practical application: what is missing? 554
Mol. Plant 9, 396-416 (2016). 555
8. Nussaume, L. et al. Phosphate import in plants: focus on the PHT1 transporters. Front. 556
Plant Sci. 2, 83 (2011). 557
9. Raghothama, K.G. Phosphate acquisition. Annu. Rev. Plant Physiol. Plant Mol. Biol. 50, 558
665-693 (1999). 559
10. Gamuyao, R. et al.The protein kinase Pstol1 from traditional rice confers tolerance of 560
phosphorus deficiency. Nature 488, 535-539 (2012). 561
11. Haefele, S.M., Nelson, A. & Hijmans, R.J. Soil quality and constraints in global rice 562
production. Geoderma 235-236, 250-259 (2014). 563
12. Krishnamurthy, P., Sreedevi, B., Ram, T. & Latha, P.C. Evaluation of rice genotypes for 564
phosphorus use efficiency under soil mineral stress conditions. J. Rice Res. 7, 53-61 565
(2014). 566
13. Prasad, R. Fertilizers and manures. Curr. Sci. 102, 894-898 (2012). 567
14. Cordell, D., Drangert, J.-O. &White, S. The story of phosphorus: global food security and 568
food for thought. Global Environ. Change 19, 292-305 (2009). 569
15. Veneklaas, E.J. et al. Opportunities for improving phosphorus-use efficiency in crop 570
plants. New Phytol. 195, 306-320 (2012). 571
16. van de Wiel, C.C.M., van der Linden, C.G. & Scholten, O.E. Improving phosphorus use 572
efficiency in agriculture: opportunities for breeding. Euphytica 207, 1-22 (2016). 573
17. International Rice Genome Sequencing Project. The map-based sequence of the rice 574
genome. Nature 436, 793-800 (2005). 575
18. Jackson, S.A. Rice: the first crop genome. Rice 9, 14 (2016). 576
19. Jung, K.-H., An, G. & Ronald, P.C. Towards a better bowl of rice: assigning function to 577
tens of thousands of rice genes. Nat. Rev. Genet. 9, 91-101 (2008). 578
20. Hirochika, H. Insertional mutagenesis with Tos17 for functional analysis of rice genes. 579
Breed. Sci. 60, 486-492 (2010). 580
21. Hirochika, H. et al. Rice mutant resources for gene discovery. Plant Mol. Biol. 54, 325-581
334 (2004). 582
22. Wilson, R. & Doudna, J.A. Molecular mechanisms of RNA interference. Annu. Rev. 583
Biophys. 42, 217-239 (2013). 584

13
23. Jinek, M. et al. A programmable dual RNA-guided DNA endonuclease in adaptive 585
bacterial immunity. Science 337, 816-821 (2012). 586
24. He, Y. et al.Programmed self-elimination of the CRISPR/Cas9 construct greatly 587
accelerates the isolation of edited and transgene-free rice plants. Mol. Plant 11, 1210-588
1213 (2018). 589
25. Hu, X., Meng, X., Liu, Q., Li, J. & Wang, K. Increasing the efficiency of CRISPR-Cas9-590
VQR precise genome editing in rice. Plant Biotechnol. J. 16, 292-297 (2018). 591
26. Miao, C. et al. Mutations in a subfamily of abscisic acid receptor genes promote rice 592
growth and productivity. Proc. Natl Acad. Sci. USA 115, 6058-6063 (2018). 593
27. Kondou, Y., Higuchi, M. & Matsui, M. High-throughput characterization of plant gene 594
functions by using gain-of-function technology. Annu. Rev. Plant Biol. 61, 373-393 595
(2010). 596
28. Wu, P., Shou, H., Xu, G. & Lian, X. Improvement of phosphorus efficiency in rice on the 597
basis of understanding phosphate signaling and homeostasis. Curr. Opin. Plant Biol. 16, 598
205-212 (2013). 599
29. Chen, K. & Gao, C. Genome-edited crops: how to move them from laboratory to market. 600
Front. Agr. Sci. Eng 7, 181-187 (2020). 601
30. Cunningham, F.J., Goh, N.S., Demirer, G.S., Matos, J.L. & Landry, M.P. Nanoparticle-602
mediated delivery towards advancing plant genetic engineering. Trends Biotechnol. 36, 603
882-897 (2018). 604
31. Schmidt, S.M., Belisle, M. & Frommer, W.B. The evolving landscape around genome 605
editing in agriculture. EMBO Rep. 21, e50680 (2020). 606
32. Editorial. Gene-edited plants cross European event horizon, Nat. Biotechnol. 36, 776 607
(2018). 608
33. Ishii, T. Crop gene-editing: should we bypass or apply existing GMO policy? Trends 609
Plant Sci. 23, 947-950 (2018). 610
34. Purnhagen, K.P. et al. EU court casts new plant breeding techniques into regulatory 611
limbo, Nat. Biotechnol. 36, 799-800 (2018). 612
35. Potrykus, I. Golden rice and beyond. Plant Physiol. 125, 1157-1161(2001). 613
36. Kettenburg, A.J., Hanspach, J., Abson, D.J. & Fischer, J. From disagreements to 614
dialogue: unpacking the golden rice debate. Sustain. Sci. 13, 1469-1482 (2018). 615
37. Till, B.J. et al. Discovery of chemically induced mutations in rice by TILLING. BMC 616
Plant Biol. 7, 19 (2007). 617
38. Tsai, H. et al. Discovery of rare mutations in populations: TILLING by sequencing. Plant 618
Physiol. 156, 1257-1268 (2011). 619
39. Jiang, S.-Y. & Ramachandran, S. Natural and artificial mutants as valuable resources for 620
functional genomics and molecular breeding. Int. J. Biol. Sci. 6, 228-251(2010). 621
40. Jagadish, S.V.K., Craufurd, P.Q. & Wheeler, T.R. Phenotyping parents of mapping 622
populations of rice for heat tolerance during anthesis. Crop Sci. 48, 1140-1146 (2008). 623
41. Mithra, S.V.A. et al. DBT propelled national effort in creating mutant resource for 624
functional genomics in rice. Curr. Sci. 110, 543-548 (2016). 625
42. Poli, Y. et al. Genotype × environment interactions of Nagina22 rice mutants for yield 626
traits under low phosphorus, water limited and normal irrigated conditions. Sci. Rep. 8, 627
15530 (2018a). 628
43. Poli, Y. et al. Increased catalase activity and maintenance of photosystem II distinguishes 629
high-yield mutants from low-yield mutants of rice var. Nagina22 under low-phosphorus 630
stress. Front. Plant Sci. 9, 1543 (2018b). 631

14
44. Yugandhar, P. et al. Identifying markers associated with yield traits in Nagina22 rice 632
mutants grown in low phosphorus field or in alternate wet/dry conditions. Aust. J. Crop. 633
Sci. 11, 548-556 (2017a). 634
45. Yugandhar, P. et al. Comparing hydroponics, sand, and soil medium to evaluate 635
contrasting rice Nagina22 mutants for tolerance to phosphorus deficiency. Crop Sci. 57, 636
2089-2097 (2017b). 637
46. Yugandhar, P. et al. Nagina22 mutants tolerant or sensitive to low P in field show 638
contrasting response to double P in hydroponics and pots. Arch. Agron. Soil Sci. 64, 639
1975-1987 (2018a). 640
47. Yugandhar, P. et al. Characterization of the loss-of-function mutant NH101 for yield 641
under phosphate deficiency from EMS-induced mutants of rice variety Nagina22. Plant 642
Physiol. Biochem. 130, 1-13 (2018b). 643
48. Collins, T.J. ImageJ for microscopy. BioTechniques 43, S25-S30 (2007). 644
49. Negi, M., Sanagala, R., Rai, V. & Jain, A. Deciphering phosphate deficiency-mediated 645
temporal effects on different root traits in rice grown in a modified hydroponic system. 646
Front. Plant Sci. 7, 550 (2016). 647
50. Jia, H. et al. The phosphate transporter gene OsPht1;8 is involved in phosphate 648
homeostasis in rice. Plant Physiol. 156, 1164-1175 (2011). 649
51. Lichtenthaler, H.K. & Wellburn, A.R. Determinations of total carotenoids and 650
chlorophylls a and b in leaf extracts in different solvents. Biochem. Soc. Trans. 11, 591-651
592 (1983). 652
52. Porra, P.J., Thompson, W.A. & Kriedemann, P.E. Determination of accurate extinction 653
coefficients and simultaneous equations for assaying chlorophylls a and b extracted with 654
four different solvents: verification of the concentration of chlorophyll standards by 655
atomic absorption spectroscopy. Biochim. Biophys. Acta 975, 384-394 (1989). 656
53. Ames, B.N. Assay of inorganic phosphate, total phosphate and phosphatases. Methods 657
Enzymol. 8, 115-118 (1966). 658
54. Johnson, C.B., Holloway, B.R., Smith, H. & Grierson, D. Isoenzymes of acid phosphatase 659
in germinating peas. Planta 115, 1-10 (1973). 660
55. Dhindsa, R.S., Plumb-Dhindsa, P. & Thorpe, T.A. Leaf senescence: correlated with 661
increased levels of membrane permeability and lipid peroxidation, and decreased levels of 662
superoxide dismutase and catalase. J. Exp. Bot. 32, 93-101(1981). 663
56. Castillo, F.J., Penel, C. & Greppin, H. Peroxidase release induced by ozone in Sedum 664
album leaves. Involvement of Ca2+
. Plant Physiol. 74, 846-851(1984). 665
57. Aebi, H. Catalase in vitro. Meth. Enzymol. 105, 121-126 (1984). 666
58. Nakano, Y. & Asada, K. Hydrogen peroxide is scavenged by ascorbate-specific 667
peroxidase in spinach chloroplasts. Plant Cell Physiol. 22, 867-880 (1981). 668
59. Alexieva, V., Sergiev, I., Mapelli, S. & Karanov, E. The effect of drought and ultraviolet 669
radiation on growth and stress markers in pea and wheat. Plant Cell Environ. 24, 1337-670
1344 (2001). 671
60. Poli, Y. et al. Characterization of a Nagina22 rice mutant for heat tolerance and mapping 672
of yield traits. Rice 6, 36 (2013). 673
61. Cruz, N.D. & Khush, G.S. Rice grain quality evaluation procedures. In: Singh R K, 674
Singh U S, Khush G S. Aromatic Rices. New Delhi, India: Oxford and IBH 675
Publishing Co. Pvt. Ltd 15-28 (2000). 676
62. Cagampang, G.B., Perez, C.M. & Juliano, B.O. A gel consistency test for eating quality 677
of rice. J. Sci. Fd. Agric. 24, 1589-1594 (1973). 678
63. Juliano,B.O. A simplified assay for milled rice amylase. Cereal Sci. Today 16, 334-340 679
(1971). 680

15
64. Livak, K.J. & Schmittgen, T.D. Analysis of relative gene expression data using real-time 681
quantitative PCR and the 2–ΔΔC
T method. Methods 25, 402-408 (2001). 682
65. R Core Team. R: A Language and Environment for Statistical Computing. Vienna: R 683
Foundation for Statistical Computing. (2012). 684
66. Jain, A. et al. Differential effects of sucrose and auxin on localized phosphate deficiency-685
induced modulation of different traits of root system architecture in Arabidopsis. Plant 686
Physiol. 144, 232-247 (2007). 687
67. Jain, A. et al. Variations in the composition of gelling agents affect morphophysiological 688
and molecular responses to deficiencies of phosphate and other nutrients. Plant 689
Physiol.150, 1033-1049 (2009). 690
68. Nagarajan, V.K. et al. Arabidopsis Pht1;5 mobilizes phosphate between source and sink 691
organs and influences the interaction between phosphate homeostasis and ethylene 692
signaling. Plant Physiol.156, 1149-1163 (2011). 693
69. Hochholdinger, F., Park, W.J., Sauer, M. & Woll, K. From weeds to crops: genetic 694
analysis of root development in cereals. Trends Plant Sci. 9, 42-48 (2004). 695
70. Hochholdinger, F. & Zimmermann, R. Conserved and diverse mechanisms in root 696
development. Curr. Opin. Plant Biol. 11, 70-74 (2008). 697
71. Panigrahy, M. et al. Hydroponic experiment for identification of tolerance traits 698
developed by rice Nagina 22 mutants to low-phosphorus in field condition. Arch. Agron. 699
Soil Sci. 60, 565-576 (2014). 700
72. Ogawa, S. et al. N- and P-mediated seminal root elongation response in rice seedlings. 701
Plant Soil 375, 303-315 (2014). 702
73. Veronica, N.et al. Influence of low phosphorus concentration on leaf photosynthetic 703
characteristics and antioxidant response of rice genotypes. Photosynthetica 55, 285-293 704
(2017). 705
74. Xu, H.X., Weng, X.Y. & Yang, Y. Effect of phosphorus deficiency on the photosynthetic 706
characteristics of rice plants. Russ. J. Plant Physiol .54, 741-748 (2007). 707
75. Graham-Acquaah, S. et al. Variations in agronomic and grain quality traits of rice grown 708
under irrigated lowland conditions in West Africa. Food Sci. Nutr. 6, 970-982 (2018). 709
76. Lapitan, V.C., Redoña, E.D., Abe, T. & Brar, D.S. Mapping of quantitative trait loci 710
using a doubled-haploid population from the cross of Indica and Japonica cultivars of 711
rice. Crop Sci.49, 1620-1628 (2009). 712
77. Misra, G. et al. Dissecting the genome-wide genetic variants of milling and appearance 713
quality traits in rice. J. Exp. Bot.70, 5115-5130 (2019). 714
78. Hakata, M. et al. Suppression of α-amylase genes improves quality of rice grain ripened 715
under high temperature. Plant Biotechnol. J. 10, 1110-1117 (2012). 716
79. Nakata, M. et al. High temperature-induced expression of rice α-amylases in developing 717
endosperm produces chalky grains. Front. Plant Sci. 8, 2089 (2017). 718
80. Zhou, J. et al. OsPHR2 is involved in phosphate-starvation signaling and excessive 719
phosphate accumulation in shoots of plants. Plant Physiol.146, 1673-1686 (2008). 720
81. Hou, X.L. et al. Regulation of the expression of OsIPS1 and OsIPS2 in rice via systemic 721
and local Pi signalling and hormones. Plant Cell Environ.28, 353-364 (2005). 722
82. Saenchai, C.et al. The involvement of OsPHO1;1 in the regulation of iron transport 723
through integration of phosphate and zinc deficiency signaling. Front. Plant Sci.7, 396 724
(2016). 725
83. Wang, Z. et al. Rice SPX1 and SPX2 inhibit phosphate starvation responses through 726
interacting with PHR2 in a phosphate-dependent manner. Proc. Natl Acad. Sci. U.S.A. 727
111, 14953-14958 (2014). 728

16
84. Ai, P. et al. Two rice phosphate transporters, OsPht1;2 and OsPht1;6, have different 729
functions and kinetic properties in uptake and translocation. Plant J. 57, 798-809 (2009). 730
85. Jia, H. et al. OsPht1;8, a phosphate transporter, is involved in auxin and phosphate 731
starvation response in rice. J. Exp. Bot. 68, 5057-5068 (2017). 732
86. Sun, S. et al. A constitutive expressed phosphate transporter, OsPht1;1, modulates 733
phosphate uptake and translocation in phosphate-replete rice. Plant Physiol. 159, 1571-734
1581 (2012). 735
87. Wang, X. et al. Phosphate transporters OsPHT1;9 and OsPHT1;10 are involved in 736
phosphate uptake in rice. Plant Cell Environ. 37, 1159-1170 (2014). 737
88. Zhang, F. et al. Overexpression of rice phosphate transporter gene OsPT6 enhances 738
phosphate uptake and accumulation in transgenic rice plants. Plant Soil 384, 259-270 739
(2014). 740
89. Zhang, F. et al. Involvement of OsPht1;4 in phosphate acquisition and mobilization 741
facilitates embryo development in rice. Plant J. 82, 556-569 (2015). 742
90. Tian, J. et al. Overexpression of OsPAP10a, a root-associated acid phosphatase, increased 743
extracellular organic phosphorus utilization in rice. J. Integr. Plant Biol. 54, 631-639 744
(2012). 745
91. Wang, Z. et al. Regulation of OsSPX1 and OsSPX3 on expression of OsSPX domain 746
genes and Pi-starvation signaling in rice. J. Integr. Plant Biol.51, 663-674 (2009). 747
92. Hu, B. et al. MicroRNA399 is involved in multiple nutrient starvation responses in rice. 748
Front. Plant Sci.6, 188 (2015). 749
93. Ai, H. et al. The ferroxidase LPR5 functions in the maintenance of phosphate 750
homeostasis and is required for normal growth and development of rice. J. Exp. Bot.71, 751
4828-4842 (2020). 752
94. Hu, B. et al. LEAF TIP NECROSIS1 plays a pivotal role in the regulation of multiple 753
phosphate starvation responses in rice. Plant Physiol. 156, 1101-1115 (2011). 754
95. Wang, H. et al. OsSIZ1, a SUMO E3 ligase gene, is involved in the regulation of the 755
responses to phosphate and nitrogen in rice. Plant Cell Physiol. 56, 2381-2395 (2015). 756
96. Misson, J. et al. A genome-wide transcriptional analysis using Arabidopsis thaliana 757
Affymetrix gene chips determined plant responses to phosphate deprivation. Proc. Natl 758
Acad. Sci. U.S.A.102, 11934-11939 (2005). 759
97. Rubio, V. et al. A conserved MYB transcription factor involved in phosphate starvation 760
signaling both in vascular plants and in unicellular algae. Genes Dev. 15, 2122-2133 761
(2001). 762
98. Abe, A. et al. Genome sequencing reveals agronomically important loci in rice using 763
MutMap. Nat. Biotechnol.30, 174-178 (2012). 764
99. Takagi, H. et al. MutMap accelerates breeding of a salt-tolerant rice cultivar. Nat. 765
Biotechnol. 33, 445-449 (2015). 766
767
Acknowledgements 768
We thank Dr SR Voleti and Dr N Sarla (ICAR-Indian Institute of Rice Research, Hyderabad, 769
India) for their valuable and critical suggestions throughout this study. The work was 770
supported by the research grants (BT/PR-9264/AGR/02/ 406(04)/2007 and 771
BT/PR10787/AGIII/103/883/2014) by the Department of Biotechnology, Govt. of India to 772
SKM. We also acknowledge the Fund for Improvement of S&T Infrastructure in Universities 773
and Higher Educational Institutions (FIST) for 2017 by the Department of Science & 774
Technology, Government of India) to Amity Institute of Biotechnology, Amity University 775
Rajasthan (AUR) (SR/FST/LS-1/2017/56). 776
777

17
Authorship contributions 778
A.J. developed the ideas, designed, and supervised all the experiments, and prepared the final 779
manuscript. Y.P. performed most of the experiments, analyzed the data, and prepared the 780
final manuscript. D.S. and S.K.M. supervised all the physiological and biochemical 781
experiments. V.N. performed most of the experiments and analyzed the data. A.H. analyzed 782
the molecular data. W.X. prepared the figures. D.G. carried out the literature search. 783
784
Additional Information 785
Supplementary data accompanies this paper at https://doi.org/10.xxxx.xxxxxx.xxx.xxxxx.x. 786
787
Competing Interests: The authors declare no competing interests. 788
789
Legends 790
791

18
Figure 1. Rice producing (metric tons) (a) top 20 countries 792
(www.worldagriculturalproduction.com/crops/rice.aspx) and (b) top 10 states in India 793
(www.mapsofindia.com/top-ten/india-crops/rice.html). (c) Available soil P content (high, 794
medium, and low) in top 10 states in India producing rice (www.iiss.nic.in/districtmap.html). 795
796
Figure 2. Effects of Pi deficiency on different RSA traits. N22 and NH787 seedlings (4-d-797
old)were grown hydroponically under P- conditions for 7 d. (a) Roots were spread gently and 798
scanned to reveal the architectural details. The primary root tip is indicated by a blue dot. (b-799
g) Data presented for (b) Primary root length (PRL), (c) Total length of the lateral roots 800
(TLLR), (d) Number of seminal roots (NSR), (e) Total length of seminal roots (TLSR), (f) 801
Total length of adventitious roots (TLAR), and (g) Total root length (TRL).Values (n = 12) 802
are means ± SE and different letters on the histograms indicate that the means differ 803
significantly (P< 0.05). (h) Correlogram of theRSA traits in Pi-deprived N22 and NH787. 804
The scale represents Pearson correlation values with bluish and reddish shades indicate 805
positive and negative correlation, respectively. 806

19
807
808
Figure 3. Effects of Pi deficiency on the growth performance and the agronomic traits. N22 809
and NH787 seedlings (15-d-old) were grown in a low Pi (P-) potting soil up to maturity. (a-d) 810
Growth performance (a) and phenotype of the root (b), panicle (c), and seed (d) of Pi-811
deprived N22 and NH787. The photographs (a-d) are representatives of 12 independent 812
biological replicates. (e-l) Data presented for (e) Root biomass, (f) Root length, (g) 813
Vegetative biomass, (h) Number of tillers, (i) Filled spikelets/panicle, (j) Unfilled 814
spikelets/panicle, (k) 100 grain weight, and (l) Yield. Values (n = 12) are means ± SE and 815
different letters on the histograms indicate that the means differ significantly (P < 816
0.05).Correlogram of agronomic traits i.e., Filled spikelets/panicle (FSP), Number of tillers 817
(NT), Root biomass (RB), Root length (RL), Vegetative biomass (VB), and Unfilled 818
spikelets/panicle (USP) in Pi-deprived N22 and NH787. The scale represents Pearson 819
correlation values with bluish and reddish shades indicate positive and negative correlation, 820
respectively. 821

20
822
823
Figure 4. Effects of Pi deficiency on the photosynthetic and fluorescence traits in N22 and 824
NH787. (a-k) Data are presented for (a) Photosynthetic rate (PN), (b) Stomatal conductance 825
(gs), (c) Intercellular CO2 concentration (Ci), (d) Transpiration rate (E), (e) Maximum 826
efficiency of PSII photochemistry (Fv/Fm), (f) Electron transport rate (ETR), (g) Coefficient 827
of photochemical quenching (qP), (h) Coefficient of non-photochemical quenching (qN), and 828
contents of (i) Chlorophyll a, (j) Chlorophyll b, and (k) carotenoid. Values (n = 12) are 829
means ± SE and different letters on the histograms indicate that the means differ significantly 830
(P < 0.05). 831

21
832
833
Figure 5. Effects of Pi deficiency on the concentrations of Pi, Apase, and the enzymes 834
involved in ROS scavenging. N22 and NH787 were grown hydroponically for 7d and in a 835
potting soil up to 50% flowering under P+ and P- conditions. (a-g) Data are presented for the 836
concentrations of (a) Pi, (b) Apase, (c) SOD, (d) H2O2, (e) POD, (f) APX, and (g) CAT. 837
Values (n=12) aremeans ± SE and different letters on the histograms indicate that the means 838
differ significantly (P< 0.05).Hp, Hydroponics; Ps, Potting soil. 839

22
840
841
Figure 6. Effects of Pi deficiency on pollen viability and antioxidant enzyme activities in the 842
anther. N22 and NH787 were grown in a potting soil up to 50% flowering under P+ and P- 843
conditions. (a-d) Pollen viability was assayed by staining with I2-KI and the images were 844
captured with a stereomicroscope. The data are presented for (e) Per cent pollen viability and 845
(f-i) the ROS scavenging enzyme activities in the anthers of (f) SOD, (g) POD, (h) APX, and 846
(i) CAT. Values (n= 6) aremeans ± SE and different letters on the histograms indicate that the 847
means differ significantly (P< 0.05). 848

23
849
850
Figure 7. Effects of Pi deficiency on different grain parameters. N22 and NH787 were grown 851
in a potting soil up to 50% flowering under P+ and P- conditions and after harvesting, grains 852
were threshed, cleaned, and dried under natural condition. Data are presented for (a) 853
Frequency of single grain weight, (b) Hulling, (c) Milling (d) Per cent head rice recovery, (e) 854
Per cent amylose content, (f) Grain length, (g) Grain width, and (h) Grain area. Values (n = 3, 855
6, and 20 for a, b-e, and f-h, respectively) are means ± SE and different letters on the 856
histograms indicate that the means differ significantly (P< 0.05). 857

24
858
859
Figure 8. Correlogram of the agronomical and quality traits, pollen fertility, and the activities 860
of antioxidant enzymes and α-amylase in the anther and spikelets, respectively in N22 and 861
NH787grown in a potting soil up to 50% flowering under P+ and P- conditions. The scale 862
represents Pearson correlation values with brownish and bluish shades indicate positive and 863
negative correlation, respectively. TN = Tiller number, PF = pollen fertility, GA = Grain area, 864
GW = grain width, GL = Grain length, AA = α-amylase, AC = amylose content, HRR = Head 865
rice recovery. 866

25
867
868
Figure 9. Relative expression levels of GPH in Pi-deprived roots of N22 and NH787.N22 and 869
NH787 were grown in potting soil under P+ and P- conditions up to 50% flowering stage and 870
their roots were harvested. Quantitative real-time RT-PCR (qRT-PCR) was employed for 871
determining the relative expression levels of MPH genes.(a) MPH genes induced in 872
NH787(green bars)compared with N22 (black bars). (b) MPH genes suppressed in 873
NH787(red bars)compared with N22 (black bars).OsActin(LOC_Os03g50885)was used as an 874
internal control. Values are means ± SE (n=6) and different letters on the histograms indicate 875
that the values differ significantly(P< 0.05). 876
877
878
879
880
881

26
882
Country Rice
production
(Metric tons)*
Population
(in million as
of September
2020)**
Projected
population
(in million
by 2050)***
Per cent increase in
population by 2050
China 14,90,00,000 1439.32 1402.40 -2.63
India 11,80,00,000 1380.00 1639.17 15.81
Bangladesh 3,60,00,000 164.68 192.56 14.48
Indonesia 3,49,00,000 273.52 330.90 17.34
Vietnam 2,75,00,000 97.33 109.60 11.2
Thailand 2,04,00,000 69.79 65.94 -5.84
Myanmar 1,31,00,000 54.40 62.25 12.61
Philippines 1,10,00,000 109.58 144.48 24.16
Japan 76,50,000 126.47 105.80 -19.54
Pakistan 75,00,000 220.89 338.01 34.65
Brazil 68,68,000 212.55 228.98 7.18
United States 68,64,000 331.00 379.41 12.76
Cambodia 57,80,000 16.71 21.86 23.56
Nigeria 49,61,000 206.13 401.31 48.64
Egypt 43,00,000 102.33 159.95 36.02
South Korea 37,44,000 51.26 NA NA
Nepal 36,75,000 29.13 35.32 17.53
Sri Lanka 28,93,000 21.41 21.81 1.83
Madagascar 26,88,000 27.69 54.04 48.76
Peru 22,77,000 32.97 40.37 18.33
Table 1. Top 20 rice-producing countries, their present (2020), predicted (2050), and per cent 883
increase in population by 2050. 884
*www.worldagriculturalproduction.com/crops/rice.aspx 885
**www.worldometers.info/world-population 886
***www. populationpyramid.net/2050 887
NA = Not available 888
889
S.No.
Family Genes LOC number
P1BS position (analysed in 3 kb
upstream of ATG initiation site of the gene)
Transcription
al response to Pi deficie
ncy
Functional characterization Function Reference
Number
Location Root
Shoot
Ox RNAi T-DNA
Tos
17
CRISPR-Cas9
1 E3 SUMO ligase
OsSIZ1 Os05g03430
0 None Pi-dependent responses.
(Wang et al., 2015)
2 MYB-like transcription
factor
OsPHR2 Os07g25710
1 -1862/-1855 Pi-starvation signalling pathway
(Zhou et al.,2008 )
3 miRNA miRNA399a
MI0001053 1 -139/-132 Regulates Pi starvation signal transduction
(Hu et al., 2015)
4 Pi sensing
and OsIPS1
Os03g0533
4 2
-432/-425, -
567/-560
Regulation by
systemic and local Pi (Hou et al., 2005)

27
signalling signalling and hormones.
5 Ubiquitin-conjugating
E2 enzyme
OsPHO2 Os05g4839
0 2
-740/-733, -
1255/1248
Signalling component
downstream of miR399 and involved
in regulating Pi starvation responses.
(Hu et al., 2011)
6 Root-to-shoot translocation
OsPHO1,
1
Os01g54390
3 -482/-475, -986/-979, -1187/-1180
Regulate Fe transport by integrating Pi and Zn deficiency signalling.
(Saenchai et al., 2016)
7 Pi sensing and signalling
OsSPX1 Os06g40120
4
-143/-136, -177/-170, -1575/-1568, -2268/-2259
Regulates growth during Pi deficiency
via negative feedback loop.
(Wang et al.,
2009)
Inhibits Pi starvation responses by interacting with
OsPHR2 in a Pi-dependent manner.
(Wang Z et al., 2014)
8 Pi sensing and signalling
OsSPX2 Os02g10780
6
-154/-147, -2049/2042, -2784/-2777, -2815/-2808, -2827/-2820, 2932/-2925
Regulated by OsSPX1. (Wang et al., 2009)
Inhibits Pi starvation responses by
interacting with OsPHR2 in a Pi-dependent manner.
(Wang Z et al., 2014)
9 High-affinity
Pi transporter OsPht1,1
Os03g0562
0
0 None
Uptake and
translocation of Pi under P+ condition.
(Sun et al., 2012)
10 Low-affinity
Pi transporter OsPht1,2
Os03g0564
0
2 -343/-336, -
2937/-2930
Translocation of stored
Pi. (Ai et al., 2009)
11 High-affinity Pi transporter
OsPht1,4 Os04g10750
1 -2948/-2941
Uptake and mobilization of Pi and development of embryo.
(Zhang et al., 2015)
12 High-affinity Pi transporter
OsPht1,6 Os08g45000
1 -107/-100
Uptake and translocation of Pi.
(Ai et al., 2009)
(Zhang et al., 2014)
13 High-affinity Pi transporter
OsPht1,8 Os10g30790
3 -1592/-1585, -1761/-1754, -2846/-2839
Pi homeostasis and critical for growth and development.
(Jia et al., 2011)
Cross-talk between Pi and auxinsignalling.
(Jia et al., 2017)
14 High-affinity Pi transporter
OsPht1,9 Os06g21920
3 -518/-511, -910/-903, -2909/-2902
Uptake of Pi. (Wang X et al., 2014)
15 High-affinity Pi transporter
OsPht1,1
0
Os06g21950
0 None Uptake of Pi.
16 Purple acid phosphatase
OsPAP1
0a
Os01g56880
3 -225/-218, -2050/-2043,
-2202/-2195
Utilization of extracellular organic P.
(Tian et al., 2012)
17 Ferroxidase OsLPR5 Os01g0364
0 0 None
Pi homeostasis and critical for growth and development.
(Ai et al., 2020)
890
Up regulated
No effect
Not reported
Yes
No

28
Table 2. Functionally characterized genes involved in the maintenance of Pi homeostasis in 891
rice. 892
893

Figures
Figure 1
Rice producing (metric tons) (a) top 20 countries (www.worldagriculturalproduction.com/crops/rice.aspx)and (b) top 10 states in India (www.mapso�ndia.com/top-ten/india-crops/rice.html). (c) Available soil Pcontent (high, medium, and low) in top 10 states in India producing rice(www.iiss.nic.in/districtmap.html). Note: The designations employed and the presentation of the material

on this map do not imply the expression of any opinion whatsoever on the part of Research Squareconcerning the legal status of any country, territory, city or area or of its authorities, or concerning thedelimitation of its frontiers or boundaries. This map has been provided by the authors.
Figure 2
Effects of Pi de�ciency on different RSA traits. N22 and NH787 seedlings (4-d-old)were grownhydroponically under P- conditions for 7 d. (a) Roots were spread gently and scanned to reveal thearchitectural details. The primary root tip is indicated by a blue dot. (b-g) Data presented for (b) Primaryroot length (PRL), (c) Total length of the lateral roots (TLLR), (d) Number of seminal roots (NSR), (e) Totallength of seminal roots (TLSR), (f) Total length of adventitious roots (TLAR), and (g) Total root length(TRL).Values (n = 12) are means ± SE and different letters on the histograms indicate that the meansdiffer signi�cantly (P< 0.05). (h) Correlogram of theRSA traits in Pi-deprived N22 and NH787. The scalerepresents Pearson correlation values with bluish and reddish shades indicate positive and negativecorrelation, respectively.

Figure 3
Effects of Pi de�ciency on the growth performance and the agronomic traits. N22 and NH787 seedlings(15-d-old) were grown in a low Pi (P-) potting soil up to maturity. (a-d) Growth performance (a) andphenotype of the root (b), panicle (c), and seed (d) of Pi-deprived N22 and NH787. The photographs (a-d)are representatives of 12 independent biological replicates. (e-l) Data presented for (e) Root biomass, (f)Root length, (g) Vegetative biomass, (h) Number of tillers, (i) Filled spikelets/panicle, (j) Un�lled

spikelets/panicle, (k) 100 grain weight, and (l) Yield. Values (n = 12) are means ± SE and different letterson the histograms indicate that the means differ signi�cantly (P < 0.05).Correlogram of agronomic traitsi.e., Filled spikelets/panicle (FSP), Number of tillers (NT), Root biomass (RB), Root length (RL), Vegetativebiomass (VB), and Un�lled spikelets/panicle (USP) in Pi-deprived N22 and NH787. The scale representsPearson correlation values with bluish and reddish shades indicate positive and negative correlation,respectively.
Figure 4
Effects of Pi de�ciency on the photosynthetic and �uorescence traits in N22 and NH787. (a-k) Data arepresented for (a) Photosynthetic rate (PN), (b) Stomatal conductance (gs), (c) Intercellular CO2concentration (Ci), (d) Transpiration rate (E), (e) Maximum e�ciency of PSII photochemistry (Fv/Fm), (f)Electron transport rate (ETR), (g) Coe�cient of photochemical quenching (qP), (h) Coe�cient of non-photochemical quenching (qN), and contents of (i) Chlorophyll a, (j) Chlorophyll b, and (k) carotenoid.Values (n = 12) are means ± SE and different letters on the histograms indicate that the means differsigni�cantly (P < 0.05).

Figure 5
Effects of Pi de�ciency on the concentrations of Pi, Apase, and the enzymes involved in ROS scavenging.N22 and NH787 were grown hydroponically for 7d and in a potting soil up to 50% �owering under P+ andP- conditions. (a-g) Data are presented for the concentrations of (a) Pi, (b) Apase, (c) SOD, (d) H2O2, (e)POD, (f) APX, and (g) CAT. Values (n=12) aremeans ± SE and different letters on the histograms indicatethat the means differ signi�cantly (P< 0.05).Hp, Hydroponics; Ps, Potting soil.

Figure 6
Effects of Pi de�ciency on pollen viability and antioxidant enzyme activities in the anther. N22 andNH787 were grown in a potting soil up to 50% �owering under P+ and P- conditions. (a-d) Pollen viabilitywas assayed by staining with I2-KI and the images were captured with a stereomicroscope. The data arepresented for (e) Per cent pollen viability and (f-i) the ROS scavenging enzyme activities in the anthers of(f) SOD, (g) POD, (h) APX, and (i) CAT. Values (n= 6) aremeans ± SE and different letters on thehistograms indicate that the means differ signi�cantly (P< 0.05).
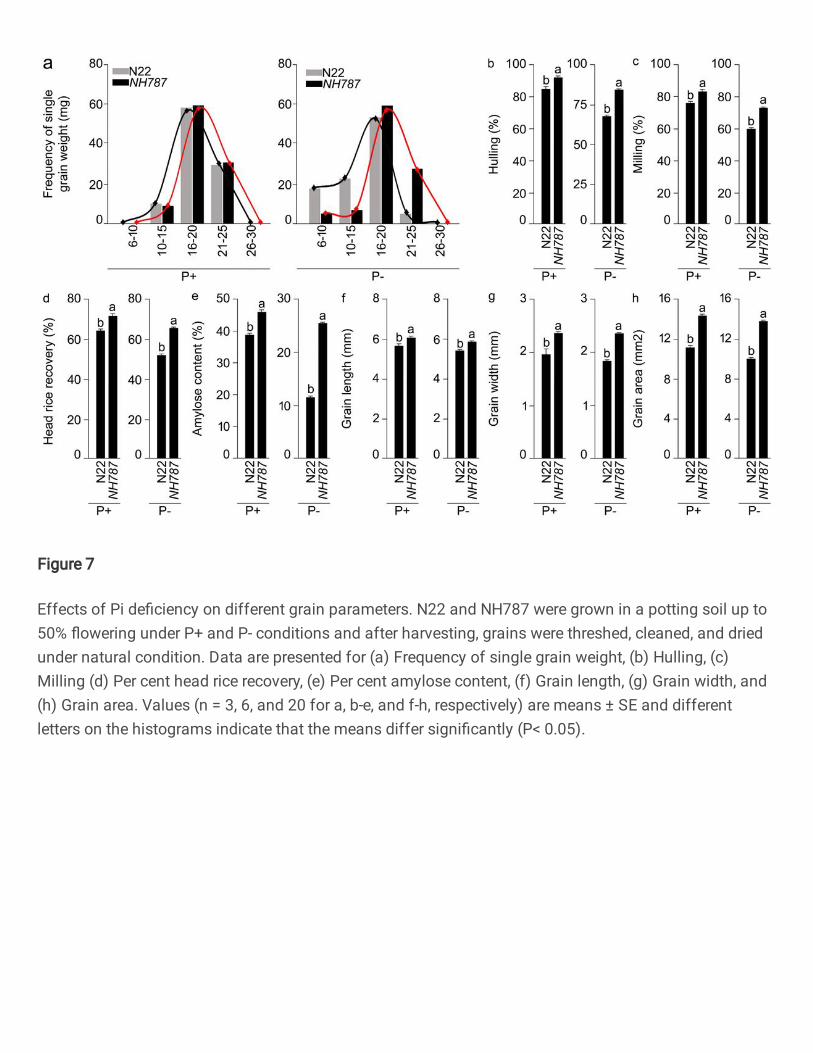
Figure 7
Effects of Pi de�ciency on different grain parameters. N22 and NH787 were grown in a potting soil up to50% �owering under P+ and P- conditions and after harvesting, grains were threshed, cleaned, and driedunder natural condition. Data are presented for (a) Frequency of single grain weight, (b) Hulling, (c)Milling (d) Per cent head rice recovery, (e) Per cent amylose content, (f) Grain length, (g) Grain width, and(h) Grain area. Values (n = 3, 6, and 20 for a, b-e, and f-h, respectively) are means ± SE and differentletters on the histograms indicate that the means differ signi�cantly (P< 0.05).

Figure 8
Correlogram of the agronomical and quality traits, pollen fertility, and the activities of antioxidantenzymes and α-amylase in the anther and spikelets, respectively in N22 and NH787grown in a potting soilup to 50% �owering under P+ and P- conditions. The scale represents Pearson correlation values withbrownish and bluish shades indicate positive and negative correlation, respectively. TN = Tiller number,PF = pollen fertility, GA = Grain area, GW = grain width, GL = Grain length, AA = α-amylase, AC = amylosecontent, HRR = Head 865 rice recovery.

Figure 9
Relative expression levels of GPH in Pi-deprived roots of N22 and NH787.N22 and NH787 were grown inpotting soil under P+ and P- conditions up to 50% �owering stage and their roots were harvested.Quantitative real-time RT-PCR (qRT-PCR) was employed for determining the relative expression levels ofMPH genes.(a) MPH genes induced in NH787(green bars)compared with N22 (black bars). (b) MPHgenes suppressed in NH787(red bars)compared with N22 (black bars).OsActin(LOC_Os03g50885)wasused as an internal control. Values are means ± SE (n=6) and different letters on the histograms indicatethat the values differ signi�cantly(P< 0.05).
Supplementary Files
This is a list of supplementary �les associated with this preprint. Click to download.
SupplementaryInfoFile.docx