GADOON Half year - Gadoon Textile Mills Limited...
26
Transcript of GADOON Half year - Gadoon Textile Mills Limited...

01
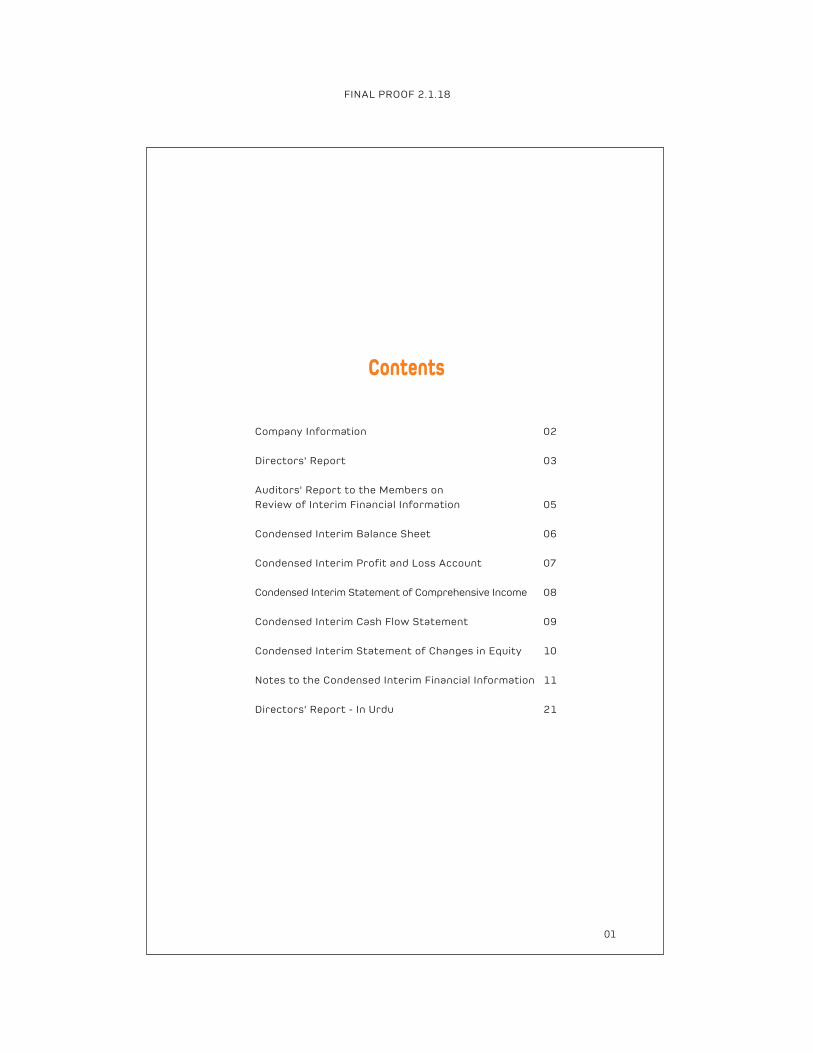
Company Information 02
Directors' Report 03
Auditors' Report to the Members on
Review of Interim Financial Information 05
Condensed Interim Balance Sheet 06
Condensed Interim Profit and Loss Account 07
Condensed Interim Statement of Comprehensive Income 08
Condensed Interim Cash Flow Statement 09
Condensed Interim Statement of Changes in Equity 10
Notes to the Condensed Interim Financial Information 11
Directors' Report - In Urdu 21
Contents
FINAL PROOF 2.1.18

02
Company Information
Board of Directors Mr. Muhammad Yunus Tabba (Chairman)Mr. Muhammad Sohail Tabba (Chief Executive)Mr. Muhammad Ali TabbaMr. Imran YunusMr. Jawed Yunus TabbaMrs. Mariam Tabba KhanMrs. Zulekha Tabba MaskatiyaMr. Saleem Zamindar (Independent Director)
Audit Committee Mr. Saleem Zamindar (Chairman)Mr. Muhammad Ali TabbaMr. Jawed Yunus TabbaMrs. Zulekha Tabba Maskatiya
HR and Remuneration Mr. Jawed Yunus Tabba (Chairman)Committee Mrs. Mariam Tabba Khan
Mrs. Zulekha Tabba Maskatiya
Executive Directorand Company Secretary Mr. Abdul Sattar Abdullah
Chief Financial Officer Mr. Muhammad Imran Moten
Auditors Deloitte Yousuf AdilChartered AccountantsA Member of Deloitte Touche Tohmatsu
Chief Internal Auditor Mr. Haji Muhammad Mundia
Registered Office 200-201, Gadoon Amazai Industrial Estate,Distt. Swabi, Khyber PakhtunkhwaPhone: 093-8270212-3Fax: 093-8270311Email: [email protected]
Karachi Office 7-A, Muhammad Ali Housing Society,Abdul Aziz Haji Hashim Tabba Street,Karachi-75350.Phone No: 021-35205479-80Fax No: 021-34382436
Liaison Office Syed�s Tower, Third Floor, Opp. Custom House,Jamrud Road, Peshawar.Phone No: 091-5701496Fax No: 091-5702029E-mail: [email protected]
Factory Locations 200-201, Gadoon Amazai Industrial Estate,Distt. Swabi, Khyber Pakhtunkhwa.
57 K.M. on Super Highway, Karachi.
Share Registrar / Transfer Central Depository Company of Pakistan LimitedAgent CDC House, 99-B, Block B, S.M.C.H.S.,
Main Shahrah-e-Faisal, Karachi.(Toll Free): 0800 23275
Bankers
Allied Bank Limited
Askari Bank Limited
Bank Al-Falah Limited
Bank Al-Habib Limited
Bank Islami Pakistan Limited
Dubai Islamic Bank Pakistan Limited
Faysal Bank Limited
Habib Bank Limited
Habib Metropolitan Bank Limited
Meezan Bank Limited
National Bank of Pakistan
MCB Bank Limited (formerly NIB Bank Limited)
Soneri Bank Limited
Standard Chartered Bank Pakistan Limited
The Bank of Punjab
United Bank Limited
FINAL PROOF 2.1.18
03
Dear Members
The Directors of your Company take pleasure in presenting before you the performancereview and the un-audited financial statements for the half year ended December 31, 2017.
Overview
During the period under review, your Company recorded turnover of Rs. 13 billion againstRs. 11.7 billion for the Same Period Last Year (SPLY); an increase of approx. Rs. 1.3 billion(11%) for SPLY. The export package announced by the government last year has also beenextended to this year by softening condition of 10% increase in export. The extended exportpackage along with devaluation of rupee has somehow supported to the ailing textile sector,which is evident from an increase of 25% from SPLY. However, profit margins are still notvery attractive on account of regional competition.
The Company, capitalizing on its reputation built over the years in the local market hasresulted in an increase of Rs. 363 million in local sales to Rs. 8.45 billion against Rs. 8.09billion in SPLY, which is 4% higher when compared with SPLY.
Despite political instabilities, abrupt devaluation of currency and current account deficit inaddition to fierce competition with regional competitors, consistent efforts of yourmanagement has managed to get the bottom line of Rs. 404 million as compared to of Rs.367 million SPLY.
Economic Prospects
Overall economic position of the country has remained stable. There have been some politicalinstabilities, which was compensated by other factors, not limited to CPEC gaining globalrecognition and reduction in power crisis of the country.
Although cotton production has increased in comparison to last year but it still couldn't meetthe target set by the government, due to which industry has to shift towards import ofcotton in current financial year. This has not only affected current account of the countrybut has also made finished products costlier than our regional competitors. On overall basis,current account deficit is up by 21% in Rupee term and 19% in dollar term.
The implementation of ECC decision regarding withdrawal of Sales tax and Custom duty onimported cotton may support in reducing cost of production which was increased by abruptchange in exchange rate.
Financial Performance
As evident from the financial results stated,the Company has managed to compete in thishalf year by posting a positive bottom line.
Directors' Report
FINAL PROOF 2.1.18
Profit and Loss Summary
(Rupees in �000)
December 31,2017
December 31,2016
Percentage
Favorable /(Unfavorable)
3,585,410)
8,094,880)
11,680,290)
686,023)
(126,727)
(95,849)
(172,389)
206,508)
461,310)
366,870)
13.09)
4,482,427
8,457,641
12,940,068
797,849
(184,817
(107,095
(250,356
325,814
508,083
404,346
14.43
Export
Local
Sales (net)
Gross Profit
Distribution cost
Administrative expenses
Finance cost
Other income
Profit before taxation
Profit after taxation
Earnings per share (Rs.)
25.02
4.48
10.79
16.30
(45.84)
(11.73)
(45.23)
57.77
10.14
10.22
)
)
)
As evident from above, the Export sales have shown an upward trend from SPLY mainly onaccount of support from the Export package announced by the Government in January 2017which was further extended to financial year 2018 in August 2017 with relax conditions anddevaluation of Pak rupee. The product cost in the current period has increased as cost ofinventory procured has not been compensated with the prevailing selling prices due to

04
regional as well as local competition. Resultantly, gross profit margins have remain stagnantwhen compared with last period.
There has been a sharp increase in Distribution cost mainly due to increased freight onaccount of increased export of Yarn and Knitted fabrics. The increase in administrative costis due to inflation and other factors beyond management control. After the political instabilitywhich resulted in abrupt devaluation during the period, the Company's management, keepingin view the risk management and cost benefit analysis, has disposed-off its foreign currencyexposure by converting the same to local borrowing, which resulted in an increase of 45%in its Finance cost. Although, the management has still managed to maintain efficient portfolioof funds by reaping maximum benefits of lower benchmark rates prevalent in the countryalong-with minimum spreads.
The returns from the company's strategic decision to invest in diversified avenues is supportingenterprise value of the Company which is evident from a material increase of Rs. 121 millionin other income to Rs. 232 million against Rs. 111 million SPLY. Further more, with the revisedexport package, rebate income to be received under the referred package has increasedother Income by Rs. 88 million.
Operational Performance
The production and sales statistics for the half year ended December 31, 2017 and itscomparison with SPLY is presented below:
It is evident from above that there has been an increase of 3% in production because of wellplanned production mix, furthermore, local sales and export sales quantities have beenincreased by 5% and 6% respectively.
Future Outlook
We believe that the announcement of revised export package by the government, relaxingthe conditional subsidy will surely create business opportunities for the ailing textile sector,which has the largest share of export of the country, this in result will be a great supportto the economy as a whole. The management is also working actively to procure mosteconomical raw material available to meet its production target maintaining quality parametersto keep the bottom line positive.
Furthermore, keeping in view the latest technologies, Company management is also planningto replace old technology machineries with new technology to become more effective andefficient, and be able to compete with its regional competitors.
Keeping in view the results achieved by investing in diversified portfolios, the board hasalready notified its approval for investment in 2 wind power projects and is now pleased toannounce its approval for solar power project. All such investment decisions will be placedfor shareholders' approval.
Acknowledgements
The Directors record their appreciation of the performance of the Company's workers, staffand executives.
FINAL PROOF 2.1.18
Karachi: January 29, 2018
For and on behalf of the Board
MUHAMMAD SOHAIL TABBAChief Executive Officer
MUHAMMAD YUNUS TABBAChairman / Director
28,007
December-2017
Sales
December-2017
Production
December-2016
Sales
December-2016
ProductionQu
an
tity
in K
Gs
(�0
00
)
45,000
30,000
-
Export Sales
Local Sales
40,25726,618 39,153
12,960
15,000
12,216
05
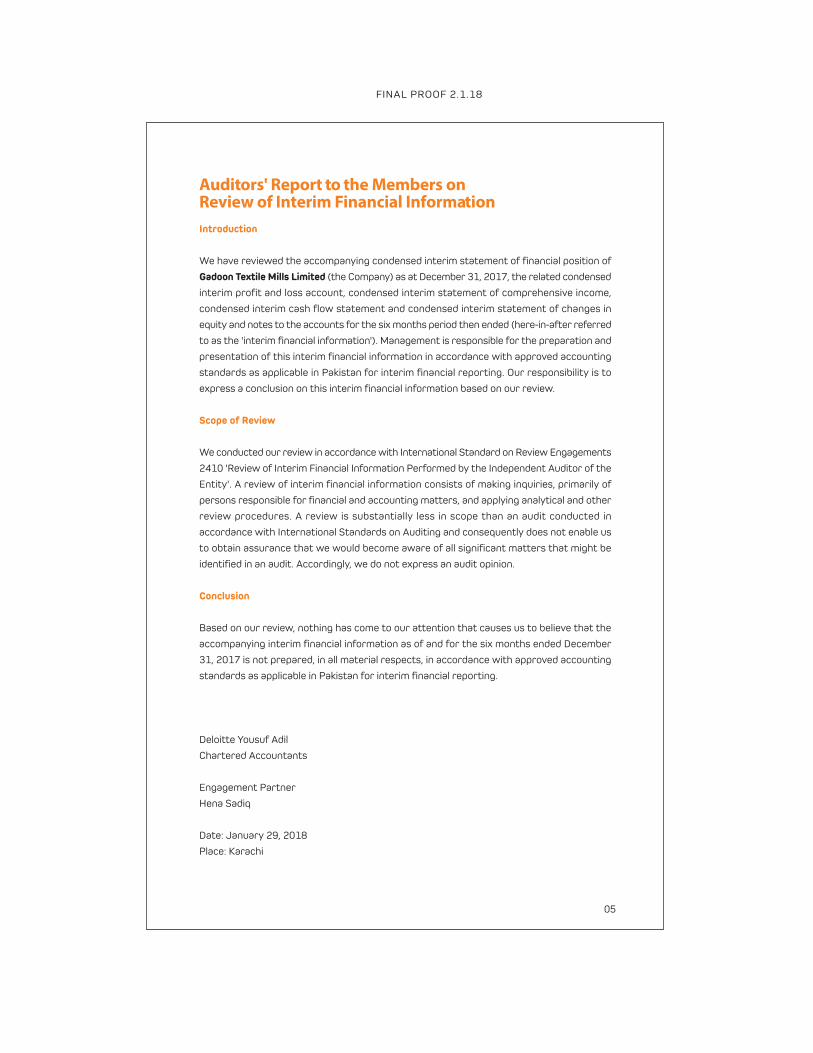
Auditors' Report to the Members onReview of Interim Financial Information
Introduction
We have reviewed the accompanying condensed interim statement of financial position of
Gadoon Textile Mills Limited (the Company) as at December 31, 2017, the related condensed
interim profit and loss account, condensed interim statement of comprehensive income,
condensed interim cash flow statement and condensed interim statement of changes in
equity and notes to the accounts for the six months period then ended (here-in-after referred
to as the 'interim financial information'). Management is responsible for the preparation and
presentation of this interim financial information in accordance with approved accounting
standards as applicable in Pakistan for interim financial reporting. Our responsibility is to
express a conclusion on this interim financial information based on our review.
Scope of Review
We conducted our review in accordance with International Standard on Review Engagements
2410 'Review of Interim Financial Information Performed by the Independent Auditor of the
Entity'. A review of interim financial information consists of making inquiries, primarily of
persons responsible for financial and accounting matters, and applying analytical and other
review procedures. A review is substantially less in scope than an audit conducted in
accordance with International Standards on Auditing and consequently does not enable us
to obtain assurance that we would become aware of all significant matters that might be
identified in an audit. Accordingly, we do not express an audit opinion.
Conclusion
Based on our review, nothing has come to our attention that causes us to believe that the
accompanying interim financial information as of and for the six months ended December
31, 2017 is not prepared, in all material respects, in accordance with approved accounting
standards as applicable in Pakistan for interim financial reporting.
Deloitte Yousuf Adil
Chartered Accountants
Engagement Partner
Hena Sadiq
Date: January 29, 2018
Place: Karachi
FINAL PROOF 2.1.18

06
ASSETS
Non-current AssetsProperty, plant and equipment 5 7,698,549 7,447,694Long-term advance 6 - -Long-term loans 11,725 9,723Long-term deposits 27,704 27,704Long-term investments 7 2,507,203 2,472,715
10,245,181 9,957,836Current AssetsStores, spares and loose tools 517,428 491,790Stock-in-trade 8 4,994,737 5,700,578Trade debts 2,282,284 1,750,769Loans and advances 628,148 732,810Trade deposits and short-term prepayments 28,754 17,679Other receivables 741,002 928,097Income tax refundable 478,535 514,535Cash and bank balances 208,442 163,926
9,879,330 10,300,184
Total Assets 20,124,511 20,258,020
EQUITY AND LIABILITIES
Share Capital and Reserves
Authorized57,500,000 ordinary shares of Rs. 10/- each 575,000 575,000
Issued, subscribed and paid-up capital 280,296 280,296Capital reserves 137,541 137,541Revenue reserves 7,023,884 6,948,886
Total Equity 7,441,721 7,366,723
Non-Current LiabilitiesLong-term finance 467,165 -Deferred liabilities 1,163,286 1,114,696
Current LiabilitiesTrade and other payables 2,913,171 2,794,771Accrued mark-up 111,071 87,667Short-term borrowings 9 7,915,028 8,635,992Provision for taxation 113,069 258,171
11,052,339 11,776,601
Total Liabilities 12,682,790 12,891,297
TOTAL EQUITY AND LIABILITIES 20,124,511 20,258,020
CONTINGENCIES AND COMMITMENTS 10
The annexed notes 1 to 17 form an integral part of these condensed interim financialinformation.
Condensed Interim Balance SheetAs at December 31, 2017
Note
(Rupees in �000)
June 30,2017
(Audited)
December 31,2017
(Un-audited)
MUHAMMAD SOHAIL TABBAChief Executive Officer
MUHAMMAD IMRAN MOTENChief Financial Officer
MUHAMMAD YUNUS TABBAChairman / Director
FINAL PROOF 2.1.18
07
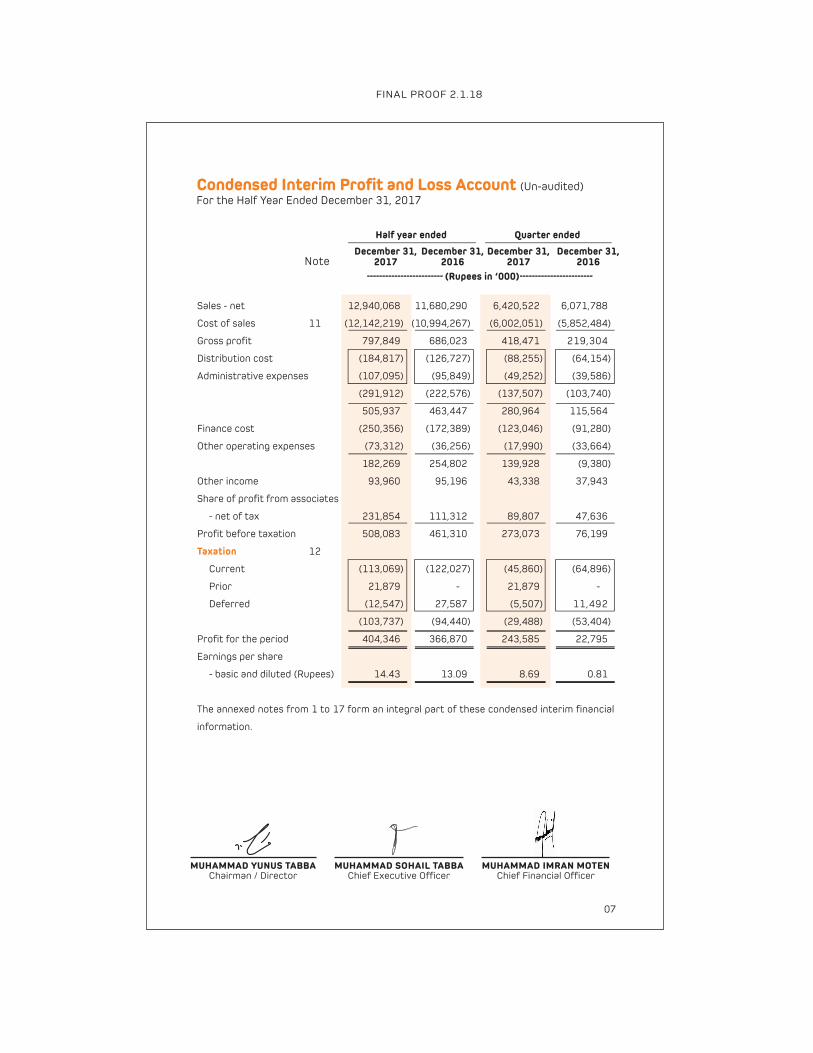
Condensed Interim Profit and Loss Account (Un-audited)
For the Half Year Ended December 31, 2017
MUHAMMAD SOHAIL TABBAChief Executive Officer
MUHAMMAD IMRAN MOTENChief Financial Officer
MUHAMMAD YUNUS TABBAChairman / Director
(Rupees in �000)
Half year ended
December 31,2017
December 31,2016
December 31,2017
December 31,2016
Quarter ended
Note
Sales - net 12,940,068 11,680,290 6,420,522 6,071,788
Cost of sales 11 (12,142,219) (10,994,267) (6,002,051) (5,852,484)
Gross profit 797,849 686,023 418,471 219,304
Distribution cost (184,817) (126,727) (88,255) (64,154)
Administrative expenses (107,095) (95,849) (49,252) (39,586)
(291,912) (222,576) (137,507) (103,740)
505,937 463,447 280,964 115,564
Finance cost (250,356) (172,389) (123,046) (91,280)
Other operating expenses (73,312) (36,256) (17,990) (33,664)
182,269 254,802 139,928 (9,380)
Other income 93,960 95,196 43,338 37,943
Share of profit from associates
- net of tax 231,854 111,312 89,807 47,636
Profit before taxation 508,083 461,310 273,073 76,199
Taxation 12
Current (113,069) (122,027) (45,860) (64,896)
Prior 21,879 - 21,879 -
Deferred (12,547) 27,587 (5,507) 11,492
(103,737) (94,440) (29,488) (53,404)
Profit for the period 404,346 366,870 243,585 22,795
Earnings per share
- basic and diluted (Rupees) 14.43 13.09 8.69 0.81
The annexed notes from 1 to 17 form an integral part of these condensed interim financial
information.
FINAL PROOF 2.1.18
08
MUHAMMAD SOHAIL TABBAChief Executive Officer
MUHAMMAD IMRAN MOTENChief Financial Officer
MUHAMMAD YUNUS TABBAChairman / Director
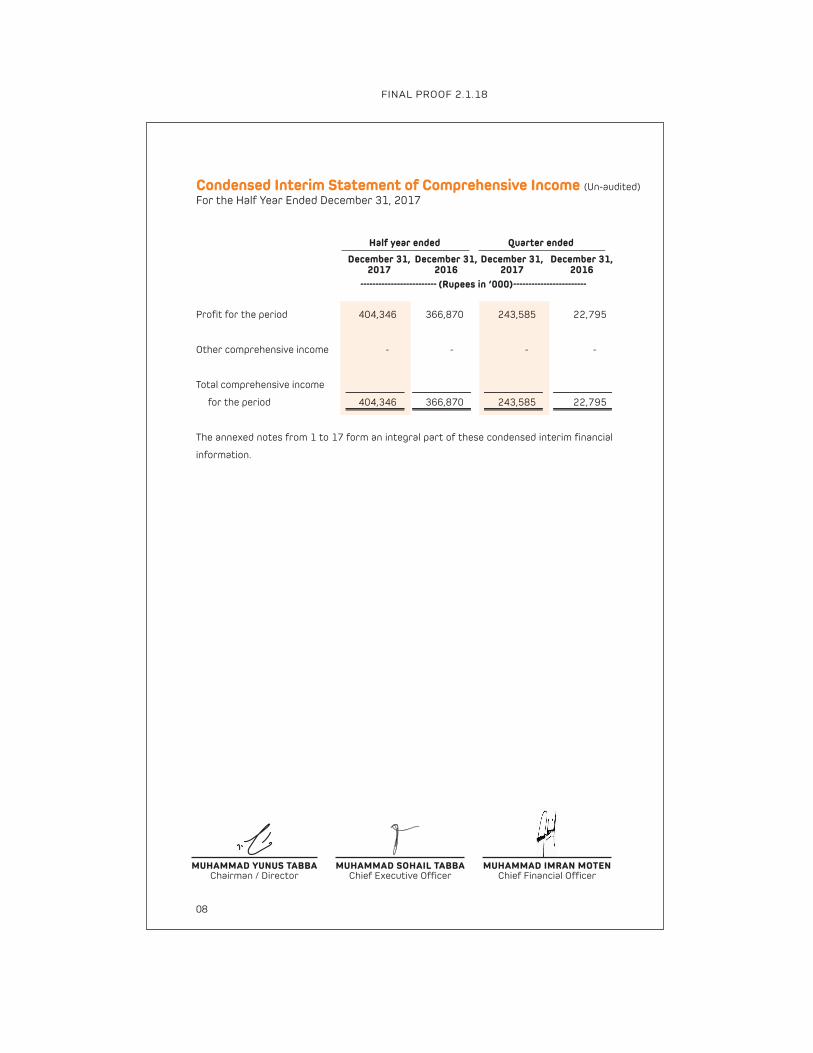
Condensed Interim Statement of Comprehensive Income (Un-audited)
For the Half Year Ended December 31, 2017
(Rupees in �000)
Half year ended
December 31,2017
December 31,2016
December 31,2017
December 31,2016
Quarter ended
Profit for the period 404,346 366,870 243,585 22,795
Other comprehensive income - - - -
Total comprehensive income
for the period 404,346 366,870 243,585 22,795
The annexed notes from 1 to 17 form an integral part of these condensed interim financial
information.
FINAL PROOF 2.1.18

09
Condensed Interim Cash Flow Statement (Un-audited)
For the Half Year Ended December 31, 2017
A. CASH FLOWS FROM OPERATING ACTIVITIES
Cash generated from operations 13 1,441,257 1,986,107
Finance cost paid (226,952) (159,731)
Rebate received 34,690 -
Income tax (paid) / received (25,985) 17,640
Gratuity paid (53,968) (75,077)
(272,215) (217,168)
Net cash generated from operating activities 1,169,042 1,768,939
B. CASH FLOWS FROM INVESTING ACTIVITIES
Purchase of property, plant and equipment (617,927) (73,271)
Sale proceeds from disposal of property,
plant and equipment 9,511 14,809
Long-term loans paid to recovered from employees (2,002) (1,109)
Long-term deposits paid - (2,644)
Sale proceeds from disposal of short term investment - 115,525
Profit received from bank deposits 823 851
Dividend received 59,809 56,242
Net cash (used in) / generated from investing activities (549,786) 110,403
C. CASH FLOWS FROM FINANCING ACTIVITIES
Long-term finance obtained 467,165 -
Dividend paid (320,941) (20)
Net cash generated from / (used in) financing activities 146,224 (20)
Net increase / (decrease) in cash and cash
equivalents (A+B+C) 765,480 1,879,322
Cash and cash equivalents at beginning of the period (8,472,066) (9,166,314)
Cash and cash equivalents at end of the period (7,706,586) (7,286,992)
CASH & CASH EQUIVALENTS
Cash and bank balances 208,442 659,134
Short-term borrowings (7,915,028) (7,946,126)
(7,706,586) (7,286,992)
The annexed notes 1 to 17 form an integral part of these condensed interim financialinfomation.
Half year ended
December 31,2016
December 31,2017
(Rupees in �000)
MUHAMMAD SOHAIL TABBAChief Executive Officer
MUHAMMAD IMRAN MOTENChief Financial Officer
MUHAMMAD YUNUS TABBAChairman / Director
FINAL PROOF 2.1.18
Note

10
Condensed Interim Statement of Changes in Equity (Un-audited)
For the Half Year Ended December 31, 2017
Share
premium
General
Reserve
Unappro-
priated
profit
Sub
total
Grand
total
- - - - - - - - - - - - - - - - - - - - - - - - - - - - - - - - ( R u p e e s i n � 0 0 0 ) - - - - - - - - - - - - - - - - - - - - - - - - - -
- - -Capita l Reser ves-- -
Amalga-
mation
reserve
- - - - - Revenue Reser ves - - - - -
Issued,
subscribed and
paid-up share
capital
Sub
total
Amalga-
mation
reserve
Balance as at July 1, 2016 280,296 103,125 34,416 137,541 1,000,000 727,333 4,388,435 6,115,768 6,533,605
Total comprehensive income for the period
Profit for the period - - - - - - 366,870 366,870 366,870
Other comprehensive income - - - - - - - - -
Total comprehensive income for the period - - - - - - 366,870 366,870 366,870
Balance as at December 31, 2016 280,296 103,125 34,416 137,541 1,000,000 727,333 4,755,305 6,482,638 6,900,475
Total comprehensive income for the period
Profit for the period - - - - - - 440,116 440,116 440,116
Other comprehensive income - - - - - - 26,132 26,132 26,132
Total comprehensive income for the period - - - - - - 466,248 466,248 466,248
Balance as at June 30, 2017 280,296 103,125 34,416 137,541 1,000,000 727,333 5,221,553 6,948,886 7,366,723
Transaction with owners
Final dividend @ Rs. 5/- per share for the
year ended June 30, 2017 - - - - - - (140,148) (140,148) (140,148)
Interim dividend @ Rs. 6.75 per share - - - - - - (189,200) (189,200) (189,200)
- - - - - - (329,348) (329,348) (329,348)
Total comprehensive income for the period
Profit for the period - - - - - - 404,346 404,346 404,346
Other comprehensive income - - - - - - - - -
Total comprehensive income for the period - - - - - - 404,346 404,346 404,346
Balance as at December 31, 2017 280,296 103,125 34,416 137,541 1,000,000 727,333 5,296,551 7,023,884 7,441,721
The annexed notes from 1 to 17 form an integral part of these condensed interim financialinformation.
MUHAMMAD SOHAIL TABBAChief Executive Officer
MUHAMMAD IMRAN MOTENChief Financial Officer
MUHAMMAD YUNUS TABBAChairman / Director
FINAL PROOF 2.1.18

11
1. THE COMPANY AND ITS OPERATIONS
1.1 Gadoon Textile Mills Limited (the Company) was incorporated in Pakistan onFebruary 23, 1988 as a public limited company under the Companies Ordinance,1984 and is listed on Pakistan Stock Exchange. The manufacturing facilities ofthe Company are located at Gadoon Amazai Industrial Estate KhyberPakhtunkhwa and 57 km on Super Highway (near Karachi). The principal activityof the Company is manufacturing and sale of yarn and knitted fabrics. Y.B.Holdings (Private) Limited is the holding company.
2. BASIS OF PREPARATION
2.1 This condensed interim financial information of the Company for the half yearended December 31, 2017 has been prepared in accordance with therequirements of the International Accounting Standard 34 - Interim FinancialReporting and provisions of and directives issued under the CompaniesOrdinance, 1984. In case where requirements differ, the provisions of ordirectives issued under the Companies Ordinance, 1984 have been followed.This condensed interim financial information does not include all the informationrequired for the full financial statements and therefore should be read inconjunction with the annual financial statements of the Company for the yearended June 30, 2017.
In 2017, the Companies Act, 2017 (the new Companies Act) was enacted andpromulgated by the SECP on May 30, 2017. An exemption was granted tocompanies whose financial year ended on or before June 30, 2017 via CircularNo. 17 of July 20, 2017. No further exemption has been provided and theCompany is currently in process of determining impact, if any, on annual financialstatements due to implementation of the Act. There is no impact on thiscondensed interim financial information as they have been prepared primarilyunder IAS 34 as stated above.
2.2 This condensed interim financial information is presented in Pak Rupees whichis also the Company's functional currency and figures presented in this condensedinterim financial information has been rounded off to the nearest thousandrupee.
2.3 This condensed interim financial information is unaudited. However, a limitedscope review of this condensed interim financial information has been performedby the external auditors of the Company in accordance with the requirementsof clause (26) of Listed Companies (Code of Corporate Governance) Regulations,2017. This condensed interim financial information is being submitted to theshareholders as required by section 237 of the Companies Act 2017.
2.4 The comparative statement of financial position presented has been extractedfrom annual financial statements for the year ended June 30, 2017; thecomparative condensed profit and loss account, condensed interim statementof other comprehensive income, condensed interim cash flow statement andcondensed interim statement of changes in equity of the Company have beenextracted from the unaudited condensed interim financial information for thesix months period ended December 31, 2016.
Notes to the Condensed Interim Financial Information (Un-audited)
For the Half Year Ended December 31, 2017
FINAL PROOF 2.1.18
12
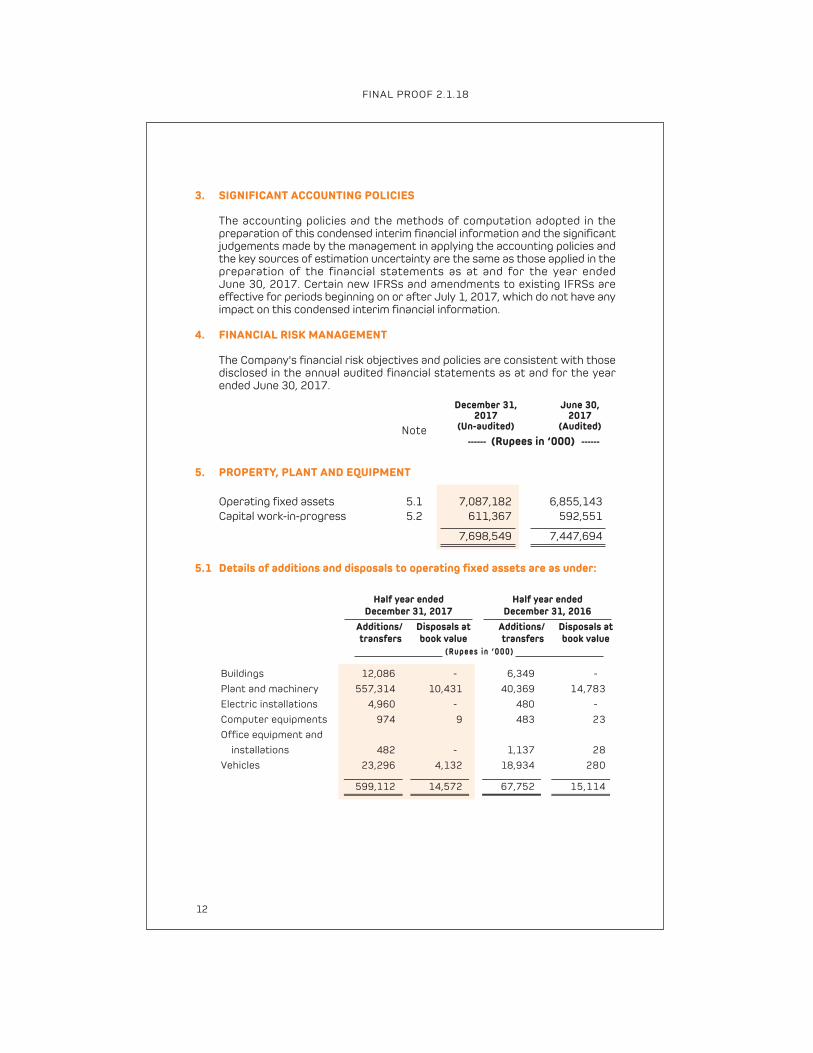
3. SIGNIFICANT ACCOUNTING POLICIES
The accounting policies and the methods of computation adopted in thepreparation of this condensed interim financial information and the significantjudgements made by the management in applying the accounting policies andthe key sources of estimation uncertainty are the same as those applied in thepreparation of the financial statements as at and for the year endedJune 30, 2017. Certain new IFRSs and amendments to existing IFRSs areeffective for periods beginning on or after July 1, 2017, which do not have anyimpact on this condensed interim financial information.
4. FINANCIAL RISK MANAGEMENT
The Company's financial risk objectives and policies are consistent with thosedisclosed in the annual audited financial statements as at and for the yearended June 30, 2017.
FINAL PROOF 2.1.18
5.1 Details of additions and disposals to operating fixed assets are as under:
(Rupees in �000)
Additions/ transfers
Disposals atbook value
Additions/ transfers
Disposals atbook value
Half year endedDecember 31, 2016
Half year endedDecember 31, 2017
Buildings 12,086 - 6,349 -
Plant and machinery 557,314 10,431 40,369 14,783
Electric installations 4,960 - 480 -
Computer equipments 974 9 483 23
Office equipment and
installations 482 - 1,137 28
Vehicles 23,296 4,132 18,934 280
599,112 14,572 67,752 15,114
Note(Rupees in �000)
December 31,2017
(Un-audited)
June 30,2017
(Audited)
5. PROPERTY, PLANT AND EQUIPMENT
Operating fixed assets 5.1 7,087,182 6,855,143
Capital work-in-progress 5.2 611,367 592,551
7,698,549 7,447,694
13
6. LONG - TERM ADVANCE
- Considered doubtful
Investment in a joint venture - Advance 6.1 66,667 66,667
Less: Provision against advance (66,667) (66,667)
- -
6.1 This represents first and second tranche of advance for a Joint Venture project
amounting to Rs. 4,250 million. The principal activity of theJoint Venture Project
was acquisition and development of a real estate project in Karachi through a
Joint Venture Company. The Company's share in this Joint Venture project is
ten percent. Currently, the future of this project is not certain and the recovery
of this amount is considered doubtful.
7. LONG - TERM INVESTMENTS
Investments in associated undertakings
ICI Pakistan Limited 1,617,767 1,571,147
Lucky Holdings Limited 174,581 164,843
Yunus Energy Limited 714,855 736,725
2,507,203 2,472,715
5.2 Details of additions and transfers from capital work-in-progress are as under:
FINAL PROOF 2.1.18
December 31,2017
(Un-audited)
June 30,2017
(Audited)
(Rupees in �000)
Note
Gadoon Amazai
Plant and machinery 531,250 227,590 9,152 9,152
Civil works 5,253 5,253 - -
Electric installations 1,134 1,134 - -
Advance to Supplier 12,276 15,952 23,221 16,176
Mark up capitalized 3,051 1,267 - -
Karachi Project
Plant and machinery 11,052 324,822 31,217 31,217
Civil works 39,062 6,833 - -
Electric installations 3,826 3,826 480 480
Advance to Supplier 7,158 7,344 3,642 6,349
Mark up capitalized 2,407 3,635 3,530 2,348
616,469 597,656 71,242 65,722
Half year endedDecember 31, 2016
Half year endedDecember 31, 2017
- - - - - - - - - - - - - - - - - - - - - - - - - - - - - (Rupees in �000) - - - - - - - - - - - - - - - - - - - - - - - - - - -
Additions Transfers Additions Transfers
December 31,2017
(Un-audited)
June 30,2017
(Audited)
(Rupees in �000)
Note

14
8. STOCK-IN-TRADE
Raw material in
- hand 3,097,047 3,436,226
- transit 636,586 721,359
3,733,633 4,157,585
Work-in-process 283,117 262,525
Finished goods
- Yarn 902,861 1,150,054
- Knitted fabric 34,306 24,783
- Waste at net realisable value 40,820 105,631
977,987 1,280,468
4,994,737 5,700,578
9. SHORT-TERM BORROWINGS
Banking companies - secured
Running finance 9.1 4,042,517 677,014
Short term finance 3,000,000 1,500,000
Foreign currency loan against:
- Import finance 448,413 6,002,310
- Export finance 424,098 456,668
872,511 6,458,978
7,915,028 8,635,992
9.1 Facilities for running finance, import finance, export refinance and short term
finance are available from various banks upto Rs. 27.78 billion (June 30, 2017:
Rs. 24.78 billion). The terms and conditions of the short-term borrowings
including markup rates and securities have not materially changed from
June 30, 2017.
10. CONTINGENCIES AND COMMITMENTS
10.1 Contingencies
10.1.1 As at period end, bank guarantees given in favour of the Company by banks
in normal course of business amounting to Rs. 949.04 million
(June 30, 2017: Rs. 949.04 million).
Other contingencies are same as disclosed in notes 21.1.2 to 21.1.9 to the
annual financial statements for the year ended June 30, 2017.
December 31,2017
(Un-audited)
June 30,2017
(Audited)
(Rupees in �000)
FINAL PROOF 2.1.18
Note

15
10.1.2 Others
Export bills discounted with recourse 1,450,296 1,540,624
Indemnity bond in favor of Collector
of Customs against imports 4,105 4,105
Post-dated cheques in favor of Collector
of Customs against imports 596,598 684,890
10.2 Commitments
Letters of credit opened by banks for:
Plant and machinery 134,865 -
Raw materials 4,731,504 477,625
Stores and spares 54,773 28,035
Foreign currency forward contracts - 9,315
Further, the Company has outstanding contractual commitment under
sponsors support agreement, for debt servicing of two loan installments upto
Rs. 338 million on behalf of Yunus Energy Limited, an associated undertaking.
December 31,2017
(Un-audited)
June 30,2017
(Audited)
(Rupees in �000)
(Rupees in �000)
Half year ended
December 31,2017
December 31,2016
December 31,2017
December 31,2016
Quarter ended
Note
FINAL PROOF 2.1.18
11. COST OF SALES
Opening stock
- finished goods 1,280,468 641,035 924,031 1,080,985
Cost of goods
manufactured 11.1 11,839,738 11,160,035 6,056,007 5,578,302
13,120,206 11,801,070 6,980,038 6,659,287
Closing stock
- finished goods (977,987) (806,803) (977,987) (806,803)
12,142,219 10,994,267 6,002,051 5,852,484

16
12. TAXATION
There have been no change in the tax contingencies as disclosed in note number
21.1.5, 21.1.6, 21.1.8 and 21.1.9 to the annual audited financial statements for
the year ended June 30, 2017.
FINAL PROOF 2.1.18
(Rupees in �000)
Half year ended
December 31,2017
December 31,2016
December 31,2017
December 31,2016
Quarter ended
11.1 Cost of goods manufactured
Opening stock
- work in process 262,525 250,971 349,253 216,100
Raw and packing material
consumed 8,379,993 7,683,736 4,218,849 3,891,044
Other manufacturing
expenses 3,480,337 3,437,510 1,771,022 1,683,340
11,860,330 11,121,246 5,989,871 5,574,384
12,122,855 11,372,217 6,339,124 5,790,484
Closing stock
- work in process (283,117) (212,182) (283,117) (212,182)
11,839,738 11,160,035 6,056,007 5,578,302
13. CASH GENERATED FROM OPERATIONS
Profit before taxation 508,083 461,310
Adjustments for:
Depreciation 352,502 369,825
Loss on disposal of property, plant and equipment 5,059 300
Finance cost 250,356 172,389
Share of profit from associates - net of tax (231,854) (111,312)
Realised gain on short-term investment - (87,498)
Rebate on export sales (88,468) -
Profit on deposits (800) (913)
Dividend income - (2,415)
Provision for gratuity 90,011 79,900
Working capital changes 13.1 556,368 1,104,521
933,174 1,524,797
Cash generated from operations 1,441,257 1,986,107
Half year ended
December 31,2016Note
December 31,2017
(Rupees in �000)
17
14. TRANSACTIONS WITH RELATED PARTIES
Related parties comprise of associated companies, other associated undertakings,
directors and key management personnel. Transactions between the Company
and the related parties are:
FINAL PROOF 2.1.18
13.1 Working capital changes
(Increase) / decrease in current assetsStores, spares and loose tools (25,638) 79,711
Stock-in-trade 705,841 907,807
Trade debts (531,515) (132,066)
Loans and advances (59,328) (76,644)
Trade deposits and short-term prepayments (11,075) 22,959
Other receivables 368,090 (48,952)
446,375 752,815
Increase in current liabilities
Trade and other payables 109,993 351,706
Changes in working capital 556,368 1,104,521
Name of Related Parties Nature of Transaction
a. Associated companies(Common Directorship)
Lucky Cement Limited Purchase of cement 5,325 801Re-imbursement of expenses 459 319
Yunus Textile Mills Limited Sale of yarn 201,199 148,670
Lucky Knits (Private) Limited Sale of yarn 417,437 315,492Purchase of goods & services 16,473 13,934Purchase of vehicle - 410
Lucky Textile Mills Limited Sale of yarn 1,238,330 1,265,920Sale of fabric 173,732 175,337Doubling charges - 1,232Processing charges 2,038 -
Lucky Energy (Private) Limited Purchase of electricity 650,739 559,096
Lucky Landmark (Private) Limited Sale of vehicle 1,491 -
Yunus Energy Limited Re-imbursement of expenses 2,744 2,128Share of profit on investment 115,688 7,623
ICI Pakistan Limited Purchase of fiber 832,394 730,939Sale of fiber - 22,379Share of profit on investment 106,429 96,433Dividend received 59,809 53,828
Lucky Holdings Limited Share of profit on investment 9,737 7,256
b. Benefits to key management personnel 40,932 32,931
Half year ended
December 31,2016Note
December 31,2017
(Rupees in �000)
December 31,
2017
December 31,
2016
Half year ended
----- (Rupees in �000) -----
18
MUHAMMAD SOHAIL TABBAChief Executive Officer
MUHAMMAD IMRAN MOTENChief Financial Officer
MUHAMMAD YUNUS TABBAChairman / Director
FINAL PROOF 2.1.18
15. FAIR VALUE OF FINANCIAL ASSETS AND FINANCIAL LIABILITIES
Fair value is the price that would be received to sell an asset or paid to transfer a liability
in an orderly transaction between market participants at the measurement date.
The carrying values of all financial assets and liabilities reflected in the financial
statements approximate their fair values.
Fair value hierarchy
The following table provides an analysis of financial instruments that are measured
subsequent to initial recognition at fair value, grouped into Levels 1 to 3 based on the
degree to which the fair value is observable.
� Level 1 fair value measurements are those derived from quoted prices (unadjusted)
in active markets for identical assets or liabilities.
� Level 2 fair value measurements are those derived from inputs other than quoted
prices included within Level 1 that are observable for the asset or liability, either directly
(i.e. as prices) or indirectly (i.e. derived from prices).
� Level 3 fair value measurements are those derived from valuation techniques that
include inputs for the asset or liability that are not based on observable market data
(unobservable inputs).
As at December 31, 2017, the company has no financial instruments that falls into
any of the above category.
16. CORRESPONDING FIGURES
Comparative information has been re-classified, re-arranged or additionally incorporated
in these financial information, wherever necessary, to facilitate comparison and to
conform with changes in presentation in the current period.
17. DATE OF AUTHORIZATION FOR ISSUE
This condensed interim financial information have been approved and authorized for
issue on January 29, 2018 by the Board of Directors of the Company.

19
FINAL PROOF 2.1.18
28,007
December-2017
Sales
December-2017
Production
December-2016
Sales
December-2016
ProductionQu
an
tity
in K
Gs
(�0
00
)45,000
30,000
-
Export Sales
Local Sales
40,25726,618 39,153
12,960
15,000
12,216
20
FINAL PROOF 2.1.18
3,585,410)
8,094,880)
11,680,290)
686,023)
(126,727)
(95,849)
(172,389)
206,508)
461,310)
366,870)
13.09)
25.02)
4.48)
10.79)
16.30)
(45.84)
(11.73)
(45.23)
57.77)
10.14)
10.22)
)
4,482,427
8,457,641
12,940,068
797,849
(184,817
(107,095
(250,356
325,814
508,083
404,346
14.43
)
)
21
FINAL PROOF 2.1.18

FINAL PROOF 2.1.18

FINAL PROOF 2.1.18
BLANK PAGE

FINAL PROOF 2.1.18
BLANK PAGE

FINAL PROOF 2.1.18


![Textile Technology [Read-Only]textile.yazd.ac.ir/ms.ahmadi/Downloads/Textile Technology/Textile... · Textile Technology (Pictures) Edited by: M. S. Ahmadi Textile Technology 1 Yazd](https://static.fdocuments.in/doc/165x107/5e786641131316263558e076/textile-technology-read-only-technologytextile-textile-technology-pictures.jpg)