G20 Financial Regulatory Reforms 31 August 2016 2nd · Implementation and Effects of the G20...
45
Implementation and Effects of the G20 Financial Regulatory Reforms 31 August 2016 2 nd Annual Report
Transcript of G20 Financial Regulatory Reforms 31 August 2016 2nd · Implementation and Effects of the G20...

Implementation and Effects of the G20 Financial Regulatory Reforms 31 August 2016 2nd Annual Report

2
Contacting the Financial Stability Board
Sign up for e-mail alerts:Follow the FSB on Twitter:
E-mail the FSB at:
www.fsb.org/emailalert @FinStbBoard [email protected]
Copyright © 2016 | Financial Stability Board
TABLE OF CONTENTS Page
Executive Summary ........................................................................................................... 1
Table on implementation of reforms in priority areas by FSB jurisdictions (as of 31 August 2016) ....................................................................... 3
1. Introduction ............................................................................................................. 6
2. Implementation status ............................................................................................. 7
2.1 Building resilient financial institutions ............................................... 7
2.2 Ending too-big-to-fail ........................................................................ 10
2.3 Making derivatives markets safer ..................................................... 12
2.4 Transforming shadow banking into resilient market-based finance 14
2.5 Progress in other reform areas ......................................................... 16
2.6 Strengthening adherence to international financial standards ....... 17
2.7 Key implementation challenges ........................................................ 17
Promoting cross-border cooperation ................................................ 17
Addressing implementation capacity and other operational constraints ........................................................................................ 18
3. Overall effects of reforms ...................................................................................... 19
3.1 Building a more resilient financial system ........................................ 19
3.2 Supporting sound financial intermediation ...................................... 24
4. Areas for attention ................................................................................................. 27
4.1 Market liquidity ................................................................................. 27
4.2 Effects of reforms on EMDEs ............................................................ 31
4.3 An open and integrated global financial system .............................. 32 Annex 1: Supplementary information ............................................................................. 36
Annex 2: Monitoring forward planner ............................................................................ 40
Annex 3: Sources of information ..................................................................................... 41 Abbreviations .................................................................................................................. 43

1
EXECUTIVE SUMMARY
In 2008, the G20 initiated a comprehensive programme of regulatory reforms to address the fault lines that caused the largest financial crisis since the Great Depression. The crisis led to a global recession whose effects are still being felt today. The cumulative loss of output since the crisis, compared to its pre-crisis trend, is of the order of 25% of one year’s world GDP. The reforms are designed to increase the resilience of the global financial system while preserving its open and integrated structure. Their full, timely and consistent implementation aims to support the G20 objective of strong, sustainable and balanced growth. The strengthening of resilience to date has stood the global financial system in good stead. During recent episodes of market turbulence the financial system has continued to function effectively, dampening aftershocks rather than amplifying them. This resilience in the face of stress demonstrates the benefits of the agreed reforms, but should not lead to complacency. A sustained effort to complete the implementation of those reforms is needed. Implementation progress remains steady but uneven across the four core areas of the reform programme (see colour-coded table and Section 2): ■ Building resilient financial institutions – Implementation of Basel III capital
and liquidity standards has generally been timely, and banks remain on track to meet these standards. However, some major advanced economies have not addressed deviations in their rules from the Basel framework.
■ Ending too-big-to-fail – Implementation of higher loss absorbency and more intensive supervision is most advanced for global systemically important banks. But substantial work remains to build effective resolution regimes and to operationalise resolution plans for cross-border firms.
■ Making derivatives markets safer – Implementation of over-the-counter (OTC) derivatives reforms is well underway, but progress remains uneven. Margin requirements are behind schedule and platform trading frameworks are relatively undeveloped in many jurisdictions. The availability and use of trade repositories (TRs) continues to expand, but significant work is still needed to ensure trade reporting is effective.
■ Transforming shadow banking into resilient market-based finance – Implementation of the agreed reforms (e.g. on the oversight and regulation of shadow banking entities, money market funds, risk alignment of securitisation) remains at a relatively early stage. More work is needed by the FSB and jurisdictions to assess and respond to potential financial stability risks in this area.
Across these reform areas, effective implementation will require further cross-border cooperation and addressing legal, data and capacity constraints. The effects of the reforms implemented to date have been generally positive (see Section 3): ■ The largest internationally active banks are considerably more resilient
than before the crisis. Banks have built larger and better quality capital buffers, mainly through retained earnings. They now have significantly lower leverage and many have improved their funding profiles. However, banks are still adjusting their business models and low market valuations persist for many of them.

2
■ Progress has also been made in strengthening the resilience of financial markets. Increased risk awareness and stronger regulation have curtailed opaque and complex securitisations. OTC derivatives contracts are increasingly cleared by central counterparties (CCPs) to reduce contagion risk among market participants. However, work is still ongoing to strengthen market infrastructure and address vulnerabilities in market-based finance and asset management activities.
■ This improved resilience has been achieved while maintaining the overall provision of credit to the real economy. Growth in total credit and bank lending has resumed in all regions, albeit at different paces, following a sharp decline after the crisis. The cost of financing has remained low, although exceptionally accommodative monetary policies may have contributed to this outcome. The growth of market-based finance has diversified the sources of financing of the real economy in a number of countries, but needs to be matched with appropriate measures to address any associated financial stability risks.
The FSB, in collaboration with the standard-setting bodies (SSBs), continues to enhance the analysis of the effects of reforms. Policies will be adjusted where necessary to address material unintended consequences. Work is underway to address the conceptual and empirical challenges in evaluating whether the reforms taken together are having their intended effects on the financial system and the broader economy. Three areas merit ongoing attention (see Section 4): ■ Market liquidity – There is limited evidence of a broad deterioration in
market liquidity, although there is some evidence of less depth in certain sovereign and corporate debt markets. The reforms have reduced the likelihood that a deterioration in market liquidity could result in wider financial stability problems. The FSB will continue to monitor and further analyse the resilience of market liquidity under stressed conditions.
■ Effects of reforms on emerging market and developing economies (EMDEs) – EMDEs have not reported any major unintended consequences from implementing the reforms, although global banks are reducing their presence and activities in EMDE markets. The FSB will further examine the drivers and implications of this trend. Work is also underway to assess and address the decline in correspondent banking.
■ Maintaining an open and integrated global financial system – The reforms appear to have helped avoid significant retrenchment and market fragmentation, which were common features of past financial crises. While international bank lending has declined since the crisis, its structure has shifted towards more stable locally funded lending. More work is needed to evaluate the effects of reforms on financial openness and integration.
G20 Leaders’ continued support is needed to address identified gaps and inconsistencies in the four core reform areas, and to overcome legal and operational obstacles to implementation by: ■ putting in place legal powers to share information across borders and to be
able to give prompt effect to foreign resolution actions; ■ removing legal barriers to reporting OTC derivatives to TRs and putting in
place legal frameworks to permit authorities’ access to TR-held data; and ■ ensuring that legal, data and capacity constraints do not hamper
implementation efforts.

3
Table on implementation of reforms in priority areas by FSB jurisdictions (as of 31 August 2016) The table provides a snapshot of the status of implementation progress by FSB jurisdiction across priority reform areas, based on information collected by FSB and standard-setting bodies’ (SSBs) monitoring mechanisms. The colours and symbols in the table indicate the timeliness of implementation, while the letters indicate the extent to which implementation is consistent with the international standard (Basel III) or its effectiveness is hampered by identified obstacles (trade reporting).
Reform Area
Basel III^ Compen-sation Over-the-counter (OTC) derivatives Resolution Shadow banking+
Risk-based capital
Liquidity coverage
ratio (LCR)
Higher loss absorbency for G-SIBs
(home jurisdictions)
Require-ments
for D-SIBs
Leverage ratio
Net Stable
Funding Ratio
(NSFR)
Trade reporting
Central clearing
Platform trading
Margin (as of 1
Sep 2016)
Transfer / bail-in /
temporary stay
powers for banks
Recoveryand
resolution planning
for systemic
banks
Transfer / bridge / run-off powers
for insurers
Money market funds
(MMFs)
Securi-tisation
Agreed phase-in (completed) date
2013 (2019)
2015 (2019)
2016 (2019) 2016 2018 2018 end-2012 end-2012 end-2012 Sep 2016
(2019)
Argentina na ** **
Australia C * Brazil C ** Canada C, D, F ** China C, C R, D, F France MNC C ** * Germany MNC C ** Hong Kong C C ** India C LC D, F Indonesia R ** Italy MNC C * Japan C C D Mexico C C & D ** * Netherlands MNC C ** * Rep. of Korea D ** Russia C C ** Saudi Arabia C LC R, D ** Singapore C ** South Africa C C D, F ** Spain MNC C * Switzerland C C ** Turkey C C D, F ** United Kingdom MNC C ** * United States LC C

4
Legend
Basel III: Final rule published and in force. OTC derivatives: Legislative framework in force and standards/criteria/requirements (as applicable) in force
for over 90% of relevant transactions. Resolution: Element of resolution regime in the FSB Key Attributes of Effective Resolution Regimes for
Financial Institutions (Key Attributes) that is implemented/in place. For the powers columns, all three of the resolution powers for banks (transfer, bail-in and temporary stay) and insurers (transfer, bridge and run-off) are available. Both recovery and resolution planning processes are in place for systemic banks.
Compensation: All FSB Principles and their Implementation Standards for Sound Compensation Practices (Principles and Standards) implemented.
Shadow banking: MMFs – Final implementation measures in force for valuation, liquidity management and (where applicable) stable net asset value (NAV). Securitisation – Final adoption measures taken (and where relevant in force) for implementing an incentive alignment regime and disclosing requirements.
Basel III: Final rule in force, but certain elements (e.g. countercyclical capital buffer, LCR disclosure
requirements) are not yet finalised. Compensation: All except a few (three or less) FSB Principles and Standards implemented.
Basel III: Final rule published but not in force, or draft regulation published. OTC derivatives: Regulatory framework being implemented. Resolution: Element of resolution regime in the Key Attributes that is partially implemented / in place. For
the powers columns, one or two of the resolution powers for banks (transfer, bail-in and temporary stay) and insurers (transfer, bridge and run-off) are available. Recovery planning is in place for systemic banks, but resolution planning processes are not.
Compensation: FSB Principles and Standards partly implemented (more than three Principles and/or Standards have not yet been implemented)
Shadow banking: MMFs – Draft/final implementation measures published or partly in force for valuation, liquidity management and (where applicable) stable NAV. Securitisation – Draft/final adoption measures published or partly in force for implementing an incentive alignment regime and disclosing requirements.
Basel III: Draft regulation not published (light red colour indicates deadline for reform not lapsed). OTC derivatives: No regulatory framework in place (dark red colour indicates lapsed deadline for reform). Resolution: Element of resolution regime in the Key Attributes that is not implemented / in place. For the
powers columns, none of the three resolution powers for banks (transfer, bail-in and temporary stay) and insurers (transfer, bridge and run-off) are available. Neither recovery nor resolution planning processes are in place for systemic banks.
Shadow banking: MMFs – Draft implementation measures not published for valuation, liquidity management and (where applicable) stable NAV. Securitisation – Draft adoption measures not published for implementing an incentive alignment regime and disclosing requirements.
Basel III: Requirements reported as non-applicable.
na Resolution regimes: Information not available in the FSB’s August 2016 fifth progress report on resolution.
C / LC / MNC / NC
Basel III: Regulatory Consistency Assessment Program (RCAP) – assessed “compliant” (C), “largely compliant” (LC), “materially non-compliant” (MNC) and “non-compliant” (NC) with Basel III rules. See the RCAP compliance scale in the Basel Committee’s Handbook for jurisdictional assessments.
^ Basel III: Risk-based capital column excludes certain technical standards that will come into force by 2017.
These are: the standardised approach for counterparty credit risk; capital requirements for central counterparty (CCP) exposures and for equity investments in funds; and the revised Pillar 3 framework.
& Basel III: The updated status of domestic systemically important banks (D-SIB) implementation for Mexico based on self-reporting, and will be reviewed in the next Basel Committee update.
R / D / F
OTC derivatives: Legal barriers to domestic participants’ reporting to trade repositories (TRs) for which cure/mitigant is not available (R); access to domestic TR data by domestic authorities other than primary authority not permitted, or permitted with material conditions (D); direct or indirect access to domestic TR data by foreign authorities not permitted, or permitted only with material conditions (F).
+ Shadow banking: The 2016 update on MMFs and securitisation was undertaken by IOSCO using the assessment methodology in its 2015 peer review reports in these areas.
* / ** Shadow banking: Implementation is more advanced than the overall rating in one or more / all elements of
at least one reform area (MMFs), or in one or more / all sectors of the market (securitisation).

5
Changes in implementation status since the 2015 G20 Summit The table shows the changes in implementation status by FSB jurisdiction across priority areas between 31 October 2015 and 31 August 2016, based on information collected by FSB and SSBs’ monitoring mechanisms. Only those areas included in the above colour-coded table for both years and progress that involves a change in colours are shown. The colour on the left-hand cell reflects the implementation status as of October 2015, while the colour on the right-hand cell indicates the status as of August 2016.
Reform area / Jurisdiction Basel III Compensation OTC
derivatives Resolution Shadow banking+
Australia Platform trading
Brazil
Recovery and resolution
planning for systemic banks
Canada Requirements for D-SIBs Margin
China Requirements for D-SIBs ** MMFs
Germany * Securi-tisation
Hong Kong
Transfer / bail-in / temporary stay
powers for banks
Securi-tisation
Recovery and resolution
planning for systemic banks
Indonesia LCR
Compensa-tion
Recovery and resolution
planning for systemic banks
Requirements
for D-SIBs
Japan HLA for G-SIBs, requirement
for D-SIBs Margin MMFs
Mexico Requirements for D-SIBs
Central clearing, platform trading
Rep. of Korea Requirements for D-SIBs Margin
Russia LCR,
requirements for D-SIBs
Platform trading
Recovery and resolution planning for systemic banks
** Securi-tisation
Switzerland
Central clearing, platform trading
Transfer / bail-in / temporary stay powers for
banks
Turkey Requirements for D-SIBs Compensa-
tion
United States Margin

6
1. Introduction This is the second annual report to the G20 on the implementation and effects of reforms. ■ The purpose of the report is to highlight the progress made by G20 and FSB members in
implementing regulatory reforms to fix the fault lines that led to the global financial crisis and build a safer, more resilient financial system.
■ Over time, these annual reports will enable the G20 to assess whether the financial reforms are achieving their intended results in an effective manner consistent with its objectives for financial stability and growth.
The financial crisis imposed tremendous costs on the global economy (Graph 1). ■ The cumulative loss of output since the crisis, compared to its pre-crisis trend is of the order
of 25% of one year’s world gross domestic product (GDP).1 ■ The global economy is still recovering from the effects of the crisis, nine years after its
onset. These costs include much higher public debt, increased unemployment and substantial output losses, particularly for advanced economies.
The costs of the recent global financial crisis have been substantial Graph 1
Public debt has increasedsignificantly in advanced economies
The crisis caused a large output loss Unemployment remains above pre-crisis levels in advanced economies
Percent of GDP Percent Percent
Left panel: Public debt to GDP ratio for FSB jurisdictions, weighted by nominal GDP. Middle panel: Real GDP growth rates forFSB jurisdictions, weighted by nominal GDP. Right panel: Simple average of unemployment rates for FSB jurisdictions. Source:International Monetary Fund (IMF), World Economic Outlook Database, April 2016.
The G20 launched a comprehensive programme of financial reforms post-crisis to increase the resilience of the global financial system, while preserving its open and integrated structure. The FSB was established by the G20 in 2009 to coordinate the development and to monitor the implementation of this programme. ■ The reform programme has four core elements: making financial institutions more
resilient; ending too-big-to-fail (TBTF); making derivatives markets safer; and transforming
1 See chapter 3 of the IMF’s World Economic Outlook (April 2015) and The effect of the global financial crisis on OECD
potential output by Ollivaud and Turner (2015, OECD Journal; Economic Studies – Volume 2014).
20
40
60
80
100
2005 2007 2009 2011 2013 2015
Advanced economiesEMDEs
–5.0
–2.5
0.0
2.5
5.0
7.5
2005 2007 2009 2011 2013 2015
Advanced economiesEMDEs
4
6
8
10
2005 2007 2009 2011 2013 2015
Advanced economiesEMDEs

7
shadow banking into resilient market-based finance.2 These reforms cover a broad range of issues involving banks and other types of financial institutions and financial markets.
■ By making the financial system more resilient and thereby reducing the likelihood and severity of crises, the reforms aim to reduce the public costs and losses in output and employment associated with such crises.
■ The main elements of the reforms have been agreed and their implementation is well underway. Some policy work is still ongoing, particularly the work of the Basel Committee on Banking Supervision (BCBS) to finalise certain elements of the Basel III framework. In doing so, the BCBS will focus on not significantly increasing overall capital requirements.
■ The FSB is supporting the full, timely and consistent implementation of these reforms, and stands ready to address material unintended consequences.
The strengthening of resilience to date has stood the global financial system in good stead during recent market turbulence. ■ Thus far this year, the global financial system has weathered two spikes in uncertainty and
risk aversion: one in response to concerns about the medium-term growth prospects of the world economy and about banks’ ongoing adjustment to the macroeconomic and regulatory environment; and the second over the potential implications of the UK’s referendum to leave the European Union (EU).
■ The financial system has continued to function effectively in both cases by dampening aftershocks rather than amplifying them. International coordination and clear public communication by authorities have contributed to this outcome.
■ Such resilience in the face of stress demonstrates the benefits of the agreed reforms, but should not lead to complacency. These events also highlight the importance of the FSB’s work to address emerging vulnerabilities and of the need for continued progress in completing the implementation of these reforms.
2. Implementation status
2.1 Building resilient financial institutions
Regulatory adoption of Basel III has generally been timely to date. ■ All 24 FSB jurisdictions have the core elements of the Basel III risk-based capital and
liquidity (Liquidity Coverage Ratio, LCR) rules in force. ■ Final rules on higher loss absorbency requirements for global systemically important banks
(G-SIBs) are in force in all jurisdictions that have G-SIBs headquartered in them. ■ Final rules on the assessment methodology and higher loss absorbency requirements for
D-SIBs, which are due in 2016, have been issued in 22 jurisdictions (78% of the market). ■ There has been progress since last year in the adoption of final rules for the LCR (two more
jurisdictions), G-SIB (one more jurisdiction) and D-SIB (seven more jurisdictions) requirements.
■ Jurisdictions are now moving on to implementation of the leverage ratio and the Net Stable Funding Ratio (NSFR), which are due to come into force in 2018 (Graph 2).
■ 95 non-BCBS jurisdictions report that they have adopted or are in the process of adopting elements of Basel III, including those relating to the definition of capital and to the LCR.
2 Shadow banking is defined as “credit intermediation involving entities and activities (fully or partly) outside the regular
banking system.” Some authorities or market participants prefer to use other terms such as “market-based financing” instead of “shadow banking”. The use of the term “shadow banking” is not intended to cast a pejorative tone on this system of credit intermediation. However, the FSB is using the term “shadow banking” as this is the most commonly employed and, in particular, has been used in the earlier G20 communications.

8
Implementation efforts now focus on the leverage ratio and the NSFR Graph 2
As percent of number of FSB jurisdictions1
As percent of market size2
Final rule in force Final rule or draft regulation published Draft regulation not published but deadline has not
lapsed
1 The six EU members of the FSB are presented as separate jurisdictions. 2 Market size based on assets of banks domiciled in each FSB jurisdiction at end-2014.
Several jurisdictions report challenges to meeting the agreed implementation timelines for certain forthcoming elements of the Basel III standards. ■ The reported challenges relate mainly to delays in the legislative or rule-making process,
and to difficulties in adjusting banks’ information technology (IT) systems (see Section 2.7). ■ These challenges affect the implementation of the standardised approach for measuring
counterparty credit risk (January 2017), capital requirements for CCP exposures and for equity investments in funds (January 2017) and the revised Pillar 3 framework (end-2016).
Evolution of banks’ regulatory capital and liquidity ratios Graph 3
Risk-based capital and leverage ratios continue toimprove
Aggregate liquidity shortfalls have declined over time
Weighted average ratio, percent EUR billion Percent (Weighted average ratio) EUR billion
1 Total capital shortfall for banks to reach the fully phased-in 2019 Common Equity Tier 1 (CET1) target ratio of 7% plus bank-specific G-SIB surcharges if applicable, and the respective target levels (and G-SIB surcharges) for Tier 1 and total capital ratios.2 Additional total capital shortfall to meet the fully-phased in leverage ratio (on top of the target risk-based capital ratios), assuming a 3% calibration as per BCBS (2014).
Note: The left graph shows data for banks that have Tier 1 capital of more than €3 billion and are internationally active (“Group 1 banks”), while the right graph is for all banks covered by BCBS monitoring. The ratios on the left graph are weighted by risk-weighted assets (RWAs), while the liquidity ratios on the right graph are weighted by CET1 capital. Source: March 2016 BCBS Basel III Monitoring Report.
2
4
6
8
10
0
200
400
600
800
H1’11 H2’11 H1’12 H2’12 H1’13 H2’13 H1’14 H2’14 H1’15
Risk-based capital ratios
Leverage ratios
LHS:Capital shortfall (risk-based capital ratio)1
Additional shortfall (leverage ratio) 2
RHS:
1.00
1.05
1.10
1.15
1.20
1.25
0
200
400
600
800
H1 2013 H2 2013 H1 2014 H2 2014 H1 2015
LCR ratioNSFR ratio
LHS:LCR Shortfall NSFR Shortfall
RHS:
Leverage ratio
Liquidity (NSFR)
Leverage ratio
Liquidity (NSFR)
0 20 40 60 80 1000 20 40 60 80 100

9
Banks continue to build capital and liquidity buffers to meet the new standards (Graph 3). ■ All large internationally active banks report meeting the fully phased-in minimum risk-
based capital and leverage ratio requirements. ■ 80% of these banks report meeting or exceeding the fully phased-in minimum liquidity
requirements – the LCR and the NSFR. The consistency of implementation with the Basel framework should be further improved. ■ Risk-based capital rules – BCBS has assessed 21 FSB jurisdictions (Graph 4).3
■ Fifteen (representing 61% of the market) were found to be compliant or largely compliant with risk-based capital rules; and
■ The six EU members of the FSB (assessed as a single jurisdiction, representing 36% of the market) were found to be materially non-compliant. In their March 2016 follow-up reporting, these members did not report taking, or planning to take, actions to address identified deviations.
■ Liquidity rules – all seven FSB jurisdictions assessed by the BCBS to date (representing 6% of the market) were found to be compliant or largely compliant with the LCR.
■ G/D-SIB requirements – all ten FSB jurisdictions that are home to G-SIBs were found by the BCBS to be compliant with G-SIB requirements. The D-SIB frameworks in these jurisdictions were also found to be broadly aligned with the D-SIB principles.
Consistency with Basel III risk-based capital rules should be further improved Graph 4
As percent of number of FSB jurisdictions1 As percent of market size2
Compliant Largely compliant Materially non-compliant Non-compliant Not assessed yet
1 The six EU members of the FSB are presented as separate jurisdictions. 2 Market size based on assets of banks domiciled in each FSB jurisdiction at end-2014.
Work is underway to address excessive variability in RWAs modelled by banks. ■ BCBS analyses continue to find material variations in banks’ internal risk-weighted asset
calculations due to factors other than underlying risk. ■ To reduce variation in credit RWAs and improve consistency and comparability of banks’
capital ratios, the BCBS has proposed constraints on the use of internal models.4 It has also proposed to remove the use of internal models for operational risk.
3 The most material inconsistencies relate to internal models for credit risk, counterparty credit risk and securitisation, and
the definition of capital. 4 The final design and calibration of the proposals will be informed by a quantitative impact study. The BCBS will focus on
not significantly increasing overall capital requirements. See the March 2016 BCBS consultative document on reducing variation in credit risk-weighted assets – constraints on the use of internal model approaches.
Risk based capital
Liquidity (LCR)
Risk based capital
Liquidity (LCR) 0 20 40 60 80 1000 20 40 60 80 100

10
Work is also underway to develop a global insurance capital standard. ■ The International Association of Insurance Supervisors (IAIS) is developing a global risk-
based Insurance Capital Standard (ICS) for internationally active insurance groups. The first version of the ICS will be issued in 2017, with implementation scheduled to start from 2020.
Adoption of regulatory and supervisory frameworks for compensation is almost completed. ■ Almost all FSB jurisdictions have fully implemented the FSB Principles and Standards for
Sound Compensation Practices, which aim to reduce incentives for excessive risk taking that may arise from the structure of firms’ compensation schemes. Two more jurisdictions have aligned their framework with the FSB standard since last year.
■ Authorities remain focused on embedding oversight of compensation practices in bank supervision and further improving the governance and risk alignment of compensation.
■ The FSB has examined the role of compensation policy and tools in broader efforts to address misconduct risks. There is considerable variation across jurisdictions in the use of provisions for malus (to adjust the unvested portion of employees’ variable compensation on an ex post basis) and clawback (to recover the vested portion) in the event of misconduct. This reflects, in part, uncertainties in the enforceability of these provisions and challenges of applying them consistently across large firms.
2.2 Ending too-big-to-fail
Processes for identifying G-SIBs and G-SIIs are in place. ■ Lists of G-SIBs and global systemically important insurers (G-SIIs) are updated annually. The
IAIS published in June a revised methodology for the assessment of G-SIIs, which addresses all types of insurance and reinsurance, and other financial activities of global insurers.
■ The assessment methodologies for non-bank non-insurer global systemically important financial institutions (G-SIFIs) will be finalised once the current FSB work on developing policy recommendations to address structural vulnerabilities from asset management activities is completed.
Implementation of the policy framework has advanced the most for G-SIBs. ■ Implementation of Higher Loss Absorbency as well as of reporting and disclosure
requirements for G-SIBs is proceeding on a timely basis (see Section 2.1). ■ Supervisory frameworks have improved and supervisory colleges have been established for
almost all G-SIBs, although cross-border supervisory cooperation needs to strengthen.5 ■ Many G-SIBs did not meet the deadline for compliance with the BCBS Principles on risk data
aggregation and risk reporting. ■ Crisis Management Groups (CMGs) have been established for all G-SIBs, and resolution
planning is advancing. G-SIBs and authorities are taking actions to improve resolvability but significant work remains to put cooperation agreements in place (see Section 2.7).
■ G-SIBs have started developing Total Loss-Absorbing Capacity (TLAC) issuance strategies. Several G-SIB home authorities have issued proposals and one has adopted final rules on TLAC implementation.
Substantial work remains in achieving effective resolution regimes and operationalising plans for systemically important banks and non-bank financial institutions (Graphs 5 and 6). ■ Only a subset of FSB jurisdictions, mostly G-SIB home jurisdictions, have implemented bank
resolution regimes with comprehensive powers that are broadly in line with the FSB Key Attributes of Effective Resolution Regimes for Financial Institutions. The powers most often
5 See the FSB peer review on supervisory frameworks and approaches for SIBs (April 2015) and the BCBS progress report
on the implementation of principles for effective supervisory colleges (July 2015).

11
lacking are explicit continuity powers, bail-in, and powers to impose a temporary stay on the exercise of early termination rights. There are reforms underway in several FSB jurisdictions to address some, but not all, of these gaps (Annex 1, Box 1).
More work is needed to implement comprehensive bank resolution regimes Graph 5
As percent of number of FSB jurisdictions1
As percent of market size2
Fully implemented/in place Partially implemented/in place Not implemented
1 The six EU members of the FSB are presented as separate jurisdictions. 2 Market size based on assets of banks domiciled in each FSB jurisdiction at end-2014. 3 Composite indicator on extent to which jurisdictions have transfer, bail-in and temporary stay powers in their regime.
Progress in implementing resolution-related reforms Graph 6
Progress in adopting comprehensive bank resolutionpowers is greatest for G-SIB home authorities
The implementation of G-SIB-specific resolutionrequirements is more advanced than for G-SIIs
Number of FSB jurisdictions Percent of G-SIBs and G-SIIs in 2015/16
Note: The left graph shows the availability of bank resolution powers in FSB jurisdictions at the time of the 2013 thematic review(based on data as of December 2012) and as of July 2016. The right graph shows the implementation status of G-SIB- and G-SII-specific resolution requirements as of August 2014 and August 2016. Those G-SIBs and G-SIIs that were added/removed fromthe list in those years have been excluded to ensure a consistent sample. Source: FSB 5th progress report on resolution.
■ Weaknesses identified through G-SIB resolvability assessments include the assessment of
likely funding needs in resolution; operationalising bail-in; management information systems; and continuity of access in resolution to financial market infrastructures.
■ Implementation of resolution reforms is significantly less advanced in the insurance sector, although CMGs have been established and recovery plans adopted for most G-SIIs.
0
5
10
15
20
’12 ’16 ’12 ’16 ’12 ’16 ’12 ’16 ’12 ’16 ’12 ’16 ’12 ’16 ’12 ’16Replace Control & Transfer Asset Bridge Temp Bail-in Cont. of
mgmt operate mgmt bank stay servicesfirm for group
entities
Non-G-SIB home jurisdictions
G-SIB home jurisdictions
0
20
40
60
80
100
G-SIB G-SII G-SIB G-SII G-SIB G-SII G-SIB G-SII G-SIB CMGs Co-operation Recovery Operational ISDA Reso-
established agreements plans resolution lution Stay(CoAgs) plans Protocol signed adherence
20152016
G–SIBs:20152016
G–SIIs:
Resolution powers3
Recovery planning
Resolution planning
Resolution powers3
Recovery planning
Resolution planning0 20 40 60 80 1000 20 40 60 80 100

12
■ Systematic cross-border resolution planning processes are not yet in place for CCPs, but work is underway by the FSB to provide more granular guidance on CCP resolution.
2.3 Making derivatives markets safer
Implementation of OTC derivatives reforms is well underway, including in the largest derivatives markets, but it remains behind schedule in some jurisdictions (Graph 7). ■ Implementation is most advanced for trade reporting and for higher capital requirements
for non-centrally cleared derivatives. Central clearing frameworks and (to a lesser degree) margining requirements have been or are being implemented, while platform trading frameworks are relatively undeveloped in most jurisdictions.
■ There has been progress since last year in adopting standards for determining when standardised OTC derivatives should be required to be centrally cleared (two more jurisdictions) and platform trading (three more jurisdictions).
■ Trade reporting requirements covering over 90% of OTC derivative transactions in the relevant market are in force in 19 jurisdictions.
■ Higher capital requirements for banks’ exposures to non-centrally cleared derivatives that cover over 90% of their relevant markets are in force in 20 jurisdictions.
■ 14 jurisdictions have central clearing frameworks in force for determining when standardised OTC derivatives should be centrally cleared that cover over 90% of their relevant markets. Based on those frameworks, clearing requirements will have been adopted in 10 jurisdictions by September 2016, mainly on interest rate derivatives.
■ By September 2016, margin requirements for non-centrally cleared derivatives that cover over 90% of relevant transactions will be in force in only three jurisdictions in accordance with the first phase of the BCBS-International Organization of Securities Commissions (IOSCO) implementation schedule. Around half of the FSB jurisdictions do not appear on track to implement variation margin requirements in accordance with the second and final phase (March 2017). One jurisdiction (China) has not yet initiated reform in this area.
■ 11 jurisdictions have frameworks for determining exchange/electronic platform trading requirements for standardised OTC derivatives that apply to over 90% of their markets. One jurisdiction (Korea) has not yet initiated reform in this area.
Implementation has tended to be most advanced in the largest OTC derivatives markets
Graph 7
As percent of number of FSB jurisdictions1
As percent of market size for interest rate swaps2
Regulatory framework and standards in force for over 90% of relevant transactions
Regulatory framework being implemented No regulatory framework in place (dark red colour
indicates that deadline for reform has lapsed)
1 The six EU members of the FSB are presented as separate jurisdictions. 2 Market size is proxied by single currency interest rate derivatives’ gross turnover in April 2013 (Bank for International Settlements (BIS) 2013 Triennial Survey).
Reporting
Clearing
Trading
Margin
Reporting
Clearing
Trading
Margin

13
The availability and use of TRs and CCPs continues to expand globally. ■ Progress continues to be made in enhancing the regulatory frameworks for TRs and CCPs
and in setting expectations for their sound design and operation consistent with the Principles for Financial Market Infrastructures (PFMI) by the Committee on Payments and Market Infrastructures (CPMI) and IOSCO (Graph 8).
■ The aggregate number of derivative trade reports submitted to major TRs has increased greatly since early 2014, while trade reporting requirements are most prevalent for interest rate and foreign exchange transactions (Graph 9). The availability of TRs (or similar infrastructures) is now widespread across FSB jurisdictions.
■ The cross-border availability of CCPs has also increased, facilitating activity and uptake of central clearing. The global usage of CCPs is growing, particularly for interest rate derivatives, which is the asset class in which CCP clearing is most widely available (see Section 3.1).
■ Authorities are monitoring clearing implementation issues such as the availability of client clearing services, and international work is underway to promote CCP resilience, recovery planning and resolvability (Annex 1, Box 4).
Implementation of the PFMI continues to advance Graph 8
Trade repositories (As percent of number of FSB jurisdictions1)
Central counterparties(As percent of number of FSB jurisdictions1)
Final rule in force Final rule or draft regulation published Draft regulation not published
Not applicable
1 The six EU members of the FSB are presented as separatejurisdictions.
Significant work is still needed to make trade reporting truly effective. ■ A number of jurisdictions have reported plans to remove legal barriers to full reporting of
trade information to TRs and to have a legal framework in place to permit authorities’ access to TR-held data, in response to the findings of the 2015 trade reporting peer review.6
■ The usefulness of TR data is limited by data quality issues, while differences in the details of reporting requirements among TRs and jurisdictions make it very challenging to aggregate or compare data from different sources. SSBs are working to promote greater data harmonisation by making proposals for unique product and transaction identifiers, and the FSB is developing proposals for the governance of those identifiers.
6 See the November 2015 FSB Thematic Review of OTC Derivatives Trade Reporting and the August 2016 Report on FSB
Members’ Plans to Address Legal Barriers to Reporting and Accessing OTC Derivatives Transaction Data.
Principles
Responsibilities
Principles
Responsibilities
0 20 40 60 80 100 0 20 40 60 80 100

14
Use of trade repositories Graph 9
The number of OTC derivative trades submitted tomajor TRs has increased greatly since early 20141
Trade reporting requirements are most prevalent for interest rate and foreign exchange derivatives2
Millions of contracts Percent of FSB jurisdictions
1 Position numbers represent aggregates of the number of OTC derivative trades reports submitted to selected TRs and outstanding as at the reporting date, expressed in millions of contracts. Positions may be reported individually by both parties to the transaction (e.g. under double-sided reporting regimes), which may lead to some double counting. Source: DTCC group (DDR, DDRL, DDRS), JFSA (DDRJ), RegisTR, Cetip, B&M Bovespa and HKMA-TR. 2 Estimated regulatory coverage of reporting requirements (% of all new transactions required to be reported) across FSB jurisdictions by asset class as of June 2016. Source: FSB, 11th Progress Report on the implementation of OTC derivatives market reforms.
2.4 Transforming shadow banking into resilient market-based finance
■ The FSB has created a system-wide monitoring framework to assess global trends and risks in the shadow banking system and, in collaboration with SSBs, has been developing policy measures to strengthen oversight and regulation.7
Implementation of policies to reduce the run risk of money market funds (MMFs) is ongoing (Graph 10). ■ Implementation of IOSCO recommendations for MMFs is most advanced in six FSB
jurisdictions (69% of global market), including two of the largest markets (US and China). ■ Nineteen FSB jurisdictions have implemented the fair value approach for the valuation of
MMF portfolios, but progress in liquidity management is less advanced and less even. ■ Nine FSB jurisdictions continue to permit MMFs that offer a stable net asset value (NAV),
but further work is needed in some of these jurisdictions to reinforce the resilience of those funds and their ability to meet redemptions.
7 These are in the areas of: mitigating risks in banks’ interactions with shadow banking entities; reducing the susceptibility
of money market funds to “runs”; improving transparency and aligning incentives in securitisation; dampening pro-cyclicality and other financial stability risks in securities financing transactions; and assessing and mitigating financial stability risks posed by other shadow banking entities and activities.
0
10
20
30
Q4 2013 Q2 2014 Q4 2014 Q2 2015 Q4 2015 Q2 2016
CommodityFX
CreditInterest rates
Equity
0
20
40
60
80
100
Commodity Credit Equity FX Interest Rate
Estimated coverage above 60%Estimated coverage below 60%Reporting requirements not in effect or no data availableN/A

15
Implementation progress is most advanced in the largest MMF markets Graph 10
As percent of number of FSB jurisdictions1
As percent of market size2
Final rule in force Final rule or draft regulation published Draft regulation not published
Not applicable
1 The six EU members of the FSB are presented as separatejurisdictions. 2 Market size based on assets under management (AUM) inFSB jurisdictions (accounting for 83% of global AUM) at end-2014.
Progress remains mixed across FSB jurisdictions in implementing IOSCO’s recommendations on incentive alignment approaches for securitisation (Graph 11). ■ Eight FSB jurisdictions report progress (either at a national level or within an industry
sector) in this area, while one jurisdiction (Australia) reports a downgrading of implementation status.
■ Most jurisdictions that have implemented incentive alignment requirements (partially or fully) oblige issuers to (directly or indirectly) retain typically 5% of the credit risk of the securitisation. However, there are exemptions to these requirements in some jurisdictions.
Uneven implementation of incentive alignment reforms for securitisation Graph 11
As percent of number of FSB jurisdictions1
As percent of market size2
Final rule in force Final rule or draft regulation published Draft regulation not published
1 The six EU members of the FSB are presented as separatejurisdictions. 2 Market size based on value of securitisation issuance(collateralised debt obligations, mortgage-backed securitiesand asset-backed securities) in FSB jurisdictions during 2014.
Implementation of the FSB Policy Framework for the oversight and regulation of shadow banking entities remains at a relatively early stage. ■ In 2015, for the first time, all 24 FSB jurisdictions (as well as Chile and Ireland) participated
in an information-sharing exercise on their assessments of, and tools to mitigate, identified shadow banking risks. The exercise resulted in a more focused analysis of shadow banking risks (e.g. maturity/liquidity transformation and leverage). This analysis will be further refined over time to provide more accurate measures of the degree to which non-bank credit intermediation gives rise to systemic risks.
■ A peer review found that, although progress is being made, more work is needed by both jurisdictions and the FSB to comprehensively assess and respond to potential shadow banking risks and to support FSB risk assessments and policy discussions (Annex 1, Box 2). This should include information exchange and cooperation amongst authorities and
0 20 40 60 80 100 0 20 40 60 80 100
Valuation
Liquidity management
Stable NAV
Valuation
Liquidity management
Stable NAV
Incentive alignment
Disclosure
Incentive alignment
Disclosure
0 20 40 60 80 100 0 20 40 60 80 100

16
additional implementation guidance and enhanced discussion of jurisdictions’ submissions to improve coverage and consistency of the data for assessing shadow banking risks.
■ FSB jurisdictions have agreed to take further actions to implement fully the Policy Framework. The FSB will conduct follow-up work to facilitate its effective implementation.
Implementation of reforms in other shadow banking policy areas is also at an early stage. ■ In order to ensure that spillovers of risks to the banking system are prudentially mitigated,
jurisdictions are implementing the risk-based capital requirements for banks’ investments in the equity of funds (to come into force in 2017), with a few members having final rules in force. Jurisdictions are also beginning to adopt the supervisory frameworks for measuring and controlling banks’ large exposures (to come into force in 2019).
■ Jurisdictions are at an early stage of implementing the FSB policy recommendations on securities financing transactions, including minimum haircut floors, some of which are being phased in by end-2018. Standards and processes for global securities financing data collection and aggregation that are relevant for financial stability monitoring and policy responses will be in place by end-2018.
2.5 Progress in other reform areas
■ Several jurisdictions have established inter-agency bodies for macroprudential policies, strengthened system-wide monitoring, and are using tools to address financial stability risks. Drawing on these experiences and empirical evidence, the IMF, FSB and BIS have prepared a report on elements that can help inform effective macroprudential policies.
■ Further progress has been made in closing the data gaps identified in the financial crisis, both in terms of expanding the number of reporting countries and in developing new data sets. The framework for the G-SIBs data collection is being enriched with information to allow a deeper analysis of common exposures and funding dependencies.
■ Of the three FSB jurisdictions identified in a 2012 FSB peer review as not having an explicit deposit insurance system, China and Saudi Arabia introduced such a system in 2015 and 2016 respectively, while South Africa intends to introduce one in the near future.
■ All relevant jurisdictions report having in place an oversight framework with registration and ongoing requirements relating to hedge funds or their managers.
■ Almost all jurisdictions report that they have put in place requirements for the registration and oversight of credit rating agencies (CRAs). However, more work is needed to avoid mechanistic reliance on CRA ratings by reducing references to CRA ratings in national laws and regulations, developing alternative standards of creditworthiness, and enhancing firms’ credit assessment capabilities.
■ In the wake of misconduct concerns, the administrators of the most widely used interest rate benchmarks (EURIBOR, LIBOR and TIBOR) continue to take steps to improve the robustness of these benchmarks, although these have not yet been completed. Progress is also being made by market participants, working with authorities, to identify near-risk free interest rate benchmarks and to increase their market use where appropriate. In addition, the first phase of the Global Code of Conduct for the Foreign Exchange Market was issued in May 2016 by a working group under the auspices of the BIS Markets Committee. The complete Code and its adherence mechanisms, which aim to promote the integrity and effective functioning of foreign exchange markets, will be released in May 2017.
■ The global Legal Entity Identifier (LEI) system has issued over 440,000 LEIs in 195 countries as of 20 June 2016. This unique identifier is used in two-thirds of FSB jurisdictions to support regulatory activities, for instance in connection with financial reporting. Additional uses are contemplated, such as in the area of correspondent banking. Further adoption of the LEI by legal entities worldwide and its use by authorities for a wider range of regulatory purposes is essential to fully reap its collective benefits.

17
■ In its third progress report, the Enhanced Disclosures Task Force (EDTF) noted that 82% of covered banks say that they have fully implemented its recommendations on risk disclosures in their 2015 annual reports, up from 75% the year before. Given the progress in improving bank disclosures, the FSB believes the EDTF does not need to undertake a fourth progress report, and has therefore formally disbanded the Task Force.
■ The international and US accounting standard setters have issued separate standards on expected loan loss provisioning (to come into force in 2018 and 2020 respectively), both of which are forward-looking and take account of the lessons of the crisis. These standards have not converged, and the FSB has asked the standard-setters to monitor their consistent implementation and to continue to seek opportunities for meeting the G20’s call for further accounting convergence. The EDTF developed a set of recommendations and examples of practice for disclosures to help the market understand the upcoming changes.
■ The FSB is working with the International Forum of Independent Audit Regulators (IFIAR) and global accounting firms to enhance the quality of audits of G-SIFIs. In March 2016, IFIAR published its latest findings, identified in members’ inspections of audit firms. IFIAR is not yet satisfied that enough has been done by the audit profession to understand and address shortfalls in audit quality.
2.6 Strengthening adherence to international financial standards
FSB members are implementing their commitments to lead by example.8 ■ FSB jurisdictions that have not had an IMF-World Bank Financial Sector Assessment
Program (FSAP) in the last five years are undergoing an FSAP update in 2016-17 (China, Indonesia, Netherlands, Saudi Arabia, Turkey). FSAP assessments for Germany, Russia and the UK were completed over the past year.
■ All FSB jurisdictions except Turkey have published the results of their compliance assessments in Reports on Standards and Codes published by the IMF and World Bank.
■ Over the past year, the FSB completed the country peer review of India, while the reviews of Brazil, France and Japan are underway.
2.7 Key implementation challenges
Promoting cross-border cooperation
Further cross-border cooperation is needed to overcome obstacles to effective implementation of reforms, including for resolution regimes and OTC derivatives. ■ The FSB and SSBs have been promoting approaches to deeper cross-border cooperation to
facilitate the effective implementation of reforms. ■ The need for such approaches is particularly relevant in policy areas where a significant
proportion of activity is cross-border, such as for resolution regimes and OTC derivatives. Resolution regimes ■ Effective resolution planning and the orderly resolution of a cross-border bank require
national authorities to have legal powers and efficient processes for sharing information, to have developed firm-specific cooperation agreements (CoAgs) with host authorities on CMGs for G-SIFIs, and to be able to give prompt effect to foreign resolution actions.
■ Significant work remains to put these arrangements in place. Since August 2015 the number of G-SIB CoAgs has increased modestly from 13 to 15, while only two have been signed for G-SIIs. Authorities need to renew efforts to put in place CoAgs for all G-SIFIs.
8 See the FSB webpages on FSAP participation and on FSB country peer reviews.

18
■ More progress is also needed to put in place mechanisms for giving cross-border effect to resolution actions. So far, only some FSB jurisdictions have such mechanisms in place, though reforms are underway in a number of other jurisdictions.
■ The FSB issued Principles for Cross-border Effectiveness of Resolution Actions in November 2015, and will monitor their implementation and review any experience, legal cases and practices of statutory and contractual recognition and supportive measures.
OTC derivatives ■ Some authorities note that unevenness in the pace of implementation as well as
inconsistencies or gaps in applying requirements to cross-border transactions can result in conflicting or duplicative requirements, or lead to opportunities for regulatory arbitrage; and that differences in recognition/equivalence requirements can lead to complex and time-consuming bilateral recognition processes of derivatives regulatory frameworks.
■ Current indications are that a substantial number of jurisdictions will not have margin requirements in force in accordance with the internationally agreed schedule. Such delays may have knock-on effects on the implementation of others and may have level playing field implications for jurisdictions that have implemented the standards based on the agreed timelines.
■ Authorities continue to engage bilaterally and in multilateral fora, with some positive developments taking place in identified cross-border issues. For example, the European Commission and the US Commodity Futures Trading Commission have announced a common approach for the regulation of certain CCPs active in both the EU and US.
■ Some progress has also been made in cross-border regulatory arrangements for trade reporting and execution of OTC derivatives. Further progress on cross-border issues remains important to achieve the intended objectives of the reforms.
■ The 2015 FSB trade reporting peer review (see Section 2.3) highlighted the need for FSB jurisdictions to remove legal barriers to the reporting of OTC derivatives transactions to TRs (including with respect to foreign requirements) and to have legal frameworks in place to permit both domestic and foreign authorities’ access to data held in a domestic TR. Globally, significant work is still needed in a number of jurisdictions to remove these barriers to full reporting of and access to trade information.
■ Further work is needed to promote cooperation among regulators, including by increasing efforts to complete the reform agenda, sharing implementation experiences (see Section 4.2), as well as by using the options set out in IOSCO’s cross-border regulatory toolkit.9
Addressing implementation capacity and other operational constraints
Implementation efforts continue to be hampered by legal, data and capacity constraints. ■ These include: complex domestic rule-making processes; legacy IT systems used for
reporting; and skillset shortages in new areas and complex standards that require specialised expertise (such as Basel III liquidity standards, resolution regimes and OTC derivatives reforms), which can be compounded by implementation monitoring demands. These constraints affect the timeliness, consistency and quality of national implementation.
■ Some EMDEs also report additional challenges in implementing reforms due to the limited size and early stage of development of their domestic financial markets, capacity and resource constraints, and cost pressures (see Section 4.2).
9 See the September 2015 final report of the IOSCO Task Force on Cross-Border Regulation (FR23/2015).

19
The FSB is working with SSBs and its member authorities to address identified constraints. ■ Transitional arrangements are in place for many standards, taking into account the
macroeconomic conjuncture, legislative arrangements and operational challenges. ■ Comprehensive and robust implementation monitoring mechanisms ensure that
challenges and gaps are identified and addressed at an early stage. For example, most jurisdictions actively rectify observed deviations from the Basel III framework through amending their domestic regulations in the course of the BCBS consistency assessment.
■ Workshops, peer reviews, technical assistance and capacity building are being used by the FSB, SSBs and other international bodies to facilitate the sharing of experiences and overcome challenges in implementation of reforms.
■ To reduce overlapping demands and to assist in the effective prioritisation of monitoring efforts, the FSB is developing a ‘heat map’ of resources for upcoming monitoring work.
3. Overall effects of reforms The FSB, in collaboration with SSBs, is working to enhance the analysis of the effects of reforms, including whether the reforms are working together as intended. ■ With the main elements of the post-crisis reforms agreed and implementation of some core
reforms (such as Basel III) well underway, initial analysis of their possible effects is now becoming feasible. The analysis indicates that those reforms have enhanced resilience and hence the financial system’s ability to absorb shocks and support growth. Other reforms, some of which interact with earlier reforms, remain at an earlier stage of implementation.
■ The challenges highlighted in the 2015 report of evaluating whether the reforms are having their intended long-run effects remain relevant.10 Possible approaches to address these challenges and to refine the framework for evaluating the effects of reforms were discussed at an FSB workshop in May 2016 (Annex 1, Box 3).
■ Given these factors and with implementation still ongoing (see Section 2), the findings below will continue to be updated and enhanced in future reports.
3.1 Building a more resilient financial system
The core of the global financial system – its largest cross-border banks – is considerably stronger today than before the crisis (Graph 12). ■ Banks have built higher and better quality capital buffers, largely through retained
earnings. They now have significantly lower leverage than before the crisis. All internationally active banks have fully met the Basel III capital requirements ahead of the 2019 deadline, while continuing to pay out dividends and engage in share buybacks.11
■ Funding profiles have improved especially for those banks most affected by the crisis (Graph 13), both due to less reliance on short-term wholesale funding (replaced by more stable sources, such as deposits) and as a result of having more liquid assets (particularly government bonds and, in some cases, central bank reserves). Exceptionally accommodative monetary policies may also have contributed to this outcome, which
10 They include: separating the effects of reforms from other factors, such as unconventional monetary policies;
distinguishing temporary from permanent effects; linking micro/sectoral indicators of progress with macro-level objectives; comparing short-term costs (which are easier to measure) to the accreting benefits in terms of financial crises avoided or tempered; and selecting appropriate reference points and counterfactuals for assessing outcomes.
11 See the Basel III monitoring report by the BCBS (March 2016) and the speech on Market liquidity and bank capital by Shin (April 2016).

20
reduces banks’ exposure to market fluctuations and susceptibility to runs. The adjustment process is ongoing and authorities continue to monitor progress in meeting LCR and NSFR.
■ More robust prudential requirements, more intensive supervision and increased risk awareness have led to improvements in banks’ risk management, governance and compensation structures that have helped reduce incentives for excessive risk-taking.12
Banking sector resilience Graph 12
Banks have increased their capital ratios mainly throughretained earnings, while dividend payout ratios have remained broadly stable
G-SIBs have reduced their leverage while risk weights have begun to increase in recent years1
Risk-based capital ratios (Percent) Dividend payout ratio (Percent) Percent Percent
1 The G-SIBs shown in this graph are the ones that were identified in November 2015. Left panel: Evolution of fully phased-in common equity tier 1 (CET1) capital ratio of the BCBS “Group 1” banks (i.e. banks thathave Tier 1 capital of more than €3 billion and are internationally active), and its decomposition into retained earnings’accumulation, new equity raised, and changes in risk weighted assets (RWAs). The figure for 2009 is based on the initial BaselIII proposal and there is no data for 2010. The figure for 2015 is for end-June. Dividends as a proportion of after-tax profits paid by these banks over the same time period is also shown. Source: March 2016 BCBS Monitoring Report. Right panel: Bank leverage (total assets to tier 1 capital) and risk weights (risk-weighted assets to total assets) of G-SIBs. Source: Bankscope.
Banks are still in the process of adjusting their structures and business models in response to the new operating environment, in search of sustainable profitability (Graph 13).
12 See the FSB thematic peer reviews on supervisory frameworks and approaches for SIBs (April 2015) and risk governance
(February 2013), and the FSB progress report on compensation practices (November 2015).
0
2
4
6
8
10
0
10
20
30
40
2009 2010 2011 2012 2013 2014 2015
2009 CET1 capital ratio2011 CET1 capital ratioEquity raised (cumulative contribution since 2011)Risk weighted assets (cumulative contribution since 2011)Retained earnings (cumulative contribution since 2011)Dividends paid (Portion of profit after tax) (RHS)
10
20
30
40
50
60
70
10
20
30
40
50
60
2001 2003 2005 2007 2009 2011 2013 2015
Leverage (avg, LHS)Leverage (max, LHS)Risk weights (avg, RHS)Risk weights (min,RHS)

21
Changes in banking structures and profitability Graph 13
Most G-SIBs have reduced trading and interbanklending, and increased loans and securities holdings
Many G-SIBs in Europe and the US have increased customer deposits and reduced other funding sources
Percent of bank assets Percent of bank funding liabilities
G-SIBs’ share in global banking assets has declinedslightly, but their balance sheets remain large
Large banks' profitability has recovered in recent years, but there are differences across regions
Percent of bank assets Total assets (USD trillion) Return on equity (percent, weighted average)
Top panels: Balance sheet structure in 2006 and 2015 of those G-SIBs that were identified in November 2015, grouped by jurisdiction (CN=China, JP=Japan, US=United States) and region (Europe). Those banks that do not have data available forboth 2006 and 2015 (i.e. Group BPCE, Goldman Sachs, Unicredit, Bank of New York Mellon) are excluded. “Other assets”includes cash, derivatives and repos, while “funding liabilities” exclude other liabilities and equity. All figures are weighted averages of the balance sheet structure of all banks. Source: Bankscope Bottom left panel: Evolution of average asset size of G-SIBs in absolute terms by region and overall as a proportion of globalbanking assets. Source: Bankscope and FSB Global Shadow Banking Monitoring Report 2015 (November 2015). Bottom right panel: Return on equity for all global banks with total assets exceeding US$100 billion as of end-2015, weighted by total assets and grouped by region. Asia Pacific (AP) advanced=Australia/Hong Kong/Japan/Korea/Singapore, EU=Europe,NA=Canada/US, EM=Emerging Markets (Brazil/China/India/Malaysia/Mexico/Qatar/Russia/Saudi Arabia/Taiwan/Turkey/UAE). For the AP advanced region, an outlier bank was removed from the sample for 2003. Source: Bankscope.
0
20
40
60
80
100
JP JP Europe Europe US US CN CN2006 2015 2006 2015 2006 2015 2006 2015
Customer LoansTrading AssetsOther assets
Interbank LoansNon-trading securities
0
20
40
60
80
100
JP JP Europe Europe US US CN CN2006 2015 2006 2015 2006 2015 2006 2015
Customer DepositsLong-term funding
Short-term wholesale fundingOther funding liabilities
25
30
35
40
0.5
1.0
1.5
2.0
2.5
07 09 11 13 15All G_SIBs: Average total assets (RHS)
CN: Average total assets (RHS)
Europe: Average total assets (RHS)
JP: Average total assets (RHS)
US: Average total assets (RHS)
Total assets of G-SIBs to total global banking assets (LHS)
–10
–5
0
5
10
15
2001 2003 2005 2007 2009 2011 2013 2015
All banks with total assets exceeding $100 bnAP advancedEM
EUNA

22
■ Business models based on high leverage, riskier trading activities and over-reliance on wholesale lending and funding have diminished, as intended, and are being replaced by models with a greater focus on retail banking. Banks are also shrinking less profitable business lines and some of them have scaled back foreign activities (see Section 4).13 The implications of these changes for specific market segments need to be monitored carefully.
■ Business model adjustments stem from a range of factors, including investor pressures to exit low-margin businesses; regulatory reforms (which have made certain activities and structures more costly); technological changes; the low growth and interest rate environment; and restructuring conditions for banks that were rescued during the crisis.
■ G-SIBs’ share of global banking assets has declined marginally post-crisis, but their balance sheets remain large in absolute terms. Trends differ across regions: the average balance sheet size of G-SIBs in Europe and the US has remained broadly stable in recent years, while the size of Asian G-SIBs has increased.
Bank profitability has recovered in recent years, but returns on bank equity are lower in most regions than the unsustainable pre-crisis levels (Graph 14). ■ This is partly due to reforms that reduced leverage and raised the cost of unsound business
models. Other factors include inflexible cost structures, legacy issues (e.g. non-performing loans, restructuring costs, misconduct fines) and the low interest rate environment.
Drivers of bank profitability Graph 14
The post-crisis profitability of G-SIBs, particularly inEurope and the US, has been impacted by lowerleverage (compared to pre-crisis) and by legal costs
G-SIBs’ income structures and levels have not changed substantially since the crisis, but cost-income ratios are higher in most regions
Percent Percent Percent of total assets
Left panel: RoE for pre-crisis period (2004-2007) vs post-crisis period (2010-2015) for all G-SIBs by jurisdiction/region. The contributions of reduced leverage and legal costs (shown as additional bars to the post-crisis RoEs) are calculated as weighted averages for the respective regions. Source: Bankscope and “Recent trends in euro area banks’ business models andimplications for banking sector stability” in the ECB’s Financial Stability Review (May 2016). Right panel: Split of operating income into main elements (simple average for G-SIBs by region; same sample of banks as used in the other charts). Source: Bankscope.
13 See, for example, the special feature on Recent trends in euro area banks’ business models and implications for banking
sector stability in the ECB’s Financial Stability Review (May 2016).
–9
–6
–3
0
3
6
9
12
15
18
China Europe Japan United StatesRoE (avg, 2004-2007)
RoE (avg 2010-2015)
Contribution of higher pre-crisis leverage
Contribution of legal costs
20
30
40
50
60
0
1
2
3
4
Japan Japan EuropeEurope US US China China2007 2015 2007 2015 2007 2015 2007 2015
Cost-to-income ratioLhs:
Net interest incomeNet fees and comissionNet other operating income
Rhs:

23
For many banks, these factors contribute to low market-to-book valuations (Graph 15). ■ Shareholders’ return expectations are still adjusting to the improvements in bank resilience
and the lower risk-free rates. ■ Recent bouts of market volatility in part reflect concerns that many banks also have to do
more to adjust their long-term business models to a lower growth and nominal interest rate environment, and strengthened international regulatory framework.
Changes in banks’ market valuations Graph 15
Banks’ market-to-book ratios have dropped considerably in the pre-crisis period…
… but they also vary widely within the same region
Ratio By country/region in 2015
Left panel: Aggregates are calculated as the total market capitalisation across institutions domiciled in a particular region,divided by the corresponding total book value of common equity. ¹ Canada, US. ² Denmark, Norway, Sweden, Switzerland, UK. ³ Brazil, Chile, China, Indonesia, Israel, Malaysia, , Taiwan, Thailand, Turkey. 4 Austria, Belgium, France, Germany, Ireland, Italy, Portugal, Spain. 5 Australia, Hong Kong, Japan, Korea, Singapore. Sources: Datastream; S&P Capital IQ; BIS calculations.Right panel: AP Advanced = Australia, Hong Kong, Japan, Korea, Singapore; Euro area = Austria, France, Germany, Italy and Spain; NA = Canada and United States; Other Europe = Sweden, Switzerland and United Kingdom. Sources: S&P Capital IQ; BIS calculations.
There is also progress in addressing other core elements of the reform programme, but more work is needed to enhance their contribution to financial system resilience (Graph 16). ■ Work is underway to enhance G-SIBs’ resolvability, including through TLAC. Recent
empirical studies suggest a possible decline in G-SIBs’ funding cost advantages since the crisis peaked but the results remain uneven, partly reflecting varying stages of implementation across jurisdictions.14 The FSB will continue to deepen its analysis on the effects of resolution-related reforms.
■ In a few jurisdictions, TR data and authorities’ estimates suggest that over half, and in two cases more than 80%, of new interest rate derivatives are being centrally cleared, although overall there remains scope for further uptake of central clearing (see Section 2.3).
■ OTC derivatives contracts are increasingly cleared by CCPs to reduce contagion risk among market participants. In doing so, the reforms have increased the systemic importance of CCPs. Work is underway by the FSB and SSBs to promote CCP resilience, recovery planning and resolvability (Annex 1, Box 4).
14 See Estimating the extent of the ‘too big to fail’ problem — a review of existing approaches by Siegert and Willison (April
2015, Bank of England Financial Stability Paper No. 32) and the two articles by Afonso and Santos in the Federal Reserve Bank of New York’s Liberty Street Economics (June 2015).
0.0
0.5
1.0
1.5
2.0
2.5
2006 2008 2010 2012 2014 2016
NA1
Other Europe2
EM3
Euro area4
AP advanced5
0
2
4
6
8
10
12
14
0 to 0.25 0.25 to 0.5 0.5 to 0.75 0.75 to1 1 to 1.25 1.25 to1.5 1.5 to1.75 1.75 to 2 2 to 3
Market-to-book ratioAP Advanced Euro area NA Other Europe

24
■ Increased risk awareness among market participants as well as stronger regulation to discourage unsustainable business practices and to align incentives of market participants have helped sharply curtail opaque and complex securitised products.
Other measures of financial system resilience Graph 16
Complex securitisation products have declined since the crisis
Central clearing of OTC interest rate and credit derivatives has increased in recent years
Amount outstanding, USD trillion EUR trillion EUR trillion
Left panel: Data from “Structured Finance” category, total outstanding by category at year-end. ABCP=Asset-backed Commercial Paper, CDOs=Collaterised Debt Obligations, CMBS=Commercial Mortgage-Backed Securities, RMBS=Residential Mortgage-Backed Securities. Source: Federal Reserve, SIFMA. Right panel: Six-month moving average of volumes in OTC interest rate and credit derivatives cleared by selected US and European CCPs, as of June 2016. Source: FSB, 11th Progress Report on the implementation of OTC derivatives market reforms.
■ Some evidence suggests that the level of interconnectedness between banks and other
financial institutions may have declined since the crisis,15 but the implementation of shadow banking reforms is still at too early a stage to be able to assess their effects. A continued focus on addressing potential risks associated with market-based finance and asset management activities is needed.
3.2 Supporting sound financial intermediation
The improvement in bank resilience has been achieved while maintaining the overall provision of credit to the real economy (Graph 17). ■ Overall, banks have met the higher capital requirements without cutting back sharply on
the level of lending. Recent research and supervisory analysis indicate that higher bank capitalisation (within a reasonable range) has been associated with lower cost funding and more robust and higher lending over time, underscoring the importance of resilient banks in supporting the recovery.16
15 See Section 3.2 of the FSB Global Shadow Banking Monitoring Report 2015 (November 2015). 16 See Why bank capital matters for monetary policy by Gambacorta and Shin (BIS Working Paper No 558, April 2016), the
BCBS Research Task Force’s Literature review on integration of regulatory capital and liquidity instruments (March 2016), and Sections 4.1.2 and 6.1 of the European Banking Authority’s Report on SMEs and SME supporting factor (EBA/OP/2016/04, March 2016).
0
1
2
3
1997 2000 2003 2006 2009 2012 2015
US non-agency CMBS & RMBSGlobal CDOs backed by Structured FinanceUS ABCP
10
20
30
40
50
60
0.6
0.8
1.0
1.2
2010 2011 2012 2013 2014 2015 2016
Interest Rate Derivatives (LHS)Credit Derivatives (RHS)

25
■ Following a sharp decline after the crisis, both total and bank lending growth have resumed in all regions, albeit at different paces. Most FSB jurisdictions continue to report no material shortage in the supply of financing.
■ The cost of financing to the real economy, whether by banks or debt markets, has remained generally low in recent years.
■ The exceptionally accommodative monetary policies coupled with the extended phase-in period of reforms and jurisdiction-specific factors may have contributed to this outcome.
Evolution of financing volumes and spreads Graph 17
Bank lending growth has now resumed in all regions,and is coming down in EMs
Total lending growth to the real economy has resumed in all regions
Year-on-year growth, percent Year-on-year growth, percent
Banks’ net interest margins have narrowed since thefinancial crisis
Corporate bond yields and spreads have stabilised in recent years at much lower levels than during the crisis
Net interest margin (Percent, simple average) Percent
Top panels: Year-on-year growth of outstanding bank lending (left) and total lending by all sectors (right) to the private non-financial sector (data as of 2015Q3). AP Advanced=Australia/Hong Kong/Japan/Korea/Singapore, Other Europe=Denmark/Norway/Sweden/Switzerland/UK, NA=Canada/US, EM=Emerging Markets (Argentina/Brazil/China/India/Indonesia/Malaysia/Mexico/Russia/Saudi Arabia/South Africa/Thailand/Turkey). Source: BIS statistics on credit to the non-financial sector. Bottom left panel: Simple average of net interest margins, based on top 1,000 global banks with assets exceeding USD 10billion. AP advanced= Australia/Hong Kong/Japan/Korea/Singapore, EU=Europe, NA=Canada/US, EM=Emerging Markets(Argentina/Brazil/Chile/China/Egypt/India/Indonesia/Mexico/Philippines/Russia/Saudi Arabia/South Africa/Taiwan/Thailand/Turkey/UAE). Source: Bankscope. Bottom right panel: BBB-rated corporate bond yields and spreads (relative to yield on 10-year Treasuries). Source: Moody’s.
–10
–5
0
5
10
15
20
25
01 02 03 04 05 06 07 08 09 10 11 12 13 14 15
AP AdvancedEM
Other EuropeEuro area
NA
–5
0
5
10
15
20
25
01 02 03 04 05 06 07 08 09 10 11 12 13 14 15
AP AdvancedEM
Other EuropeEuro area
NA
0
1
2
3
4
00 01 02 03 04 05 06 07 08 09 10 11 12 13 14 15
AllbanksEM
AP advanced EU NA
0
2
4
6
8
00 01 02 03 04 05 06 07 08 09 10 11 12 13 14 15 16
Corporate bond yield (BBB rating)Corporate bond spread (BBB)

26
Non-bank credit intermediation has grown post-crisis in a number of countries (Graph 18).17 ■ Non-bank financial intermediation has grown in several advanced economies (particularly
in Europe) and EMDEs since the crisis, and now represents about 40% of total financial system assets in 20 jurisdictions and the euro area. Growth was most rapid in EMDEs but from a low base, given their bank-centric systems.
■ The most rapid asset growth was experienced by trust companies as well as money market, fixed income and other funds. Growth was due in part to a substantial increase in non-bank credit intermediation, largely from capital markets.
■ The size of jurisdictions’ non-bank financial sectors relative to their economies varies widely and appears to be related to their degree of financial intermediation and deepening. The growth in these sectors has been associated with economic growth in recent years.
■ Underlying drivers may include long-term structural (e.g. demographics leading to asset accumulation) and conjunctural (e.g. accommodative monetary policies, declining risk aversion and search for yield) factors. Regulatory reforms may also have contributed to this growth by increasing the relative cost of bank-based finance.18
■ The shift toward more market-based finance represents a welcome increase in diversity of the sources of finance supporting economic activity, but will need to be matched with appropriate measures to address any associated financial stability risks (see Section 4.1).
Growth in non-bank credit intermediation Graph 18
The portion of credit granted outside the banking sector has increased in the Euro area and EMs
Credit granted by insurers as well as pension and investment funds has grown steadily in recent years
Percent USD trillion
Left panel: Portion of credit to private non-financial corporates granted by non-banks (debt securities, including bonds and short-term paper as well as currency/deposits) vs total credit to private non-financial corporates. Source: BIS Credit to non-financial sector. Right panel: Total credit (loans and receivables, debt securities, and other credit-related assets, e.g. government debt and other debt instruments, excluding intercompany receivables) by insurance companies and pension funds other financialinstitutions. Source: FSB Global Shadow Banking Monitoring Report 2015.
17 See, for example, the speech on The future of financial reform by Carney (November 2014), the 2015 BIS annual report,
Assessing shadow banking – non-bank financial intermediation in Europe by Grillet-Aubert and others (July 2016, ESRB Occasional Paper No. 10), and the FSB Global Shadow Banking Monitoring Report 2015.
18 See, for example, chapter 2 of the IMF’s October 2014 Global Financial Stability Report, the speech on The age of asset management by Haldane (April 2014); and Financial structure and growth by Gambacorta and others (March 2014).
0
20
40
60
80
2003 2005 2007 2009 2011 2013 2015
AP advanced EM Euro area
NA Other Europe
0
5
10
15
2009 2010 2011 2012 2013 2014
Insurance companies and pension funds Fixed income fundsFinance companies, Hedge funds, Other funds, Broker dealers

27
4. Areas for attention This section highlights areas that merit ongoing attention regarding the possible interactions and effects of the reforms. ■ The monitoring of progress, challenges in implementation and the adjustment of policy
measures to address material unintended consequences represent good regulatory practice and form an important part of ensuring the accountability of the FSB and SSBs.
■ The FSB has identified three areas for ongoing attention regarding the effects of reforms, which have been subject to ongoing analysis since 2015: market liquidity; effects of reforms on EMDEs; and maintaining an open and integrated global financial system.
4.1 Market liquidity
Last year’s report noted concerns that liquidity in some fixed income markets has declined in recent years. These concerns arise at a time when market-based finance is increasing. ■ The growth of market-based finance means that pricing and trading conditions in fixed
income markets have a stronger bearing on credit supply and overall financing conditions, and hence on economic output.
The FSB has reviewed preliminary evidence on liquidity in corporate and sovereign fixed income markets, their possible drivers, and their potential impacts on primary issuance, the efficiency of price discovery and the resilience of markets during stress. A number of changes are taking place in secondary fixed income markets that may impact liquidity and require further analysis (Graph 19). ■ The role of the asset management industry in fixed income markets has grown significantly
since the financial crisis, albeit from a modest level. While investment funds have tended to be relatively stable investors during prior periods of stress, their redemption terms could give rise to large demands for liquidity over very short time windows in secondary markets.19
■ Regulatory reforms to make banks more resilient have increased the costs of dealer banks’ market-making activities, including liquidity provision. Less abundant liquidity in normal times was a recognised cost of building more resilient banks.
■ At the same time, technological changes are modifying trading arrangements in these markets, with growth in electronic trading and venues. This has facilitated an expansion of automated, high-frequency trading in some markets, with non-bank participants accounting for a growing share of trading (particularly in sovereign bond markets).
■ Accommodative monetary conditions have likely eased market liquidity across many fixed income markets. At the same time, low interest rates have contributed to reduced dealer profitability from holding securities on their balance sheets.
19 The FSB published in June 2016 for public consultation a set of proposed policy recommendations to address structural
vulnerabilities from asset management activities. These seek to address potential financial stability risks relating to liquidity mismatch, leverage, operational risks and securities lending activities.

28
Volume and electronic trading20 of fixed income markets Graph 19
Primary fixed income market activity has been substantial globally since the crisis, e.g. for US Treasuries and corporate bonds
The level of electronic trading has increased in all markets, albeit from different starting points
Issuance (USD trillion) Amount outstanding (USD trillion) Percent of transactions
To date, there is limited evidence that the above changes have led to a broad deterioration in market liquidity conditions in normal times (Graph 20). ■ In most cases, price-based measures of market liquidity in cash sovereign and corporate
bond markets have remained within historical ranges, including in periods of higher underlying market volatility. In some cases, they have improved since the crisis.
■ The transition to electronic trading with greater pre-trade transparency, and, particularly automated, high-frequency trading in some sovereign bond markets, may have contributed to reduced bid-ask spreads in normal times.
■ Overall, the efficiency of price discovery in fixed income markets has been maintained or improved. However, pricing anomalies in some cases have been observed in related markets (e.g. cash and derivative markets).21 These may reflect higher liquidity costs or less ample financing for investors arbitraging markets.
20 See BIS Markets Committee, 2016, Electronic trading in fixed income markets for a definition of the term ‘electronic
trading’. This term covers both trades conducted on electronic trading platforms as well as high frequency trading. 21 See, for example, Bank of England, Financial Stability Report, July 2016, Charts E/F (p. 30).
0.0
0.5
1.0
1.5
2.0
2
4
6
8
10
12
1997 2000 2003 2006 2009 2012 2015
US Treasuries: Amout outstandingUS Corporate Bonds: Amount oustandingUS Treasuries: IssuanceUS Corporate Bonds: Issuance
0
20
40
60
Corporate Corporate Repos European USHY cash IG cash government Treasuries
bonds
2012 2015
Left panel: US sovereign and corporate bonds issued and outstanding. Source: SIFMA. See also Graph 20 (right panel). Right panel: State of electronic trading of fixed income markets. Source: BIS Markets Committee, 2016, Electronic trading in fixed income markets.

29
Bid-ask spreads in fixed income markets remain low in historic terms Graph 20
Bid-ask spreads of government bonds have been fairlyconstant, with spikes during periods of volatility
Corporate bid-ask spreads remain subdued
256th of a point Basis points
However, there is some evidence of less depth in certain markets, potentially indicating less resilience of liquidity under stressed market conditions (Graph 21). ■ More automated, high-frequency trading in sovereign bond markets, increased post-trade
transparency in corporate bond markets and less dealer bank market making have been associated by some observers with a decline in trade sizes in those markets. 22 Market intelligence suggests that in certain sovereign bond markets, the price impact of larger trades may have risen and executing such trades without price impact may take longer than before. However, in other markets, there is evidence that the price impact of larger trades is within historical ranges.
■ In recent years, in repo markets there have been some signs of a decline in volumes (such as in the UK and, to a lesser degree, the US, but not in the Euro area or in Japan) and an increase in relative borrowing costs.23 Although poor risk management in repo markets was a source of contagion during the financial crisis, these markets play an important role in facilitating the flow of cash and securities around the financial system and in financing trading and investor positioning. A decline in repo volumes or a rise in its costs may also impact other fixed income markets in terms of pricing and market depth.
■ In some markets, the composition of participants has changed significantly. For example, in on-the-run cash US Treasuries, principal trading firms now account for more than half of trading volumes. The implications of this shift in market participation are not yet fully understood.24
22 See BIS Markets Committee, 2016, Electronic trading in fixed income markets, Graph 8. 23 See Bank of England, Financial Stability Report, July 2016, Chart B.11 (Volume, p.23) and Chart C (spread between three-
month government bond repo and three-month overnight indexed swap rates, p. 29). 24 See the July 2015 Joint Staff Report on The U.S. Treasury Market on October 15, 2014 and the January 2016 CGFS paper
on Fixed income market liquidity for an analysis of the “flash rally” in the US Treasury market during 15 October 2014.
0
2
4
6
8
2006 2007 2008 2009 2010 2011 2012 2013 2014 2015
US Treasuries (10-year)
0
20
40
60
2006 2007 2008 2009 2010 2011 2012 2013 2014
EUR Corporate USD Corporate
Left panel: Spreads for US Treasuries in the inter-dealer market; in 256ths of a point, equivalent to about 0.39 cents per US$100 face value (par). Source: Committee on the Global Financial System (CGFS), 2016, Fixed income market liquidity. Right panel: Evolution of corporate bid-ask spreads. Source: BIS, Quarterly Review March 2015, Shifting tides - market liquidity and market-making in fixed income instruments.

30
Market liquidity conditions: market depth Graph 21
The price impact of large trades in US Treasuries are within historical range1
Volumes of repo financing by primary US dealers have declined
Basis points Basis points USD billion
The reforms have reduced the likelihood that a deterioration in market liquidity could result in wider financial stability problems. ■ The greater capital strength and more resilient funding of core financial intermediaries
mean that market liquidity erosions would be less likely to have systemic implications than in the past.
■ But less resilient liquidity in secondary fixed income markets may reduce primary issuance in these markets, and hence affect the flow of credit from these markets.
Continued monitoring and further analysis of market liquidity conditions, including during periods of stress, are warranted. ■ Fixed income markets are undergoing structural changes (some of which began before the
crisis), reflecting technological innovation affecting trading arrangements and conditions, post-crisis changes to dealer-bank business models, and the large expansion of the asset management industry. It is difficult to reliably attribute changes in market liquidity conditions in different segments, if any, to specific drivers. Similarly, it is hard to project how market conditions might evolve as the structure of the system moves to a new normal.
■ The FSB and its members will undertake more active monitoring and analysis, especially of changes in market depth and funding liquidity conditions.25 Given the important role of the repo markets in the financial system, a cross-jurisdiction study of developments in repo markets will be undertaken by the CGFS. FSB members will also study further developments in the trading infrastructure and technology in fixed income markets.
25 This will take into account related work undertaken by various FSB jurisdictions as well as SSBs – see, for example IOSCO’s
August 2016 consultation report on Examination of Liquidity of the Secondary Corporate Bond Markets.
0
2
4
6
8
10
0
20
40
60
2005 2007 2009 2011 2013 2015
US Treasuries (2 years, LHS)US Treasuries (5 years, RHS)US Treasuries (10 years; RHS)
0
1,000
2,000
3,000
4,000
1991 1994 1997 2000 2003 2006 2009 2012 2015
Dealer Assets (USD Billion)
1 Price change per $1 billion net order flow; monthly averages. Left panel: Price impact of large orders for US Treasuries with different maturities. Source: CGFS, 2016, Fixed income market liquidity. Right panel: Repo financing by primary US dealers. Source: US Federal Reserve Bank of New York.

31
■ In addition, the FSB will continue its work, including through stress simulations by some of its member authorities, to assess how the behaviours of institutional investors that demand and supply liquidity may affect market resilience during periods of acute stress.
4.2 Effects of reforms on EMDEs
To date, EMDEs have not reported major unintended consequences from implementing the reforms, though global banks are reducing their presence and activities in EMDE markets. ■ Evidence on the effects of reforms in EMDEs remains predominantly qualitative, reflecting
the still early stage of implementation and challenges in separating the effects of reforms from broader post-crisis developments. Implementation challenges and possible effects of reforms were discussed at the FSB’s second EMDEs Forum in March 2016.
■ Some EMDEs report continuing concerns about cross-border spillovers that may be reducing the presence and activities of global banks in their domestic markets. These concerns arise in part as global banks reassess their business models. They also reflect how home jurisdictions of hosted global banks are implementing the reforms (e.g. consolidation practices), or national measures to improve financial stability that go beyond internationally agreed standards (e.g. structural banking reforms).
■ Some EMDEs have asked for additional international guidance on implementation of standards to address the above issues. They also called for guidance on how proportionality could be applied with respect to agreed OTC derivatives reforms and on bilateral recognition/equivalence assessments.
The FSB, in collaboration with SSBs and international financial institutions, is monitoring the effects of regulatory reforms on EMDEs and following up on issues that arose in their implementation. ■ The FSB issued guidance in November 2015 on cooperation and information sharing with
host authorities of jurisdictions where a G-SIFI has a systemic presence in a jurisdiction that is not represented on its crisis management group.
■ Taking into account the impact of the TLAC standard on EMDEs, a longer conformance period was permitted for G-SIBs headquartered in EMDEs.
■ The FSB examined resolution-related reforms in recent peer reviews of EMDE members (Russia, Saudi Arabia, Turkey) and made recommendations to address identified gaps.
■ FSB Regional Consultative Groups have held workshops and set up working groups to examine the implementation of reforms (e.g. shadow banking, trade reporting) from a regional perspective.
■ As a follow-up to the EMDEs Forum, the FSB jointly with IOSCO will hold a workshop in October 2016 for jurisdictions to share experiences in OTC derivatives market reforms, including determining whether certain OTC derivative products are sufficiently standardised for central clearing or trading on exchanges, thereby facilitating a common understanding of implementation.
Work is also underway by the FSB and other international bodies to assess and address the decline in correspondent banking. ■ International banks’ withdrawal of correspondent banking services in some countries,
while not an effect of agreed post-crisis reforms, is an issue that affects many EMDEs. ■ Loss of such services can create financial exclusion, particularly where it affects flows such
as remittances, and can drive some payment flows underground, which would make it harder for authorities to prevent financial crime and the financing of terrorist activity.
■ The FSB is coordinating work, in partnership with other organisations, to implement an action plan to assess and address the decline in correspondent banking (Annex 1, Box 5).

32
4.3 An open and integrated global financial system
The evidence suggests that the reforms have helped to avoid significant retrenchment and market fragmentation, which were common features of past financial crises. ■ An open and integrated financial system contributes to the allocation of global savings
across countries. It can also enhance financial deepening, risk sharing and diversification across institutions and markets, with positive effects on investment and growth.
■ The FSB and SSBs have been working to avoid cross-border retrenchment and market fragmentation by:
■ strengthening or developing new international standards – to promote confidence and a level playing field;
■ adopting a robust approach to monitoring and reporting on implementation – to identify and address implementation challenges and unintended effects; and
■ promoting cross-border cooperation – to deal with any spillovers.
■ The financial crisis has slowed down, but not reversed, the long-term trend of higher global financial integration; in fact, empirical evidence suggests that such integration has increased in recent years (Graph 22).26
■ While the reforms do not target a particular level of financial integration, their consistent implementation is critical to the maintenance of open markets and sustainable cross-border financing.
Measures of global financial integration Graph 22Global foreign assets and liabilities have continued togrow after the financial crisis, albeit at a slower pace
Gross capital flows appear to have stabilised at a lower level compared to the pre-crisis period
USD trillion Percent of global GDP
Left panel: Global foreign assets and liabilities. Source: IMF Global Financial Stability Report (April 2016). Right panel: Gross capital flows (including inflows and outflows of direct portfolio and other investments, and change inreserve assets). Advanced economies (AE) include Australia, Canada Denmark, Euro area, Hong Kong, Japan, Korea, NewZealand, Norway, Singapore, Sweden, Switzerland, UK and US. Emerging markets (EM) include economies from emerging Asia(China, Chinese Taipei, India, Indonesia, Malaysia, Philippines, Thailand), Latin America (Argentina, Brazil, Chile, Colombia,Mexico, Peru) and other (Czech Republic, Hungary, Poland, Russia, Saudi Arabia, South Africa, Turkey). Source: presentationon More pluralism, more stability? by Borio based on IMF World Economic Outlook data.
26 Financial integration typically encompasses financial openness, free cross-border movement of capital and integration of
financial services. See the report on Strengthening the International Monetary System – A Stocktaking by IMF staff (March 2016).
0
100
200
300
1998 2000 2002 2004 2006 2008 2010 2012 2014
DebtForeign direct investmentPortfolio investment
DerivativesReserves
1
2
3
4
2001 2003 2005 2007 2009 2011 2013 2015
AE EM
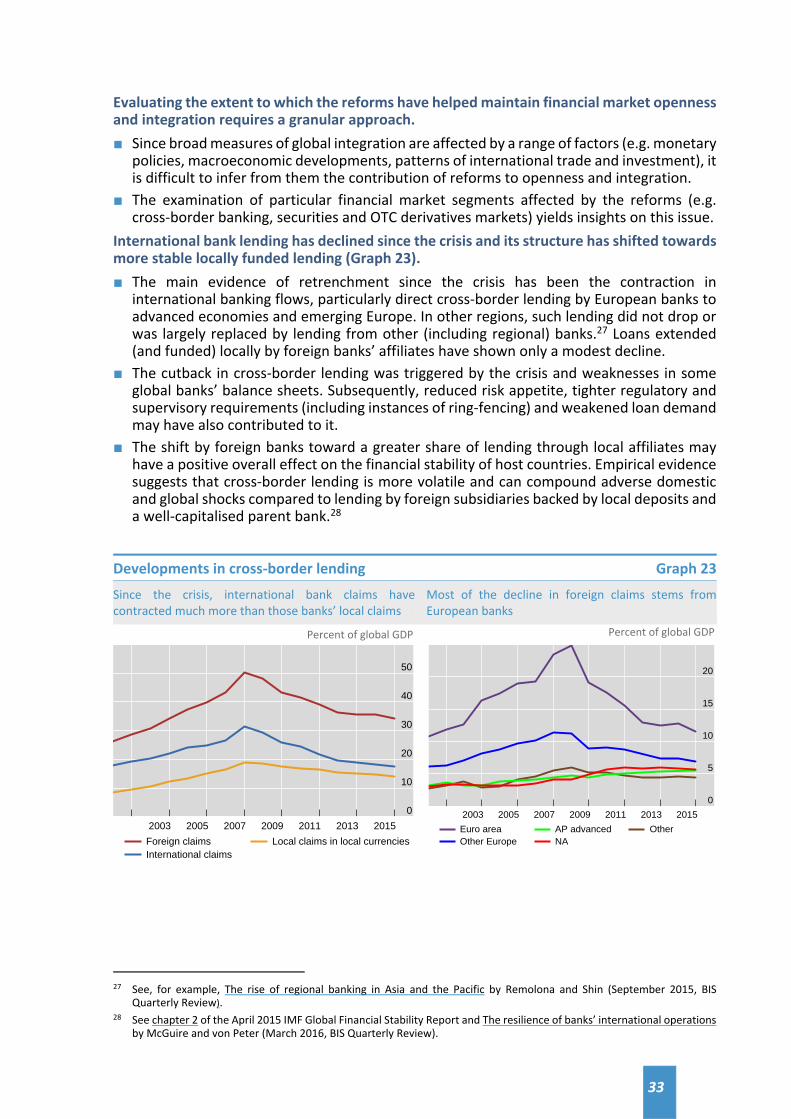
33
Evaluating the extent to which the reforms have helped maintain financial market openness and integration requires a granular approach. ■ Since broad measures of global integration are affected by a range of factors (e.g. monetary
policies, macroeconomic developments, patterns of international trade and investment), it is difficult to infer from them the contribution of reforms to openness and integration.
■ The examination of particular financial market segments affected by the reforms (e.g. cross-border banking, securities and OTC derivatives markets) yields insights on this issue.
International bank lending has declined since the crisis and its structure has shifted towards more stable locally funded lending (Graph 23). ■ The main evidence of retrenchment since the crisis has been the contraction in
international banking flows, particularly direct cross-border lending by European banks to advanced economies and emerging Europe. In other regions, such lending did not drop or was largely replaced by lending from other (including regional) banks.27 Loans extended (and funded) locally by foreign banks’ affiliates have shown only a modest decline.
■ The cutback in cross-border lending was triggered by the crisis and weaknesses in some global banks’ balance sheets. Subsequently, reduced risk appetite, tighter regulatory and supervisory requirements (including instances of ring-fencing) and weakened loan demand may have also contributed to it.
■ The shift by foreign banks toward a greater share of lending through local affiliates may have a positive overall effect on the financial stability of host countries. Empirical evidence suggests that cross-border lending is more volatile and can compound adverse domestic and global shocks compared to lending by foreign subsidiaries backed by local deposits and a well-capitalised parent bank.28
Developments in cross-border lending Graph 23Since the crisis, international bank claims havecontracted much more than those banks’ local claims
Most of the decline in foreign claims stems from European banks
Percent of global GDP Percent of global GDP
27 See, for example, The rise of regional banking in Asia and the Pacific by Remolona and Shin (September 2015, BIS
Quarterly Review). 28 See chapter 2 of the April 2015 IMF Global Financial Stability Report and The resilience of banks’ international operations
by McGuire and von Peter (March 2016, BIS Quarterly Review).
0
10
20
30
40
50
2003 2005 2007 2009 2011 2013 2015
Foreign claimsInternational claims
Local claims in local currencies
0
5
10
15
20
2003 2005 2007 2009 2011 2013 2015
Euro areaOther Europe
AP advancedNA
Other

34
European banks have cut back sharply their foreignclaims to advanced economies since the crisis
Foreign claims to emerging economies have increased in recent years, except for the European banks
Percent of global GDP Percent of global GDP
Top left graph: Foreign claims are BIS reporting banks’ worldwide consolidated financial claims on counterparties outsidetheir home country. International claims are cross-border claims booked from all offices plus locally booked claims in foreigncurrencies booked in host countries. Local claims in local currencies are claims booked by banks’ foreign affiliatesdenominated in the local currency of the host country vis-à-vis counterparties in the same host country. Top right graph: Foreign claims by banks based on their residence; AP Advanced=Australia/Japan, Euroarea=Belgium/France/Germany/ Italy/Netherlands/Spain, Other Europe=Switzerland/UK, NA=Canada/US, Other=all otherreporting countries. Bottom left graph: Foreign claims to advanced economies from banks in different regions (by residence). Europe=Euro areaand other Europe (as defined above). Bottom right graph: Foreign claims to emerging economies from banks in different regions (by residence). All graphs use annual data (average of quarterly data for each year), which reduces the impact of gaps and breaks in the datastemming from, for example, bank mergers or changes in the reporting population. Source: The resilience of banks’international operations by McGuire and von Peter (March 2016, BIS Quarterly Review), based on BIS consolidated statistics(immediate borrower basis) and IMF.
The global integration of securities markets continues to grow (Graph 24). ■ This is illustrated by increased levels of international bond issuance by non-financial
corporates and cross-border holdings of securities,29 as well as by the greater use of global financial infrastructures for trading, settlement and clearance.
The introduction of reforms for OTC derivatives has not resulted in disruption of global markets for these products. ■ The implementation of requirements in a number of FSB jurisdictions to promote more
central clearing and exchange/platform trading of OTC derivatives does not appear to have compromised risk intermediation. There is evidence of improved liquidity in the interest rate swap market, notwithstanding some signs of geographical segmentation.30
■ Several jurisdictions have taken steps to facilitate cross-border activity under new post-crisis regulations, such as through allowing for decisions on deference to foreign regulations and recognition of foreign CCPs. It is important for authorities to continue to use various tools to address potential cross-border regulatory issues.
29 See also the FSB’s report to the G20 on Corporate Funding Structures and Incentives (August 2015). 30 See Benos and others, January 2016, Centralized trading, transparency and interest rate swap market liquidity: evidence
from the implementation of the Dodd-Frank Act, Bank of England Staff Working Paper No. 580.
0
10
20
30
2001 2003 2005 2007 2009 2011 2013 2015
European banksNorth American banksAsia-Pacific banks
Other banking systems
0.0
1.5
3.0
4.5
2001 2003 2005 2007 2009 2011 2013 2015
European banksNorth American banksAsia-Pacific banks
Other banking systems

35
Developments in cross-border securities markets activity Graph 24Holdings of local bonds by foreign investors haveincreased globally since the crisis
Net issuance of international debt securities by non-financial corporates has grown since the crisis
USD trillion USD billion USD billion
Left panel: AP Advanced=Australia, Hong Kong, Japan, Korea, New Zealand, Singapore; EM=Argentina, Brazil, China, Colombia,Indonesia, India, Mexico, Malaysia, Peru, the Philippines, Russia, Saudi Arabia, Thailand, Turkey, South Africa, Euroarea=Austria, Belgium, Germany, Estonia, Spain, Finland, France, Greece, Ireland, Italy, Lithuania, Luxembourg, Latvia, theNetherlands, Portugal, Slovenia, Slovakia; Other Europe=Switzerland, Denmark, UK, Norway, Sweden, NA=Canada, US;Source: IMF International Financial Statistics. Right panel: International debt securities issued by non-financial corporations (net issuance, all instruments, all maturities)by nationality of issuer. Source: BIS Debt securities statistics.
The FSB will continue to monitor the effects of reforms on financial integration and work with SSBs to promote cooperation and build trust among its members.
0
10
20
30
2001 2003 2005 2007 2009 2011 2013 2015
AP advancedEM
Euro areaOther Europe
NA
0
100
200
300
400
500
1,00
2,00
3,00
4,00
5,00
2001 2003 2005 2007 2009 2011 2013 2015
Amount outstanding (year end) (RHS)Debt issued (total per calendar year) (LHS)

36
ANNEX 1: SUPPLEMENTARY INFORMATION
Box 1: Findings from March 2016 FSB thematic review on bank resolution regimesThe peer review examined the range and nature of resolution powers available to authorities for the banking sector in FSB jurisdictions, as well as any requirements for recovery and resolution planning and resolvability assessments for domestically incorporated banks. The main findings were: ■ Only a subset of the FSB membership – primarily home jurisdictions of G-SIBs –
currently have a bank resolution regime with a comprehensive set of powers broadly in line with the FSB’s Key Attributes of Effective Resolution Regimes for Financial Institutions (Key Attributes). The bank resolution powers that are most often lacking are explicit continuity powers, bail-in powers, and powers to impose a temporary stay on the exercise of early termination rights. The reforms underway in a number of FSB jurisdictions address some, but not all, of the gaps in bank resolution powers.
■ While resolution regimes generally apply to all types of commercial banks, the coverage of holding companies of banks, branches of foreign banks and material non-regulated operational entities within a financial group is more variable across FSB jurisdictions.
■ There is significant variation across FSB jurisdictions in the conditions for the use of resolution powers and their level of detail.
■ More progress has been made on recovery planning compared to resolution planning or resolvability assessments. Only nine jurisdictions currently have explicit statutory powers to require banks to adopt appropriate measures to improve their resolvability.
The review made recommendations to FSB jurisdictions to address identified gaps so as to fully implement the Key Attributes. These involve: introducing missing powers in bank resolution regimes; reviewing and extending as necessary the scope of those regimes; introducing recovery and resolution planning requirements for all banks that are potentially systemic in failure; and adopting powers to require banks to take measures to improve their resolvability. By December 2016 jurisdictions will report to the FSB what actions they have taken, or plan to take (including implementation time frames), to address these gaps. In addition, the FSB will provide additional clarification and guidance to assist jurisdictions in effective and consistent implementation, and to enhance, in collaboration with other international bodies, the sharing of experiences and practices on resolution regimes.
Box 2: Findings from May 2016 FSB thematic peer review on shadow bankingThe peer review evaluated the implementation by FSB jurisdictions of the overarching principles in the FSB Policy Framework for Strengthening Oversight and Regulation of Shadow Banking Entities. It concluded that, notwithstanding the progress made, implementation remains at a relatively early stage. More work is needed to ensure that jurisdictions can comprehensively assess and respond to potential shadow banking risks by non-bank financial entities (i.e. maturity/liquidity

37
transformation, imperfect credit risk transfer or leverage), and support FSB risk assessments and policy discussion. The review recommended that FSB jurisdictions should: establish a systematic process involving all relevant domestic authorities to assess shadow banking risks posed by non-bank financial entities or activities; address identified data gaps to be able to assess financial stability risks posed by these entities or activities, taking into account the potential materiality of those risks; remove impediments to cooperation and information-sharing between authorities, including on a cross-border basis; and review the adequacy of public disclosures by non-bank financial entities and enhance those disclosures as necessary to address identified material gaps. The FSB will continue to monitor jurisdictions’ implementation of the Policy Framework, including the above recommendations. As a follow-up to the peer review, the FSB will also work to enhance consistency in jurisdictions’ classification of non-bank financial entities into economic functions in line with the Policy Framework. In this regard, starting with the 2016 information-sharing exercise, the FSB will prepare additional implementation guidance setting out agreed methodological enhancements to the exercise and will strengthen the process of discussion and review as part of the information-sharing exercise for jurisdictions to learn from each other. The FSB will also develop approaches to help jurisdictions better monitor and assess risks from non-bank financial entities’ interconnectedness and cross-border activities; and encourage and promote the sharing of information among member authorities on policy tools and public disclosures.
Box 3: FSB workshop on effects of reforms (May 2016) In May 2016, the FSB convened national authorities, standard-setting bodies, international financial institutions, and experts from academia and think tanks to share emerging evidence on the effects of financial regulatory reforms, and to discuss current and prospective methodologies and approaches to evaluating the effects of those reforms. Participants noted a number of areas for future work. While metrics are available (e.g. banks’ capital and liquidity levels, volumes/proportion of OTC derivatives centrally cleared or electronically traded) to assess whether implementation of individual reforms has had its intended effects, more data will be needed to assess the interactions of reforms and their overall macroeconomic effects. Such data should also support analysis of the microeconomics of adjustment by market participants as well as of investor expectations and distributional effects of the reforms. More broadly, participants noted that attributing the effects that combined reforms are having on overall macroeconomic and financial conditions is empirically difficult, given the many factors shaping aggregate conditions and the lack at this stage of adequate post-implementation data. Instead, participants recommended a focus on a set of indicators of financial system-level resilience and intermediation for ongoing monitoring, complemented by deep-dives on specific aspects for financial system functioning meriting attention, such as in the case of market liquidity.
38
Over time, the evaluation framework for the assessment of effects of reforms should be refined and deepened based on experience, and should comprise: ■ further articulation of the links between reform objectives (and, where available,
expected outcomes), intermediate targets and macro aggregates. ■ a range of empirical methods to enhance the quality and reliability of estimates.
Given the early stage of development, it was considered important to leverage and further encourage the work of FSB members as well as academia/industry and to avoid circumscribing the various approaches to be explored.
■ infrastructure for policy evaluation (e.g. data, coordination between national and international evaluation work).
Box 4: FSB and SSBs’ work programme on CCP resilience, recovery and resolvabilityIn 2009, the G20 Leaders committed to ensuring that all standardised OTC derivatives contracts are cleared through CCPs. Fully realising the benefits of CCPs requires them to be subject to strong regulatory, oversight and supervisory requirements and resolution regimes. First, CCPs must be sufficiently resilient in the sense that financial resources allow them to withstand clearing member failures and other stress events to a very high probability. Second, CCPs must have recovery plans that allow them to allocate excess losses beyond prefunded resources and generate additional liquidity without putting an excessive burden on clearing members and other financial institutions. And third, there must be credible CCP resolution plans. The FSB, BCBS, CPMI and IOSCO agreed a joint workplan to coordinate their respective international policy work aimed at enhancing the resilience, recovery planning and resolvability of CCPs, and to work in close collaboration. The main deliverables are as follows: ■ Resilience: CPMI-IOSCO is drafting more granular guidance on several key aspects
of the CPMI-IOSCO Principles for financial market infrastructures (PFMI) with a view to further improving the resilience of CCPs regarding financial risk management – namely, governance, credit and liquidity stress testing, margin, a framework for a CCP’s contribution of its financial resources to losses and coverage. The guidance was issued for public consultation in August 2016.
■ Recovery planning: CPMI-IOSCO’s implementation monitoring of the PFMI has shown that there has been (to date) variable implementation of recovery planning by CCPs. In particular, a number of the CCPs assessed have not yet put in place the full set of recovery rules and procedures as required under the PFMI. CPMI-IOSCO will provide guidance to facilitate a CCP’s development of its recovery plan by building on and reiterating certain aspects of the 2014 CPMI-IOSCO report on the Recovery of financial market infrastructures. This guidance was issued for public consultation in August 2016.
■ Resolution: There must be credible resolution plans in place for systemically important CCPs, developed by the home authority of the CCP and coordinated within the CCP’s CMG or equivalent in an internationally consistent manner to avoid uncertainty and regulatory arbitrage. The FSB issued a discussion note on Essential Aspects of CCP Resolution Planning in August 2016, and will issue a consultation document on guidance or standards for CCP resolution by early 2017.

39
■ Analysis of interdependencies. Macroprudential considerations associated with the interconnectedness of CCPs and G-SIBs have come to the fore. A joint BCBS, CPMI, FSB and IOSCO study group was established in July 2015 to identify, quantify and analyse interdependencies between CCPs and major financial institutions and any resulting systemic implications. The study group launched a CCP data collection exercise in August and will issue a report in early 2017 on its findings.
Box 5: Action plan on correspondent bankingThe FSB initiated work to examine the extent and causes of banks’ withdrawal from correspondent banking and the implications for affected jurisdictions. This withdrawal is a source of concern for the international community, since it may affect the ability to send and receive international payments or drive some payment flows underground, with potential consequences on growth, financial inclusion, as well as the stability and integrity of the financial system. The November 2015 Report to the G20 on actions taken to assess and address the decline in correspondent banking presents a four point action plan that will be implemented in partnership with other organisations to: ■ further examine the dimensions of the decline and implications for financial
inclusion and financial stability, with additional data to complement the information already available and better direct policy efforts. A World Bank survey commissioned by the FSB showed that 49 jurisdictions – roughly half of those surveyed – had experienced a decline in correspondent banking services, with some regions more affected than others. Multiple causes explain the decline in correspondent banking and the other actions below target some of the drivers.
■ clarify regulatory expectations, including through more guidance by the Financial Action Task Force (FATF) and the BCBS. The FATF published in February 2016 a revised guidance for a risk-based approach on Money or Value Transfer Services, one of the areas most impacted by the decline in correspondent banking services. Draft FATF guidance on correspondent banking will be published by October, followed by revised BCBS guidance.
■ support domestic capacity-building in jurisdictions that are home to affected respondent banks: an inventory of technical assistance projects has been developed and is being mapped. One objective is to make sure that sufficient resources are available to address the capacity-building needs of jurisdictions experiencing a decline in correspondent banking. In this regard, the mapping showed that technical assistance has been recently completed or is ongoing in at least 43 affected jurisdictions. Another objective is to encourage industry actions, in particular by correspondent banks, to support improvements at respondent banks.
■ strengthen tools for due diligence by correspondent banks: the FSB will encourage implementation of the recommendations from the CPMI report on correspondent banking, such as using Know Your Customer (KYC) utilities, or improving the quality of information in payment messages. The use of the LEI will support these two initiatives, helping to standardise information in KYC utilities and potentially payment messages.

40
ANNEX 2: MONITORING FORWARD PLANNER
Reform area Monito-ring body
Monitoring activity Expected publication date
Building resilient financial institutions
BCBS
▪ Progress report on timely adoption of Basel III framework ▪ RCAP assessments of capital and liquidity standards for Argentina, Indonesia and
Korea ▪ RCAP assessments of liquidity standards for Japan (incorporating follow-up
assessment on capital), Singapore, EU, US, Switzerland, China, Brazil, Australia, Canada ▪ Industry workshop on corporate governance ▪ Basel III monitoring report
▪ 2016H2 ▪ 2016 ▪ 2016H2- 2017 ▪ 2016Q3 ▪ 2016Q3
FSB ▪ Thematic peer review on corporate governance ▪ Industry workshop on compensation practices in the securities sector (with IOSCO) ▪ Fifth progress report on compensation practices
▪ 2017Q1 ▪ 2016H2 ▪ 2017H1
Ending too-big-to-fail
FSB BCBS IAIS
▪ Resolution progress report ▪ Report on implementation of BCBS principles for effective risk data aggregation and
risk reporting ▪ Self-reporting on status of implementation of G-SII policy measures ▪ Thematic self-assessment and peer review on Insurance Core Principle 12 (winding up
and exit from the market)
▪ 2017 ▪ 2017Q1 ▪ 2017H1 ▪ 2017H2
Transforming shadow banking into resilient market-based finance
FSB IOSCO
▪ Shadow banking progress report ▪ Global shadow banking monitoring report 2016 ▪ Follow-up peer reviews on implementation of IOSCO recommendations on money
market funds and securitisation
▪ 2017 ▪ 2016Q4 ▪ 2016H2-2017
Making derivatives markets safer
FSB CPMI-IOSCO
▪ Twelfth progress report on OTC derivatives market reforms ▪ Progress report on FSB members’ plans to address legal barriers to reporting and
accessing OTC derivatives transaction data ▪ Implementation monitoring of the Principles for Financial Market Infrastructures
(PFMI) – level 1 assessment reports ▪ PFMI – level 2 assessment reports for Hong Kong and Singapore ▪ PFMI – level 3 follow-up targeted review of CCPs, including issues related to their
recovery planning
▪ 2017 ▪ 2017 ▪ 2017H1
▪ 2017 ▪ 2017
Other reform areas
FSB IOSCO IAIS
▪ Country peer reviews of Japan, Brazil, France, Argentina, Korea, Singapore, and Hong Kong
▪ Implementation Monitoring Network (IMN) survey on progress in other reform areas ▪ Report on progress in reforming major interest rate benchmarks ▪ Progress report on implementation of the recommendations in the second phase of
the Data Gaps Initiative (by the staff of the IMF and FSB Secretariat) ▪ Thematic review of WM London 4pm Fix for three currency pairs against the IOSCO
Financial Benchmarks Principles ▪ Thematic review of the implementation of the IOSCO Recommendations regarding the
Protection of Client Assets ▪ IMN survey on progress in IOSCO-related reform areas ▪ Pilot program for implementation of selected IOSCO Principles and Standards that are
relevant to BIS Global Economy Meeting (GEM) Committee jurisdictions ▪ Thematic self-assessment and peer review on solvency-related Insurance Core
Principles ▪ Thematic self-assessment and peer review on Insurance Core Principle 24
(macroprudential surveillance) ▪ Thematic self-assessment and peer review on supervisory cooperation related
Insurance Core Principles
▪ 2016H2-17 ▪ 2017 ▪ 2017 ▪ 2017 ▪ 2016 ▪ 2016 ▪ 2017 ▪ 2016H2-2017 ▪ 2016 ▪ 2016 ▪ 2017
Note: Some monitoring activities are ongoing and will be completed in 2016-17.

41
ANNEX 3: SOURCES OF INFORMATION
Basel II ■ Report to G20 Leaders on implementation of the Basel III regulatory reforms, August 2016
(BCBS) ■ Assessments of G-SIB and D-SIB frameworks for China, EU, Japan, Switzerland and the US,
June 2016 (BCBS) ■ Tenth progress report on adoption of the Basel regulatory framework, April 2016 (BCBS) ■ Literature review on integration of regulatory capital and liquidity instruments, March 2016
(BCBS RTF) ■ Basel III monitoring report, March 2016 (BCBS) ■ RCAP jurisdiction-level assessments of final Basel III regulations (BCBS) ■ RCAP assessments of the consistency of regulatory outcomes (BCBS) Compensation practices ■ Measures to reduce misconduct risk: Second Progress Report, September 2016 (FSB) ■ FSB Round Table on Compensation Tools to Address Misconduct in Banks, July 2016 (FSB)
TBTF ■ Resilience through resolvability – moving from policy design to implementation: 5th Report
to the G20 on progress in resolution, August 2016 (FSB) ■ Second thematic review on resolution regimes, March 2016 (FSB) ■ Progress in adopting the Principles for effective risk data aggregation and risk reporting,
December 2015 (BCBS)
Shadow banking ■ Thematic Review on the Implementation of the FSB Policy Framework for Shadow Banking
Entities, May 2016 (FSB) ■ Global Shadow Banking Monitoring Report 2015, November 2015 (FSB) ■ Transforming Shadow Banking into Resilient Market-based Finance: An Overview of
Progress, November 2015 (FSB)
OTC derivatives ■ OTC Derivatives Markets Reforms: Eleventh Progress Report on Implementation, August
2016 (FSB) ■ Report on FSB Members’ Plans to Address Legal Barriers to Reporting and Accessing OTC
Derivatives Transaction Data, August 2016 (FSB) ■ Implementation monitoring of PFMI: Level 3 assessment – Report on the financial risk
management and recovery practices of 10 derivatives CCPs, August 2016 (CPMI-IOSCO) ■ Implementation monitoring of the Principles for Financial Market Infrastructures (CPMI-
IOSCO)

42
Other reform areas ■ Country peer reviews (FSB) ■ FSB jurisdictions’ responses to the Implementation Monitoring Network (IMN) survey (FSB) ■ Implementation Report: G20/FSB Recommendations related to Securities Markets,
forthcoming (IOSCO) ■ The Financial Crisis and Information Gaps: First Progress Report on the Second Phase of the
G-20 Data Gaps Initiative, September 2016 (staff of the IMF and FSB Secretariat) ■ Elements of effective macroprudential policies: Lessons from international experience,
August 2016 (IMF-FSB-BIS) ■ Reforming Major Interest Rate Benchmarks – Progress report on implementation of July
2014 FSB recommendations, July 2016 (FSB) ■ First phase of a global code of conduct for currency markets published, May 2016 (BIS) ■ 2015 Progress Report on Implementation of EDTF Principles and Recommendations,
December 2015 (EDTF) ■ Impact of Expected Credit Loss Approaches on Bank Risk Disclosures, December 2015
(EDTF)
Adherence to international financial standards ■ Information on FSB members’ commitments to lead by example (FSB) ■ Initiative on international cooperation and information exchange (FSB) ■ Multilateral Memorandum of Understanding Concerning Consultation and Cooperation
and the Exchange of Information (IOSCO)
Emerging market and developing economies (EMDEs) ■ FSB Regional Consultative Group working group reports (FSB) ■ Progress report to G20 on the FSB action plan to assess and address the decline in
correspondent banking, August 2016 (FSB) ■ The Withdrawal of Correspondent Banking Relationships: A Case for Policy Action, June
2016 (IMF Staff Discussion Note) ■ Withdrawal from correspondent banking: where, why and what to do about it, November
2015 (World Bank)

43
ABBREVIATIONS
BCBS Basel Committee on Banking SupervisionBIS Bank for International SettlementsCPMI Committee on Payments and Market Infrastructures CCPs Central counterpartiesCET1 Common Equity Tier 1 CapitalCMG Crisis management groupsCGFS Committee on the Global Financial SystemCoAgs Cross-border cooperation agreementsCPMI Committee on Payments and Market Infrastructures CRAs Credit rating agenciesD-SIBs Domestic systemically important banksEDTF Enhanced Disclosures Task ForceEMDEs Emerging Market and Developing EconomiesEU European UnionFSAP Financial Sector Assessment ProgramFSB Financial Stability BoardFATF Financial Action Task ForceGDP Gross domestic productG-SIBs Global systemically important banksG-SIFIs Global systemically important financial institutionsG-SIIs Global systemically important insurersIAIS International Association of Insurance SupervisorsICS International Capital StandardIFIAR International Forum of Independent Audit Regulators IMF International Monetary FundIOSCO International Organization of Securities Commissions IT Information technologyKYC Know your customerLCR Liquidity Coverage Ratio (Basel III)LEI Legal Entity IdentifierMMFs Money market fundsNAV Net asset value NSFR Net Stable Funding Ratio (Basel III)OFIs Other financial institutionsOTC Over-the-counter (derivatives)PFMI Principles for Financial Market Infrastructure (CPMI-IOSCO) QIS Quantitative impact studyRCAP Regulatory Consistency Assessment Programme (BCBS) RWAs Risk-weighted assetsSSBs Standard-setting bodiesSIFIs Systemically important financial institutionsTBTF Too-big-to-fail TLAC Total Loss-Absorbing CapacityTRs Trade repositories