G2 Meeting
46
G2 Meeting April 3, 2014
-
Upload
rahim-wallace -
Category
Documents
-
view
39 -
download
2
description
G2 Meeting. April 3, 2014. Agenda. Opening Remarks: Welcome and Acknowledge Guests Safety Response System - Lisa Lariscy Stock and Flow / Dashboard - Jim 8:8, 8b, OM 30 and Visitation - Counties Outcomes 2 and 24 Updates Wrap Up - Commissioner Horton and Director Hill. - PowerPoint PPT Presentation
Transcript of G2 Meeting

G2 Meeting
April 3, 2014

Agenda Opening Remarks: Welcome and Acknowledge
Guests Safety Response System - Lisa Lariscy Stock and Flow / Dashboard - Jim 8:8, 8b, OM 30 and Visitation - Counties Outcomes 2 and 24 Updates Wrap Up - Commissioner Horton and Director
Hill

Safety Response System
Lisa Lariscy

Permanency Benchmarks
Stock & Flow
Jim

What is “Stock and Flow?"

What is “Stock and Flow?"
6-12 month “Tub”
13+ month “Tub”
Exits from Care
13+ month “Faucet Kids”
Exits from Care

Win Fabulous Prizes!!!

Children in Care 6-12 Months Jun 2013
Jul 2013
Aug 2013
Sep 2013
Oct 2013
Nov 2013
Dec 2013
Jan 2014
Feb 2014
Mar 2014
10 Mo. Total
ANumber of Foster Care Cases open on the first day of the month 559 564 554 532 532 549 546 551 564 586 554
10 Month Average
Number of Children Removed 42 42 41 48 55 31 49 48 51 39 4510 Month Average
DNumber of Children reaching 6 months total 11 29 15 27 16 22 18 23 8 19 188
10 Month Total
HNumber of Children reaching 13 months during the month 18 15 12 16 16 17 12 7 16 12 141
10 Month Total
INumber of Children in care 6-12 Months exiting 2 4 16 6 6 2 12 3 6 6 63
10 Month Total
JNumber of Children in Care 6-12 Months on the last day of the month 137 143 128 128 124 125 119 132 118 118 127
10 Month Average
Discharge Reason Exits Exits Exits Exits Exits Exits Exits Exits Exits Exitsa Reunification 1 3 11 6 2 1 5 2 5 2b Live with other relative 1 1 2 0 2 1 7 0 0 1c Adoption finalized 0 0 0 0 0 0 0 0 0 0d Guardianship 0 0 3 0 1 0 0 1 1 2
Positive Permanency Subtotal (a+b+c+d) 2 4 16 6 5 2 12 3 6 5 6110 Month Total
e Emancipation 0 0 0 0 0 0 0 0 0 1f Transfer to another agency 0 0 0 0 0 0 0 0 0 0g Runaway 0 0 0 0 0 0 0 0 0 0h Death of Child (May 2009 forward) 0 0 0 0 0 0 0 0 0 0i Legal Status not mapped to AFCARS (May 2009 forward)0 0 0 0 1 0 0 0 0 0
Total (a+b+c+d+e+f+g+h+i) 2 4 16 6 6 2 12 3 6 6
Positive Permanency Ratio:(a+b+c+d)/(D) 18% 14% 107% 22% 31% 9% 67% 13% 75% 26% 32%10 Month Average
Matriculation Ratio: (H)/(H+I) 90% 79% 43% 73% 73% 89% 50% 70% 73% 67% 69%10 Month Average
DeKalb

All Children in Care 13+ MonthsJun 2013
Jul 2013
Aug 2013
Sep 2013
Oct 2013
Nov 2013
Dec 2013
Jan 2014
Feb 2014
Mar 2014
10 Mo. Total
ANumber of Foster Care Cases open on the first day of the month 559 564 554 532 532 549 546 551 564 586 554
10 Month Average
Number of Children Removed 42 42 41 48 55 31 49 48 51 39 4510 Month Average
DNumber of Children reaching 13 months total 18 15 12 16 16 17 12 7 16 12 141
10 Month Total
Number of Children reaching 25 months total 12 12 15 12 9 7 2 5 8 9 91
10 Month Total
HNumber of Children in care 13+ months exiting during the month 4 12 8 7 6 6 14 6 6 11 80
10 Month Total
INumber of Children in Care 13+ Months on the last day of the month 275 275 262 263 269 272 262 264 274 282 270
10 Month Average
Discharge Reason Exits Exits Exits Exits Exits Exits Exits Exits Exits Exitsa Reunification 2 4 3 2 0 1 4 3 2 4b Live with other relative 2 5 1 0 4 0 6 0 1 0c Adoption finalized 0 3 1 5 0 1 0 0 2 0d Guardianship 0 0 0 0 0 3 0 2 0 6
Positive Permanency Subtotal (a+b+c+d) 4 12 5 7 4 5 10 5 5 10 6710 Month Total
e Emancipation 0 0 3 0 2 1 4 1 1 0f Transfer to another agency 0 0 0 0 0 0 0 0 0 0g Runaway 0 0 0 0 0 0 0 0 0 0h Death of Child (May 2009 forward) 0 0 0 0 0 0 0 0 0 0i Legal Status not mapped to AFCARS (May 2009 forward)0 0 0 0 0 0 0 0 0 1
Total (a+b+c+d+e+f+g+h+i) 4 12 8 7 6 6 14 6 6 11
Positive Permancy Ratio:(a+b+c+d)/D 22% 80% 42% 44% 25% 29% 83% 71% 31% 83% 48%10 Month Average
DeKalb

100
90
80
70
60
50
40
30
20
10
0
10
20
30
40
50
60
70
80
90
100Dec-10 Jan-11 Feb-11 Mar-11 Apr-11 May-11 Jun-11 Jul-11 Aug-11 Sep-11 Oct-11 Nov-11 Dec-11 Jan-12 Feb-12 Mar-12 Apr-12 May-12 Jun-12 Jul-12 Aug-12 Sep-12 Oct-12 Nov-12 Dec-12 Jan-13 Feb-13
% of Children Still in Care% of Children Exited within 24 mos.% of Children Exited within 12 mos.% of Children Exited within 6 mos.# of Children Still in Care# of Children Exited within 24 mos.# of Children Exited within 12 mos.# of Children Exited within 6 mos.
Outcome 8b
Outcome 8a
DeKalb

Children in Care 6-12 Months Jun 2013
Jul 2013
Aug 2013
Sep 2013
Oct 2013
Nov 2013
Dec 2013
Jan 2014
Feb 2014
Mar 2014
10 Mo. Total
ANumber of Foster Care Cases open on the first day of the month 663 645 632 614 590 610 594 578 594 589 611
10 Month Average
Number of Children Removed 49 58 42 51 62 39 49 65 49 75 5410 Month Average
DNumber of Children reaching 6 months total 15 9 30 13 16 15 19 24 13 13 167
10 Month Total
HNumber of Children reaching 13 months during the month 17 23 11 22 16 15 13 9 5 20 151
10 Month Total
INumber of Children in care 6-12 Months exiting 9 4 6 9 1 4 2 2 10 3 50
10 Month Total
JNumber of Children in Care 6-12 Months on the last day of the month 134 113 123 105 102 96 99 114 112 101 110
10 Month Average
Discharge Reason Exits Exits Exits Exits Exits Exits Exits Exits Exits Exitsa Reunification 4 3 3 8 1 3 2 1 2 3b Live with other relative 5 0 2 0 0 0 0 0 2 0c Adoption finalized 0 0 0 0 0 1 0 0 0 0d Guardianship 0 0 0 1 0 0 0 0 6 0
Positive Permanency Subtotal (a+b+c+d) 9 3 5 9 1 4 2 1 10 3 4710 Month Total
e Emancipation 0 1 0 0 0 0 0 1 0 0f Transfer to another agency 0 0 1 0 0 0 0 0 0 0g Runaway 0 0 0 0 0 0 0 0 0 0h Death of Child (May 2009 forward) 0 0 0 0 0 0 0 0 0 0i Legal Status not mapped to AFCARS (May 2009 forward)0 0 0 0 0 0 0 0 0 0
Total (a+b+c+d+e+f+g+h+i) 9 4 6 9 1 4 2 2 10 3
Positive Permanency Ratio:(a+b+c+d)/(D) 60% 33% 17% 69% 6% 27% 11% 4% 77% 23% 28%10 Month Average
Matriculation Ratio: (H)/(H+I) 65% 85% 65% 71% 94% 79% 87% 82% 33% 87% 75%10 Month Average
Fulton
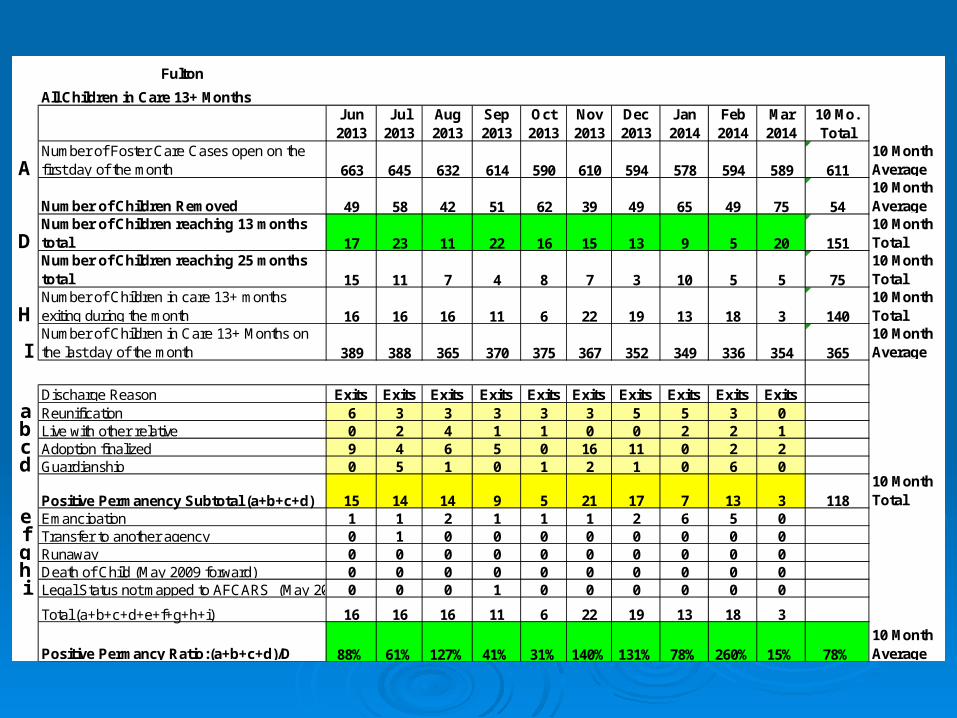
All Children in Care 13+ MonthsJun 2013
Jul 2013
Aug 2013
Sep 2013
Oct 2013
Nov 2013
Dec 2013
Jan 2014
Feb 2014
Mar 2014
10 Mo. Total
ANumber of Foster Care Cases open on the first day of the month 663 645 632 614 590 610 594 578 594 589 611
10 Month Average
Number of Children Removed 49 58 42 51 62 39 49 65 49 75 5410 Month Average
DNumber of Children reaching 13 months total 17 23 11 22 16 15 13 9 5 20 151
10 Month Total
Number of Children reaching 25 months total 15 11 7 4 8 7 3 10 5 5 75
10 Month Total
HNumber of Children in care 13+ months exiting during the month 16 16 16 11 6 22 19 13 18 3 140
10 Month Total
INumber of Children in Care 13+ Months on the last day of the month 389 388 365 370 375 367 352 349 336 354 365
10 Month Average
Discharge Reason Exits Exits Exits Exits Exits Exits Exits Exits Exits Exitsa Reunification 6 3 3 3 3 3 5 5 3 0b Live with other relative 0 2 4 1 1 0 0 2 2 1c Adoption finalized 9 4 6 5 0 16 11 0 2 2d Guardianship 0 5 1 0 1 2 1 0 6 0
Positive Permanency Subtotal (a+b+c+d) 15 14 14 9 5 21 17 7 13 3 11810 Month Total
e Emancipation 1 1 2 1 1 1 2 6 5 0f Transfer to another agency 0 1 0 0 0 0 0 0 0 0g Runaway 0 0 0 0 0 0 0 0 0 0h Death of Child (May 2009 forward) 0 0 0 0 0 0 0 0 0 0i Legal Status not mapped to AFCARS (May 2009 forward)0 0 0 1 0 0 0 0 0 0
Total (a+b+c+d+e+f+g+h+i) 16 16 16 11 6 22 19 13 18 3
Positive Permancy Ratio:(a+b+c+d)/D 88% 61% 127% 41% 31% 140% 131% 78% 260% 15% 78%10 Month Average
Fulton

Fulton
100
90
80
70
60
50
40
30
20
10
0
10
20
30
40
50
60
70
80
90
100Dec-10 Jan-11 Feb-11 Mar-11 Apr-11 May-11 Jun-11 Jul-11 Aug-11 Sep-11 Oct-11 Nov-11 Dec-11 Jan-12 Feb-12 Mar-12 Apr-12 May-12 Jun-12 Jul-12 Aug-12 Sep-12 Oct-12 Nov-12 Dec-12 Jan-13 Feb-13
% of Children Still in Care
% of Children Exited within 24 mos.% of Children Exited within 12 mos.% of Children Exited within 6 mos.# of Children Still in Care
# of Children Exited within 24 mos.# of Children Exited within 12 mos.# of Children Exited within 6 mos.
Outcome 8b

Visitation
Counties

DeKalb County
PlacementVisitation Data
February 2014

DeKalb County
February2014
OM 20A
Child Visits
AdministratorSuperviso
r Require
dMade %
Lyles389/39897.74%
Cox 108 108 100%
Hill 93 85 91.40%
Njenga 131 130 99.24%
Jack 66 66 100%
Johnson337/34298.54%
Scott 122 119 97.54%
Hall 70 69 98.57%
Jacob 93 93 100%
Pertiller 57 56 98.25%
Rayne301/30399.34%
Macon 102 100 98.04%
Garrett 117 117 100%
Smith 84 84 100%
Summary 1043 1027 98.47%
Excellent 96.25% or greater
Good 92% - 96.24%
Needs Improvement <92%
Kenny A. Mandate 96.25%
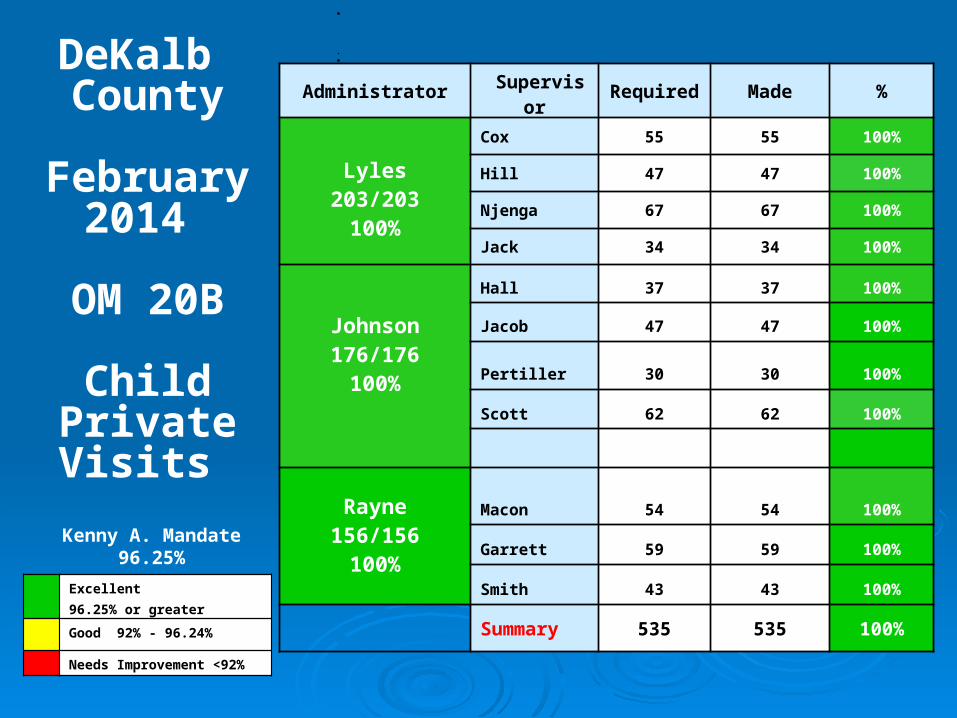
DeKalb County
February2014
OM 20B
ChildPrivateVisits
Kenny A. Mandate96.25%
Excellent 96.25% or greater
Good 92% - 96.24%
Needs Improvement <92%
Administrator Supervis
orRequire
dMade %
Lyles203/203
100%
Cox 55 55 100%
Hill 47 47 100%
Njenga 67 67 100%
Jack 34 34 100%
Johnson176/176
100%
Hall 37 37 100%
Jacob 47 47 100%
Pertiller 30 30 100%
Scott 62 62 100%
Rayne156/156
100%
Macon 54 54 100%
Garrett 59 59 100%
Smith 43 43 100%
Summary 535 535 100%

DeKalbCounty
February2014
OM 21
Reunification
Visits
Excellent 85% or greater
Good 75% - 84.9%
Needs Improvement <75%
Kenny A. Mandate 85%
Administrator
Supervisor
Required
Made %
Lyles56/6290.3%
Cox 1 1 100%
Hill 18 14 77.8%
Njenga 43 41 95.3%
Jack 0 0 NA
Johnson94/10787.9%
Hall 16 16 100%
Jacob 30 30 100%
Pertiller 24 18 75%
Scott 37 30 81.8%
Rayne75/8489.3%
Macon 27 23 85.2%
Garrett 39 39 100%
Smith 18 13 72.2%
Summary 253 225 88.9%

DeKalb County
February2014
OM 22
CaretakerVisits
Kenny A. Mandate 95%
Excellent 95% or greater
Good 87.5% - 94.9%
Needs Improvement <87.5
Administrator Supervis
orRequire
dMade %
Lyles198/202
98%
Cox 55 55 100%
Hill 47 43 91.5%
Njenga 67 67 100%
Jack 33 33 100%
Johnson165/17196.5%
Hall 36 35 97.2%
Jacob 45 45 100%
Pertiller 29 26 89.7%
Scott 61 59 96.7%
Rayne145/15394.8%
Macon 53 53 100%
Garrett 58 58 100%
Smith 42 34 81%
Summary 526 508 96.6%
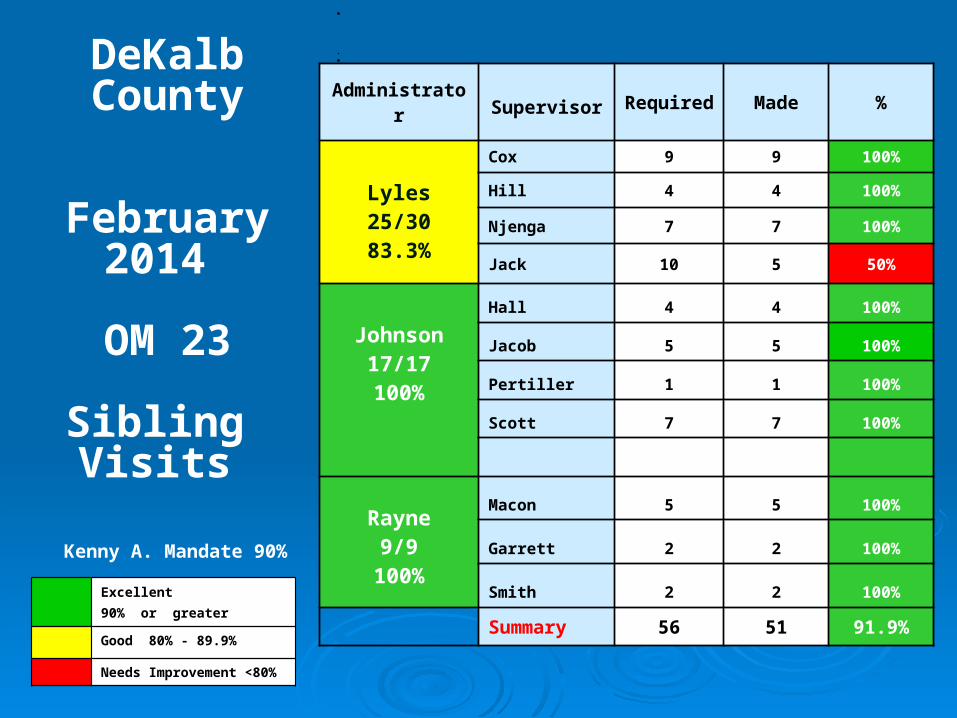
DeKalbCounty
February2014
OM 23
Sibling Visits
Excellent 90% or greater
Good 80% - 89.9%
Needs Improvement <80%
Kenny A. Mandate 90%
Administrator
Supervisor
Required
Made %
Lyles25/3083.3%
Cox 9 9 100%
Hill 4 4 100%
Njenga 7 7 100%
Jack 10 5 50%
Johnson17/17100%
Hall 4 4 100%
Jacob 5 5 100%
Pertiller 1 1 100%
Scott 7 7 100%
Rayne9/9
100%
Macon 5 5 100%
Garrett 2 2 100%
Smith 2 2 100%
Summary 56 51 91.9%
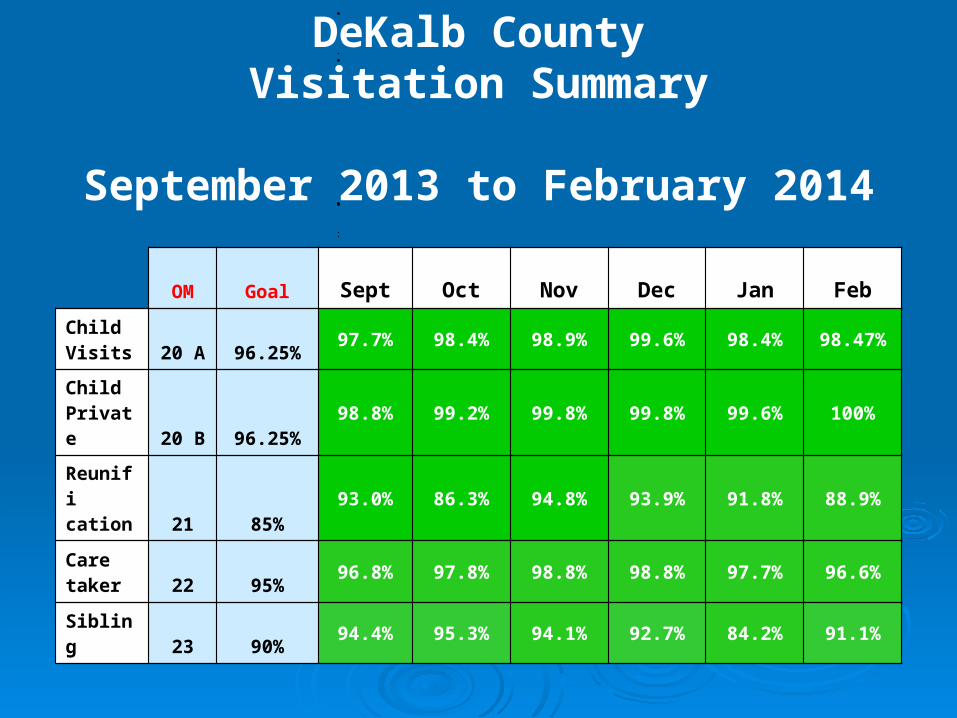
OM Goal Sept Oct Nov Dec Jan Feb
Child Visits 20 A 96.25%
97.7% 98.4% 98.9% 99.6% 98.4% 98.47%
Child Private 20 B 96.25%
98.8% 99.2% 99.8% 99.8% 99.6% 100%
Reunification 21 85%
93.0% 86.3% 94.8% 93.9% 91.8% 88.9%
Care taker 22 95%
96.8% 97.8% 98.8% 98.8% 97.7% 96.6%
Sibling 23 90%94.4% 95.3% 94.1% 92.7% 84.2% 91.1%
DeKalb CountyVisitation Summary
September 2013 to February 2014

Fulton County
PlacementVisitation Data
February 2014

Fulton County
February2014
OM 20A
Child Visits
Admin
Supervisor Required Made %
Russell99.28%
414/417
Beasley 116 116 100%
Greene 94 91 96.81%
Hudson 87 87 100%
Rudd 120 120 100%
Walker100%
245/245
Haynes 74 74 100%
Searcy 102 102 100%
Trim 69 69 100%
Williams99.46%
368/370
Booker 87 87 100%
Bradley 80 79 98.75%
Fulton 82 81 98.78%
Scott-Morrow 121 121 100%
Summary 1032 102799.52
%
Excellent 96.25% or greater
Good 92% - 96.24%
Needs Improvement <92%
Kenny A. Mandate 96.25%
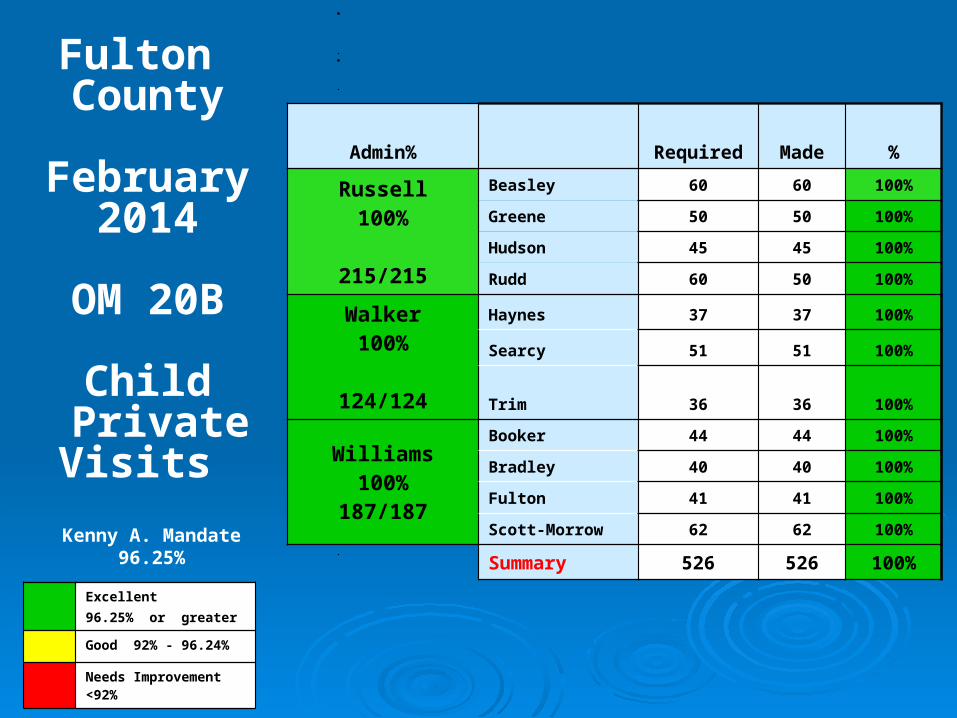
Fulton County
February2014
OM 20B
Child PrivateVisits
Admin% Required Made %
Russell100%
215/215
Beasley 60 60 100%
Greene 50 50 100%
Hudson 45 45 100%
Rudd 60 50 100%
Walker100%
124/124
Haynes 37 37 100%
Searcy 51 51 100%
Trim 36 36 100%
Williams100%
187/187
Booker 44 44 100%
Bradley 40 40 100%
Fulton 41 41 100%
Scott-Morrow 62 62 100%
Summary 526 526 100%
Excellent 96.25% or greater
Good 92% - 96.24%
Needs Improvement <92%
Kenny A. Mandate 96.25%
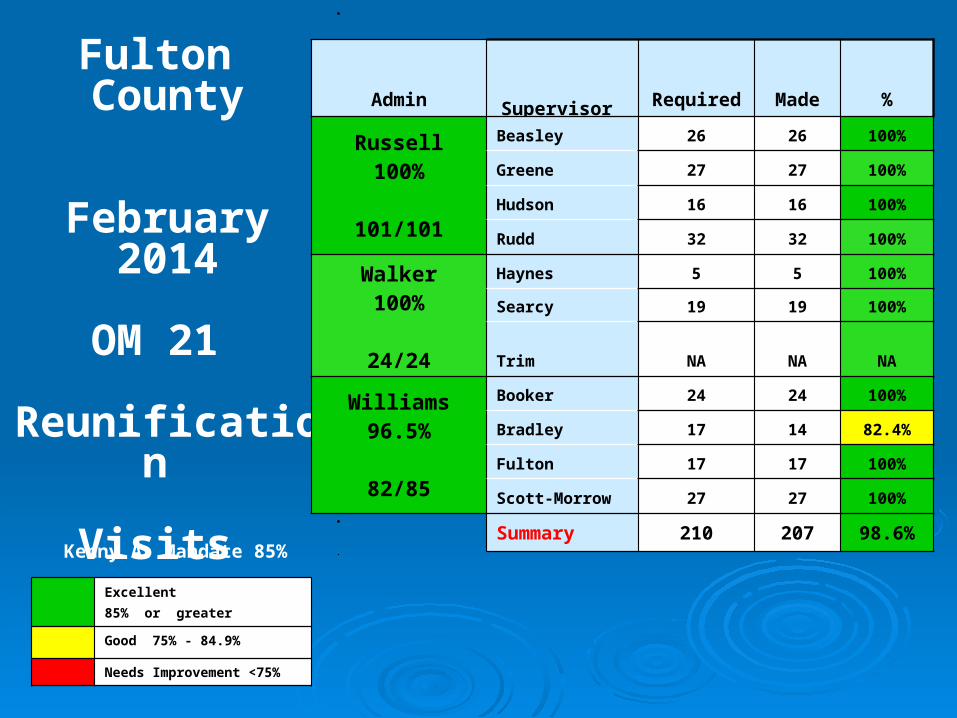
Fulton County
February2014
OM 21
Reunification
Visits
Excellent 85% or greater
Good 75% - 84.9%
Needs Improvement <75%
Kenny A. Mandate 85%
Admin
Supervisor Required Made %
Russell100%
101/101
Beasley 26 26 100%
Greene 27 27 100%
Hudson 16 16 100%
Rudd 32 32 100%
Walker100%
24/24
Haynes 5 5 100%
Searcy 19 19 100%
Trim NA NA NA
Williams96.5%
82/85
Booker 24 24 100%
Bradley 17 14 82.4%
Fulton 17 17 100%
Scott-Morrow 27 27 100%
Summary 210 207 98.6%

Fulton County
February2014
OM 22
Caretaker
Visits
Excellent 95% or greater
Good 87.5% - 94.9%
Needs Improvement <87.5
Kenny A. Mandate 95%
Admin Required Made %
Russell98.1%
204/208
Beasley 60 59 98.3%
Greene 46 44 95.7%
Hudson 42 42 100%
Rudd 60 59 98.3%
Walker100%
122/122
Haynes 37 37 100%
Searcy 49 49 100%
Trim 36 36 100%
Williams99.0%
183/182
Booker 44 44 100%
Bradley 38 37 97.4%
Fulton 41 41 100%
Scott-Morrow 61 61 100%
Summary 514 509 99.0%
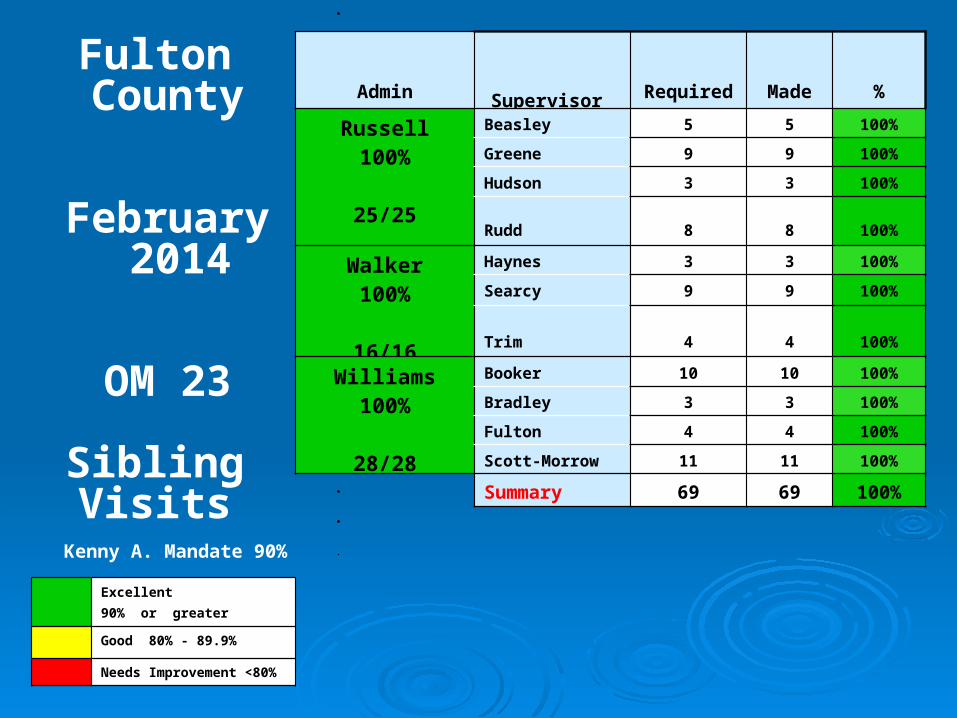
Fulton County
February 2014
OM 23
Sibling Visits
Excellent 90% or greater
Good 80% - 89.9%
Needs Improvement <80%
Kenny A. Mandate 90%
Admin
Supervisor Required Made %
Russell100%
25/25
Beasley 5 5 100%
Greene 9 9 100%
Hudson 3 3 100%
Rudd 8 8 100%
Walker100%
16/16
Haynes 3 3 100%
Searcy 9 9 100%
Trim 4 4 100%
Williams100%
28/28
Booker 10 10 100%
Bradley 3 3 100%
Fulton 4 4 100%
Scott-Morrow 11 11 100%
Summary 69 69 100%

OM Goal Sept Oct Nov Dec Jan Feb
Child Visits20 A
96.25%
98.0%
97.2%
98.6% 98.6%
96.8%
99.5%
Child Private20 B
96.25%
99.2%
99.1% 100% 99.6%
98.2% 100%
Reunification 21 85%85.9
%93.0
%95.3% 96.4% 94.7% 98.6%
Caretaker 22 95%97.9
%97.8
%99.1% 99.6% 98.2% 99.0%
Sibling 23 90%88.1
%95.6
% 100% 95.8% 96.8% 100%
Fulton CountyVisitation Summary
September 2013 to February 2014

8 in 8 / 8b Data
Counties

QA Review of 8 in 8 : DeKalb Results for January 2014
Total Number Percent Initial Planned Disruptions
Number of children 20 8 9 3
Number of visits due 111 44 53 14
Number of visits made 88 32 43 13
Percent of visits made 79% 73% 81% 93%
All 8 in 8 requirements met 9 45% 3 4 2
All visits made butmissed time or location requirement
2 10% 1 1 NA
At least one in-placement visit in the 1st wk 16 80% 6 8 2
At least one visit any location in the 1st wk 20 100% 8 9 3
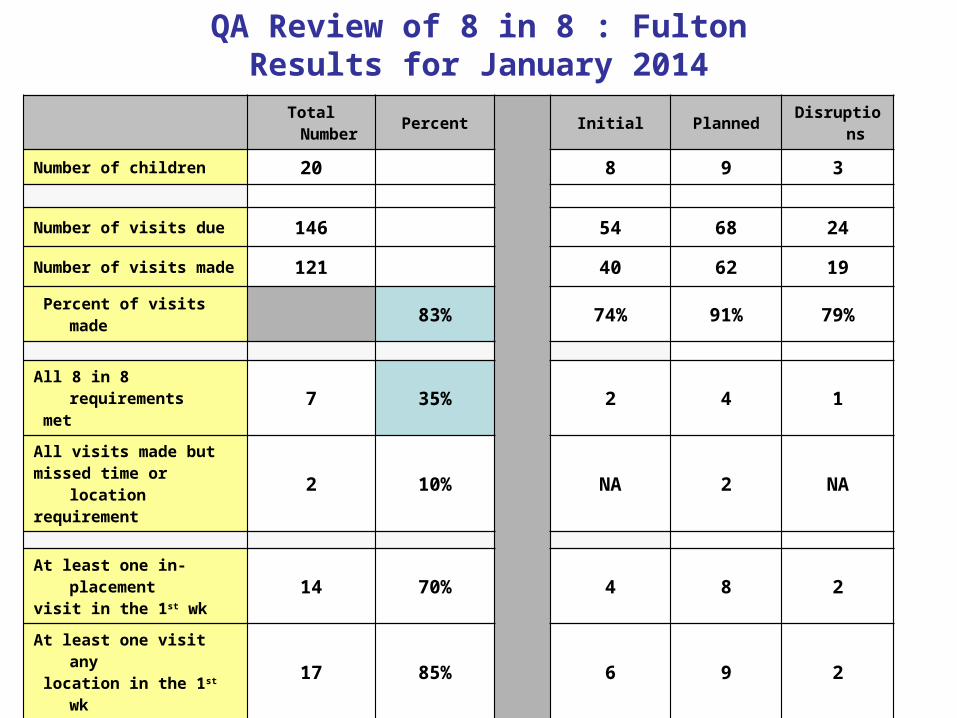
QA Review of 8 in 8 : FultonResults for January 2014
Total Number Percent Initial Planned Disruptions
Number of children 20 8 9 3
Number of visits due 146 54 68 24
Number of visits made 121 40 62 19
Percent of visits made 83% 74% 91% 79%
All 8 in 8 requirements met 7 35% 2 4 1
All visits made butmissed time or location requirement
2 10% NA 2 NA
At least one in-placement visit in the 1st wk 14 70% 4 8 2
At least one visit any location in the 1st wk 17 85% 6 9 2
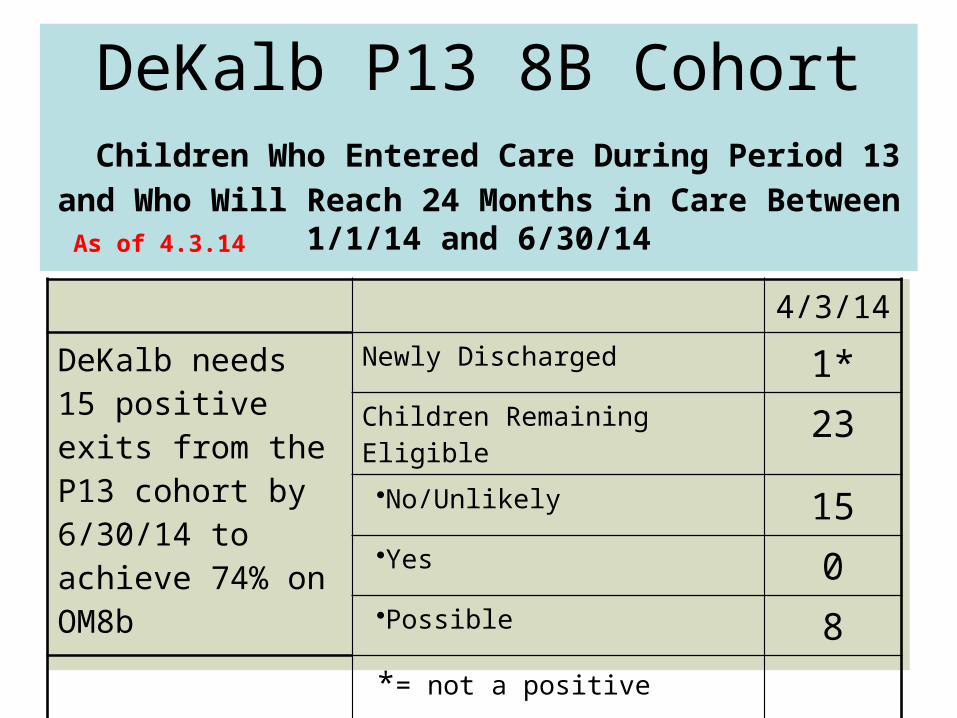
DeKalb P13 8B Cohort Children Who Entered Care During Period 13 and Who
Will Reach 24 Months in Care Between1/1/14 and 6/30/14
4/3/14
DeKalb needs 15 positive exits from the P13 cohort by 6/30/14 to achieve 74% on OM8b
Newly Discharged 1*Children Remaining Eligible 23•No/Unlikely 15•Yes 0•Possible 8*= not a positive permanency
As of 4.3.14
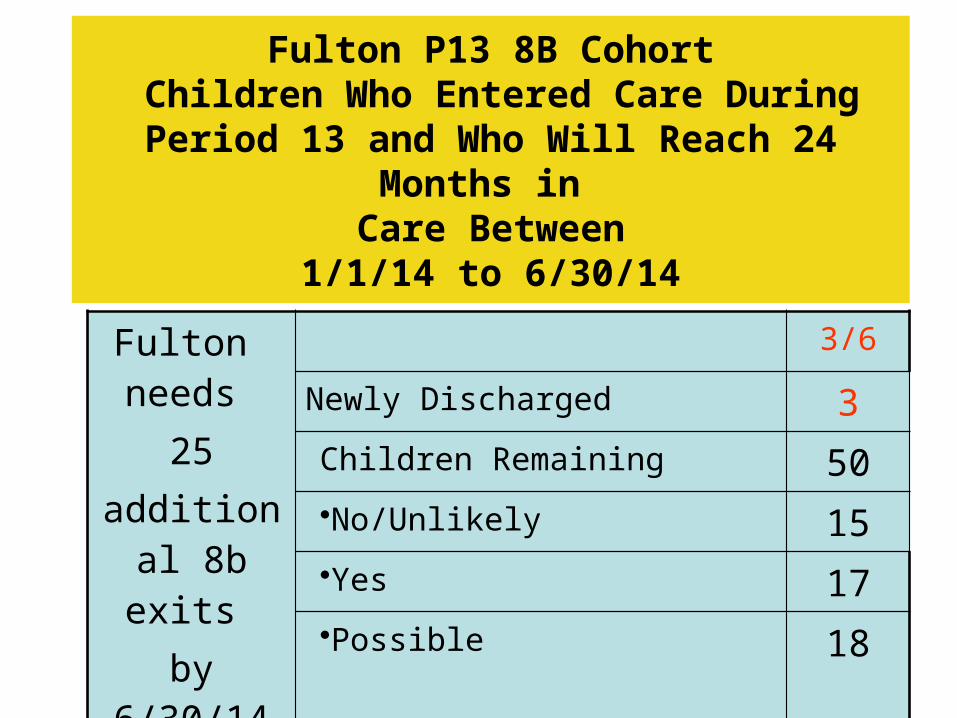
Fulton P13 8B Cohort Children Who Entered Care During Period 13
and Who Will Reach 24 Months in Care Between
1/1/14 to 6/30/14
Fulton needs
25additional 8b exits
by 6/30/14
3/6
Newly Discharged 3
Children Remaining 50•No/Unlikely 15•Yes 17•Possible 18

Outcome 30 and Health Event Tracking
Counties

Region XIVDeKalb Co.
OM 30 Reporting Month
March 2014
(Meeting the Needs of Children)
Children with Health Checks
Overdue More Than 30 Days
(End of Month)
Admin Supervisor Oct Nov Dec JanFeb
Mar
LylesOverdue >30 Days
Cox 1 1 0 0 0 1
Hill 2 2 1 2 1 0
Njenga 4 4 1* 1 0 0
Jack 2 4 0 1 2 0
Lyles Total 9 11 2* 4 3 1
Johnson Overdue >30 Days
Hall 0 1 0 0 0 0
Jacob 0 0 0 0 0 0
Pertiller 1 1 0 1 1 1
Scott 0 1 1* 0* 2
Johnson Total 1 5 1 2 1* 3
RayneOverdue >30 Days
Macon 3 6 0 1 0 0
Garrett 0 2 0 0 0 0
Smith 0 0 3
Rayne Total 3 8 0 1 0 3
Summary 13 24 3* 7* 4* 7 *
** = additional child/ren not included. On runaway status.

REGION 14
FultonCounty
OM 30Meeting the
Needs of Children
Children with Health Checks More Than 30 Days Past Due
Admin SSS Oct Nov Dec Jan Feb Mar
Russell
Beasley 3 3 14 1 0 2
Hudson 2 0 0 1 1 0
Rudd 4 1 4 1 3 2
Greene 7 2 4 4 7 6
TOTAL RUSSELL 16 6 22 7 11 10
Williams
Booker 10 4 3 4 1 5
Carbins 3 3 3 0 1 0
Fulton 5 6 4 0 0 4
Scott-Morrow 3 4 4 0 1 4
TOTAL WILLIAMS 21 17 14 4 3 13
Walker
Haynes 2 1 0 0 0 0
Trim 5 6 3 0 0 0
Searcy 1 2 0 0 0 0TOTAL WALKER 8 9 3 0 0 0County Summary 45 32 39 11 14 23

Outcomes 2 & 24 Updates
Presented to: G2Presented by: Carol Hall
Date: April 3, 2014
Georgia Department of Human Services

OUTCOME 2At least 95% of all investigations of reported abuse or neglect of foster children shall be completed within 30 days of receipt of the report
(Social Services Policy 2106)
Period 16: July 1 – December 31, 2013
Reporting Periods
1st 2nd 3rd 4th 5th 6th 7th 8th 9th 10th 11th 12th 13th 14th 15th
83% 78% 72% 72% 76% 84% 90% 66% 55% 77% 82% 81% 75% 73% 85%

98.28%

PERIOD 16 RESULTS
Goal 95%
P16’s Proposed Performance 98.28%*
• Total 58• Met 57• Missed 1
* Not yet validated by monitors

PERIOD 17 (January – March 2014)
• 43 Cases to-date
• 37 Closed timely • 6 Currently open; all on track to close timely
• P 17 Performance To-Date = 100%

OUTCOME 24A baseline measure shall be developed that shows the percentage of children discharged from foster care at age 18 or older during the 12 months prior to the entry of the consent decree who have graduated from high school or earned a GED. By the end of the second reporting period, that percentage shall increase by 10 percentage points. By the end of the fourth reporting period, that percentage shall increase by an additional 10 percentage points.
Goal = 56%OM 24 Formula = Achieved/Eligible Children in Cohort
Reporting Periods
1st 2nd 3rd 4th 5th 6th 7th 8th 9th 10th 11th 12th 13th 14th 15th
34% 25% 47% 50% 58% 49.1% 40

PERIOD 16 RESULTSFulton 17 Achieved 16 Not Achieved
17/33 = 51.5% or 52%-------------------------------------------------------------------------DeKalb18 Achieved 7 Not Achieved
18/25 = 72%

60.34%
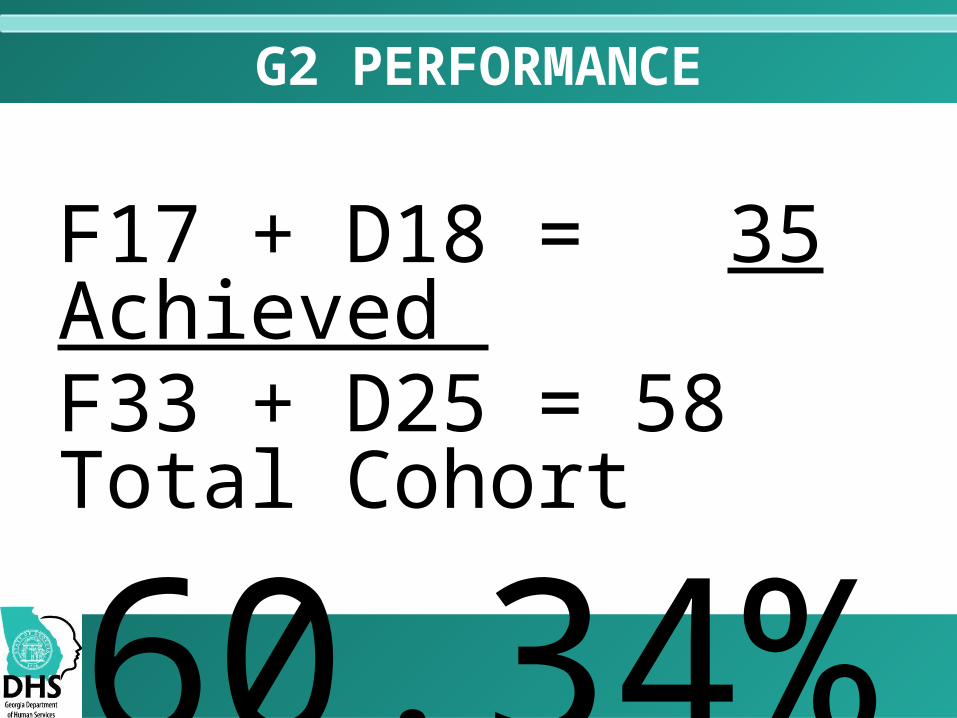
G2 PERFORMANCE
F17 + D18 = 35 Achieved F33 + D25 = 58 Total Cohort
60.34%

Wrap Up
Commissioner Horton
And
Director Hill