G Model ARTICLE IN PRESS -...
11
Please cite this article in press as: Schaefer, H. S., et al. Brain, body, and cognition: Neural, physiological and self-report correlates of phobic and normative fear. Biol. Psychol. (2014), http://dx.doi.org/10.1016/j.biopsycho.2013.12.011 ARTICLE IN PRESS G Model BIOPSY-6828; No. of Pages 11 Biological Psychology xxx (2014) xxx–xxx Contents lists available at ScienceDirect Biological Psychology jo ur nal home p age: www.elsevier.com/locate/biopsycho Brain, body, and cognition: Neural, physiological and self-report correlates of phobic and normative fear Hillary S. Schaefer a , Christine L. Larson b , Richard J. Davidson c , James A. Coan a,∗ a University of Virginia, VA, United States b University of Wisconsin, Milwaukee, WI, United States c University of Wisconsin, Madison, WI, United States a r t i c l e i n f o Article history: Received 5 June 2013 Accepted 17 December 2013 Available online xxx Keywords: Emotion Concordance Phobia Fear Brain Autonomic nervous system Self-report a b s t r a c t The phobic fear response appears to resemble an intense form of normal threat responding that can be induced in a nonthreatening situation. However, normative and phobic fear are rarely contrasted directly, thus the degree to which these two types of fear elicit similar neural and bodily responses is not well understood. To examine biological correlates of normal and phobic fear, 21 snake phobic and 21 nonphobic controls saw videos of slithering snakes, attacking snakes and fish in an event-related fMRI design. Simultaneous eletrodermal, pupillary, and self-reported affective responses were collected. Nonphobic fear activated a network of threat-responsive brain regions and involved pupillary dilation, electrodermal response and self-reported affect selective to the attacking snakes. Phobic fear recruited a large array of brain regions including those active in normal fear plus additional structures and also engendered increased pupil dilation, electrodermal and self-reported responses that were greater to any snake versus fish. Importantly, phobics showed greater between- and within-subject concordance among neural, electrodermal, pupillary, and subjective report measures. These results suggest phobic responses recruit overlapping but more strongly activated and more extensive networks of brain activity as compared to normative fear, and are characterized by greater concordance among neural activation, peripheral physiology and self-report. It is yet unclear whether concordance is unique to psychopathol- ogy, or rather simply an indicator of the intense fear seen in the phobic response, but these results underscore the importance of synchrony between brain, body, and cognition during the phobic reaction. © 2014 Published by Elsevier B.V. 1. Introduction The expression of fear is associated with an adaptive set of behaviors and central and autonomic nervous system responses that serve to protect the organism in the face of danger (Ohman & Mineka, 2001). When presented with a threat, physiological changes including increased heart rate (Moratti & Keil, 2005; Sartory, Rachman, & Grey, 1977) and dilated pupils (Reinhard, Lachnit, & König, 2006) ready the body to fight or flee. This evolu- tionarily adaptive response becomes maladaptive in simple phobic fear, in which an intense fear response can be provoked by a stimulus not immediately threatening to the body, such as a photo- graph of a snake. Autonomic reactions to phobic provocation mimic those in normative fear responding (Davidson, Marshall, Tomarken, ∗ Corresponding author at: P.O. Box 400400, Charlottesville, VA 22902, United States. Tel.: +1 434 243 2322; fax: +1 434 982 5571. E-mail address: [email protected] (J.A. Coan). & Henriques, 2000; Sarlo, Palomba, Angrilli, & Stegagno, 2002), and neuroimaging studies of phobic fear demonstrate activation in visual, motor, affective, and sensory brain networks (Schienle, Schafer, Hermann, Rohrmann, & Vaitl, 2007; Straube, Mentzel, & Miltner, 2006). These networks overlap with regions implicated in fear conditioning (Knight, Cheng, Smith, Stein, & Helmstetter, 2004; Phelps, Delgado, Nearing, & LeDoux, 2004), and presentation of fearful images (Hariri, Mattay, Tessitore, Fera, & Weinberger, 2003; Sabatinelli, Bradley, Fitzsimmons, & Lang, 2005), which find activa- tion patterns involving similar regions such as the supplementary motor area and amygdala. Despite similarities in autonomic responding and overlapping brain networks, some sequelae may be unique to phobic fear. Behavioral avoidance (Hamm, Cuthnert, Globisch, & Vaitl, 1997) and increased environmental vigilance (Kindt & Brosschot, 1997; Koch, O’Neill, Sawchuk, & Connolly, 2002) have been strongly associated with phobic fear. In addition, although phobics often overestimate the inherent danger of their feared stimuli (e.g. Arntz, Lavy, Van den Berg, & Van Rijsoort, 1993; Mizes, Landolf-Fritsche, 0301-0511/$ – see front matter © 2014 Published by Elsevier B.V. http://dx.doi.org/10.1016/j.biopsycho.2013.12.011
Transcript of G Model ARTICLE IN PRESS -...
B
Bc
Ha
b
c
a
ARAA
KECPFBAS
1
bt&cSLtfsgt
S
0h
ARTICLE IN PRESSG ModelIOPSY-6828; No. of Pages 11
Biological Psychology xxx (2014) xxx–xxx
Contents lists available at ScienceDirect
Biological Psychology
jo ur nal home p age: www.elsev ier .com/ locate /b iopsycho
rain, body, and cognition: Neural, physiological and self-reportorrelates of phobic and normative fear
illary S. Schaefera, Christine L. Larsonb, Richard J. Davidsonc, James A. Coana,∗
University of Virginia, VA, United StatesUniversity of Wisconsin, Milwaukee, WI, United StatesUniversity of Wisconsin, Madison, WI, United States
r t i c l e i n f o
rticle history:eceived 5 June 2013ccepted 17 December 2013vailable online xxx
eywords:motiononcordancehobiaearrainutonomic nervous systemelf-report
a b s t r a c t
The phobic fear response appears to resemble an intense form of normal threat responding that canbe induced in a nonthreatening situation. However, normative and phobic fear are rarely contrasteddirectly, thus the degree to which these two types of fear elicit similar neural and bodily responses isnot well understood. To examine biological correlates of normal and phobic fear, 21 snake phobic and21 nonphobic controls saw videos of slithering snakes, attacking snakes and fish in an event-relatedfMRI design. Simultaneous eletrodermal, pupillary, and self-reported affective responses were collected.Nonphobic fear activated a network of threat-responsive brain regions and involved pupillary dilation,electrodermal response and self-reported affect selective to the attacking snakes. Phobic fear recruiteda large array of brain regions including those active in normal fear plus additional structures and alsoengendered increased pupil dilation, electrodermal and self-reported responses that were greater toany snake versus fish. Importantly, phobics showed greater between- and within-subject concordanceamong neural, electrodermal, pupillary, and subjective report measures. These results suggest phobic
responses recruit overlapping but more strongly activated and more extensive networks of brain activityas compared to normative fear, and are characterized by greater concordance among neural activation,peripheral physiology and self-report. It is yet unclear whether concordance is unique to psychopathol-ogy, or rather simply an indicator of the intense fear seen in the phobic response, but these resultsunderscore the importance of synchrony between brain, body, and cognition during the phobic reaction.© 2014 Published by Elsevier B.V.
. Introduction
The expression of fear is associated with an adaptive set ofehaviors and central and autonomic nervous system responseshat serve to protect the organism in the face of danger (Ohman
Mineka, 2001). When presented with a threat, physiologicalhanges including increased heart rate (Moratti & Keil, 2005;artory, Rachman, & Grey, 1977) and dilated pupils (Reinhard,achnit, & König, 2006) ready the body to fight or flee. This evolu-ionarily adaptive response becomes maladaptive in simple phobicear, in which an intense fear response can be provoked by a
Please cite this article in press as: Schaefer, H. S., et al. Brain, body, aphobic and normative fear. Biol. Psychol. (2014), http://dx.doi.org/10.1
timulus not immediately threatening to the body, such as a photo-raph of a snake. Autonomic reactions to phobic provocation mimichose in normative fear responding (Davidson, Marshall, Tomarken,
∗ Corresponding author at: P.O. Box 400400, Charlottesville, VA 22902, Unitedtates. Tel.: +1 434 243 2322; fax: +1 434 982 5571.
E-mail address: [email protected] (J.A. Coan).
301-0511/$ – see front matter © 2014 Published by Elsevier B.V.ttp://dx.doi.org/10.1016/j.biopsycho.2013.12.011
& Henriques, 2000; Sarlo, Palomba, Angrilli, & Stegagno, 2002),and neuroimaging studies of phobic fear demonstrate activationin visual, motor, affective, and sensory brain networks (Schienle,Schafer, Hermann, Rohrmann, & Vaitl, 2007; Straube, Mentzel, &Miltner, 2006). These networks overlap with regions implicated infear conditioning (Knight, Cheng, Smith, Stein, & Helmstetter, 2004;Phelps, Delgado, Nearing, & LeDoux, 2004), and presentation offearful images (Hariri, Mattay, Tessitore, Fera, & Weinberger, 2003;Sabatinelli, Bradley, Fitzsimmons, & Lang, 2005), which find activa-tion patterns involving similar regions such as the supplementarymotor area and amygdala.
Despite similarities in autonomic responding and overlappingbrain networks, some sequelae may be unique to phobic fear.Behavioral avoidance (Hamm, Cuthnert, Globisch, & Vaitl, 1997)and increased environmental vigilance (Kindt & Brosschot, 1997;
nd cognition: Neural, physiological and self-report correlates of016/j.biopsycho.2013.12.011
Koch, O’Neill, Sawchuk, & Connolly, 2002) have been stronglyassociated with phobic fear. In addition, although phobics oftenoverestimate the inherent danger of their feared stimuli (e.g. Arntz,Lavy, Van den Berg, & Van Rijsoort, 1993; Mizes, Landolf-Fritsche,
ING ModelB
2 al Psy
&t2fler(aba2
bteDKoisceescRscio
bapentftpiaeeoUc2EaRpocpa2
wwctspwa
ARTICLEIOPSY-6828; No. of Pages 11
H.S. Schaefer et al. / Biologic
Grossman-McKee, 1987), many phobics also recognize thatheir fear is irrational and are quite embarrassed by it (Davidson,005; Mayer, Merckelbach & Muris, 2000). This apparent con-ict between explicit cognition and emotional reaction may bexplained by the uncontrollable, automatic nature of the phobiceaction and its involvement of many brain and bodily systemsOhman & Mineka, 2001). This conflict may also lead to increasedttempt at emotion regulation during fear provocation in pho-ic individuals, in an effort to dampen or control the reaction,lthough they are ultimately unable to do so (Hermann et al.,009).
This uncontrollable and automatic sensation across multipleody systems is suggestive of the theory of concordance, the notionhat indices of emotion should correlate, or cohere. However,mpirical support for this theory has been mixed (Fernández-ols, Sánchez, Carrera, & Ruiz-Belda, 1997; Matsumoto, Nezlek, &oopmann, 2007; Rosenberg & Ekman, 1994), even in the studyf specific phobia (Duinen, Schruers, & Griez, 2010). Particularlymportant are negative findings for correlation between subjectiveelf-report and physiology (e.g. Gross & Levenson, 1993), whichall into question the reliability of self-reported experiences ofmotion. However, the concordance of systems associated withmotion has been observed to vary as a function of perceived inten-ity, with higher intensity responding linked to greater systemiconcordance (Mauss, Levenson, McCarter, Willhelm, & Gross, 2005;osenberg & Ekman, 1997). Intense phobic responses have likewisehown concordance between self-reported fear and physiologi-al response (Sartory et al., 1977), and this concordance may bemportant to intense experiences that feel subjectively automaticr overwhelming.
The current study sought to contrast normative and pho-ic fear to discern similarities and distinctions in their neuralnd physiological correlates. To this end, phobic and nonphobicarticipants were presented with videos of snakes, both threat-ning clips of snakes striking in the direction of the viewer, andonthreatening snakes slithering along the ground. In this way,he normative reaction of a nonphobic person to an attackingearful snake stimulus can be compared to the phobic responseo a less obviously threatening snake and a more completeicture of fear can be obtained. We hypothesized that normat-
ve fear would recruit regions frequently associated with threatnd fear such as the amygdala, thalamus and insula (Haririt al., 2003; Williams et al., 2005). In contrast, we hypoth-sized the neural correlates of phobic fear would involve anverlapping, but much more extensive set of brain regions.nlike normative threat responding, phobic fear is often asso-iated with feelings of disgust (de Jong, Peters, & Vanderhallen,002), and greater environmental awareness (Öhman, Flykt, &steves, 2001). Therefore, we hypothesized that phobia-specificctivation in the insula (Wicker, Keyeere, Plially, Gallese, &izzolatti, 2003) and visual processing regions in temporal andarietal cortices (Lloyd, Morrison, & Roberts, 2006) would bebserved. Further, as phobics report embarrassment and self-onsciousness during fear responses (Davidson, 2005), we expectedrefrontal activation unique to phobic fear in regions associ-ted with emotion regulation (Goldin, McRae, Ramel, & Gross,008).
We were also specifically interested in whether responsesould correlate across the multiple systems being measured, andhether this occurred in both phobic and normative fear. To test for
oncordance during phobic fear provocation across multiple sys-ems, we collected self-reported affect, functional brain data and
Please cite this article in press as: Schaefer, H. S., et al. Brain, body, aphobic and normative fear. Biol. Psychol. (2014), http://dx.doi.org/10.1
everal measures of peripheral physiology. Given the intensity ofhobic symptom provocation, we hypothesized that phobic fearould be associated with greater and more consistent relationships
mong indices.
PRESSchology xxx (2014) xxx–xxx
2. Methods
2.1. Participants
A total of 24 snake phobic and 25 nonphobic control female subjects wereenrolled in the study. Potential participants were recruited through an Introduc-tory Psychology class and flyers displayed throughout the community requestingparticipants for a study of snake phobia. Exclusion criteria for all subjects includedMRI contraindication (e.g. pacemaker), claustrophobia, left-handedness, and historyof head trauma. Enrollment was limited to females due to the higher incidence ofsnake phobia in women as compared to men; creating a sample that was balancedacross gender in the snake-phobic group may have proven difficult. Eligible pho-bic participants scored greater than 18 on the Snake Questionnaire (SNAQ; Klieger,1987); control participants scored 3 or less. Diagnostic interviews were not con-ducted to evaluate phobics for clinically relevant simple phobia because it was feltthat the rarity of snakes in Wisconsin limited the daily impact of the fear; restrictingthe sample to clinical significance was unnecessarily strict. Three phobic subjectscompleted the simulation session but were not scanned: two subjects discontinuedtheir enrollment due to fear of the stimuli and one subject could not be comfortablypositioned in the MRI simulation mock scanner used to prepare participants for thescanning environment. Technical difficulties caused data from four control subjectsto be unusable, due to spatial warping of the functional data and/or problems withacquisition of functional data. The final sample size was 42, 21 of each phobic andcontrol participants. The average age of phobic participants was 19.6 years; controlsubjects were on average 20.4 years old.
2.2. Procedure
Enrolled participants first completed a simulation session in a mock MRI scan-ner to familiarize them with the scanning environment and ensure tolerability ofthe fearful stimuli. Subjects were placed in the mock MRI scanner and shown stimulisimilar but not identical to those used in the experimental trials. The real MRI scan-ning session occurred a few days to at most two weeks later, during which videoclips were presented as MR images, pupillary response, and electrodermal activ-ity data were collected. After MR scanning, subjects rated half of the video clips(randomly presented, half counterbalanced) presented on a computer outside thescanner. Valence and arousal ratings were collected for each video clip on a 1–7Likert scale. Written informed consent was given in accordance with the HumanSubjects Committee of the University of Wisconsin and subjects were paid eightydollars for participation.
2.3. Design and materials
Subjects were presented with 48 video clips approximately 2 s in duration, 16exemplars each of 3 types of videos. Video clip types included: snakes threateningin the direction of the camera, snakes slithering across the ground, and fish. Clipswere selected from a variety of nature programs. Slithering snakes and fish wereequated for direction of movement, i.e. toward versus away from the camera. Clipswere presented in random order in an event-related design with an average of 8 sof black screen between clips (average ITI = 10 s, range 8–12 s).
2.3.1. Pupillary, electrodermal and self-report data collection and analysisAn iView × system (v. 1.3.31) with eyetracking capabilities was integrated with
the fiber optic goggles used to present the video stimuli. Horizontal pupil diame-ter was acquired during fMRI scanning at a sampling rate of 60 Hz, and data wereprocessed using algorithms developed by Siegle, Steinhauer, and Thase (2004) usingMatLab software (MathWorks, Natick, MA). Blinks were identified and removedusing amplitude thresholds and remaining data were Z-scored within each partici-pant. Pupillary data were lost from 2 phobic subjects for which heavy eye makeupcaused difficulties in the software identifying the pupil. In remaining subjects, foreach video the average pupillary diameter was calculated for an 8-s window fromvideo onset, and the average response across all video presentations of each typethreatening snake, slithering snake and fish were entered into a Video Type × GroupANOVA. Estimated pupil response for individual videos were used for the concord-ance analyses described below.
Electrodermal response (EDA) was also collected simultaneous to fMRI trials,using 8 mm Ag–Ag/Cl electrodes placed on the distal phalanges of the index andmiddle fingers of the left hand. EDA signal was processed with a Matlab routinedeveloped in-house which low-pass filtered the data (0.7 Hz cutoff), and identifiedpeaks exceeding 0.05 �S in height. Due to the cold temperature in the scan room andhigh-frequency noise interference from the MR signal, only 13 subjects from eachgroup showed a reliable EDA response, which was defined as having at least 2 identi-fied peaks exceeding the 0.05 �S cutoff from each of the 3 video conditions. For thesesubjects, amplitude and frequency of response was calculated across each videotype, and these values were entered into separate Video Type × Group ANOVAs.
nd cognition: Neural, physiological and self-report correlates of016/j.biopsycho.2013.12.011
Generally, participants excluded from EDA analyses did not show suprathresholdresponses to the fish videos, and to the slithering snakes for control participants. Hadall data been included, the resultant ANOVAs would have been highly imbalanced.
Self-reported valence and arousal ratings were collected after completion of MRdata acquisition on a computer outside the scanning room. To constrain the length of
ING ModelB
al Psyc
tpaTv
apss
Si2
2
hba1i
gm
varsVawtass
jsctdeecvspjacTtaslc0
iymmoaadCaboRoatticf
ARTICLEIOPSY-6828; No. of Pages 11
H.S. Schaefer et al. / Biologic
he experiment, each participant viewed half (order counterbalanced) of the videosresented during the functional trials and rated them on a 1–7 Likert scale on valencend arousal. Ratings data were lost from one control subject due to computer failure.he average valence and arousal rating was computed for each video type, and thesealues were entered into separate Video Type × Group ANOVAs.
To assess whether these ancillary measures were describing overlapping vari-nce in response, Bartlett’s test of equality of covariance matrices was run comparinghobics and controls separately for each video type (threatening snake, slitheringnake and fish) across the variables: average EDA amplitude, pupillary response,elf-reported valence rating and self-reported arousal rating.
Significant interactions were probed with pairwise comparisons using a Leastignificant Difference adjustment for multiple comparisons. Only post hoc compar-sons of p < 0.05 are reported. Bartlett’s test was computed with R software version.6.0 for Macintosh.
.3.2. MR data collection and analysisMR images were collected with GE SIGNA 3.0 Tesla scanner equipped with
igh-speed, whole-body gradients and a whole-head transmit-receive quadratureirdcage headcoil. After scanner calibration, a T1-weighted, high-resolution SPGRnatomical scan was collected for localization of function (124 axial slices, each.2 mm thick). Functional data were collected in one 9-min run of 272 echo-planar
mages (EPI timepoints).A TR of 2 s was used (TE = 30 ms), to collect 30 interleaved 4 mm sagittal slices,
ap = 1 mm. The field-of-view for each slice was 240 by 240 mm, with a 64 by 64atrix. The resulting voxel size was 3.75 by 3.75 by 5 mm.
Data were processed with in-house software and the AFNI software package,ersion 2.52 for Mac OSX. Data processing steps included: data reconstruction with
1-voxel radius Fermi filter, correction for differences in slice-timing, 6 parameterigid-body motion correction and removal of skull and ghost artifacts. A least-quares GLM was run, fitting the timeseries from each voxel to an ideal Gammaariate hemodynamic response and entering the motion parameters in as covari-tes. For the analyses of concordance described below, the response to each videoas extracted separately; all other analyses were conducted on the average response
o each stimulus type (threatening snakes, slithering snakes, fish). The heights ofctivation to each video type or individual video were transformed into Talairachpace via identification of anatomical landmarks on the high-resolution anatomicalcan, and then blurred with a Gaussian filter (FWHM = 2 mm).
Voxel-by-voxel ANOVAs were run, inputting the activation maps from each sub-ect and stimulus type. The Group (phobic, control) by Video Type (threateningnake, slithering snake, fish) interaction was screened at p = 0.005 (mapwise p = 0.05orrected). Voxels making the initial threshold for the Group by Video Type interac-ion were subjected to simple effects contrasts, thresholded at the p < 0.005 level, toetermine the source of the interaction. Two a priori patterns of significance werextracted: (1) brain regions active during a normative fear response were those vox-ls showing greater response to threatening snakes versus slithering snakes withinontrol subjects, and not showing significantly greater activation to slithering snakesersus fish in controls (2) brain regions active during phobic response were thosehowing greater activation to threatening and slithering snakes versus fish withinhobic subjects and also showing greater activation in phobic versus control sub-
ects during the viewing of all snakes. Given the size and extent of clusters showing significant phobic response effect, some extending across multiple brain regions,lusters meeting significance for the phobic fear reaction were screened with thealairach atlas provided with the AFNI suite (Cox, 1996) dividing clusters accordingo anatomical boundaries. Correction for multiple testing was achieved by imposing
voxelwise F-threshold and minimum cluster size, which has been demonstrated aensitive method of alpha control (Logan and Rowe, 2004). Given the spatial corre-ation of the activation maps, Monte Carlo simulations determined that a voxel-wiseutoff of p = 0.005 and a minimum cluster size of 100 mm3, a map-wise p-value of.05 was achieved.
Additional tests were run to examine the relationships between activation indentified brain regions, and between brain activation and ancillary measures. Anal-ses of concordance were run, both across- and within-subjects, to address howeasures might be related. To assess whether activation across brain regions wasore highly correlated in one group versus another across subjects, Bartlett’s test
f equality of covariance matrices was run comparing brain activation in phobicsnd controls separately for each video type (threatening snake, slithering snakend fish). This test compares shared variance between two matrices of data and canetermine whether a set of variables is more related in one condition versus another.lusters used in this analysis were those identified in the normative fear reaction,s these regions are active in both phobics and controls. To determine whetherrain activation and ancilliary measures were correlated within-subjects, analysisf within-subject concordance was obtained by generating rank-order Spearman’s
correlation maps between brain activation and pupillary response to each videof threatening snakes. Separate Spearman’s R maps were obtained for each subjectnd these values were entered into a voxel-by-voxel t-test comparing the correla-
Please cite this article in press as: Schaefer, H. S., et al. Brain, body, aphobic and normative fear. Biol. Psychol. (2014), http://dx.doi.org/10.1
ion between pupillary and brain response in phobics versus controls. Data from thehreatening snakes condition was used in order to test for concordance specificallyn the maximally salient condition for both groups. Pupillary response was used foroncordance analyses because this variable provided the greatest range of responseor both groups, as ratings data were near ceiling level for the phobic group and the
PRESShology xxx (2014) xxx–xxx 3
modal electrodermal data response to the individual videos was less than 0.05 �S.Clusters meeting thresholds of p < 0.005 voxelwise and cluster size > 100 mm3 wereextracted and linear mixed models were run on cluster means to determine: (1)whether the ratings metrics also demonstrated within-subject concordance acrosseither or both groups, and (2) if there were group by condition effects indicatingsignificant activation to snake videos versus fish in one or both groups.
3. Results
3.1. Self-report
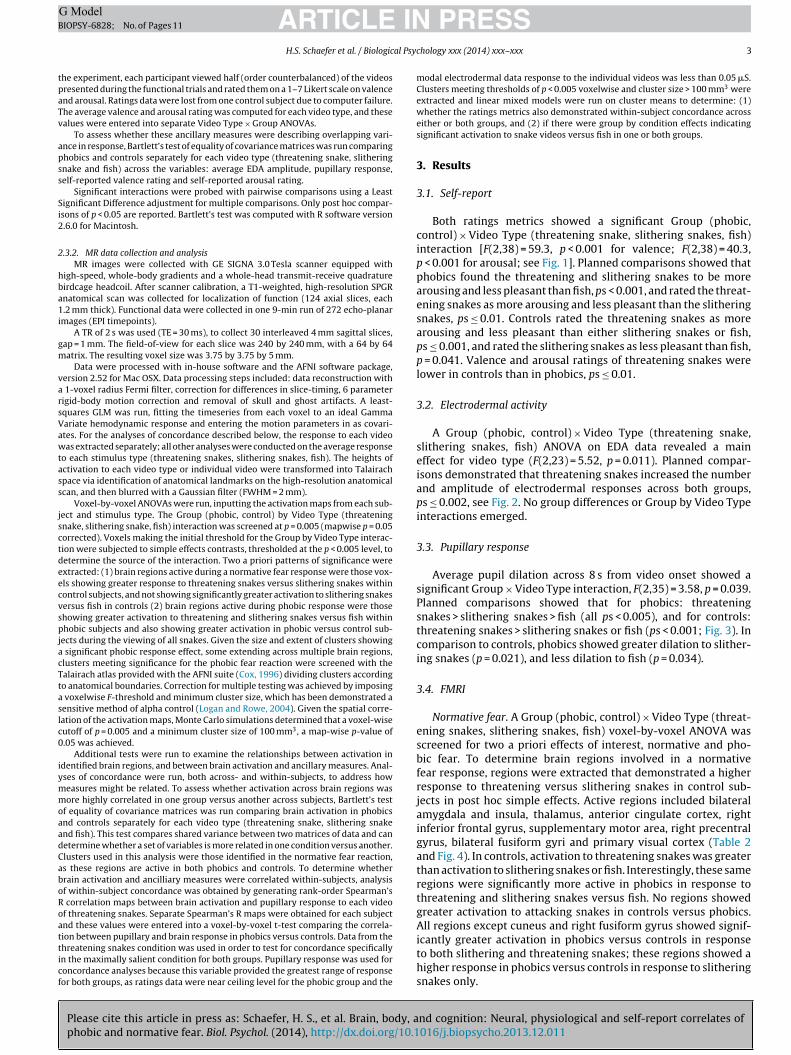
Both ratings metrics showed a significant Group (phobic,control) × Video Type (threatening snake, slithering snakes, fish)interaction [F(2,38) = 59.3, p < 0.001 for valence; F(2,38) = 40.3,p < 0.001 for arousal; see Fig. 1]. Planned comparisons showed thatphobics found the threatening and slithering snakes to be morearousing and less pleasant than fish, ps < 0.001, and rated the threat-ening snakes as more arousing and less pleasant than the slitheringsnakes, ps ≤ 0.01. Controls rated the threatening snakes as morearousing and less pleasant than either slithering snakes or fish,ps ≤ 0.001, and rated the slithering snakes as less pleasant than fish,p = 0.041. Valence and arousal ratings of threatening snakes werelower in controls than in phobics, ps ≤ 0.01.
3.2. Electrodermal activity
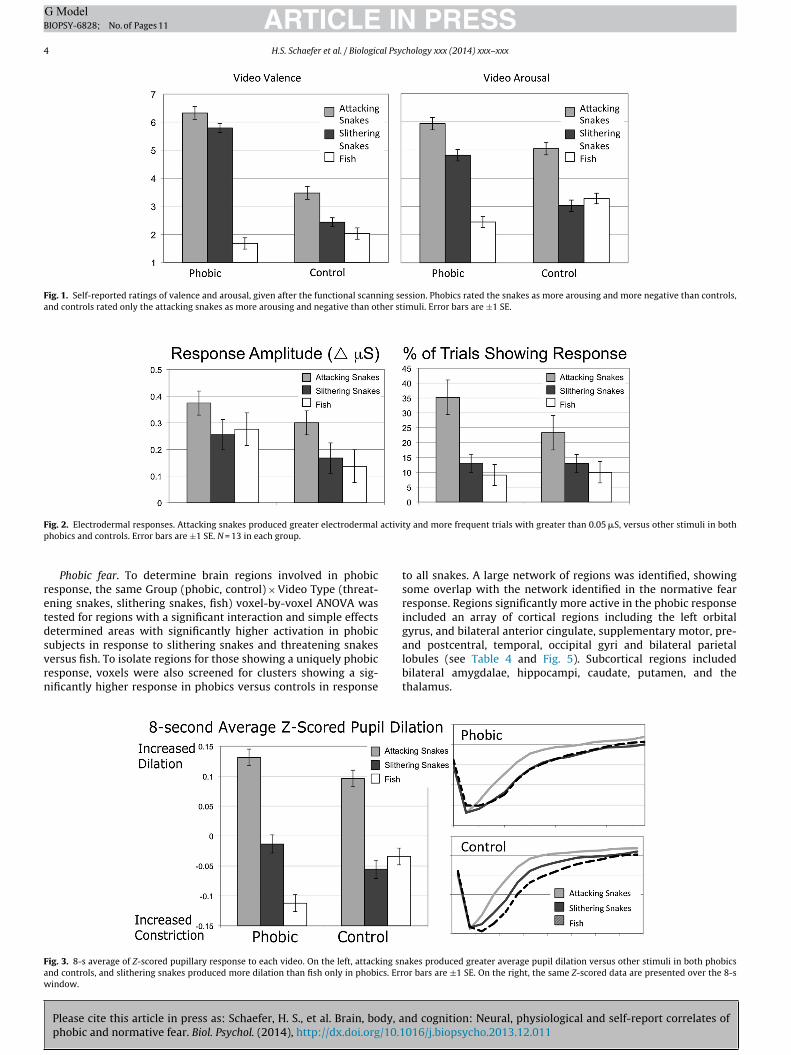
A Group (phobic, control) × Video Type (threatening snake,slithering snakes, fish) ANOVA on EDA data revealed a maineffect for video type (F(2,23) = 5.52, p = 0.011). Planned compar-isons demonstrated that threatening snakes increased the numberand amplitude of electrodermal responses across both groups,ps ≤ 0.002, see Fig. 2. No group differences or Group by Video Typeinteractions emerged.
3.3. Pupillary response
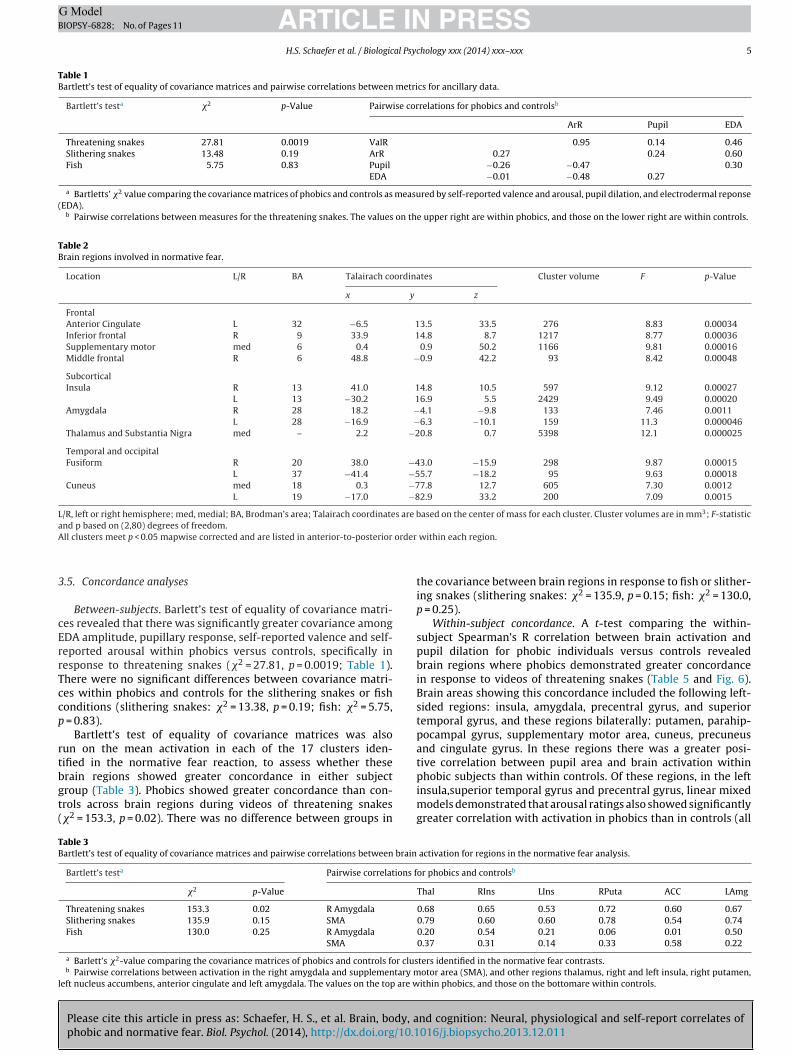
Average pupil dilation across 8 s from video onset showed asignificant Group × Video Type interaction, F(2,35) = 3.58, p = 0.039.Planned comparisons showed that for phobics: threateningsnakes > slithering snakes > fish (all ps < 0.005), and for controls:threatening snakes > slithering snakes or fish (ps < 0.001; Fig. 3). Incomparison to controls, phobics showed greater dilation to slither-ing snakes (p = 0.021), and less dilation to fish (p = 0.034).
3.4. FMRI
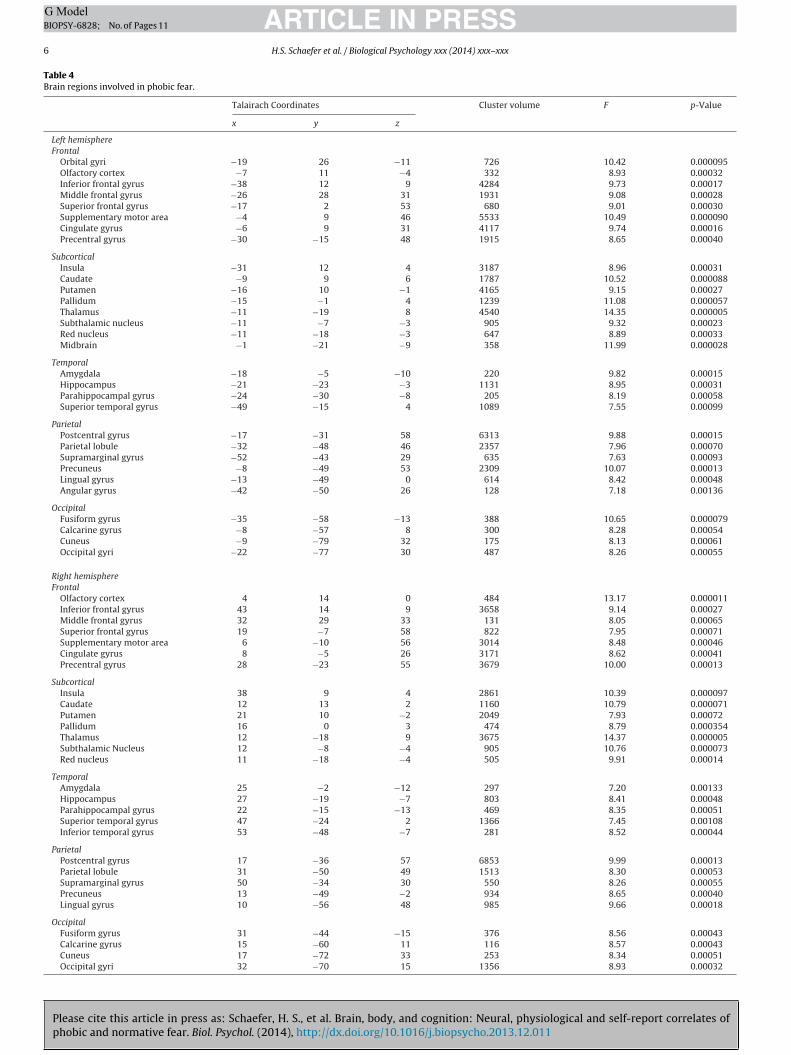
Normative fear. A Group (phobic, control) × Video Type (threat-ening snakes, slithering snakes, fish) voxel-by-voxel ANOVA wasscreened for two a priori effects of interest, normative and pho-bic fear. To determine brain regions involved in a normativefear response, regions were extracted that demonstrated a higherresponse to threatening versus slithering snakes in control sub-jects in post hoc simple effects. Active regions included bilateralamygdala and insula, thalamus, anterior cingulate cortex, rightinferior frontal gyrus, supplementary motor area, right precentralgyrus, bilateral fusiform gyri and primary visual cortex (Table 2and Fig. 4). In controls, activation to threatening snakes was greaterthan activation to slithering snakes or fish. Interestingly, these sameregions were significantly more active in phobics in response tothreatening and slithering snakes versus fish. No regions showedgreater activation to attacking snakes in controls versus phobics.All regions except cuneus and right fusiform gyrus showed signif-
nd cognition: Neural, physiological and self-report correlates of016/j.biopsycho.2013.12.011
icantly greater activation in phobics versus controls in responseto both slithering and threatening snakes; these regions showed ahigher response in phobics versus controls in response to slitheringsnakes only.
ARTICLE IN PRESSG ModelBIOPSY-6828; No. of Pages 11
4 H.S. Schaefer et al. / Biological Psychology xxx (2014) xxx–xxx
Fig. 1. Self-reported ratings of valence and arousal, given after the functional scanning session. Phobics rated the snakes as more arousing and more negative than controls,and controls rated only the attacking snakes as more arousing and negative than other stimuli. Error bars are ±1 SE.
F activip
retdsvrn
Faw
ig. 2. Electrodermal responses. Attacking snakes produced greater electrodermalhobics and controls. Error bars are ±1 SE. N = 13 in each group.
Phobic fear. To determine brain regions involved in phobicesponse, the same Group (phobic, control) × Video Type (threat-ning snakes, slithering snakes, fish) voxel-by-voxel ANOVA wasested for regions with a significant interaction and simple effectsetermined areas with significantly higher activation in phobic
Please cite this article in press as: Schaefer, H. S., et al. Brain, body, aphobic and normative fear. Biol. Psychol. (2014), http://dx.doi.org/10.1
ubjects in response to slithering snakes and threatening snakesersus fish. To isolate regions for those showing a uniquely phobicesponse, voxels were also screened for clusters showing a sig-ificantly higher response in phobics versus controls in response
ig. 3. 8-s average of Z-scored pupillary response to each video. On the left, attacking snnd controls, and slithering snakes produced more dilation than fish only in phobics. Errindow.
ty and more frequent trials with greater than 0.05 �S, versus other stimuli in both
to all snakes. A large network of regions was identified, showingsome overlap with the network identified in the normative fearresponse. Regions significantly more active in the phobic responseincluded an array of cortical regions including the left orbitalgyrus, and bilateral anterior cingulate, supplementary motor, pre-
nd cognition: Neural, physiological and self-report correlates of016/j.biopsycho.2013.12.011
and postcentral, temporal, occipital gyri and bilateral parietallobules (see Table 4 and Fig. 5). Subcortical regions includedbilateral amygdalae, hippocampi, caudate, putamen, and thethalamus.
akes produced greater average pupil dilation versus other stimuli in both phobicsor bars are ±1 SE. On the right, the same Z-scored data are presented over the 8-s
ARTICLE IN PRESSG ModelBIOPSY-6828; No. of Pages 11
H.S. Schaefer et al. / Biological Psychology xxx (2014) xxx–xxx 5
Table 1Bartlett’s test of equality of covariance matrices and pairwise correlations between metrics for ancillary data.
Bartlett’s testa �2 p-Value Pairwise correlations for phobics and controlsb
ArR Pupil EDA
Threatening snakes 27.81 0.0019 ValR 0.95 0.14 0.46Slithering snakes 13.48 0.19 ArR 0.27 0.24 0.60Fish 5.75 0.83 Pupil −0.26 −0.47 0.30
EDA −0.01 −0.48 0.27
a Bartletts’ �2 value comparing the covariance matrices of phobics and controls as measured by self-reported valence and arousal, pupil dilation, and electrodermal reponse(EDA).
b Pairwise correlations between measures for the threatening snakes. The values on the upper right are within phobics, and those on the lower right are within controls.
Table 2Brain regions involved in normative fear.
Location L/R BA Talairach coordinates Cluster volume F p-Value
x y z
FrontalAnterior Cingulate L 32 −6.5 13.5 33.5 276 8.83 0.00034Inferior frontal R 9 33.9 14.8 8.7 1217 8.77 0.00036Supplementary motor med 6 0.4 0.9 50.2 1166 9.81 0.00016Middle frontal R 6 48.8 −0.9 42.2 93 8.42 0.00048
SubcorticalInsula R 13 41.0 14.8 10.5 597 9.12 0.00027
L 13 −30.2 16.9 5.5 2429 9.49 0.00020Amygdala R 28 18.2 −4.1 −9.8 133 7.46 0.0011
L 28 −16.9 −6.3 −10.1 159 11.3 0.000046Thalamus and Substantia Nigra med – 2.2 −20.8 0.7 5398 12.1 0.000025
Temporal and occipitalFusiform R 20 38.0 −43.0 −15.9 298 9.87 0.00015
L 37 −41.4 −55.7 −18.2 95 9.63 0.00018Cuneus med 18 0.3 −77.8 12.7 605 7.30 0.0012
L 19 −17.0 −82.9 33.2 200 7.09 0.0015
L/R, left or right hemisphere; med, medial; BA, Brodman’s area; Talairach coordinates are based on the center of mass for each cluster. Cluster volumes are in mm3; F-statisticaA order
3
cErrTccp
rtbgt(
TB
l
nd p based on (2,80) degrees of freedom.ll clusters meet p < 0.05 mapwise corrected and are listed in anterior-to-posterior
.5. Concordance analyses
Between-subjects. Barlett’s test of equality of covariance matri-es revealed that there was significantly greater covariance amongDA amplitude, pupillary response, self-reported valence and self-eported arousal within phobics versus controls, specifically inesponse to threatening snakes (�2 = 27.81, p = 0.0019; Table 1).here were no significant differences between covariance matri-es within phobics and controls for the slithering snakes or fishonditions (slithering snakes: �2 = 13.38, p = 0.19; fish: �2 = 5.75,
= 0.83).Bartlett’s test of equality of covariance matrices was also
un on the mean activation in each of the 17 clusters iden-ified in the normative fear reaction, to assess whether these
Please cite this article in press as: Schaefer, H. S., et al. Brain, body, aphobic and normative fear. Biol. Psychol. (2014), http://dx.doi.org/10.1
rain regions showed greater concordance in either subjectroup (Table 3). Phobics showed greater concordance than con-rols across brain regions during videos of threatening snakes�2 = 153.3, p = 0.02). There was no difference between groups in
able 3artlett’s test of equality of covariance matrices and pairwise correlations between brain
Bartlett’s testa Pairwise correlations f
�2 p-Value
Threatening snakes 153.3 0.02 R Amygdala
Slithering snakes 135.9 0.15 SMA
Fish 130.0 0.25 R Amygdala
SMA
a Barlett’s �2-value comparing the covariance matrices of phobics and controls for clusb Pairwise correlations between activation in the right amygdala and supplementary m
eft nucleus accumbens, anterior cingulate and left amygdala. The values on the top are w
within each region.
the covariance between brain regions in response to fish or slither-ing snakes (slithering snakes: �2 = 135.9, p = 0.15; fish: �2 = 130.0,p = 0.25).
Within-subject concordance. A t-test comparing the within-subject Spearman’s R correlation between brain activation andpupil dilation for phobic individuals versus controls revealedbrain regions where phobics demonstrated greater concordancein response to videos of threatening snakes (Table 5 and Fig. 6).Brain areas showing this concordance included the following left-sided regions: insula, amygdala, precentral gyrus, and superiortemporal gyrus, and these regions bilaterally: putamen, parahip-pocampal gyrus, supplementary motor area, cuneus, precuneusand cingulate gyrus. In these regions there was a greater posi-tive correlation between pupil area and brain activation within
nd cognition: Neural, physiological and self-report correlates of016/j.biopsycho.2013.12.011
phobic subjects than within controls. Of these regions, in the leftinsula,superior temporal gyrus and precentral gyrus, linear mixedmodels demonstrated that arousal ratings also showed significantlygreater correlation with activation in phobics than in controls (all
activation for regions in the normative fear analysis.
or phobics and controlsb
Thal RIns LIns RPuta ACC LAmg
0.68 0.65 0.53 0.72 0.60 0.670.79 0.60 0.60 0.78 0.54 0.740.20 0.54 0.21 0.06 0.01 0.500.37 0.31 0.14 0.33 0.58 0.22
ters identified in the normative fear contrasts.otor area (SMA), and other regions thalamus, right and left insula, right putamen,ithin phobics, and those on the bottomare within controls.
Please cite this article in press as: Schaefer, H. S., et al. Brain, body, and cognition: Neural, physiological and self-report correlates ofphobic and normative fear. Biol. Psychol. (2014), http://dx.doi.org/10.1016/j.biopsycho.2013.12.011
ARTICLE IN PRESSG ModelBIOPSY-6828; No. of Pages 11
6 H.S. Schaefer et al. / Biological Psychology xxx (2014) xxx–xxx
Table 4Brain regions involved in phobic fear.
Talairach Coordinates Cluster volume F p-Value
x y z
Left hemisphereFrontal
Orbital gyri −19 26 −11 726 10.42 0.000095Olfactory cortex −7 11 −4 332 8.93 0.00032Inferior frontal gyrus −38 12 9 4284 9.73 0.00017Middle frontal gyrus −26 28 31 1931 9.08 0.00028Superior frontal gyrus −17 2 53 680 9.01 0.00030Supplementary motor area −4 9 46 5533 10.49 0.000090Cingulate gyrus −6 9 31 4117 9.74 0.00016Precentral gyrus −30 −15 48 1915 8.65 0.00040
SubcorticalInsula −31 12 4 3187 8.96 0.00031Caudate −9 9 6 1787 10.52 0.000088Putamen −16 10 −1 4165 9.15 0.00027Pallidum −15 −1 4 1239 11.08 0.000057Thalamus −11 −19 8 4540 14.35 0.000005Subthalamic nucleus −11 −7 −3 905 9.32 0.00023Red nucleus −11 −18 −3 647 8.89 0.00033Midbrain −1 −21 −9 358 11.99 0.000028
TemporalAmygdala −18 −5 −10 220 9.82 0.00015Hippocampus −21 −23 −3 1131 8.95 0.00031Parahippocampal gyrus −24 −30 −8 205 8.19 0.00058Superior temporal gyrus −49 −15 4 1089 7.55 0.00099
ParietalPostcentral gyrus −17 −31 58 6313 9.88 0.00015Parietal lobule −32 −48 46 2357 7.96 0.00070Supramarginal gyrus −52 −43 29 635 7.63 0.00093Precuneus −8 −49 53 2309 10.07 0.00013Lingual gyrus −13 −49 0 614 8.42 0.00048Angular gyrus −42 −50 26 128 7.18 0.00136
OccipitalFusiform gyrus −35 −58 −13 388 10.65 0.000079Calcarine gyrus −8 −57 8 300 8.28 0.00054Cuneus −9 −79 32 175 8.13 0.00061Occipital gyri −22 −77 30 487 8.26 0.00055
Right hemisphereFrontal
Olfactory cortex 4 14 0 484 13.17 0.000011Inferior frontal gyrus 43 14 9 3658 9.14 0.00027Middle frontal gyrus 32 29 33 131 8.05 0.00065Superior frontal gyrus 19 −7 58 822 7.95 0.00071Supplementary motor area 6 −10 56 3014 8.48 0.00046Cingulate gyrus 8 −5 26 3171 8.62 0.00041Precentral gyrus 28 −23 55 3679 10.00 0.00013
SubcorticalInsula 38 9 4 2861 10.39 0.000097Caudate 12 13 2 1160 10.79 0.000071Putamen 21 10 −2 2049 7.93 0.00072Pallidum 16 0 3 474 8.79 0.000354Thalamus 12 −18 9 3675 14.37 0.000005Subthalamic Nucleus 12 −8 −4 905 10.76 0.000073Red nucleus 11 −18 −4 505 9.91 0.00014
TemporalAmygdala 25 −2 −12 297 7.20 0.00133Hippocampus 27 −19 −7 803 8.41 0.00048Parahippocampal gyrus 22 −15 −13 469 8.35 0.00051Superior temporal gyrus 47 −24 2 1366 7.45 0.00108Inferior temporal gyrus 53 −48 −7 281 8.52 0.00044
ParietalPostcentral gyrus 17 −36 57 6853 9.99 0.00013Parietal lobule 31 −50 49 1513 8.30 0.00053Supramarginal gyrus 50 −34 30 550 8.26 0.00055Precuneus 13 −49 −2 934 8.65 0.00040Lingual gyrus 10 −56 48 985 9.66 0.00018
OccipitalFusiform gyrus 31 −44 −15 376 8.56 0.00043Calcarine gyrus 15 −60 11 116 8.57 0.00043Cuneus 17 −72 33 253 8.34 0.00051Occipital gyri 32 −70 15 1356 8.93 0.00032

ARTICLE IN PRESSG ModelBIOPSY-6828; No. of Pages 11
H.S. Schaefer et al. / Biological Psychology xxx (2014) xxx–xxx 7
F er actia ed thev rols to
prca
TB
ig. 4. Brain regions showing activation consistent with normative fear, e.g., greatnd activation traces are taken from the right amygdala (RA), but all clusters showersus fish in these clusters, and activation in phobics was greater than that in cont
’s < 0.05), signifying concordance across both self-report and pupil
Please cite this article in press as: Schaefer, H. S., et al. Brain, body, aphobic and normative fear. Biol. Psychol. (2014), http://dx.doi.org/10.1
eaction in predicting brain activation. For the left hemispherelusters anterior insula, insula and superior temporal gyrus, brainctivation in control subjects was significantly greater in response
able 5rain regions showing coherence between brain and pupillary response within phobics.
Hemi Talairach coordinates
x y
FrontalSupplementary motor area R 2 8
Precentral gyrus L −44 0
Cingulate gyrus medial 0 −11
SubcorticalAnterior insula L −26 20
Insula L −38 11
Putamen R 25 2
L −23 −2
Lentiform nucleus L −30 −19
TemporalAmygdala L −22 −2
Superior temporal gyrus L −51 −4
L −58 −34
L −53 −48
Parahippocampal gyrus R 12 −33
L −11 −36
ParietalLingual gyrus L −18 −61
Precuneus R 7 −72
OccipitalCuneus medial 6 −71
medial 0 −73
Middle occipital gyrus L −22 −86
vation in controls to attacking snakes versus slithering snakes. Bottom: Bar graph same pattern of significance. Phobics also showed greater activation to all snakes
the snake stimuli.
to threatening snakes than to slithering snakes or fish (all p’s < 0.05),
nd cognition: Neural, physiological and self-report correlates of016/j.biopsycho.2013.12.011
suggesting that these brain regions garner a reliable normative fearresponse, but that activation does not correlate with self-report orpupil dilation.
Cluster volume t p-Value
z
48 131 3.28 0.002339 150 3.37 0.001836 108 3.27 0.0023
−5 100 3.20 0.0028−5 787 3.41 0.0016
0 598 3.29 0.00222 831 3.39 0.00224 493 3.31 0.0021
−8 170 3.36 0.0018−2 1149 3.47 0.001319 128 3.32 0.002014 865 3.34 0.0019−4 103 3.32 0.0021
0 210 3.59 0.0010
−2 159 3.19 0.002941 411 3.34 0.0020
31 140 3.15 0.003214 380 3.29 0.002220 242 3.58 0.0010

Please cite this article in press as: Schaefer, H. S., et al. Brain, body, and cognition: Neural, physiological and self-report correlates ofphobic and normative fear. Biol. Psychol. (2014), http://dx.doi.org/10.1016/j.biopsycho.2013.12.011
ARTICLE IN PRESSG ModelBIOPSY-6828; No. of Pages 11
8 H.S. Schaefer et al. / Biological Psychology xxx (2014) xxx–xxx
Fig. 5. Brain regions showing activation consistent with phobic fear, e.g., greater activation in phobics to either attacking or slithering snakes versus fish and also greateractivation in phobics than controls in response to snakes. Labeled regions of interest include the orbitofrontal cortex (OFC), right and left amygdala (RA, LA), hippocampus(HC), and supplementary motor area (SMA). Bottom: bar graph and activation traces are taken from the left putamen (LPut), but all clusters showed this pattern of significance.Phobics also showed greater activation to all snakes versus fish in these clusters, and activation in phobics was greater than that in controls to the snake simuli.
Fig. 6. Top: brain regions showing concordance between brain activation and pupil response for phobics more than controls in response to videos of attacking snakes. Bottom:correlation between pupil dilation and brain activation in response to each of the 16 video clips of threatening snakes. These data are taken from the supplementary motorarea cluster (SMA), but all clusters show significantly greater positive correlation between pupil and brain activity for phobics versus controls. Pupil dilation is expressed inarea under the curve (AUC) across and 8-s window of the Z-transformed time course.

ING ModelB
al Psyc
4
snaf2biicmasppewrwif
4
wtaavawnvWii
ca2pbswdfi2p2bspffraaKpwtr
ARTICLEIOPSY-6828; No. of Pages 11
H.S. Schaefer et al. / Biologic
. Discussion
This study is unique in its direct and simultaneous compari-on of normative and phobic fear, finding overlapping yet distinctetworks that characterize each. While other investigations havedded to the understanding of phobic fear, and compared phobicear to normative responses to phobogenic stimuli, (e.g. Ahs et al.,009), the current study adds to this literature a direct comparisonetween phobic fear and normative fear reactions. Normative fear
s characterized by a series of brain regions frequently implicatedn threat responding and negative affect, including the anterioringulate, supplementary motor area, insula, amygdala, and thala-us, as well as visual processing regions such as the fusiform gyrus
nd cuneus. Significant eletrodermal responses, pupil dilation, andelf-reported reaction to the attacking snakes within nonphobicersons confirms a reliable normative threat response across brain,eriphery and self-reported perception, under conditions wheremotional intensity is high. Phobic fear was characterized by moreidespread activation, and more intense physiological and self-
eported reactions. While participants were not formally diagnosedith a clinically significant phobic disorder, their behavioral, phys-
ological and neural responses indicate that their experience wasar more affectively evocative than that of nonphobics.
.1. Phobic versus normative fear
Phobic fear, in contrast, recruits, on the one hand, larger volumesithin the same brains regions identified in normative fear, and, on
he other hand, several cortical and subcortical regions not associ-ted here with normal fear. Widespread activation across parietalnd occipital regions in the phobic reaction suggests extensiveisual processing and environmental vigilance that is frequentlyssociated with phobic fear (Ohman & Mineka, 2001). A larger net-ork of the motor system was also recruited in phobia versusormative fear, including precentral cortex, red nucleus and largerolumes of the supplementary motor area (SMA), and putamen.hile a small region of SMA was activated during normative fear,
n phobic fear widespread activation across multiple motor regionsmplies a more concerted, intense fight-or-flight response.
The current paradigm replicated activation in brain regionsommonly associated with phobic responses, notably the insula,mygdala, anterior cingulate, and thalamus, (e.g. Del Casale et al.,012). In agreement with a large literature on fear and threat res-onding, the amygdala reliably responded to both types of fear,ut the phobic reaction again recruited a larger volume of thistructure. Orbitofrontal cortex and hippocampal regions, whichere uniquely active during phobic fear, might underlie the con-itioned avoidance characteristic of phobic, but not normativeear. OFC has been implicated in conditioning paradigms, specif-cally signaling the reinforcement value of stimuli (Phelps et al.,004) in a top-down manner (Wright et al., 2008), while hip-ocampal regions trigger contextual memory of threat (Milad et al.,007). Together, these regions may serve to maintain the pho-ia by recalling previous episodes of fear and associating thenake with a fearful response. This interpretation agrees withrevious work suggesting that the phobic response may ariserom conditioning mechanisms operating within the normativeear network (Schweckendiek et al., 2011). Additional prefrontalegions were implicated during phobic fear in areas previouslyssociated with emotion regulation (Goldin et al., 2008) andwareness of the self (Macrae, Moran, Heatherton, Banfield, &elley 2004). Conceptually this aligns with the experience of
Please cite this article in press as: Schaefer, H. S., et al. Brain, body, aphobic and normative fear. Biol. Psychol. (2014), http://dx.doi.org/10.1
hobic versus normative fear, with the former often associatedith self-reports of embarrassment and attempts to downregulate
he fear response. As with the normative fear response, self-eported experience, electrodermal activity and pupil reactivity
PRESShology xxx (2014) xxx–xxx 9
show greater response to images of snakes than non-snakevideos in phobic persons, suggesting phobic and normative fearshare some experiential and physiological characteristics. Overall,the phobic response overlaps with the normative fear responsein self-report, autonomic activity and threat-responsive brainregions. Within these regions, phobia is associated with greaterstrength of activation than normative fear responding, exceptfor regions implicated in primary visual processing, such as thecuneus. Further, the phobic reaction recruits additional struc-tures involved in environmental vigilance, motor control, emotionregulation, and memory traces that may maintain the phobicresponse.
4.1.1. Phobic versus normative fear concordanceMoreover, the phobic response demonstrates concordance
between subjective self-report, autonomic physiology, and brainactivity whereas normative fear does not. This certainly holdstrue across subjects, that is, phobic individuals showing greaterbrain activation in response to images of snakes also experiencedstrong peripheral responses and reported more intense emotions.This effect was not present in normative fear. In fact, within con-trols, measures of peripheral physiology were somewhat positivelyrelated to each other, but were inversely related to self-report.The finding implies that concordance was not present across sys-tems in normative fear, and agrees with previous work suggestingthat individuals who are behaviorally less expressive are morephysiologically reactive (e.g. Gross & Levenson, 1993). Importantly,however, concordance was also observed within individuals withsnake phobia; those images that induce greater brain responsefor a given phobic person also induce stronger pupillary dilationand are rated are more arousing. Although this result arose froma subset of study participants due to data quality concerns, thephenomenon of concordance between brain, body, and behaviorthat is suggested adds an important facet to better understandingthe phobic response. Brain regions demonstrating this within-subject correlation involve a subset of those previously identifiedduring the phobic fear reaction and several that are also impli-cated in normative fear reactions. Concordance observed withinthe amygdala is not surprising as it is the structure most com-monly associated with the experience of fear (Phan, Wager, Taylor,& Liberzon, 2002) and has shown functional connectivity withvisual processing regions in fear perception (Sabatinelli et al., 2005).Further, the phobic reaction has been associated with feelings ofdisgust and several regions found to be coherent between brainand autonomic activity, such as the anterior insula and puta-men, are frequently associated with feelings of disgust. Stark et al.(2007) found disgust-related insula activation that correlated withself-reported disgust, suggesting that the concordance seen heremight be specifically related to a disgust component of phobia.The overall pattern of concordance among brain regions impliesthat fear, visual processing, motor preparation, autonomic activityand disgust act in concert during the most intense phobic reac-tions.
The normative fear reaction brings about reliable changes inbrain activation, pupil dilation and self-reported affect, but thesesystems do not systematically relate to each other as in phobicfear. It remains to be determined whether this concordance dur-ing the phobic reaction is a function of intensity of experience or ischaracteristic of psychopathology in particular. This is an importantqualification, as it is yet unclear whether concordance could be con-sidered a marker of pathology or is simply a barometer of intensityof experience. Further, the current work was limited with respect
nd cognition: Neural, physiological and self-report correlates of016/j.biopsycho.2013.12.011
to the size of the sample, which prohibited analysis of subgroups, aswell as the demographics (predominantly Caucasian college-agedfemales). Other studies looking for concordance across subjectshave suggested that some groups, such as older adults or males,

ING ModelB
1 al Psy
mccsniwailrtalciiicr
fWeamMfdccrefsact
tvuadapGrrsiosrvhtta
A
Ab
ARTICLEIOPSY-6828; No. of Pages 11
0 H.S. Schaefer et al. / Biologic
ay show this relationship less than others during anxiety provo-ation (Stoyanova & Hope, 2012; Teachman & Gordon, 2009). In theurrent study, concordance was observed singularly in the mostalient condition, e.g. the phobic response to attacking snakes, andot in normative fear or in the phobic response to less threaten-
ng snakes. This was true across subjects, in that phobic individualsho were highly reactive on one measure were highly reactive on
nother. Importantly, concordance was also found within subjects,.e. within a given individual videos that were rated as particu-arly distressing also engendered high behavioral and physiologicalesponses, and those videos that were less arousing had lower reac-ions across measures. This implies that concordance is primarily
function of strength of response, and failure to find such corre-ations in less salient experimental conditions may explain whyoncordance has been difficult to demonstrate. Phobic provocations an intensely fearful experience and it may be challenging to eth-cally induce a comparable level of fear, particularly in a functionalmaging paradigm. Nonetheless, could such a salient and fearfulondition be produced in a nonphobic person, concordance mayesult.
While a picture of phobic and normative fear reactions appearsrom these data, there are several avenues yet to be explored.
hile the prefrontal activations observed align with studies ofmotion regulation, other investigations of simple phobia havettributed prefrontal activity to cognitive misattributions com-only reported in phobia, such overestimation of threat (Straube,entzel, & Miltner, 2007). More precise differentiation of pre-
rontal activation into those regions attempting to regulate, orampen the phobic response, versus those regions that areognitively exacerbating it would provide insight into the pro-esses underlying and maintaining phobias as well as otheruminative disorders such as depression and generalized anxi-ty disorder. While outside the scope of the current investigation,unctional connectivity analyses may better illuminate the relation-hip between brain regions active in the phobic response. Suchnalyses may provide additional support to the hypothesis thatoncordance is a significant factor in phobic symptom provoca-ion.
In a different vein, treatment of simple phobia with exposureherapy remains an extremely effective method for symptom alle-iation, but whether concordance may fit into this effect is yetnclear. Treatment of simple phobia via exposure therapy has beenssociated with reduction in activity in regions implicated in con-itioned responses and emotion regulation (Paquette et al., 2003),s well as in regions frequently associated with phobic symptomrovocation, including the anterior cingulate and insula (Straube,lauer, Dilger, Mentzel & Miltner, 2006), and basal ganglia and
ight PFC (Ipser, Singh, & Stein, 2013). Given that many of theseegions demonstrated concordance in the current study, it is pos-ible that treatment effects could result from a gradual reductionn concordance with continued exposures. Alternatively, the effectf treatment might be explained by additional cognitive regulationtrategies being brought online to dampen automatic and coherentesponses. While simultaneous activity across autonomic, motor,isual and affective systems may characterize phobic fear episodes,ow these systems relate during treatment and recovery is impor-ant to better understand phobic fear reduction and may also applyo the treatment of other intense affective conditions, such as panicnd post-traumatic stress.
cknowledgements
Please cite this article in press as: Schaefer, H. S., et al. Brain, body, aphobic and normative fear. Biol. Psychol. (2014), http://dx.doi.org/10.1
The authors would like to thank Kristin Paul and Michaelnderle for their help in data collection. This work was supportedy NIMH Merit Award R37-MH-43454 awarded to RJ Davidson.
PRESSchology xxx (2014) xxx–xxx
References
Ahs, F., Pissiota, A., Michelgard, A., Frans, O., Furmark, T., Appel, L., et al. (2009).Disentangling the web of fear: Amygdala reactivity and functional connec-tivity in spider and snake phobia. Psychiatry Research: Neuroimaging, 172,103–108.
Arntz, A., Lavy, E., Van den Berg, G., & Van Rijsoort, S. (1993). Negative beliefs of spiderphobics: A psychometric evaluation of the Spider Phobia Beliefs Questionnaire.Advances in Behavior Research and Therapy, 15(4), 257–277.
Cox, R. W. (1996). AFNI: Software for analysis and visualization of functionalmagnetic resonance neuroimages. Computers and Biomedical Research, 29,162–173.
Davidson, J. (2005). Contesting stigma and contested emotions: Personal experienceand public perception of specific phobias. Social Science and Medicine, 61(10),2155–2164.
Davidson, R., Marshall, J., Tomarken, A., & Henriques, J. (2000). While a phobic waits:Regional brain electrical and autonomic activity in social phobics during antic-ipation of public speaking. Biological Psychiatry, 47(2), 85–95.
de Jong, P., Peters, M., & Vanderhallen, I. (2002). Disgust and disgust sensitivity inspider phobia: Facial EMG in response to spider and oral disgust imagery. Journalof Anxiety Disorders, 16(5), 477–493.
Del Casale, A. D., Ferracuti, S., Rapinesi, C., Serata, D., Piccirilli, M., Savoja, V., et al.(2012). Functional Neuroimaging in specific phobia. Psychiatry Research: Neu-roimaging, 202, 181–197.
Fernández-Dols, J., Sánchez, F., Carrera, P., & Ruiz-Belda, M. (1997). Are spontaneousexpressions and emotions linked? An experimental test of coherence. Journal ofNonverbal Behavior, 21(3), 163–177.
Goldin, P. R., McRae, K., Ramel, W., & Gross, J. J. (2008). The neural basis of emo-tion regulation: Reappraisal and suppression of negative emotion. BiologicalPsychiatry, 63, 577–586.
Gross, J., & Levenson, R. (1993). Emotional suppression: Physiology, self-report, andexpressive behavior. Journal of Personality and Social Psychology, 64(6), 970–986.
Hamm, A., Cuthbert, B., Globisch, J., & Vaitl, D. (1997). Fear and the startle reflex:Blink modulation and autonomic response patterns in animal and mutilationfearful subjects. Psychophysiology, 34(1), 97–107.
Hariri, A. R., Mattay, V. S., Tessitore, A., Fera, F., & Weinberger, D. R. (2003). Neocorticalmodulation of the maygdala response to fearful stimuli. Biological Psychiatry, 53,494–501.
Hermann, A., Schafer, A., Walter, B., Stark, R., Vaitl, D., & Schienle, A. (2009). Emotionregulation in spider phobia: Role of the medial prefrontal cortex. Social Cognitiveand Affective Neuroscience, 4, 257–276.
Ipser, J. C., Singh, L., & Stein, D. J. (2013). Meta-analysis of functional brain imagingin specific phobia. Psychiatry and Clinical Neurosciences, 67, 311–322.
Kindt, M., & Brosschot, J. F. (1997). Phobia-related cognitive bias for pictoral andlinguistic stimuli. Journal of Abnormal Psychology, 106(4), 644–648.
Klieger, D. (1987). The Snake Anxiety Questionnaire as a measure of ophidophobia.Educational and Psychological Measurement, 47(2), 449–459.
Knight, D. C., Cheng, D. T., Smith, C. N., Stein, E. A., & Helmstetter, F. J. (2004). Neu-ral substrates mediating human delay and trace fear conditioning. Journal ofNeuroscience, 24(1), 218–228.
Koch, M., O’Neill, H., Sawchuk, C., & Connolly, K. (2002). Domain-specific andgeneralized disgust sensitivity in blood-injection-injury phobia: The applica-tion of behavioral approach/avoidance tasks. Journal of Anxiety Disorders, 16(5),511–527.
Logan, B. R., & Rowe, D. B. (2004). An evaluation of thresholding techniques in fMRIanalysis. Neuroimage, 22, 95–108.
Lloyd, D., Morrison, I., & Roberts, N. (2006). Role for human posterior parietal cor-tex in visual processing of aversive objects in peripersonal space. Journal ofNeurophysiology, 95(1), 205–214.
Macrae, C. N., Moran, J. M., Heatherton, T. F., Banfield, J. F., & Kelley, W. M. (2004).Medial prefrontal activity predicts memory for self. Cerebral Cortex, 14(6),647–654.
Matsumoto, D., Nezlek, J., & Koopmann, B. (2007). Evidence for universality in phen-omenological emotion response system coherence. Emotion, 7(1), 57–67.
Mauss, I. B., Levenson, R. W., McCarter, L., Wilhelm, F. H., & Gross, J. J. (2005). Thetie that binds? Coherence among emotion experience, behavior and physiology.Emotion, 5(2), 175–190.
Mayer, B., Merckelback, H., & Muris, P. (2000). Self-reported automaticity and irra-tionality in psoder phobia. Psychological Reports, 87(2), 395–405.
Milad, M. R., Wright, C. I., Orr, S. P., Pitman, R. K., Quirk, G. J., & Rauch, S. L. (2007).Recall of fear extinction in humans activates the ventromedial prefrontal cortexand the hippocampus in concert. Biological Psychiatry, 62, 446–454.
Mizes, J. S., Landolf-Fritsche, B., & Grossman-McKee, D. (1987). Patterns of distortedcognitions in phobic disorders: An investigation of clinically severe simple pho-bics, social phobics and agoraphobics. Cognitive Therapy and Research, 11(5),583–592.
Moratti, S., & Keil, A. (2005). Cortical activation during Pavlovian fear conditioningdepends on heart rate response patterns: An MEG study. Cognitive Brain Research,25(2), 459–471.
Öhman, A., Flykt, A., & Esteves, F. (2001). Emotion drives attention: Detecting thesnake in the grass. Journal of Experimental Psychology: General, 130(3), 466–478.
nd cognition: Neural, physiological and self-report correlates of016/j.biopsycho.2013.12.011
Ohman, A., & Mineka, S. (2001). Fears, phobias and preparedness: Toward an evolvedmodule of fear and fear learning. Psychological Review, 108, 483–522.
Paquette, V., Levesque, J., Mensour, B., Leroux, J. M., Beaudoin, G., Bourgouin,P., et al. (2003). Change the mind and you change the brain: Effects of
ING ModelB
al Psyc
P
P
R
R
R
S
S
S
S
S
ARTICLEIOPSY-6828; No. of Pages 11
H.S. Schaefer et al. / Biologic
cognitive-behavioral therapy on the neural correlates of spider phobia. Neu-roimage, 18(2), 401–409.
han, K. L., Wager, T., Taylor, S. F., & Liberzon, I. (2002). Functional neuroanatomyof emotion: A meta-analysis of emotion activation studies in PET and fMRI.Neuroimage, 16, 331–348.
helps, E. A., Delgado, M. R., Nearing, K. I., & LeDoux, J. E. (2004). Extinction learningin humans: Role of the amygdala and vmPFC. Neuron, 43, 897–905.
einhard, G., Lachnit, H., & König, S. (2006). Tracking stimulus processing in Pavlo-vian pupillary conditioning. Psychophysiology, 43(1), 73–83.
osenberg, E., & Ekman, P. (1994). Coherence between expressive and experientialsystems in emotion. Cognition and Emotion, 8(3), 201–229.
osenberg, E., & Ekman, P. (1997). Coherence between expressive and experientialsystems in emotion. What the face reveals: Basic and applied studies of sponta-neous expression using the Facial Action Coding System (FACS). New York, NY,USA: Oxford University Press.
abatinelli, D., Bradley, M. M., Fitzsimmons, J. R., & Lang, P. J. (2005). Parallelamygdala and inferotemporal activation reflect emotional intensity and fearrelevance. Neuroimage, 24, 1265–1270.
arlo, M., Palomba, D., Angrilli, A., & Stegagno, L. (2002). Blood phobia and spiderphobia: Two specific phobias with different autonomic cardiac modulations.Biological Psychology, 60(2), 91–108.
artory, G., Rachman, S., & Grey, S. (1977). An investigation of the relationbetween reported fear and heart rate. Behaviour Research and Therapy, 15(5),435–438.
chienle, A., Schafer, A., Hermann, A., Rohrmann, S., & Vaitl, D. (2007). Symptom
Please cite this article in press as: Schaefer, H. S., et al. Brain, body, aphobic and normative fear. Biol. Psychol. (2014), http://dx.doi.org/10.1
provocation and reduction in patients suffering for spider phobia. EuropeanArchives of Psychiatry and Clinical Neuroscience, 257, 486–493.
chweckendiek, J., Klucken, T., Merz, C. J., Tabbert, K., Walter, B., Ambach, W., et al.(2011). Weaving the (neuronal) web: Fear learning in spider phobia. Neuroimage,54, 681–688.
PRESShology xxx (2014) xxx–xxx 11
Siegle, G., Steinhauer, S., & Thase, M. (2004). Pupillary assessment and computationalmodeling of the Stroop task in depression. International Journal of Psychophysi-ology, 52(1), 63–76.
Stark, R., Zimmerman, M., Kagerer, S., Schienle, A., Walter, B., Weygandt, M., et al.(2007). Hemodynamic brain correlates of disgust and fear ratings. Neuroimage,37, 663–673.
Stoyanova, M., & Hope, D. A. (2012). Gender, gender roles, and anxiety: Perceivedconfirmability of self report, behavioral avoidance, and physiological reactivity.Journal of Anxiety Disorders, 26(1), 206–214.
Straube, T., Glauer, M., Dilger, S., Mentzel, H.-J., & Miltner, W. H. R. (2006). Effects ofcognitive-behavioral therapy on brain activation in specific phobia. Neuroimage,29, 125–135.
Straube, T., Mentzel, H. J., & Miltner, W. H. R. (2007). Waiting for spiders: Brain activa-tion during anticipatory anxiety in spider phobics. Neuroimage, 37, 1427–1436.
Straube, T., Mentzel, H. J., & Miltner, W. H. R. (2006). Neural mechanisms of auto-matic and direct processing of phobogenic stimuli in specific phobia. BiologicalPsychiatry, 59(2), 162–170.
Teachman, B. A., & Gordon, T. (2009). Age differences in anxious responding: Olderand calmer, unless the trigger is physical. Psychology and Aging, 24(3), 703–714.
van Duinen, M. A., Schruers, K. R. J., & Griez, E. J. L. (2010). Desynchrony of fear inphobic exposure. Journal of Psychopharmacology, 24(5), 695–699.
Wicker, B., Keyeere, C., Plially, J., Gallese, V., & Rizzolatti, G. (2003). Both of us dis-gusted in my insula: The common neural basis of seeing and feeling disgust.Neuron, 40, 655–664.
Williams, L. M., Das, P., Liddell, B., Olivieri, G., Peduto, A., Brammer, M. J., et al. (2005).
nd cognition: Neural, physiological and self-report correlates of016/j.biopsycho.2013.12.011
BOLD, sweat and fears: fMRI and skin conductance distinguish facial fear signals.Neuroreport, 16, 49–52.
Wright, P., Albarracin, D., Brown, R. D., Li, H., He, G., & Liu, Y. (2008). Dissociatedresponses in the amygdala and orbitofrontal cortex to bottom-up and top-downcomponents of emotional evaluation. Neuroimage, 39, 894–902.