G e r h a r d Z e il e r & E l m a r H e g g e n€¦ · Key financials (in EUR million) W9...
21
I nt er i m r es ul t s 2 008 2 6 A u g u s t 2 0 0 8 G e r h a r d Z e il e r & E l m a r H e g g e n
Transcript of G e r h a r d Z e il e r & E l m a r H e g g e n€¦ · Key financials (in EUR million) W9...

Interim
results 200826 August 2008
Gerhard Zeiler &
Elmar Heggen

Agenda
● Introduction
○ Business Review
○ Financial Review
○ Outlook
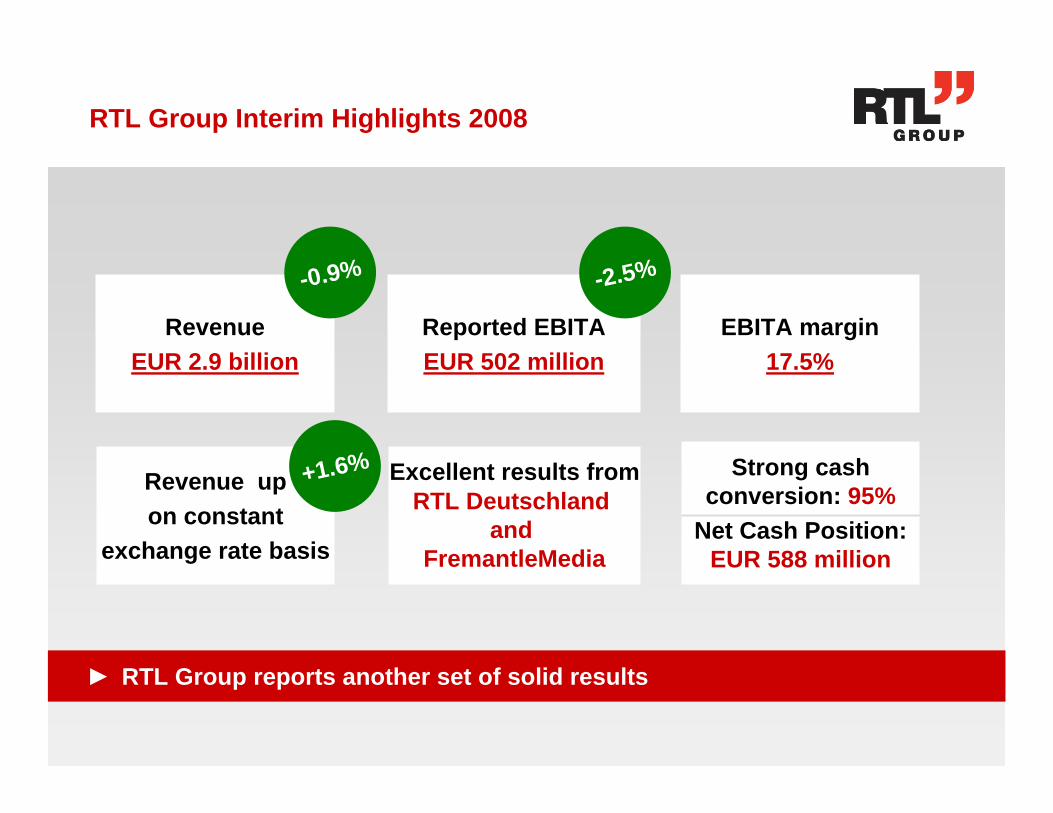
RTL Group Interim Highlights 2008
RevenueEUR 2.9 billion
-0.9%
Reported EBITAEUR 502 million
-2.5%
EBITA margin17.5%
Revenue upon constant
exchange rate basis
Excellent results fromRTL Deutschland
and FremantleMedia
Strong cashconversion: 95%
Net Cash Position:EUR 588 million
► RTL Group reports another set of solid results
+1.6%

Agenda
○ Introduction
● Business Review
○ Financial Review
○ Outlook
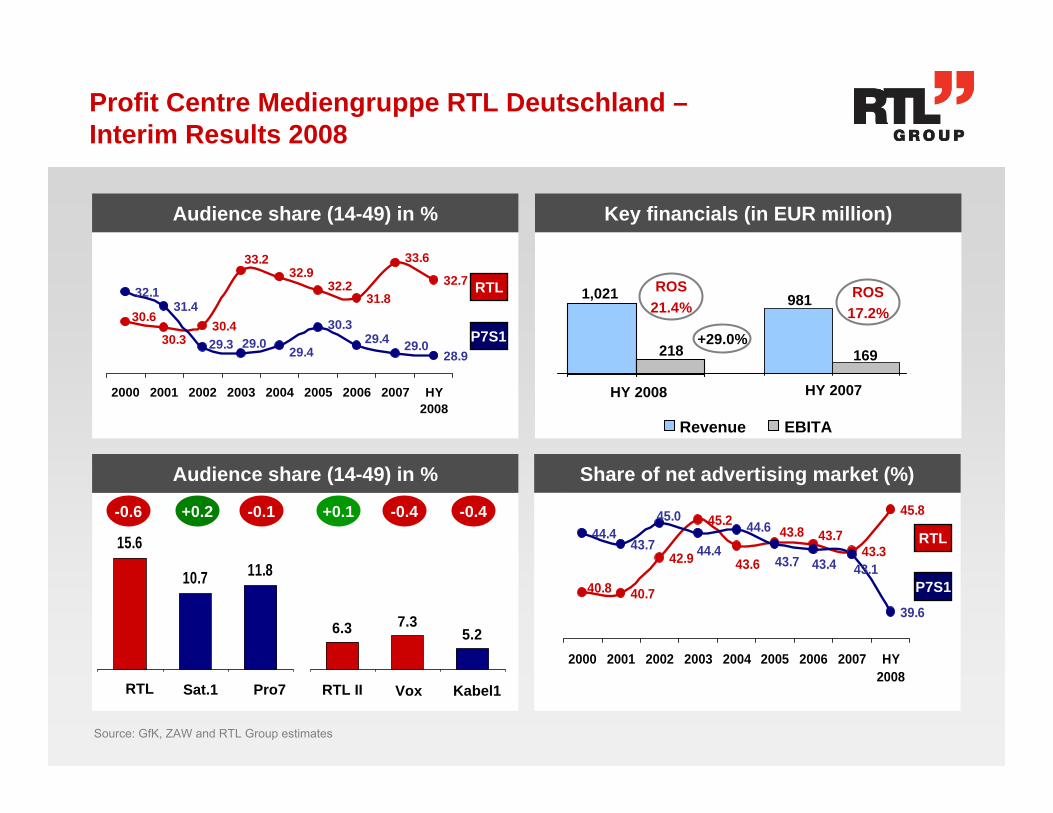
Key financials (in EUR million)
Audience share (14-49) in %
Source: GfK, ZAW and RTL Group estimates
+29.0%
Profit Centre Mediengruppe RTL Deutschland –Interim Results 2008
15.6
10.7 11.8
30.4
31.832.7
32.131.4
28.9
30.6
30.3
33.6
32.232.9
33.2
29.330.3
29.429.0 29.4 29.0
2000 2001 2002 2003 2004 2005 2006 2007 HY2008
6.3 7.35.2
HY 2008 HY 2007
Audience share (14-49) in %
ROS21.4%
ROS17.2%
RTL
P7S1
RTL Pro7Sat.1 VoxRTL II Kabel1
40.7
42.9
45.2
43.3
45.8
44.443.7
39.6
40.8
43.743.8
43.6
44.645.0
43.143.443.744.4
2000 2001 2002 2003 2004 2005 2006 2007 HY2008
RTL
P7S1
1,021 981
218 169
Share of net advertising market (%)
Revenue EBITA
-0.4+0.1-0.6 +0.2 -0.1 -0.4
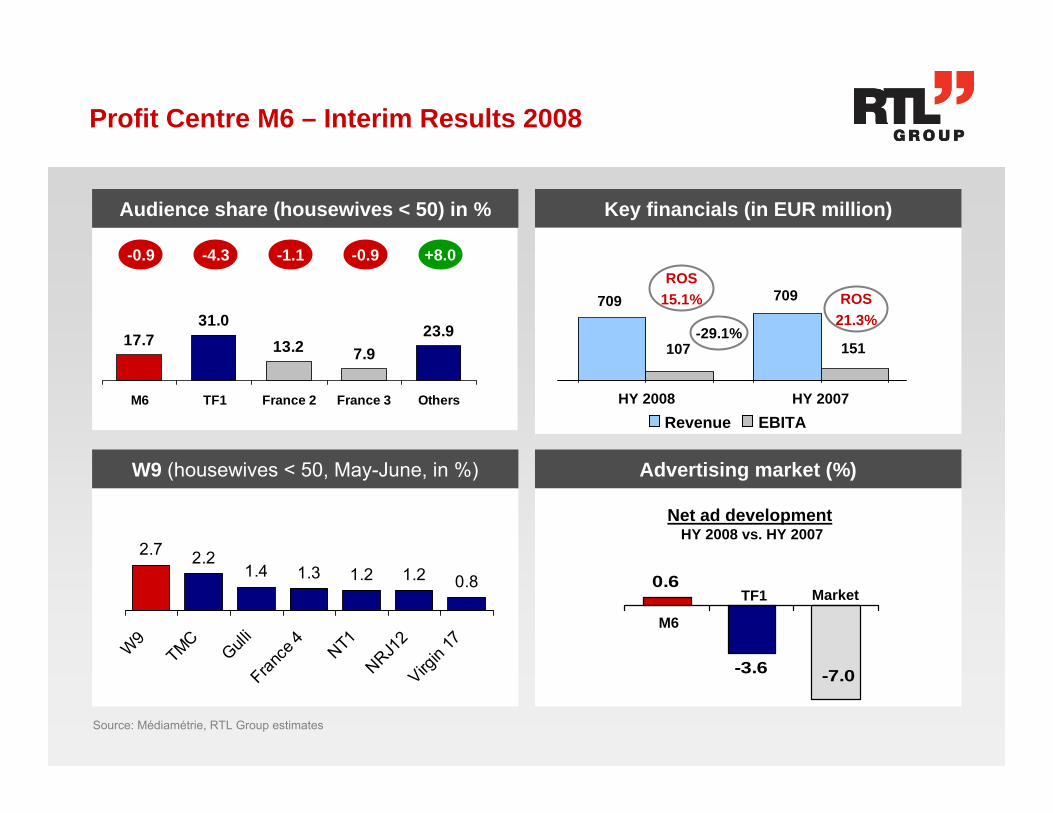
Key financials (in EUR million)
W9 (housewives < 50, May-June, in %)
Source: Médiamétrie, RTL Group estimates
Profit Centre M6 – Interim Results 2008
17.731.0
13.2 7.923.9
M6 TF1 France 2 France 3 Others
Audience share (housewives < 50) in %
Net ad developmentHY 2008 vs. HY 2007
0.6
-3.6 -7.0
HY 2008 HY 2007
-29.1%
Advertising market (%)
ROS21.3%
ROS15.1%
Revenue EBITA
709 709
107 151
-4.3-0.9 -1.1 -0.9 +8.0
2.7 2.21.4 1.3 1.2 1.2 0.8
W9
TMC
Gulli
France
4
NT1NRJ1
2Virg
in 17
M6
TF1 Market

Profit Centre FremantleMedia – Interim Results 2008
Key facts 2008 Key financials (in EUR million)
603567
HY 2008 HY 2007
9197
Currency effects (strong EUR) have negative impact on revenue and EBITA of EUR 43 million and EUR 7 million respectively
Operational performs remains strong in three main markets of USA, UK and Germany
Existing formats such as Idols and Got Talent continue to perform well. The game show “Hole in the Wall” has become FremantleMedia’s fastest ever international roll-out having been sold to 22 countries already
+6.6%
ROS17.1% ROS
15.1%
Revenue EBITA
610
At constant FX
104
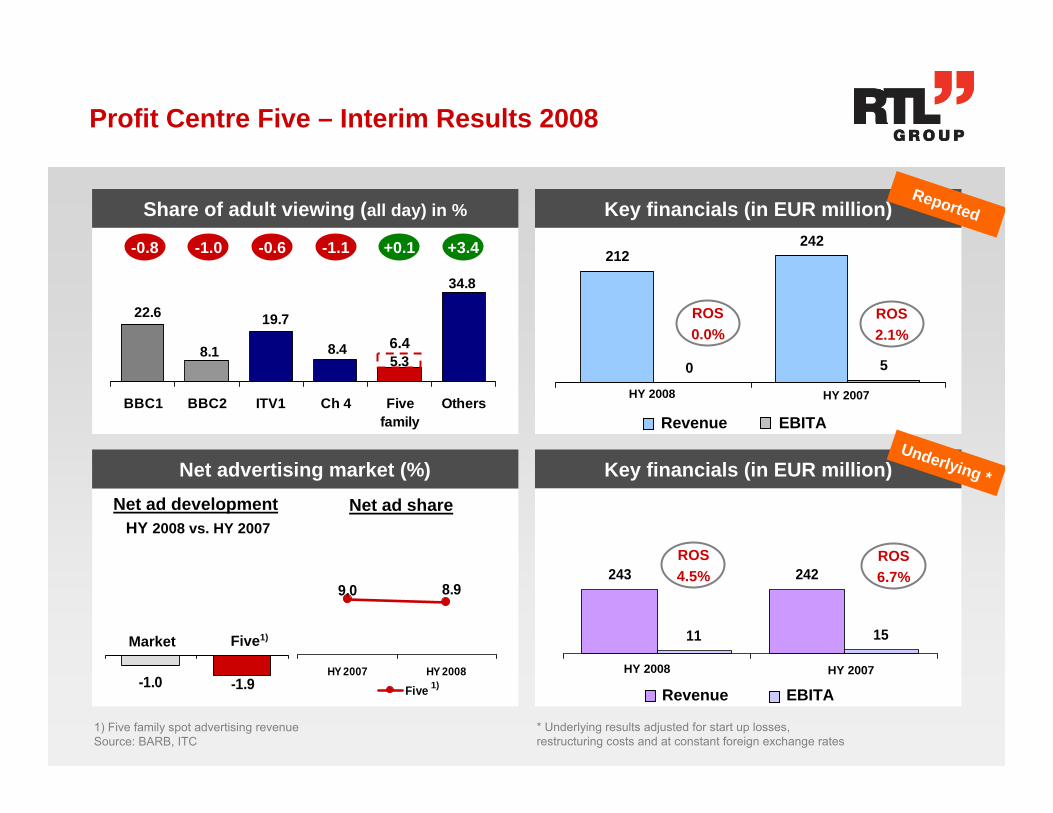
-1.9-1.0
Net advertising market (%)
9.0 8.9
HY 2007 HY 2008
Five
1) Five family spot advertising revenue Source: BARB, ITC
Profit Centre Five – Interim Results 2008
Net ad shareNet ad developmentHY 2008 vs. HY 2007
1)
Share of adult viewing (all day) in %
Market
19.7
8.45.38.1
22.6
34.8
BBC1 BBC2 ITV1 Ch 4 Fivefamily
Others
-0.8 -0.6 +0.1 +3.4-1.1-1.0 212242
0 5
Key financials (in EUR million)
Key financials (in EUR million)
Revenue EBITA
HY 2007HY 2008
243 242
11 15
ROS2.1%
ROS6.7%
ROS4.5%
Underlying *
HY 2007HY 2008
Revenue EBITA
Reported
ROS0.0%
Five
6.4
1)
* Underlying results adjusted for start up losses, restructuring costs and at constant foreign exchange rates

Key financials (in EUR million)
Share of net advertising market (%)1)
1) Source : RTL Group estimates
Profit Centre Netherlands – Interim Results 2008
10.311.812.917.3
Radio 538 Radio 3FM Q-Music Sky Radio
212
34
HY 2008
189
33
HY 2007
+3.0%
Radio 538 – audience share (20-49) and financials
Audience share (shp 20-49, primetime) in%
ROS17.5%
ROS16.0%
Revenue EBITA
30.825.7
30.5
RTL SBS Ned 1-3
Families of channels:
+1.1 +6.20.0
29.4
5.05.8
19.939.9
STERHY 2007 HY 2008
RTLSBS
Talpa
Market+4.1%
Others
5.138.6
29.5
26.8
+0.5 +0.1 +2.6 -0.8
31
13
HY 2008
Revenue EBITA
ROS41.9%

108
18
107
33
Key financials (in EUR million)
Net ad development (%)
Source: Audimetrie1) CIM MDB South, TVi estimates
Profit Centre Belgium – Interim Results 2008
HY 2008 HY 2007
Audience share (shp 18-54, primetime) in %1)
Key facts 2008
ROS30.8%
ROS16.7%
Revenue EBITA
Increased audience share despite impact of Euro 2008 championship
EBITA down year on year mainly because of EUR 10 million profit on disposal recorded in 2007
35.4
18.6
4.8
28.3
RTL Belgium Pubcaster AB Group FrenchChannels
+0.1 0.0+1.6 -0.1
-0.4 -0.5
2.4
Market RTL TVi RTBF
HY 2008 vs. HY 2007
23
Underlying EBITA
-45.5%

94
17
95
15
Profit Centre Radio France – Interim Results 2008
Key facts 2008
HY 2008 HY 2007
Key financials (in EUR million)
x Deviation vs. Apr – June 2007
ROS15.8%
ROS18.1%
RTL family maintains and increases audience market leadership – best result since 2001
Advertising market share improved to 29.0 per cent, out-performing in a market estimated to be down 4%
Reported EBITA up 13% at EUR 17 million Revenue EBITA
0.0 -0.2 +0.3 0.0 +0.1 -0.7 +0.2 -0.5 -0.2 -0.6 +0.5 +0.5 -0.4 +0.5 -0.1 -0.2 +0.1
+0.1p -0.4p -1.3 +0.6p20.5 16.1 13.4 17.8
Audience share April – June 2008 (13+, 5-24h, Mon - Fri) in %
3.24.0
13.3
2.65.26.6
1.7 3.0
7.4
3.0 3.55.68.7
10.1
0.94.25.4
RTL Fun Radio
RTL2 NRJ NostalgieChérieFM
Rire &Chansons
Eur. 1 Virgin RFM FranceInter
FranceBleu
FranceInfo
RMC Info
Skyrock MFM Indep.
RTL Group stations NRJ Group Lagardère Pubcaster Other
Market
Leadership!!
+13.3%
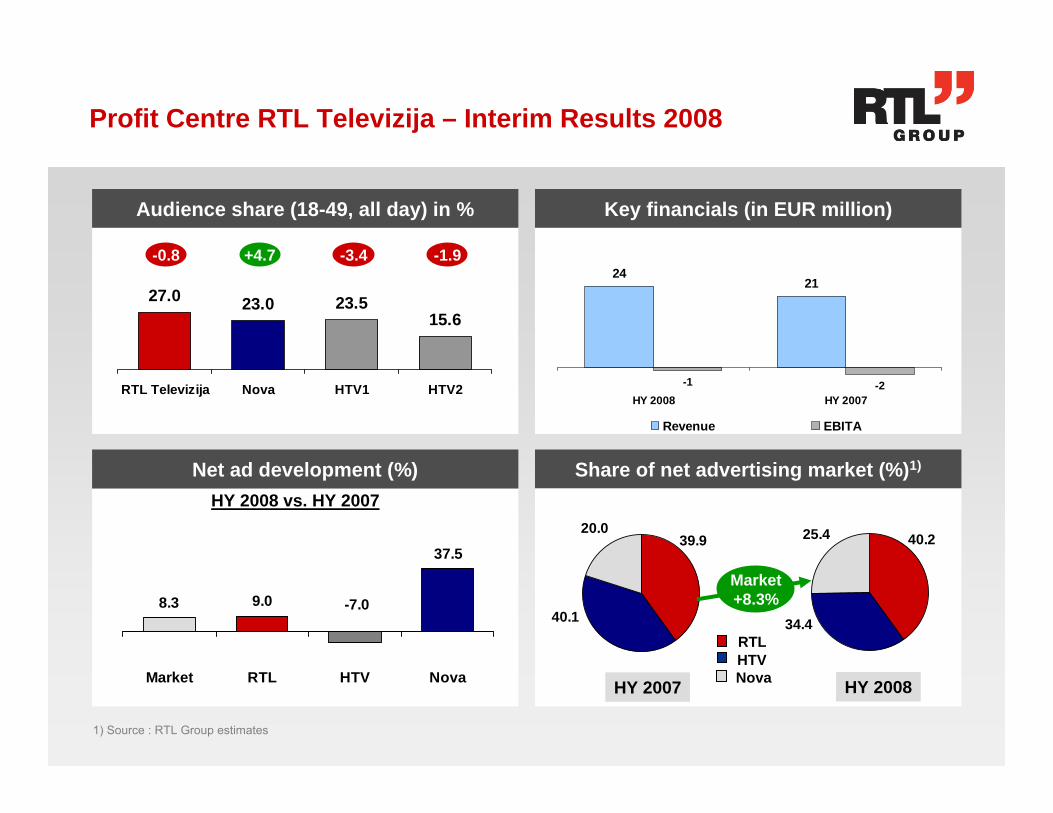
Profit Centre RTL Televizija – Interim Results 2008
8.3 9.0
37.5
-7.0
Market RTL HTV Nova
2421
-1 -2HY 2008 HY 2007
Revenue EBITA
27.0 23.0 23.515.6
RTL Televizija Nova HTV1 HTV2
Net ad development (%)
Key financials (in EUR million)
Share of net advertising market (%)1)
Audience share (18-49, all day) in %
HY 2008 vs. HY 2007
-0.8 -3.4+4.7 -1.9
40.2
34.4
25.439.9
40.1
20.0
HY 2007 HY 2008
Market+8.3%
HTVNova
RTL
1) Source : RTL Group estimates

Net ad development (%)
Profit Centre Antena 3 – Interim Results 2008
16.1 19.19.3 5.1
16.6
Antena 3 Telecinco TVE1 Cuatro La Sexta
Source: Internal estimates
HY 2008 vs. HY 2007
HY 2008 HY 2007
-19.6%
Key financials (in EUR million)
Key financials (in EUR million)Audience share (individuals) in %
ROS31.0%
ROS34.1%
Revenue EBITDA
100% view
148
477
-1.8 -0.8-1.3
-13.8
-2.5
-10.5
-4.1
Market Antena 3 T5 TVE
Group contribution
2316
HY 2008 HY 2007
-30.4%
+1.5 +1.7539
184
Audience share (18-54, all day) in %
Key financials (in HUF million)
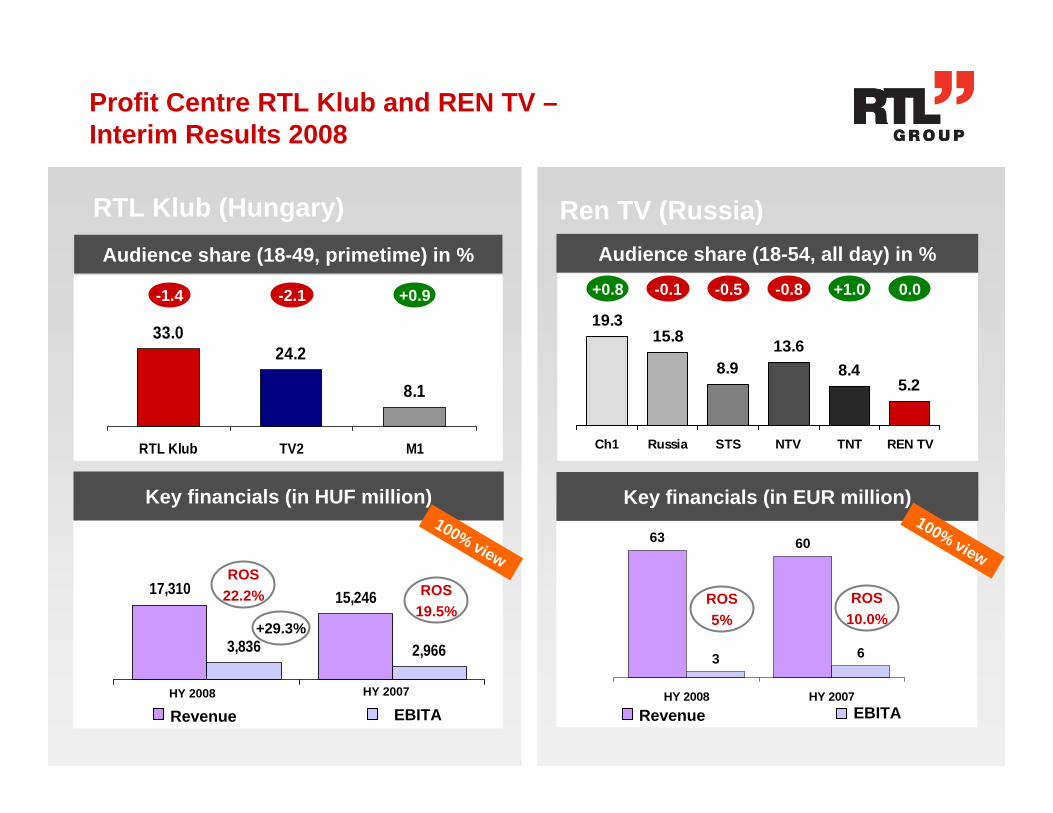
Profit Centre RTL Klub and REN TV –Interim Results 2008
19.315.8
8.913.6
8.45.2
Ch1 Russia STS NTV TNT REN TV
Key financials (in EUR million)
Audience share (18-49, primetime) in %
100% view
33.024.2
8.1
RTL Klub TV2 M1
-1.4 +0.9-2.1
17,310 15,246
3,836 2,966
ROS19.5%
ROS22.2%
HY 2007HY 2008
Revenue EBITA
+29.3%
RTL Klub (Hungary)
100% view
Ren TV (Russia)
63 60
3 6
HY 2008 HY 2007
+0.8 -0.1 -0.5 -0.8 +1.0 0.0
Revenue EBITA
ROS5%
ROS10.0%

Agenda
○ Introduction
○ Business Review
● Financial Review
○ Outlook

Review of results 30 June 2008 (1/2)
-18.118.1Adjusted EBITA margin (%)
-0.3pp17.817.5Reported EBITA margin (%)
-1.3523516Adjusted EBITA
(14)(11)Start-up losses
6(3)Restructuring charges and similar
-2.5515502Reported EBITA
-0.9
Per cent change
2,891
Half Year to June 2007
Revenue
In EUR million
Half Year to June 2008
2,864

Review of results 30 June 2008 (2/2)
In EUR million
Attributable to:
+9.2358391Profit for the period
1.93
290
68
(141)
17
96
(129)
515
Half Year to June 2007
(124)Income tax expense
+13.0
+16.6
-2.5
Per cent change
53Minority Interest
2.18Adjusted EPS
338Profit for the year attributable toRTL Group shareholders
7Gain/Loss from sale of subsidiaries, joint ventures and other investments
25Net financial income
Half Year to June 2008
502Reported EBITA
(19)Impairment of goodwill and amortisation of fair values

Cash flow statement as of 30 June 2008
(13)(22)Acquisition of subsidiaries and JVs, net of cash acquired
1-Disposal of subsidiaries and JVs, net of cash
247(35)Other financial assets (deposit excluded), net
1024Net interest received
(118)(57)Income tax paid
(528)(842)Dividends paid
92(454)Cash generated
515502Reported EBITA
96%95%EBITA conversion (FCF/EBITA)
493478Equals: Reported free cash flow (FCF)
(57)(68)Less: Acquisition of assets, net
11857Add: Income tax paid
432489Net cash flow from operating activities
Half Year to June 2007
Half Year to June 2008
In EUR million

Agenda
○ Highlights
○ Business Review
○ Financial Review
○ Outlook

Outlook
► Visibility on Advertising Markets still low
► Cautious outlook given wider economic developments
► Confident to achieve profit targets for the full year
Interim
results 200826 August 2008
Gerhard Zeiler &
Elmar Heggen