G. Comer Foundation Still the Biggest Control Knob Carbon Dioxide in Earth’s Climate History...
42
G. Comer Foundatio n Still the Biggest Control Knob Carbon Dioxide in Earth’s Climate History Richard B. Alley, Penn State CLEAN Workshop Climate Complexities May 8, 2012 Please note: I work for Penn State University, And help UN IPCC, NRC, etc., But I am not representing them, Just me.
-
Upload
shawn-melton -
Category
Documents
-
view
218 -
download
2
Transcript of G. Comer Foundation Still the Biggest Control Knob Carbon Dioxide in Earth’s Climate History...

G. Comer Foundation
Still the Biggest Control KnobCarbon Dioxide in Earth’s Climate History
Richard B. Alley, Penn StateCLEAN Workshop Climate Complexities May 8, 2012Please note: I work for Penn State University, And help UN IPCC, NRC, etc., But I am not representing them, Just me.
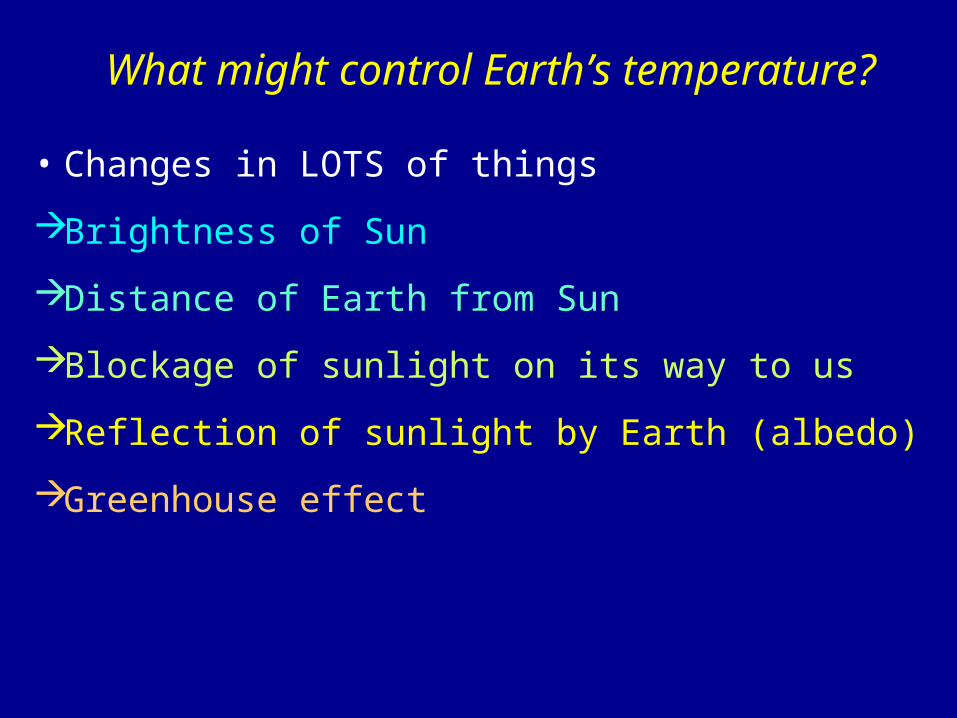
What might control Earth’s temperature?
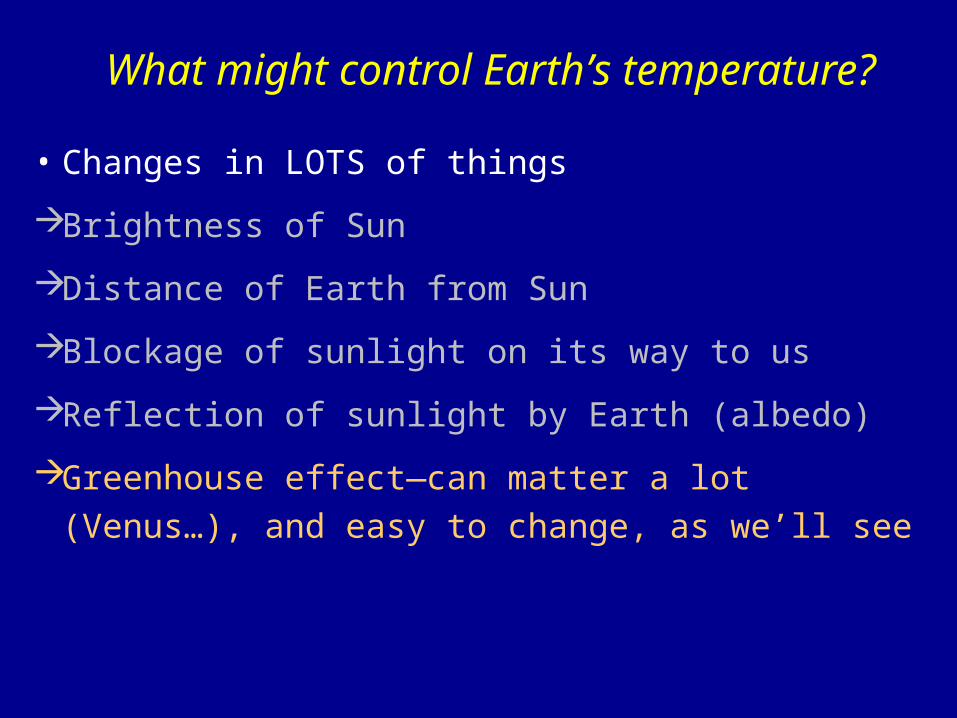
• Changes in LOTS of things
Brightness of Sun
Distance of Earth from Sun
Blockage of sunlight on its way to us
Reflection of sunlight by Earth (albedo)
Greenhouse effect
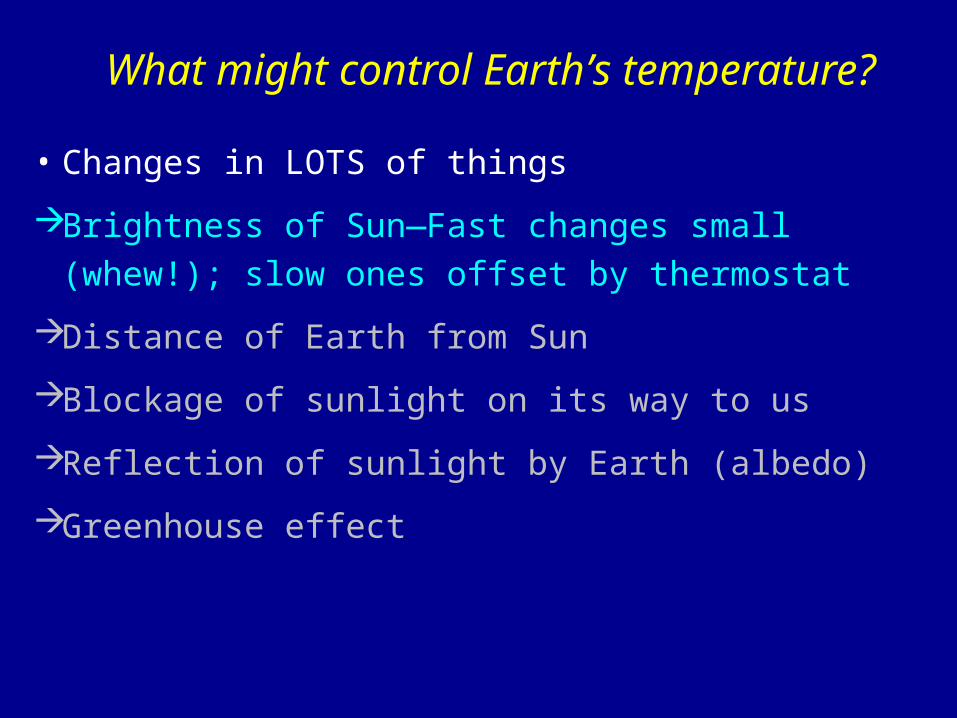
What might control Earth’s temperature?
• Changes in LOTS of things
Brightness of Sun—Fast changes small (whew!); slow ones offset by thermostat
Distance of Earth from Sun
Blockage of sunlight on its way to us
Reflection of sunlight by Earth (albedo)
Greenhouse effect

What might control Earth’s temperature?
• Changes in LOTS of things
Brightness of Sun
Distance of Earth from Sun—No worry!—dino-killer moved Earth less than 1”
Blockage of sunlight on its way to us
Reflection of sunlight by Earth (albedo)
Greenhouse effect
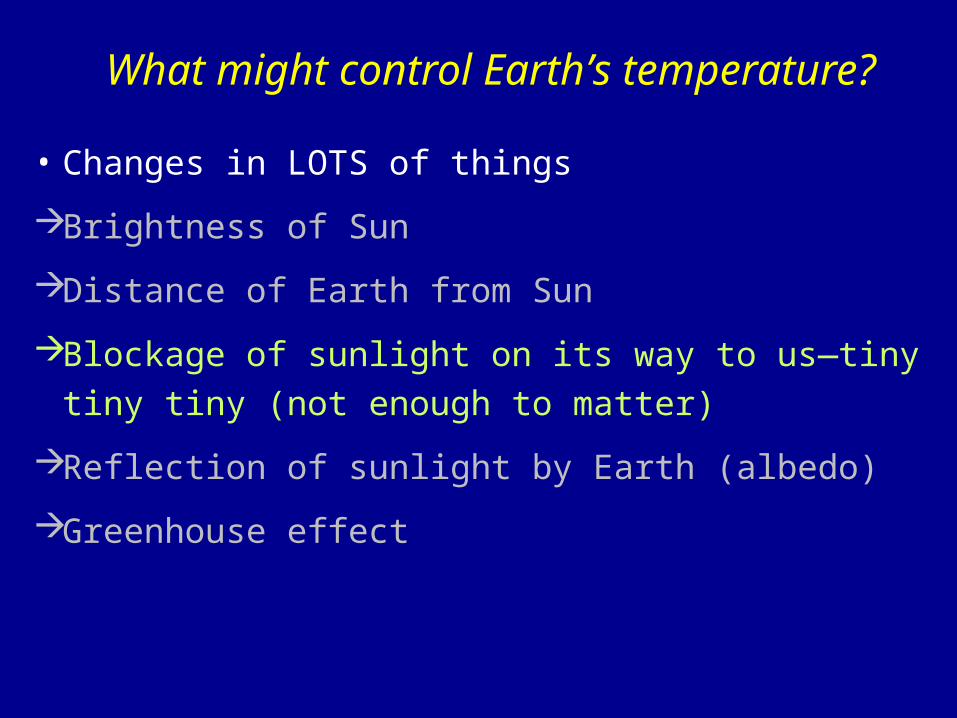
What might control Earth’s temperature?
• Changes in LOTS of things
Brightness of Sun
Distance of Earth from Sun
Blockage of sunlight on its way to us—tiny tiny tiny (not enough to matter)
Reflection of sunlight by Earth (albedo)
Greenhouse effect

What might control Earth’s temperature?
• Changes in LOTS of things
Brightness of Sun
Distance of Earth from Sun
Blockage of sunlight on its way to us
Reflection of sunlight by Earth (albedo)—can matter; hard to change much by itself
Greenhouse effect
What might control Earth’s temperature?
• Changes in LOTS of things
Brightness of Sun
Distance of Earth from Sun
Blockage of sunlight on its way to us
Reflection of sunlight by Earth (albedo)
Greenhouse effect—can matter a lot (Venus…), and easy to change, as we’ll see

What might control Earth’s temperature?
• Changes in LOTS of things
Greenhouse effect—Water vapor hard to change except by warming air (hair dryer has a heater for a good reason…)
Models: remove air’s water vapor and evaporation
restores in a few days; remove CO2 and Earth
freezes over (Pierrehumbert et al, 2007; Voigt and Marotzke, 2009)

Basis for CO2-caused warming: Is PHYSICS**Known for over a century**Refined by Air Force after WWII (operations, communications, and heat-seeking missiles)**Confirmed by history**Observed today (satellites, etc.)
Earth glowing to cool off
CO2 blocking, warms
“Color” in infrared (wavenumber cm-1)
Harries et al., 2001, Nature

Climate history confirms warming by CO2
• Temperature and CO2 correlate over time, for short-lived and long-lived events
• CO2 warms based on known physics
• Nothing else explains most main features of climate history (does not track brightness of sun, cosmic rays, or other things closely)
• Warming tends to raise CO2 over short times but lower CO2 over long times; history thus shows that CO2 controls temperature and not vice-versa.
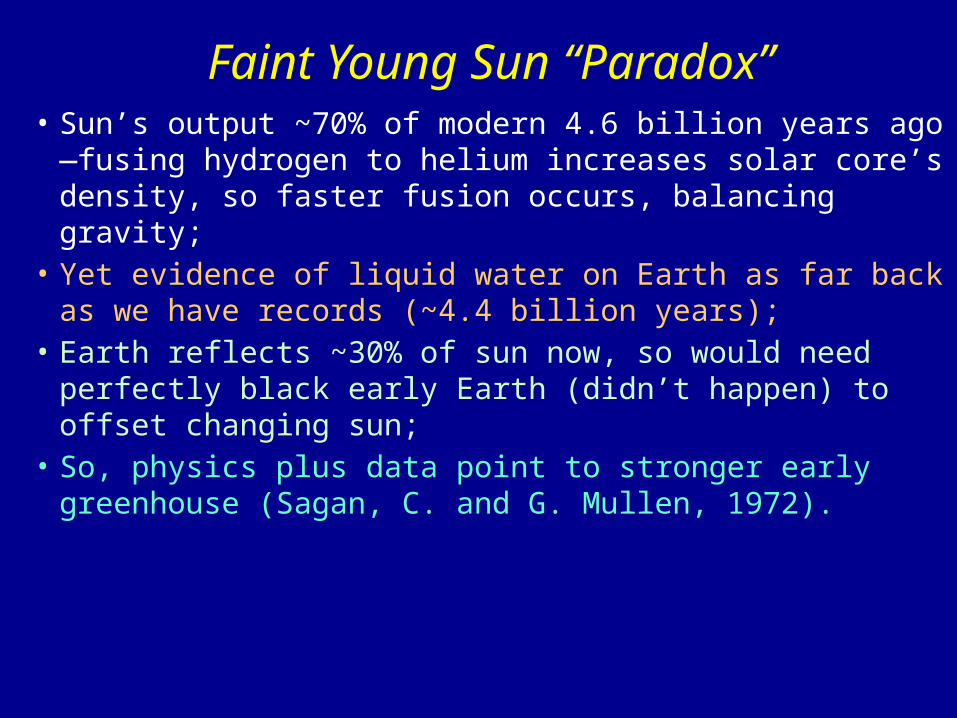
Faint Young Sun “Paradox”• Sun’s output ~70% of modern 4.6 billion years ago
—fusing hydrogen to helium increases solar core’s density, so faster fusion occurs, balancing gravity;
• Yet evidence of liquid water on Earth as far back as we have records (~4.4 billion years);
• Earth reflects ~30% of sun now, so would need perfectly black early Earth (didn’t happen) to offset changing sun;
• So, physics plus data point to stronger early greenhouse (Sagan, C. and G. Mullen, 1972).
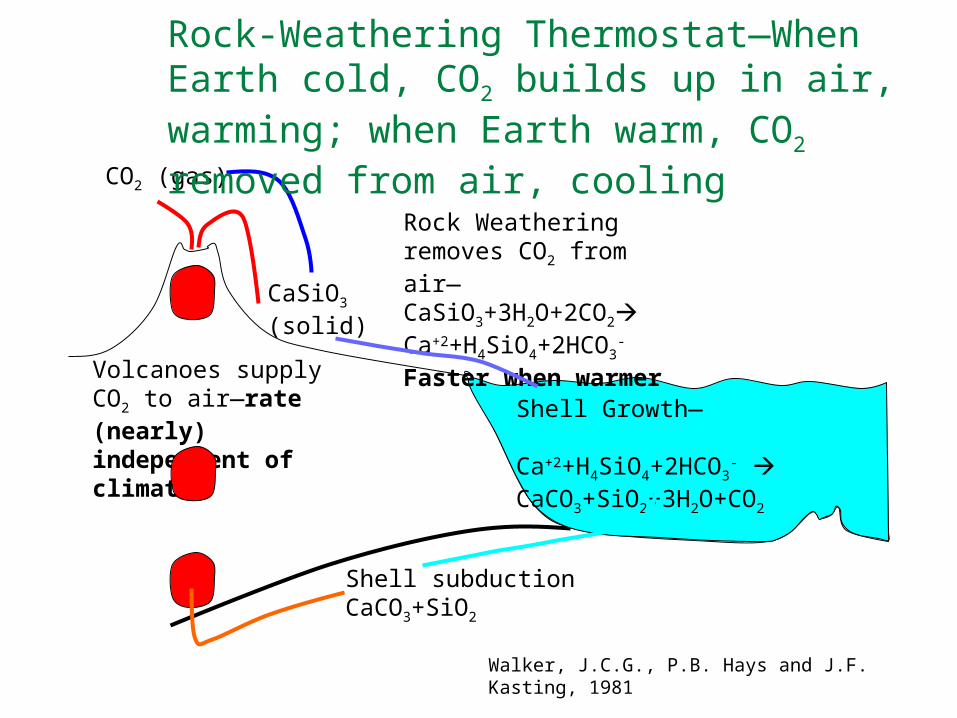
CO2 (gas)
CaSiO3 (solid)
Volcanoes supply CO2 to air—rate (nearly) independent of climate
Rock Weathering removes CO2 from air—CaSiO3+3H2O+2CO2 Ca+2+H4SiO4+2HCO3
- Faster when warmer
Shell Growth— Ca+2+H4SiO4+2HCO3
- CaCO3+SiO2+3H2O+CO2
Shell subduction CaCO3+SiO2
Walker, J.C.G., P.B. Hays and J.F. Kasting, 1981
Rock-Weathering Thermostat—When Earth cold, CO2 builds up in air, warming; when Earth warm, CO2 removed from air, cooling

Rock Weathering Thermostat
• Enough to solve faint young sun paradox (Halevy, I., R.T. Pierrehumbert and D.P. Schrag, 2009);
• Supported by physical/chemical understanding; • Maybe other greenhouse gases, etc. involved;
• If others failed, CO2 there to do the job;
• Is there any evidence for this other than physical/chemical unavoidability?
• Probably…Snowball Earth cap carbonates…

Snowball Earth
• Extensive low-elevation, low-latitude glacial deposits from some times on middle-aged Earth;
• Physical understanding: if CO2 warms & rock-weathering
thermostat works, thenCan get into a snowball with a faint sun if fast (thermostat
takes ~0.5 million years to work);Then high snow albedo needs lots of CO2 to thaw;Then lots of warming and rapid weathering should have
deposited carbonate rocks rapidly• And, cap carbonates sit atop snowball deposits.
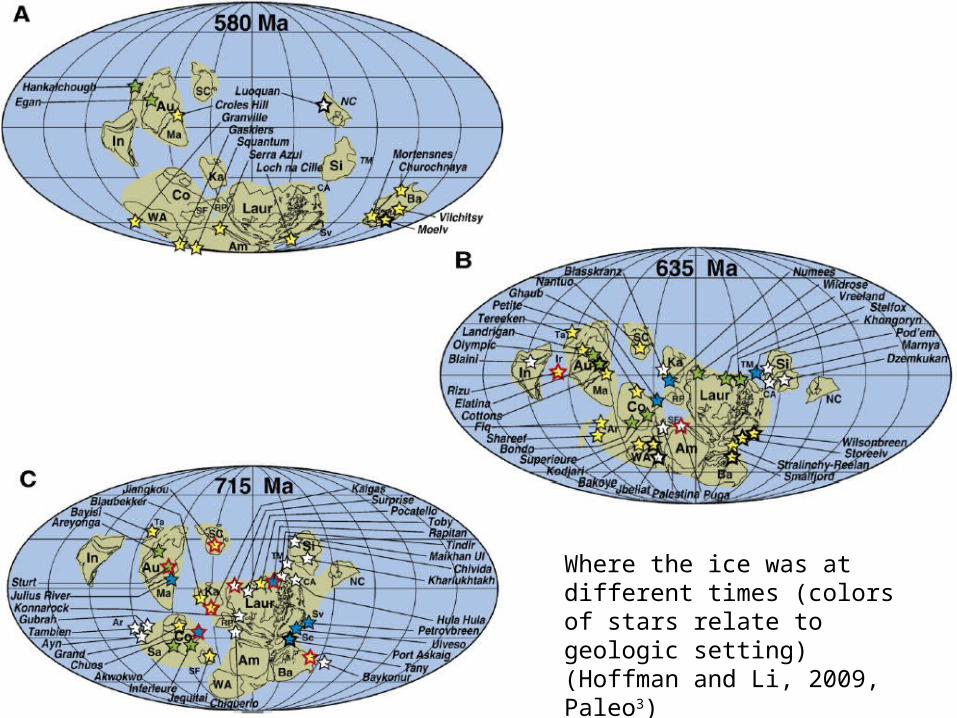
Where the ice was at different times (colors of stars relate to geologic setting) (Hoffman and Li, 2009, Paleo3)
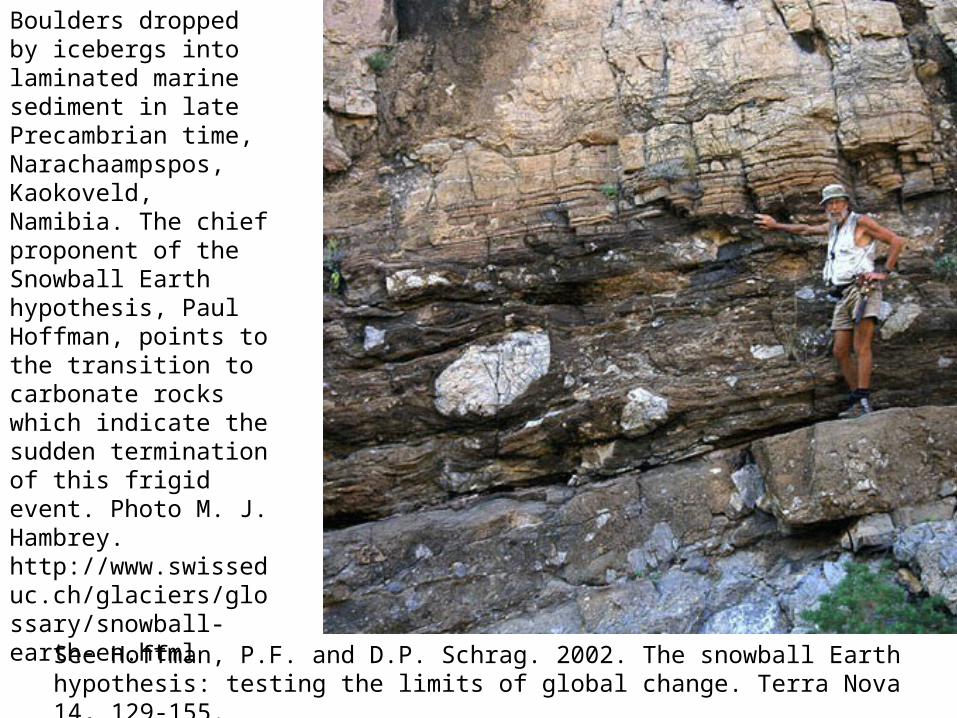
Boulders dropped by icebergs into laminated marine sediment in late Precambrian time, Narachaampspos, Kaokoveld, Namibia. The chief proponent of the Snowball Earth hypothesis, Paul Hoffman, points to the transition to carbonate rocks which indicate the sudden termination of this frigid event. Photo M. J. Hambrey. http://www.swisseduc.ch/glaciers/glossary/snowball-earth-en.html
See Hoffman, P.F. and D.P. Schrag. 2002. The snowball Earth hypothesis: testing the limits of global change. Terra Nova 14, 129-155.

CO2 Paleobarometers—How much was there?
• Gold standard is ice-core record;• So far “only” 800,000 years, duplicated to 450,000 yrs, and
multiply duplicated younger; • How do we know it works?Youngest samples agree with instrumental recordAntarctic: same record from different sites with different
temperature, accumulation, impuritiesSensible “failures”; e.g., in Greenland melt layers, expect
and find excess CO2 localized, so diffusion not smearing much. In warm tropical-glacier ice with dead bugs, anomalous high CO2 as expected.
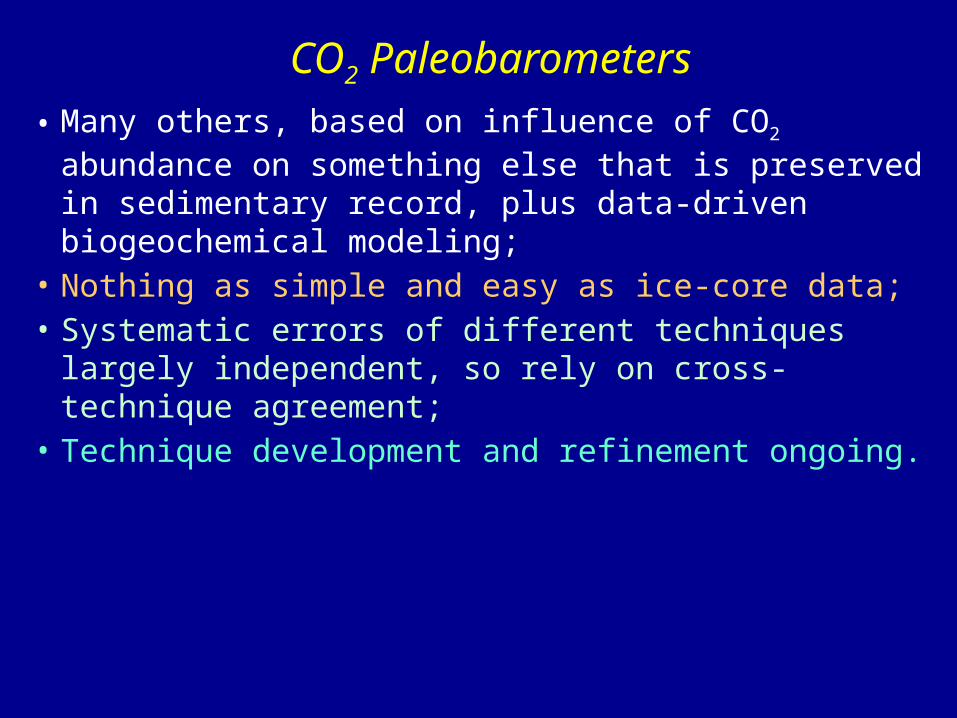
CO2 Paleobarometers
• Many others, based on influence of CO2 abundance on something else that is preserved in sedimentary record, plus data-driven biogeochemical modeling;
• Nothing as simple and easy as ice-core data; • Systematic errors of different techniques largely
independent, so rely on cross-technique agreement;
• Technique development and refinement ongoing.
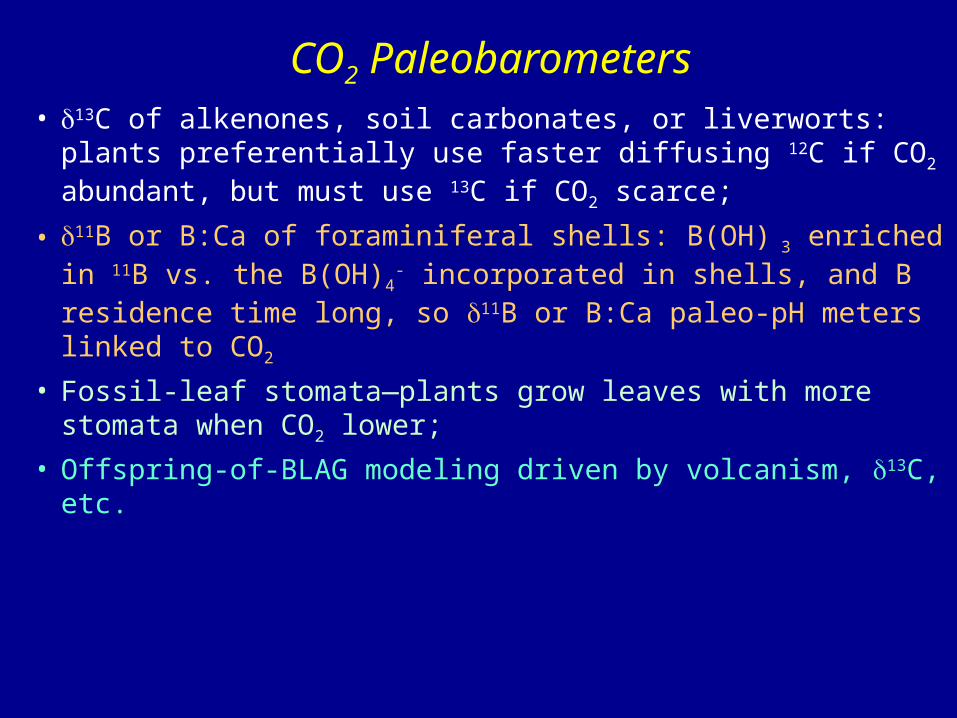
CO2 Paleobarometers• 13C of alkenones, soil carbonates, or liverworts: plants
preferentially use faster diffusing 12C if CO2 abundant, but must use 13C if CO2 scarce;
• 11B or B:Ca of foraminiferal shells: B(OH) 3 enriched in 11B vs. the B(OH)4
- incorporated in shells, and B residence time long, so 11B or B:Ca paleo-pH meters linked to CO2
• Fossil-leaf stomata—plants grow leaves with more stomata when CO2 lower;
• Offspring-of-BLAG modeling driven by volcanism, 13C, etc.

Resetting the Thermostat• More CO2 from volcanoes (e.g., more volcanism, or
shallower subduction zones so more shells subducted rather than dissolved);
• Slower weathering—colder or drier climate, or less-weatherable materials (e.g., shale at surface, vs. basalt), or less plant activity (e.g., pre-land-plants less CO2 in soil);
• Less fossil-fuel burial, or more fossil-fuel burning (e.g., higher-oxygen oceans because colder or less-fertilized);
• Change greatly over time-scales of plate tectonics and evolution—100 million years or so.
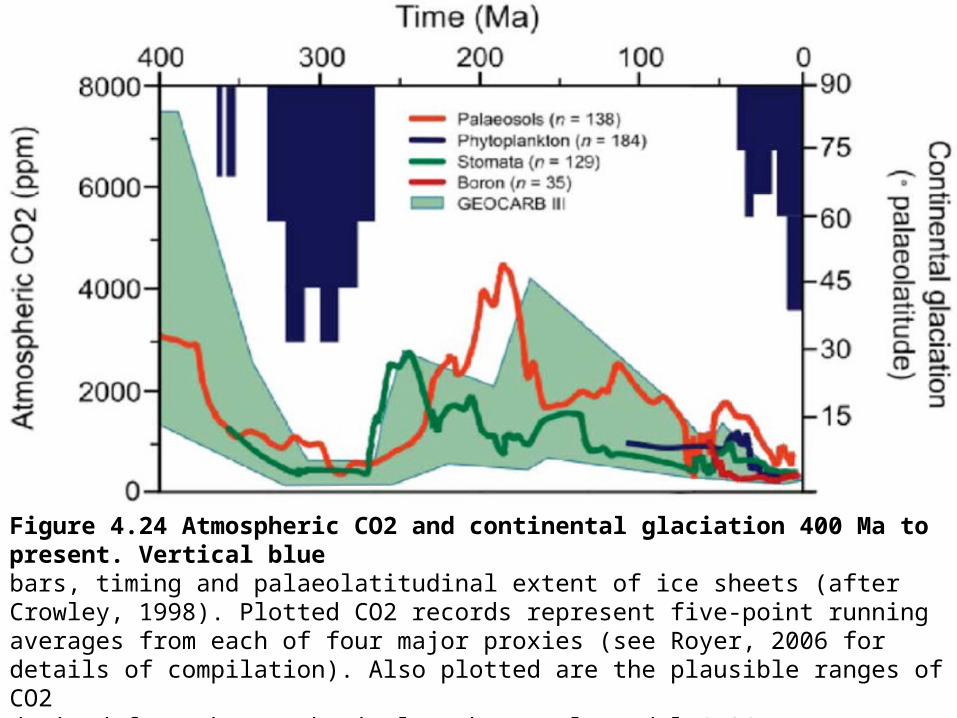
Figure 4.24 Atmospheric CO2 and continental glaciation 400 Ma to present. Vertical bluebars, timing and palaeolatitudinal extent of ice sheets (after Crowley, 1998). Plotted CO2 records represent five-point running averages from each of four major proxies (see Royer, 2006 for details of compilation). Also plotted are the plausible ranges of CO2derived from the geochemical carbon cycle model GEOCARB III (Berner and Kothavala,2001). All data adjusted to the Gradstein et al. (2004) time scale. Continental ice sheetsgrow extensively when CO2 is low. (after Jansen, 2007, that report’s Figure 6.1)

Figure 4.24 Atmospheric CO2 and continental glaciation 400 Ma to present. Vertical bluebars, timing and palaeolatitudinal extent of ice sheets (after Crowley, 1998). Plotted CO2 records represent five-point running averages from each of four major proxies (see Royer, 2006 for details of compilation). Also plotted are the plausible ranges of CO2derived from the geochemical carbon cycle model GEOCARB III (Berner and Kothavala,2001). All data adjusted to the Gradstein et al. (2004) time scale. Continental ice sheetsgrow extensively when CO2 is low. (after Jansen, 2007, that report’s Figure 6.1)
Next slide

Events—The Great Dying • End-Permian extinction, 251 million years, perhaps
95% of species became extinct;• Widespread marine biomarkers of green sulfur
bacteria that use H2S for photosynthesis (100 ppm in air is immediate danger to life or health);
• Greatest volcanism in >500 million years (Siberian traps) (slow vs. human source, but protracted);
• CO2-induced warmth, fertilization from basalt breakdown, sulfur from volcanoes seem to have contributed to anoxia and euxinia (H2S) of ocean.
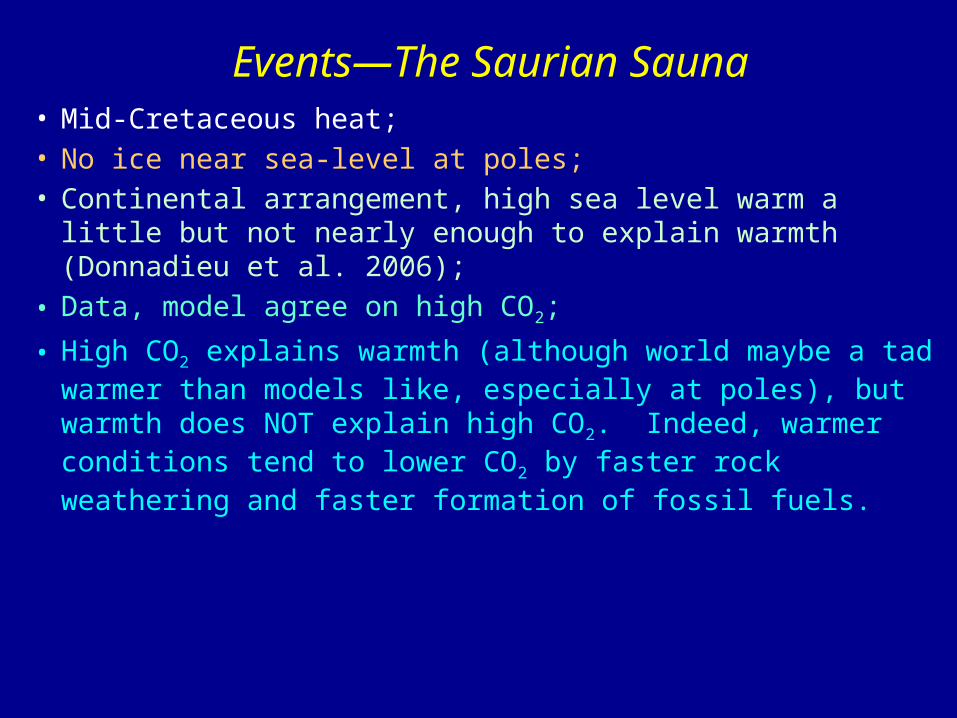
Events—The Saurian Sauna• Mid-Cretaceous heat;• No ice near sea-level at poles; • Continental arrangement, high sea level warm a little but
not nearly enough to explain warmth (Donnadieu et al. 2006);
• Data, model agree on high CO2;
• High CO2 explains warmth (although world maybe a tad warmer than models like, especially at poles), but warmth does NOT explain high CO2. Indeed, warmer conditions tend to lower CO2 by faster rock weathering and faster formation of fossil fuels.
Pre-humanNow
Now
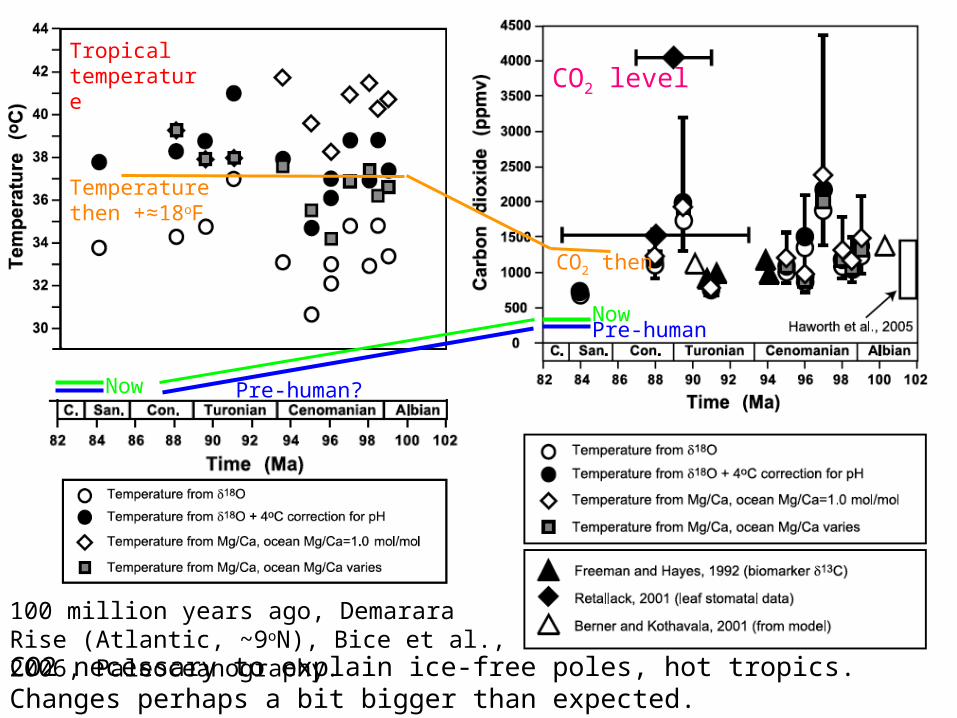
100 million years ago, Demarara Rise (Atlantic, ~9oN), Bice et al., 2006, Paleoceanography.
CO2 level
CO2 necessary to explain ice-free poles, hot tropics. Changes perhaps a bit bigger than expected.
Pre-human?
Temperature then +≈18oF
CO2 then
Tropical temperature

Scary thought
“…the wetbulb temperature...today…never exceeds 31 °C. Any exceedence of 35 °C for extended periods should induce hyperthermia in humans and other mammals, as dissipation of metabolic heat becomes impossible…this …would begin to occur with global-mean warming of about 7 °C, calling the habitability of some regions into question. With 11–12 °C warming, such regions would spread to encompass the majority of the human population as currently distributed. Eventual warmings of 12 °C are possible from fossil fuel burning.” Sherwood & Huber, PNAS, 2010
NOT a forecast, but within the realm of possibility based on refereed science: we might make it too hot for unprotected humans to live in large parts of the Earth.

Figure 4.24 Atmospheric CO2 and continental glaciation 400 Ma to present. Vertical bluebars, timing and palaeolatitudinal extent of ice sheets (after Crowley, 1998). Plotted CO2 records represent five-point running averages from each of four major proxies (see Royer, 2006 for details of compilation). Also plotted are the plausible ranges of CO2derived from the geochemical carbon cycle model GEOCARB III (Berner and Kothavala,2001). All data adjusted to the Gradstein et al. (2004) time scale. Continental ice sheetsgrow extensively when CO2 is low. (after Jansen, 2007, that report’s Figure 6.1)
Time in next slide
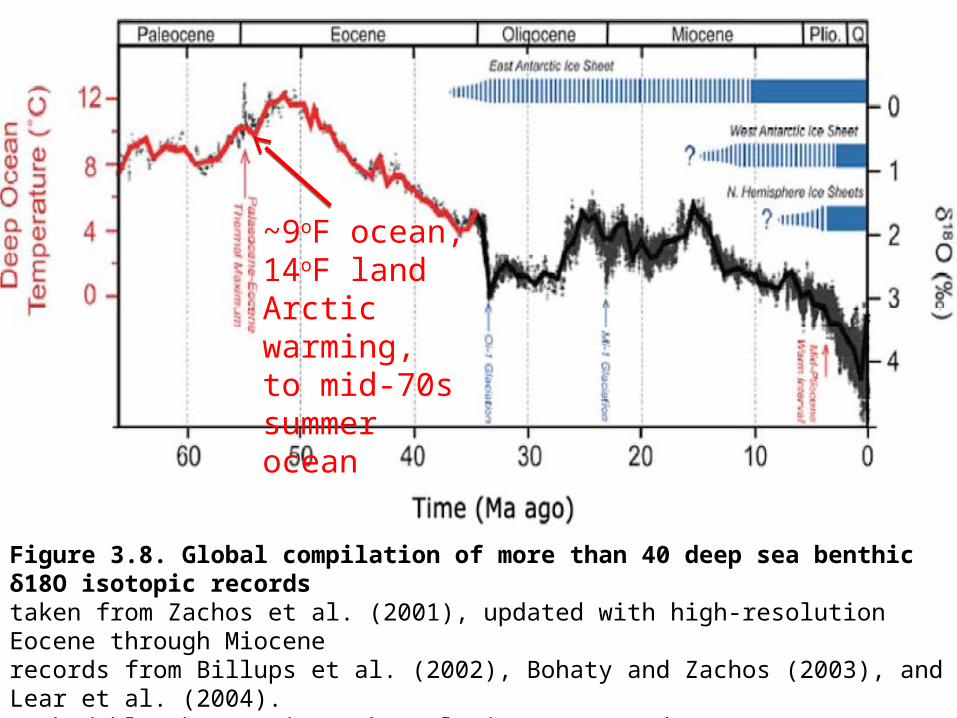
Figure 3.8. Global compilation of more than 40 deep sea benthic δ18O isotopic recordstaken from Zachos et al. (2001), updated with high-resolution Eocene through Miocenerecords from Billups et al. (2002), Bohaty and Zachos (2003), and Lear et al. (2004).Dashed blue bars, times when glaciers came and went or were smaller than now; solidblue bars, ice sheets of modern size or larger. (Figure and text modified from IPCCChapter 6, Paleoclimate, Jansen et al., 2007.)
~9oF ocean, 14oF land Arctic warming, to mid-70s summer ocean
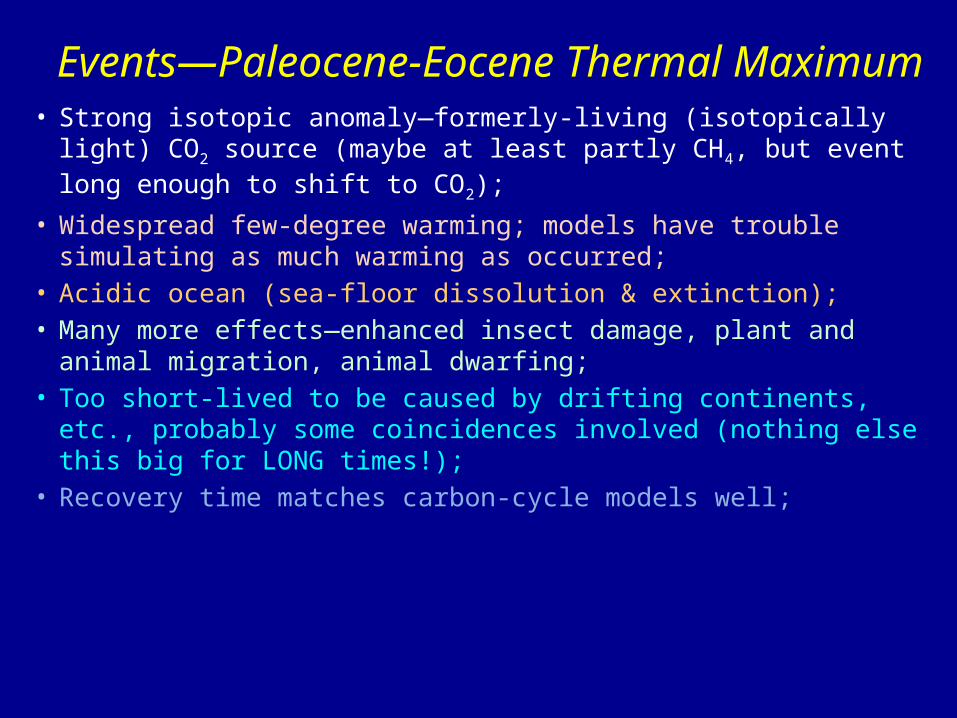
Events—Paleocene-Eocene Thermal Maximum
• Strong isotopic anomaly—formerly-living (isotopically light) CO2 source (maybe at least partly CH4, but event long enough to shift to CO2);
• Widespread few-degree warming; models have trouble simulating as much warming as occurred;
• Acidic ocean (sea-floor dissolution & extinction); • Many more effects—enhanced insect damage, plant and animal
migration, animal dwarfing;• Too short-lived to be caused by drifting continents, etc., probably
some coincidences involved (nothing else this big for LONG times!);
• Recovery time matches carbon-cycle models well;

Zachos et al., 2005, Science

Zachos et al., 2001, Science, PETM
The LPTM as recorded in benthic d13C and d18O records (A and B, respectively) from Sites 527 and 690 in the south Atlantic (73), and Site 865 in the western Pacific (26). The time scale is based on the cycle stratigraphy of Site 690 (30) with the base of the excursion placed at 54.95 Ma. The other records have been correlated to Site 690 using the carbon isotope stratigraphy. Apparent leads and lags are artifacts of differences in sample spacing. The oxygen isotope values have been adjusted for species-specific vital effects (118), and the temperature scale on the right is for an ice-free ocean. The negative carbon isotope excursion is thought to represent the influx of up to 2600 Gt of methane from dissociation of seafloor clathrate (111).
56
A
ge (
Ma)
54
WarmerMore CO2
Still much slower than human release; maybe a similar amount.
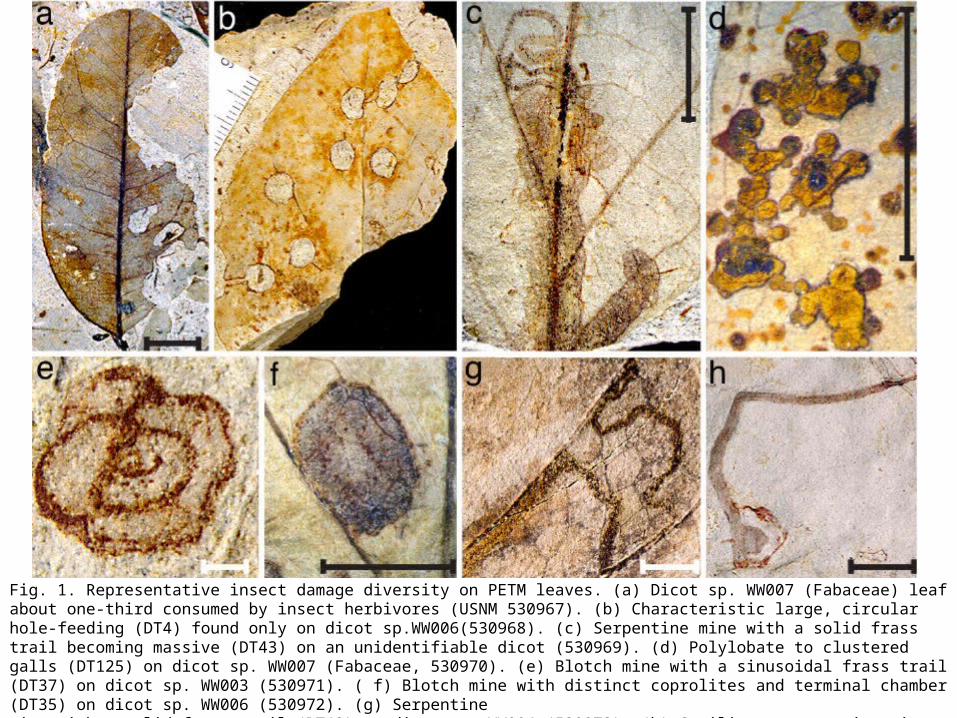
Fig. 1. Representative insect damage diversity on PETM leaves. (a) Dicot sp. WW007 (Fabaceae) leaf about one-third consumed by insect herbivores (USNM 530967). (b) Characteristic large, circular hole-feeding (DT4) found only on dicot sp.WW006(530968). (c) Serpentine mine with a solid frass trail becoming massive (DT43) on an unidentifiable dicot (530969). (d) Polylobate to clustered galls (DT125) on dicot sp. WW007 (Fabaceae, 530970). (e) Blotch mine with a sinusoidal frass trail (DT37) on dicot sp. WW003 (530971). ( f) Blotch mine with distinct coprolites and terminal chamber (DT35) on dicot sp. WW006 (530972). (g) Serpentinemine with a solid frass trail (DT43) on dicot sp. WW004 (530973). (h) Semilinear serpentine mine with terminal chamber (DT40) on dicot sp. WW005 (530974). (Scale bars: white, 1 mm; black, 5 mm.) Currano et al., 2008, PNAS (>5000 fossil leaves, Wyoming)
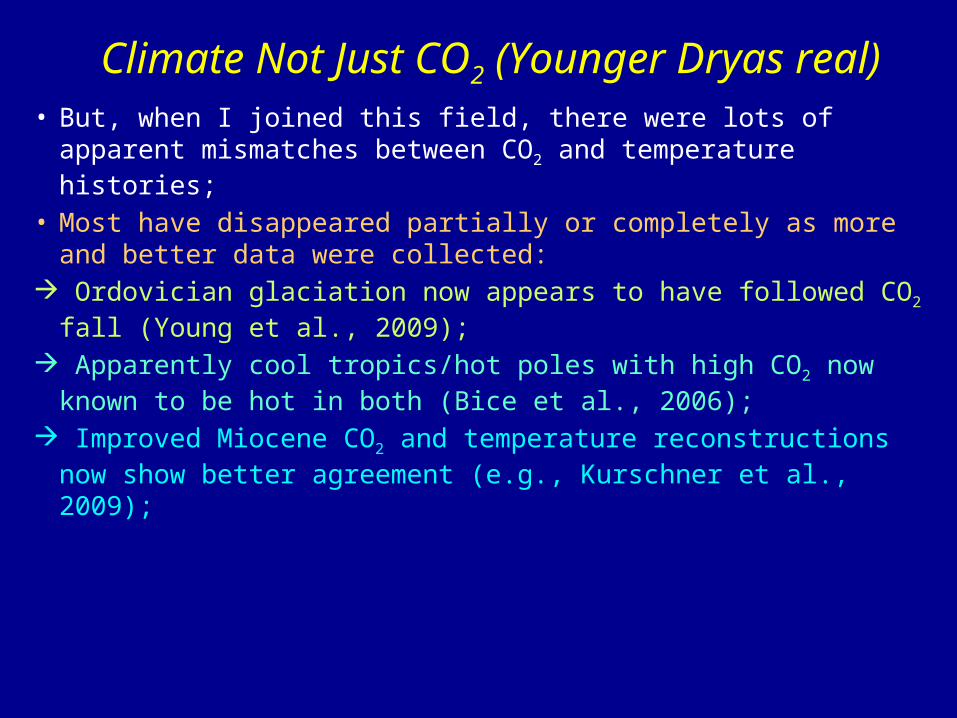
Climate Not Just CO2 (Younger Dryas real)• But, when I joined this field, there were lots of apparent
mismatches between CO2 and temperature histories;
• Most have disappeared partially or completely as more and better data were collected:
Ordovician glaciation now appears to have followed CO2 fall (Young et al., 2009);
Apparently cool tropics/hot poles with high CO2 now known to be hot in both (Bice et al., 2006);
Improved Miocene CO2 and temperature reconstructions now show better agreement (e.g., Kurschner et al., 2009);

Vostok, Petit et al.
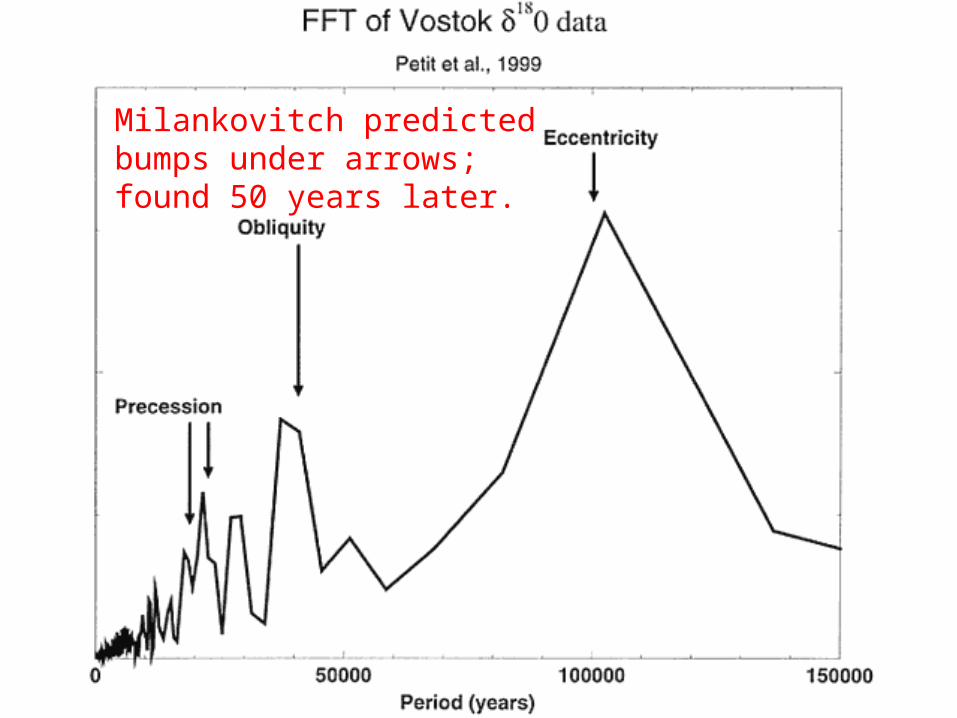
Milankovitch predicted bumps under arrows; found 50 years later.
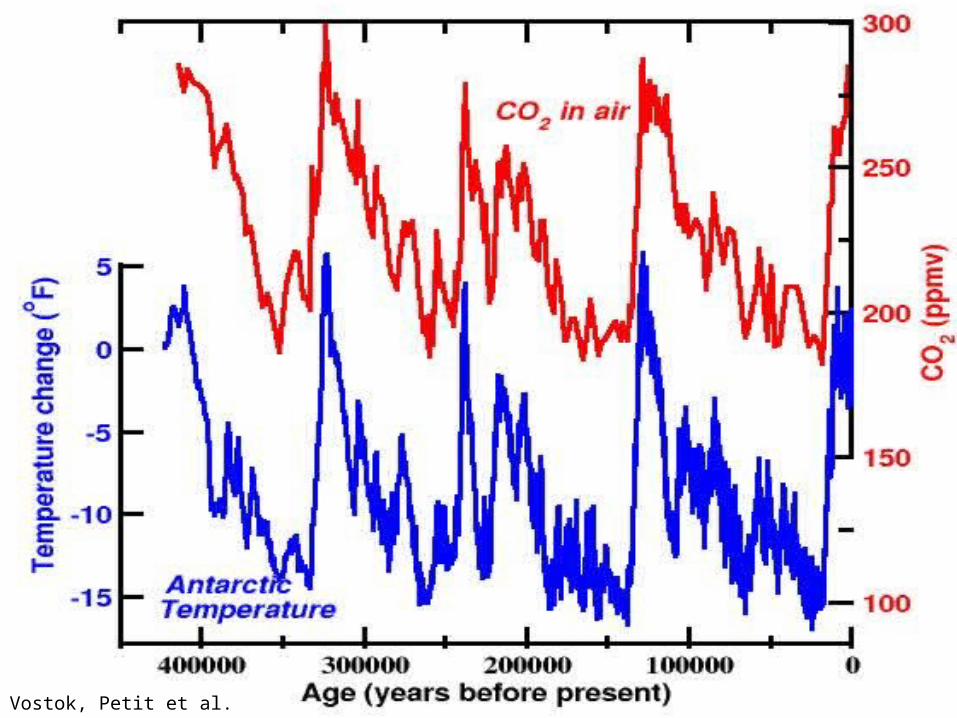
Vostok, Petit et al.

CO2 as part of ice-age cycling• Ice ages paced by orbits; whole world cooled/warmed even
though almost no change in total sun;• After big ice grew in Canada, rising polar summer sunshine
(obliquity both poles, precession north) began polar warming and ice melting;
• This changed Atlantic circulation, slowing warming in N and speeding in S;
• This shifted winds S from S. America, moving water and allowing CO2 escape from deep ocean
• Which warmed world including falling-sun tropics(e.g., Jansen+ 2007; Hansen+ 2008; Alley 2003; Cuffey & Brook 2000; Anderson+ 2009;
Broecker+ 2010; Denton+ 2010, Shakun+ 2012)
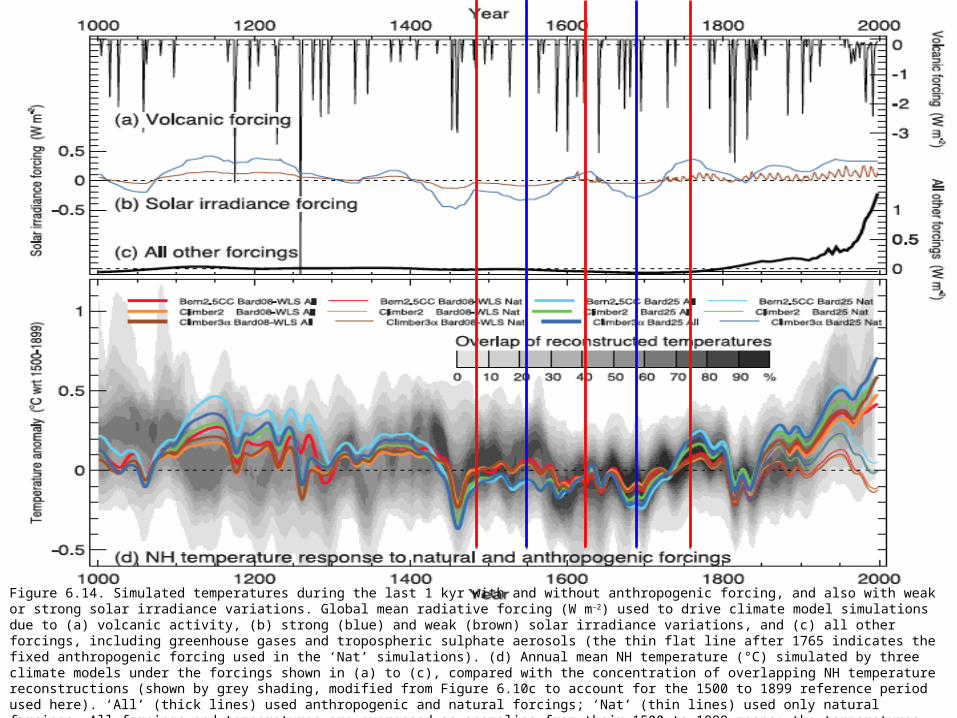
Figure 6.14. Simulated temperatures during the last 1 kyr with and without anthropogenic forcing, and also with weak or strong solar irradiance variations. Global mean radiative forcing (W m–2) used to drive climate model simulations due to (a) volcanic activity, (b) strong (blue) and weak (brown) solar irradiance variations, and (c) all other forcings, including greenhouse gases and tropospheric sulphate aerosols (the thin flat line after 1765 indicates the fixed anthropogenic forcing used in the ‘Nat’ simulations). (d) Annual mean NH temperature (°C) simulated by three climate models under the forcings shown in (a) to (c), compared with the concentration of overlapping NH temperature reconstructions (shown by grey shading, modified from Figure 6.10c to account for the 1500 to 1899 reference period used here). ‘All’ (thick lines) used anthropogenic and natural forcings; ‘Nat’ (thin lines) used only natural forcings. All forcings and temperatures are expressed as anomalies from their 1500 to 1899 means; the temperatures were then smoothed with a Gaussian-weighted filter to remove fluctuations on time scales less than 30 years. Note the different vertical scale used for the volcanic forcing compared with the other forcings. The individual series are identified in Table 6.3.

From Muschler et al., 2005, QSR. 18O (proxy for temperature) from GRIP core (top), the concentration of 10Be (middle), and the flux of 10Be (bottom). The Laschamp event of near-zero magnetic field (red arrow) allowed increased cosmic-ray flux producing more 10Be, but with no apparent effect on climate.
Climate didn’t change
When more cosmic rays reached Earth
Climate didn’t change
Today
War
mer
Cosmic rays, magnetic field don’t matter much to climate.

So, where does that leave us?• If higher CO2 warms, climate history is sensible, and CO2
caused or amplified most main changes;• There is now no plausible alternative to this; • If higher CO2 doesn’t warm, we must explain how physicists are
so wrong, and how so many suddenly-unexplained events happened;
• CO2 may be forcing or feedback—air is warmed by a CO2 molecule regardless of how it got there;
• Paleoclimatic data show climate sensitivity similar to values in modern models (~3oC for doubled CO2), perhaps with somewhat higher values over centuries or millennia especially in polar regions.

So, where does that leave us?• Lots of knobs control the Earth’s climate system;• “Sun” knob isn’t twiddled much over short times, and
ineffective over long times because of CO2;
• Magnetic-field, cosmic-ray, space-dust, other “space” knobs not shown to matter, and no more than fine-tuning (except very rare dinosaur-killer)
• Much on Earth matters regionally—a continent cools going from equator to pole, and North Atlantic ocean circulation is important—but global effect weak except through CO2;
• Much to learn! But, the complex history of Earth’s climate points to the power of human CO2 release.