G ARTICLE IN PRESS - wilberglab.cbl.umces.edu et al 2013... ·...
8
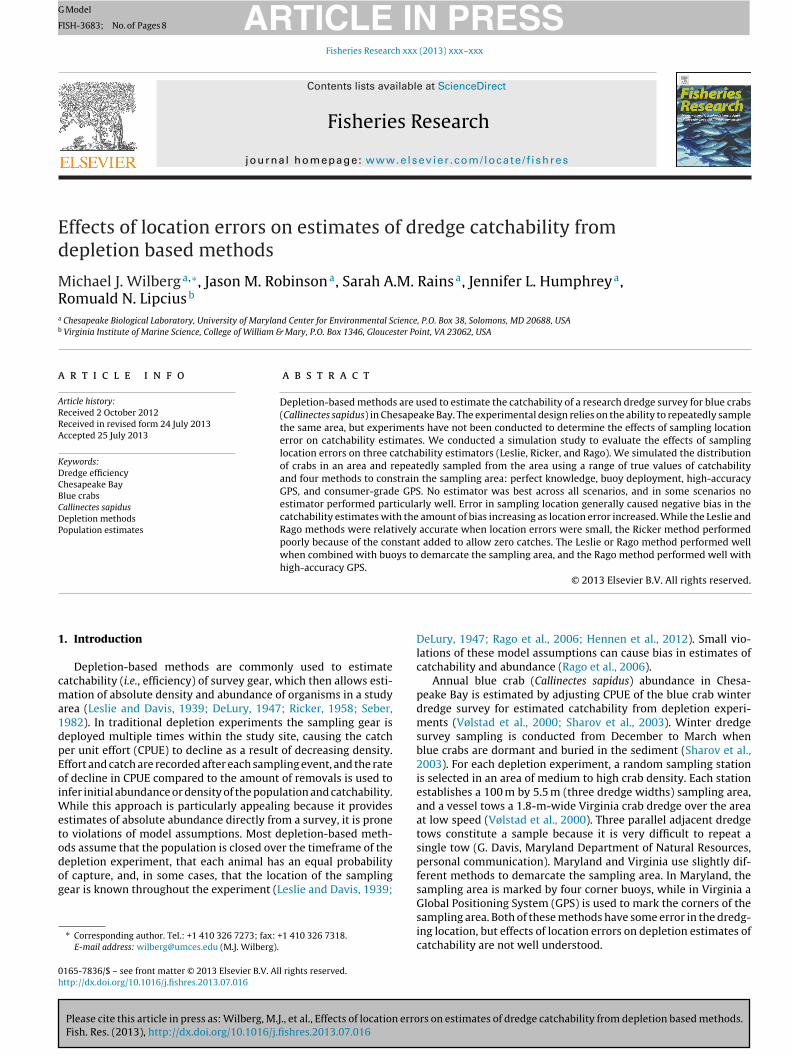
Please cite this article in press as: Wilberg, M.J., et al., Effects of location errors on estimates of dredge catchability from depletion based methods. Fish. Res. (2013), http://dx.doi.org/10.1016/j.fishres.2013.07.016 ARTICLE IN PRESS G Model FISH-3683; No. of Pages 8 Fisheries Research xxx (2013) xxx–xxx Contents lists available at ScienceDirect Fisheries Research jo u r n al homep age: www.elsevier.com/locate/fishres Effects of location errors on estimates of dredge catchability from depletion based methods Michael J. Wilberg a,∗ , Jason M. Robinson a , Sarah A.M. Rains a , Jennifer L. Humphrey a , Romuald N. Lipcius b a Chesapeake Biological Laboratory, University of Maryland Center for Environmental Science, P.O. Box 38, Solomons, MD 20688, USA b Virginia Institute of Marine Science, College of William & Mary, P.O. Box 1346, Gloucester Point, VA 23062, USA a r t i c l e i n f o Article history: Received 2 October 2012 Received in revised form 24 July 2013 Accepted 25 July 2013 Keywords: Dredge efficiency Chesapeake Bay Blue crabs Callinectes sapidus Depletion methods Population estimates a b s t r a c t Depletion-based methods are used to estimate the catchability of a research dredge survey for blue crabs (Callinectes sapidus) in Chesapeake Bay. The experimental design relies on the ability to repeatedly sample the same area, but experiments have not been conducted to determine the effects of sampling location error on catchability estimates. We conducted a simulation study to evaluate the effects of sampling location errors on three catchability estimators (Leslie, Ricker, and Rago). We simulated the distribution of crabs in an area and repeatedly sampled from the area using a range of true values of catchability and four methods to constrain the sampling area: perfect knowledge, buoy deployment, high-accuracy GPS, and consumer-grade GPS. No estimator was best across all scenarios, and in some scenarios no estimator performed particularly well. Error in sampling location generally caused negative bias in the catchability estimates with the amount of bias increasing as location error increased. While the Leslie and Rago methods were relatively accurate when location errors were small, the Ricker method performed poorly because of the constant added to allow zero catches. The Leslie or Rago method performed well when combined with buoys to demarcate the sampling area, and the Rago method performed well with high-accuracy GPS. © 2013 Elsevier B.V. All rights reserved. 1. Introduction Depletion-based methods are commonly used to estimate catchability (i.e., efficiency) of survey gear, which then allows esti- mation of absolute density and abundance of organisms in a study area (Leslie and Davis, 1939; DeLury, 1947; Ricker, 1958; Seber, 1982). In traditional depletion experiments the sampling gear is deployed multiple times within the study site, causing the catch per unit effort (CPUE) to decline as a result of decreasing density. Effort and catch are recorded after each sampling event, and the rate of decline in CPUE compared to the amount of removals is used to infer initial abundance or density of the population and catchability. While this approach is particularly appealing because it provides estimates of absolute abundance directly from a survey, it is prone to violations of model assumptions. Most depletion-based meth- ods assume that the population is closed over the timeframe of the depletion experiment, that each animal has an equal probability of capture, and, in some cases, that the location of the sampling gear is known throughout the experiment (Leslie and Davis, 1939; ∗ Corresponding author. Tel.: +1 410 326 7273; fax: +1 410 326 7318. E-mail address: [email protected] (M.J. Wilberg). DeLury, 1947; Rago et al., 2006; Hennen et al., 2012). Small vio- lations of these model assumptions can cause bias in estimates of catchability and abundance (Rago et al., 2006). Annual blue crab (Callinectes sapidus) abundance in Chesa- peake Bay is estimated by adjusting CPUE of the blue crab winter dredge survey for estimated catchability from depletion experi- ments (Vølstad et al., 2000; Sharov et al., 2003). Winter dredge survey sampling is conducted from December to March when blue crabs are dormant and buried in the sediment (Sharov et al., 2003). For each depletion experiment, a random sampling station is selected in an area of medium to high crab density. Each station establishes a 100 m by 5.5 m (three dredge widths) sampling area, and a vessel tows a 1.8-m-wide Virginia crab dredge over the area at low speed (Vølstad et al., 2000). Three parallel adjacent dredge tows constitute a sample because it is very difficult to repeat a single tow (G. Davis, Maryland Department of Natural Resources, personal communication). Maryland and Virginia use slightly dif- ferent methods to demarcate the sampling area. In Maryland, the sampling area is marked by four corner buoys, while in Virginia a Global Positioning System (GPS) is used to mark the corners of the sampling area. Both of these methods have some error in the dredg- ing location, but effects of location errors on depletion estimates of catchability are not well understood. 0165-7836/$ – see front matter © 2013 Elsevier B.V. All rights reserved. http://dx.doi.org/10.1016/j.fishres.2013.07.016
Transcript of G ARTICLE IN PRESS - wilberglab.cbl.umces.edu et al 2013... ·...
G
F
Ed
MRa
b
a
ARRA
KDCBCDP
1
cma1dpEoiWetodog
0h
ARTICLE IN PRESS Model
ISH-3683; No. of Pages 8
Fisheries Research xxx (2013) xxx– xxx
Contents lists available at ScienceDirect
Fisheries Research
jo u r n al homep age: www.elsev ier .com/ locate / f i shres
ffects of location errors on estimates of dredge catchability fromepletion based methods
ichael J. Wilberga,∗, Jason M. Robinsona, Sarah A.M. Rainsa, Jennifer L. Humphreya,omuald N. Lipciusb
Chesapeake Biological Laboratory, University of Maryland Center for Environmental Science, P.O. Box 38, Solomons, MD 20688, USAVirginia Institute of Marine Science, College of William & Mary, P.O. Box 1346, Gloucester Point, VA 23062, USA
r t i c l e i n f o
rticle history:eceived 2 October 2012eceived in revised form 24 July 2013ccepted 25 July 2013
eywords:redge efficiencyhesapeake Baylue crabs
a b s t r a c t
Depletion-based methods are used to estimate the catchability of a research dredge survey for blue crabs(Callinectes sapidus) in Chesapeake Bay. The experimental design relies on the ability to repeatedly samplethe same area, but experiments have not been conducted to determine the effects of sampling locationerror on catchability estimates. We conducted a simulation study to evaluate the effects of samplinglocation errors on three catchability estimators (Leslie, Ricker, and Rago). We simulated the distributionof crabs in an area and repeatedly sampled from the area using a range of true values of catchabilityand four methods to constrain the sampling area: perfect knowledge, buoy deployment, high-accuracyGPS, and consumer-grade GPS. No estimator was best across all scenarios, and in some scenarios no
allinectes sapidusepletion methodsopulation estimates
estimator performed particularly well. Error in sampling location generally caused negative bias in thecatchability estimates with the amount of bias increasing as location error increased. While the Leslie andRago methods were relatively accurate when location errors were small, the Ricker method performedpoorly because of the constant added to allow zero catches. The Leslie or Rago method performed wellwhen combined with buoys to demarcate the sampling area, and the Rago method performed well withhigh-accuracy GPS.
. Introduction
Depletion-based methods are commonly used to estimateatchability (i.e., efficiency) of survey gear, which then allows esti-ation of absolute density and abundance of organisms in a study
rea (Leslie and Davis, 1939; DeLury, 1947; Ricker, 1958; Seber,982). In traditional depletion experiments the sampling gear iseployed multiple times within the study site, causing the catcher unit effort (CPUE) to decline as a result of decreasing density.ffort and catch are recorded after each sampling event, and the ratef decline in CPUE compared to the amount of removals is used tonfer initial abundance or density of the population and catchability.
hile this approach is particularly appealing because it providesstimates of absolute abundance directly from a survey, it is proneo violations of model assumptions. Most depletion-based meth-ds assume that the population is closed over the timeframe of the
Please cite this article in press as: Wilberg, M.J., et al., Effects of location erroFish. Res. (2013), http://dx.doi.org/10.1016/j.fishres.2013.07.016
epletion experiment, that each animal has an equal probabilityf capture, and, in some cases, that the location of the samplingear is known throughout the experiment (Leslie and Davis, 1939;
∗ Corresponding author. Tel.: +1 410 326 7273; fax: +1 410 326 7318.E-mail address: [email protected] (M.J. Wilberg).
165-7836/$ – see front matter © 2013 Elsevier B.V. All rights reserved.ttp://dx.doi.org/10.1016/j.fishres.2013.07.016
© 2013 Elsevier B.V. All rights reserved.
DeLury, 1947; Rago et al., 2006; Hennen et al., 2012). Small vio-lations of these model assumptions can cause bias in estimates ofcatchability and abundance (Rago et al., 2006).
Annual blue crab (Callinectes sapidus) abundance in Chesa-peake Bay is estimated by adjusting CPUE of the blue crab winterdredge survey for estimated catchability from depletion experi-ments (Vølstad et al., 2000; Sharov et al., 2003). Winter dredgesurvey sampling is conducted from December to March whenblue crabs are dormant and buried in the sediment (Sharov et al.,2003). For each depletion experiment, a random sampling stationis selected in an area of medium to high crab density. Each stationestablishes a 100 m by 5.5 m (three dredge widths) sampling area,and a vessel tows a 1.8-m-wide Virginia crab dredge over the areaat low speed (Vølstad et al., 2000). Three parallel adjacent dredgetows constitute a sample because it is very difficult to repeat asingle tow (G. Davis, Maryland Department of Natural Resources,personal communication). Maryland and Virginia use slightly dif-ferent methods to demarcate the sampling area. In Maryland, thesampling area is marked by four corner buoys, while in Virginia a
rs on estimates of dredge catchability from depletion based methods.
Global Positioning System (GPS) is used to mark the corners of thesampling area. Both of these methods have some error in the dredg-ing location, but effects of location errors on depletion estimates ofcatchability are not well understood.
IN PRESSG Model
F
2 es Research xxx (2013) xxx– xxx
cdieprtsb
2
2
lcTstsmaaa–(ibdms
intsl1poMie
tWtrlTvsBrbot
2
cw
Target area
Sampled area
y1 error
100 m
y2 error
x error
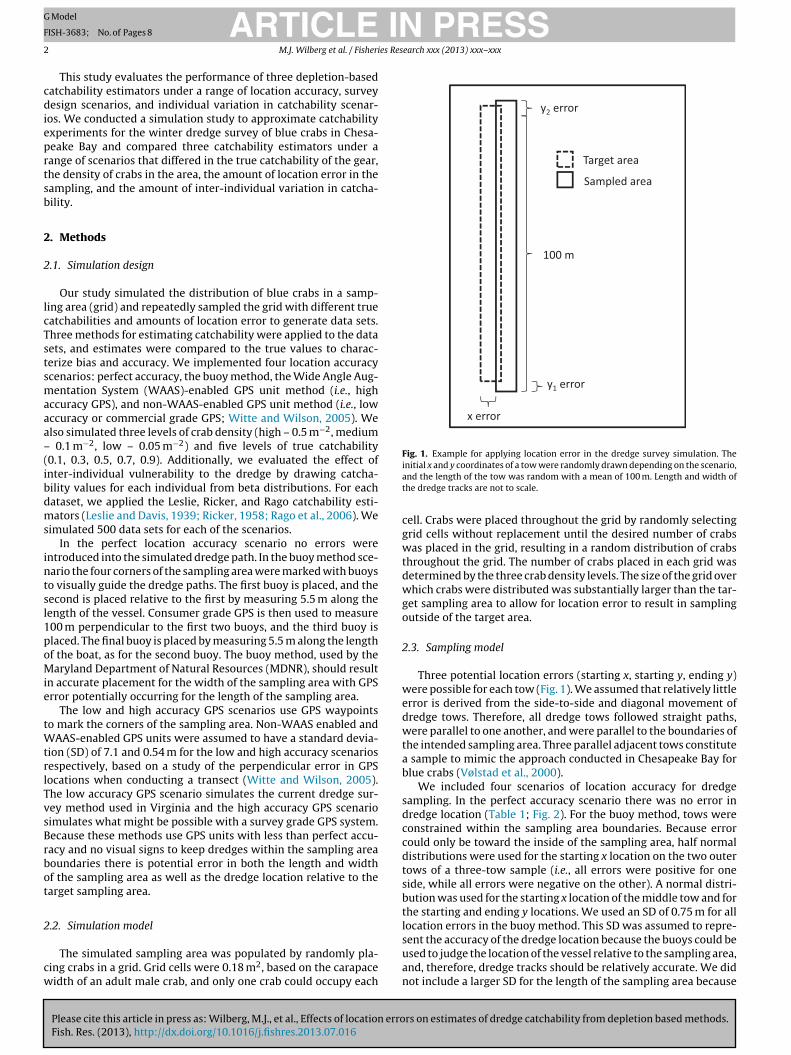
Fig. 1. Example for applying location error in the dredge survey simulation. The
ARTICLEISH-3683; No. of Pages 8
M.J. Wilberg et al. / Fisheri
This study evaluates the performance of three depletion-basedatchability estimators under a range of location accuracy, surveyesign scenarios, and individual variation in catchability scenar-
os. We conducted a simulation study to approximate catchabilityxperiments for the winter dredge survey of blue crabs in Chesa-eake Bay and compared three catchability estimators under aange of scenarios that differed in the true catchability of the gear,he density of crabs in the area, the amount of location error in theampling, and the amount of inter-individual variation in catcha-ility.
. Methods
.1. Simulation design
Our study simulated the distribution of blue crabs in a samp-ing area (grid) and repeatedly sampled the grid with different trueatchabilities and amounts of location error to generate data sets.hree methods for estimating catchability were applied to the dataets, and estimates were compared to the true values to charac-erize bias and accuracy. We implemented four location accuracycenarios: perfect accuracy, the buoy method, the Wide Angle Aug-entation System (WAAS)-enabled GPS unit method (i.e., high
ccuracy GPS), and non-WAAS-enabled GPS unit method (i.e., lowccuracy or commercial grade GPS; Witte and Wilson, 2005). Welso simulated three levels of crab density (high – 0.5 m−2, medium
0.1 m−2, low – 0.05 m−2) and five levels of true catchability0.1, 0.3, 0.5, 0.7, 0.9). Additionally, we evaluated the effect ofnter-individual vulnerability to the dredge by drawing catcha-ility values for each individual from beta distributions. For eachataset, we applied the Leslie, Ricker, and Rago catchability esti-ators (Leslie and Davis, 1939; Ricker, 1958; Rago et al., 2006). We
imulated 500 data sets for each of the scenarios.In the perfect location accuracy scenario no errors were
ntroduced into the simulated dredge path. In the buoy method sce-ario the four corners of the sampling area were marked with buoyso visually guide the dredge paths. The first buoy is placed, and theecond is placed relative to the first by measuring 5.5 m along theength of the vessel. Consumer grade GPS is then used to measure00 m perpendicular to the first two buoys, and the third buoy islaced. The final buoy is placed by measuring 5.5 m along the lengthf the boat, as for the second buoy. The buoy method, used by thearyland Department of Natural Resources (MDNR), should result
n accurate placement for the width of the sampling area with GPSrror potentially occurring for the length of the sampling area.
The low and high accuracy GPS scenarios use GPS waypointso mark the corners of the sampling area. Non-WAAS enabled and
AAS-enabled GPS units were assumed to have a standard devia-ion (SD) of 7.1 and 0.54 m for the low and high accuracy scenariosespectively, based on a study of the perpendicular error in GPSocations when conducting a transect (Witte and Wilson, 2005).he low accuracy GPS scenario simulates the current dredge sur-ey method used in Virginia and the high accuracy GPS scenarioimulates what might be possible with a survey grade GPS system.ecause these methods use GPS units with less than perfect accu-acy and no visual signs to keep dredges within the sampling areaoundaries there is potential error in both the length and widthf the sampling area as well as the dredge location relative to thearget sampling area.
.2. Simulation model
Please cite this article in press as: Wilberg, M.J., et al., Effects of location erroFish. Res. (2013), http://dx.doi.org/10.1016/j.fishres.2013.07.016
The simulated sampling area was populated by randomly pla-ing crabs in a grid. Grid cells were 0.18 m2, based on the carapaceidth of an adult male crab, and only one crab could occupy each
initial x and y coordinates of a tow were randomly drawn depending on the scenario,and the length of the tow was random with a mean of 100 m. Length and width ofthe dredge tracks are not to scale.
cell. Crabs were placed throughout the grid by randomly selectinggrid cells without replacement until the desired number of crabswas placed in the grid, resulting in a random distribution of crabsthroughout the grid. The number of crabs placed in each grid wasdetermined by the three crab density levels. The size of the grid overwhich crabs were distributed was substantially larger than the tar-get sampling area to allow for location error to result in samplingoutside of the target area.
2.3. Sampling model
Three potential location errors (starting x, starting y, ending y)were possible for each tow (Fig. 1). We assumed that relatively littleerror is derived from the side-to-side and diagonal movement ofdredge tows. Therefore, all dredge tows followed straight paths,were parallel to one another, and were parallel to the boundaries ofthe intended sampling area. Three parallel adjacent tows constitutea sample to mimic the approach conducted in Chesapeake Bay forblue crabs (Vølstad et al., 2000).
We included four scenarios of location accuracy for dredgesampling. In the perfect accuracy scenario there was no error indredge location (Table 1; Fig. 2). For the buoy method, tows wereconstrained within the sampling area boundaries. Because errorcould only be toward the inside of the sampling area, half normaldistributions were used for the starting x location on the two outertows of a three-tow sample (i.e., all errors were positive for oneside, while all errors were negative on the other). A normal distri-bution was used for the starting x location of the middle tow and forthe starting and ending y locations. We used an SD of 0.75 m for alllocation errors in the buoy method. This SD was assumed to repre-
rs on estimates of dredge catchability from depletion based methods.
sent the accuracy of the dredge location because the buoys could beused to judge the location of the vessel relative to the sampling area,and, therefore, dredge tracks should be relatively accurate. We didnot include a larger SD for the length of the sampling area because
ARTICLE IN PRESSG Model
FISH-3683; No. of Pages 8
M.J. Wilberg et al. / Fisheries Research xxx (2013) xxx– xxx 3
Table 1Equations describing location error scenarios. Symbols xi and y1,i represent the starting x and y coordinates of dredge tow i, and y2,i represents the ending y coordinate ofthe dredge tow (Fig. 1). Symbols without hats indicate the desired starting and ending locations with no errors. The ε symbols represent location errors and were all drawnfrom normal distributions with means of zero and standard deviations (�) determined by the scenario. Symbols x and y represent the observed locations that are necessaryinputs for the Rago method.
Method x y1 y2 Distributions
Perfect xi = xi y1,i = y1 y2,i = y2
Buoy xi ={
x1 + |εx,i|x2 + εx,i
x3 − |εx,i|y1,i = y1 + εy1,i y2,i = y2 + εy2,i εx,i, εy1,i, εy2,i∼N(0, � = 0.75)
pmlsifuei
Fm
High accuracy GPS xi = xi + εx,i y1,i = y1 + εy1,i
Low accuracy GPS xi = xi + εx,i y1,i = y1 + εy1,i
Rago method errors xi = xi + εx,i y1,i = y1 + εy1,i
reliminary simulations indicated that catchability estimates wereuch less sensitive to error in the length of the sampling area (y
ocations) than the x locations. For the high and low accuracy GPScenarios, we used normal distributions for the starting x, start-ng y, and ending y locations. We used SDs of 0.54 m and 7.1 m
Please cite this article in press as: Wilberg, M.J., et al., Effects of location erroFish. Res. (2013), http://dx.doi.org/10.1016/j.fishres.2013.07.016
or the WAAS-enabled GPS unit and the non-WAAS-enabled GPSnit scenarios, respectively (Witte and Wilson, 2005). The locationrrors altered each of the demarcated dredge tow areas from theirntended path (Fig. 1), based on the SD of the location accuracy.
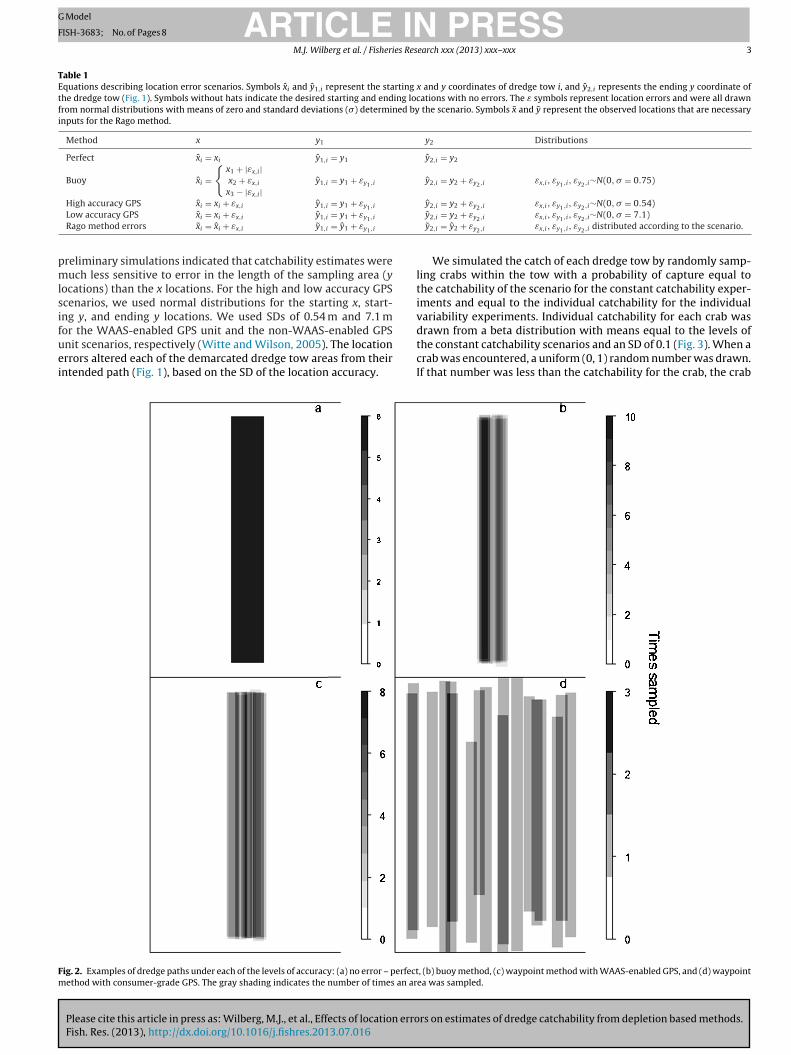
ig. 2. Examples of dredge paths under each of the levels of accuracy: (a) no error – perfectethod with consumer-grade GPS. The gray shading indicates the number of times an ar
y2,i = y2 + εy2,i εx,i, εy1,i, εy2,i∼N(0, � = 0.54)y2,i = y2 + εy2,i εx,i, εy1,i, εy2,i∼N(0, � = 7.1)y2,i = y2 + εy2,i εx,i, εy1,i, εy2,i distributed according to the scenario.
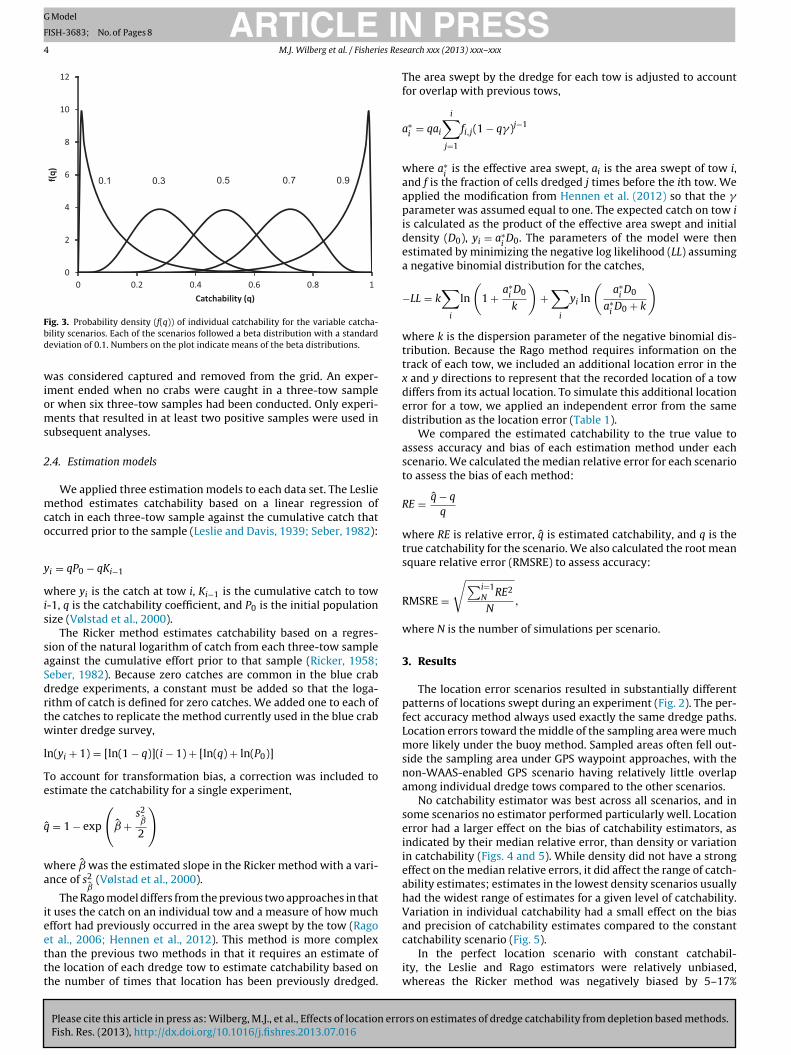
We simulated the catch of each dredge tow by randomly samp-ling crabs within the tow with a probability of capture equal tothe catchability of the scenario for the constant catchability exper-iments and equal to the individual catchability for the individualvariability experiments. Individual catchability for each crab was
rs on estimates of dredge catchability from depletion based methods.
drawn from a beta distribution with means equal to the levels ofthe constant catchability scenarios and an SD of 0.1 (Fig. 3). When acrab was encountered, a uniform (0, 1) random number was drawn.If that number was less than the catchability for the crab, the crab
, (b) buoy method, (c) waypoint method with WAAS-enabled GPS, and (d) waypointea was sampled.
ARTICLE ING Model
FISH-3683; No. of Pages 8
4 M.J. Wilberg et al. / Fisheries Res
0
2
4
6
8
10
12
10.80.60.40.20
f(q)
Catchability (q)
0.1 0.3 0.5 0.7 0.9
Fbd
wioms
2
mco
y
wis
saSdrtw
l
Te
q
wa
ieettt
ig. 3. Probability density (f(q)) of individual catchability for the variable catcha-ility scenarios. Each of the scenarios followed a beta distribution with a standardeviation of 0.1. Numbers on the plot indicate means of the beta distributions.
as considered captured and removed from the grid. An exper-ment ended when no crabs were caught in a three-tow sampler when six three-tow samples had been conducted. Only experi-ents that resulted in at least two positive samples were used in
ubsequent analyses.
.4. Estimation models
We applied three estimation models to each data set. The Leslieethod estimates catchability based on a linear regression of
atch in each three-tow sample against the cumulative catch thatccurred prior to the sample (Leslie and Davis, 1939; Seber, 1982):
i = qP0 − qKi−1
here yi is the catch at tow i, Ki−1 is the cumulative catch to tow-1, q is the catchability coefficient, and P0 is the initial populationize (Vølstad et al., 2000).
The Ricker method estimates catchability based on a regres-ion of the natural logarithm of catch from each three-tow samplegainst the cumulative effort prior to that sample (Ricker, 1958;eber, 1982). Because zero catches are common in the blue crabredge experiments, a constant must be added so that the loga-ithm of catch is defined for zero catches. We added one to each ofhe catches to replicate the method currently used in the blue crabinter dredge survey,
n(yi + 1) = [ln(1 − q)](i − 1) + [ln(q) + ln(P0)]
o account for transformation bias, a correction was included tostimate the catchability for a single experiment,
ˆ = 1 − exp
(ˆ +
s2ˆ
2
)
here ˆ was the estimated slope in the Ricker method with a vari-
nce of s2ˆ (Vølstad et al., 2000).
The Rago model differs from the previous two approaches in thatt uses the catch on an individual tow and a measure of how muchffort had previously occurred in the area swept by the tow (Rago
Please cite this article in press as: Wilberg, M.J., et al., Effects of location erroFish. Res. (2013), http://dx.doi.org/10.1016/j.fishres.2013.07.016
t al., 2006; Hennen et al., 2012). This method is more complexhan the previous two methods in that it requires an estimate ofhe location of each dredge tow to estimate catchability based onhe number of times that location has been previously dredged.
PRESSearch xxx (2013) xxx– xxx
The area swept by the dredge for each tow is adjusted to accountfor overlap with previous tows,
a∗i = qai
i∑j=1
fi,j(1 − q�)j−1
where a∗i
is the effective area swept, ai is the area swept of tow i,and f is the fraction of cells dredged j times before the ith tow. Weapplied the modification from Hennen et al. (2012) so that the �parameter was assumed equal to one. The expected catch on tow iis calculated as the product of the effective area swept and initialdensity (D0), yi = a∗
iD0. The parameters of the model were then
estimated by minimizing the negative log likelihood (LL) assuminga negative binomial distribution for the catches,
−LL = k∑
i
ln
(1 + a∗
iD0
k
)+∑
i
yi ln
(a∗
iD0
a∗iD0 + k
)
where k is the dispersion parameter of the negative binomial dis-tribution. Because the Rago method requires information on thetrack of each tow, we included an additional location error in thex and y directions to represent that the recorded location of a towdiffers from its actual location. To simulate this additional locationerror for a tow, we applied an independent error from the samedistribution as the location error (Table 1).
We compared the estimated catchability to the true value toassess accuracy and bias of each estimation method under eachscenario. We calculated the median relative error for each scenarioto assess the bias of each method:
RE = q − q
q
where RE is relative error, q is estimated catchability, and q is thetrue catchability for the scenario. We also calculated the root meansquare relative error (RMSRE) to assess accuracy:
RMSRE =
√∑i=1N RE2
N,
where N is the number of simulations per scenario.
3. Results
The location error scenarios resulted in substantially differentpatterns of locations swept during an experiment (Fig. 2). The per-fect accuracy method always used exactly the same dredge paths.Location errors toward the middle of the sampling area were muchmore likely under the buoy method. Sampled areas often fell out-side the sampling area under GPS waypoint approaches, with thenon-WAAS-enabled GPS scenario having relatively little overlapamong individual dredge tows compared to the other scenarios.
No catchability estimator was best across all scenarios, and insome scenarios no estimator performed particularly well. Locationerror had a larger effect on the bias of catchability estimators, asindicated by their median relative error, than density or variationin catchability (Figs. 4 and 5). While density did not have a strongeffect on the median relative errors, it did affect the range of catch-ability estimates; estimates in the lowest density scenarios usuallyhad the widest range of estimates for a given level of catchability.Variation in individual catchability had a small effect on the biasand precision of catchability estimates compared to the constant
rs on estimates of dredge catchability from depletion based methods.
catchability scenario (Fig. 5).In the perfect location scenario with constant catchabil-
ity, the Leslie and Rago estimators were relatively unbiased,whereas the Ricker method was negatively biased by 5–17%
ARTICLE IN PRESSG Model
FISH-3683; No. of Pages 8
M.J. Wilberg et al. / Fisheries Research xxx (2013) xxx– xxx 5
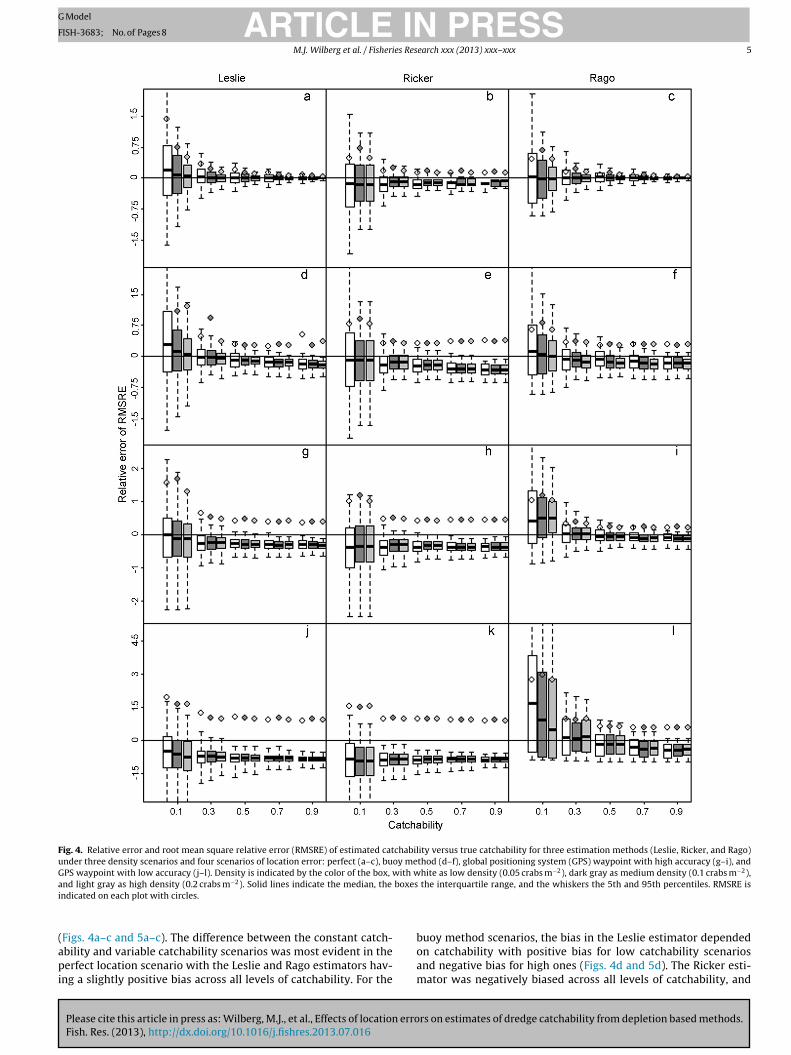
Fig. 4. Relative error and root mean square relative error (RMSRE) of estimated catchability versus true catchability for three estimation methods (Leslie, Ricker, and Rago)under three density scenarios and four scenarios of location error: perfect (a–c), buoy method (d–f), global positioning system (GPS) waypoint with high accuracy (g–i), andGPS waypoint with low accuracy (j–l). Density is indicated by the color of the box, with white as low density (0.05 crabs m−2), dark gray as medium density (0.1 crabs m−2),a boxesi
(api
nd light gray as high density (0.2 crabs m−2). Solid lines indicate the median, the
ndicated on each plot with circles.
Please cite this article in press as: Wilberg, M.J., et al., Effects of location erroFish. Res. (2013), http://dx.doi.org/10.1016/j.fishres.2013.07.016
Figs. 4a–c and 5a–c). The difference between the constant catch-bility and variable catchability scenarios was most evident in theerfect location scenario with the Leslie and Rago estimators hav-
ng a slightly positive bias across all levels of catchability. For the
the interquartile range, and the whiskers the 5th and 95th percentiles. RMSRE is
rs on estimates of dredge catchability from depletion based methods.
buoy method scenarios, the bias in the Leslie estimator dependedon catchability with positive bias for low catchability scenariosand negative bias for high ones (Figs. 4d and 5d). The Ricker esti-mator was negatively biased across all levels of catchability, and
ARTICLE IN PRESSG Model
FISH-3683; No. of Pages 8
6 M.J. Wilberg et al. / Fisheries Research xxx (2013) xxx– xxx
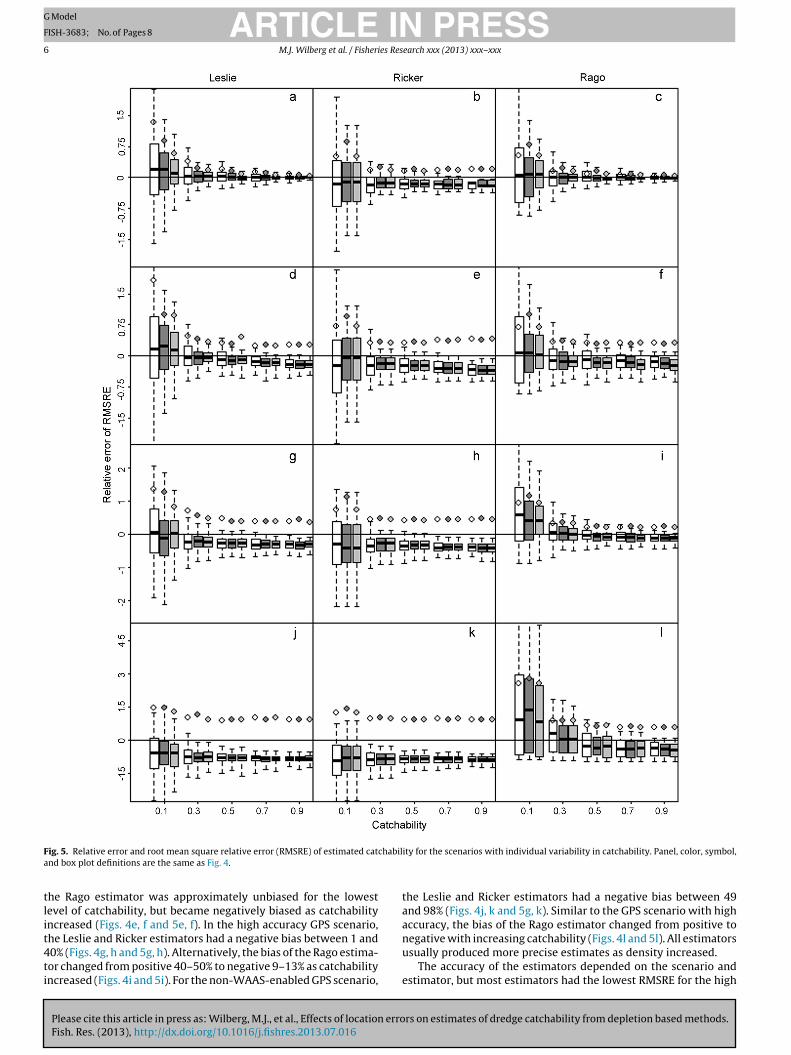
F chabila
tlit4ti
ig. 5. Relative error and root mean square relative error (RMSRE) of estimated catnd box plot definitions are the same as Fig. 4.
he Rago estimator was approximately unbiased for the lowestevel of catchability, but became negatively biased as catchabilityncreased (Figs. 4e, f and 5e, f). In the high accuracy GPS scenario,
Please cite this article in press as: Wilberg, M.J., et al., Effects of location erroFish. Res. (2013), http://dx.doi.org/10.1016/j.fishres.2013.07.016
he Leslie and Ricker estimators had a negative bias between 1 and0% (Figs. 4g, h and 5g, h). Alternatively, the bias of the Rago estima-or changed from positive 40–50% to negative 9–13% as catchabilityncreased (Figs. 4i and 5i). For the non-WAAS-enabled GPS scenario,
ity for the scenarios with individual variability in catchability. Panel, color, symbol,
the Leslie and Ricker estimators had a negative bias between 49and 98% (Figs. 4j, k and 5g, k). Similar to the GPS scenario with highaccuracy, the bias of the Rago estimator changed from positive to
rs on estimates of dredge catchability from depletion based methods.
negative with increasing catchability (Figs. 4l and 5l). All estimatorsusually produced more precise estimates as density increased.
The accuracy of the estimators depended on the scenario andestimator, but most estimators had the lowest RMSRE for the high
ING Model
F
es Res
cpcdpRmth
4
ocmawataa
bovplmpcsmocmopTtTsdsFdoP
ftcpioisactuo
sw
ARTICLEISH-3683; No. of Pages 8
M.J. Wilberg et al. / Fisheri
atchability and high density scenarios (Figs. 4 and 5). For theerfect location scenario, RMSRE decreased with increasing trueatchability for all estimators, and was always lowest for the highensity scenario. In the buoy scenario, the Leslie and Rago methodserformed similarly, but the Ricker estimator had somewhat higherMSREs at moderate and high levels of catchability. The Rago esti-ator had lower RMSREs at moderate to high levels of catchability
han the Leslie or Ricker estimators for the GPS scenarios with bothigh and low accuracy (Fig. 4g–i).
. Discussion
Our simulation results indicate that moderate to high levelsf error in sampling location generally caused negative bias inatchability estimates from dredge depletion studies. However, theagnitude and sign of the bias primarily depended on the amount
nd type of location error and the true catchability. Estimatorsere often positively biased when the true catchability was low
nd negatively biased when true catchability was high. The higherhe degree of location error, the more biased the estimates usu-lly were. This in turn would cause a positive bias in estimates ofbundance or density derived from dredge survey data.
The Leslie and Rago estimators had the general property of biasecoming increasingly negative as true catchability increased. Bothf these estimators rely on using an approximation of the expectedalue of a catch on a given tow, which likely causes the observedattern of bias. The approximation is most appropriate for lower
evels of catchability (Gould and Pollock, 1997). While the Rickerethod also relies on an approximation for expected catch, its poor
erformance was likely caused by the constant added to the trueatch values to allow for zero catches in the analysis. In additionalimulations (not shown), the Ricker method produced biased esti-ates regardless of the constant applied, unless there were no
bserved zeros. For any given true catchability, there was an asso-iated constant that would produce an unbiased estimator, but oneust know the true catchability in advance. While the addition
f constants to allow for a log transformation is widely used, it canroduce biased results (Ortiz et al., 2000; Maunder and Punt, 2004).his is a particular problem for the winter dredge survey becausehe survey attempts to sample until zero catches are observed.hus, methods that allow for zero catches without transformationhould be used when zero catches are frequently observed in theata. Additionally, all of the methods were originally developed forituations in which the population was not completely removed.or example, Ricker (1975) notes that the population should beepleted by at least 30% to obtain quality estimates. Applicationf a maximum likelihood approach, similar to that in Gould andollock (1997), could improve estimates from depletion studies.
Location errors should result in a negative bias in catchabilityor the Leslie and Ricker methods (Rago et al., 2006). For instance,he Leslie estimator relies on a regression of catch in a tow againstumulative catch up to that tow, and the slope of the regressionrovides the estimate of catchability. If the depletion experiment
s deployed perfectly, catch per tow should decrease as the densityf organisms in the sampling area decreases and cumulative catchncreases. However, if location errors occur, some portion of theampling area will be missed during early samples. Eventually thesereas that were previously missed will be sampled, resulting in highatches late in the experiment, which exerts substantial leverage onhe slope of the regression. The regression slope will be attenuatednder these conditions, causing an underestimate of catchability
Please cite this article in press as: Wilberg, M.J., et al., Effects of location erroFish. Res. (2013), http://dx.doi.org/10.1016/j.fishres.2013.07.016
n average.Dredge survey methods that used pre-deployed buoys to con-
train the dredge paths resulted in estimates of catchability thatere slightly less biased than methods which relied on high
PRESSearch xxx (2013) xxx– xxx 7
accuracy GPS guidance and much less biased than methodswhich relied on consumer-grade GPS. Accuracy of catchabilityestimates increased as the true capture efficiency of the dredgeincreased in all cases, and the bias of the catchability estimatesalso tended to be lower as simulated crab density increased,which agrees with previous studies (Seber, 1982; Gould andPollock, 1997; Gould et al., 1997). In addition to selecting themost unbiased method for estimating catchability, our resultshighlight the importance of deploying the dredge with high preci-sion to produce accurate estimates of catchability and abundance.Choosing areas of high abundance to conduct catchability exper-iments also improves performance of the estimators, as long asdredge catchability is the same in areas of high and low crabdensity.
The Rago et al. (2006) method produced biased estimates ofcatchability in many scenarios of location error, but the biaschanged from positive to negative as the true catchability increased.Hennen et al. (2012) found a three-way interaction betweenrelative error of the catchability estimate and true catchability,error scenario, and dredge path. However, Hennen et al. (2012)concluded that the Rago method produced relatively unbiased esti-mates of catchability when results were pooled across all truevalues of catchability. The disagreement between Hennen et al.’sand our conclusions was probably caused by differences in theaggregation of results. If we aggregate the results of the Ragomethod over catchability levels, the estimates are approximatelyunbiased because the negative bias at high catchability balancesout the positive bias at low catchability.
The true accuracy of the catchability estimators may havebeen overestimated in our study because we did not include dis-placement between the dredge and the vessel, which could causeadditional errors in the start and stop locations of the dredge tows.However, this displacement would likely have a minimal effecton our results because it would only affect the error surroundingstart and stop locations of each tow. Additionally, preliminary sim-ulations indicated that errors in the length of a dredge tow hada minimal effect on estimated catchability relative to the errorintroduced when a dredge tow deviates from the intended path.We also assumed that once a dredge pass began the vessel traveledin a straight line and did not wander laterally. Therefore, any lateralerror in dredge location would be constant for that tow. Character-istics of the bottom habitat may also affect catchability, causingdifferences in mean catchability among sites (Vølstad et al., 2000).
The use of buoys to guide the dredge tows, coupled with theLeslie or Rago method (Leslie and Davis, 1939; Rago et al., 2006),or high-accuracy GPS with the Rago method appear to be practicalways to implement catchability experiments for blue crabs in theChesapeake Bay. Using buoys with the Leslie or Rago method shouldonly require a small correction for the negative bias of the catcha-bility estimate to produce accurate population or density estimates,provided our assumptions about the location accuracy of the buoymethod is correct. Under most scenarios with buoys or high-accuracy GPS the Rago method and Leslie method produced similarresults in terms of bias and accuracy. The buoy method has thedisadvantage that if a buoy is accidentally caught during the exper-iment, the experiment must be conducted again in a new location.This situation is particularly problematic in deeper waters, in whichthe location of the buoy may differ from that of its anchor becauseof currents. However, the Rago method requires that the track ofeach dredge tow is known and recorded. The winter dredge surveyhas not recorded the track locations with enough precision (e.g.,starting and ending locations of dredge tows were only recorded
rs on estimates of dredge catchability from depletion based methods.
with precision of ±10 m) to apply the Rago method to historicaldata. If high-accuracy GPS units were used in future efforts to mon-itor the dredge tracks, the Rago method would likely have a smallnegative, correctable bias. For example, the results from our study
ING Model
F
8 es Res
clfpawfn
A
gcwltg4e
R
D
ARTICLEISH-3683; No. of Pages 8
M.J. Wilberg et al. / Fisheri
ould be used to correct catchability estimates assuming that ourocation accuracy assumptions are correct. While this approachor correcting bias should be tested before it is applied, it shouldroduce more accurate estimates of catchability. The only high-ccuracy GPS scenario where the Rago method performed poorlyas at very low catchability (i.e., 0.1). In most cases all methods per-
ormed poorly with the low-accuracy GPS, and this combination isot generally recommended.
cknowledgments
We thank Tom Miller, Glenn Davis, and Alexei Sharov for sug-estions that improved this study. André Punt provided helpfulomments on a previous draft of the manuscript. This researchas partially supported by NOAA Chesapeake Bay Office, Mary-
and Department of Natural Resources, Commonwealth of Virginiahrough funds to Virginia Institute of Marine Science, and the Vir-inia Marine Resources Commission. This is contribution number780 of the University of Maryland Center for Environmental Sci-nce.
Please cite this article in press as: Wilberg, M.J., et al., Effects of location erroFish. Res. (2013), http://dx.doi.org/10.1016/j.fishres.2013.07.016
eferences
eLury, D.B., 1947. On the estimation of biological populations. Biometrics 3,145–167.
PRESSearch xxx (2013) xxx– xxx
Gould, W.R., Pollock, K.H., 1997. Catch-effort maximum likelihood estimation ofimportant population parameters. Canadian Journal of Fisheries and AquaticSciences 54, 890–897.
Gould, W.R., Stefanski, L.A., Pollok, K.H., 1997. Effects of measurement error oncatch-effort estimation. Canadian Journal of Fisheries and Aquatic Sciences 54,898–906.
Hennen, D.R., Jacobson, L.D., Tang, J., 2012. Accuracy of the Patch model used toestimate density and capture efficiency in depletion experiments for sessileinvertebrates and fish. ICES Journal of Marine Science 69, 240–249.
Leslie, P.H., Davis, D.H.S., 1939. An attempt to determine the absolute number of ratson a given area. Journal of Animal Ecology 8 (94), 113.
Maunder, M.N., Punt, A.E., 2004. Standardizing catch and effort data: a review ofrecent approaches. Fisheries Research 70, 141–149.
Ortiz, M., Legualt, C.M., Ehrhardt, N.M., 2000. An alternative method of estimatingbycatch from the U.S. shrimp trawl fishery in the Gulf of Mexico, 1972–1995.Fishery Bulletin 98, 583–599.
Ricker, W.E., 1958. Handbook of computations for biological statistics of fish popu-lations. Bulletins of Fisheries Research, Board of Canada, 119.
Ricker, W.E., 1975. Computation and Interpretation of Biological Statistic of FishPopulations. Bulletins of Fisheries Research, Board of Canada 191, 382.
Rago, P.J., Weinberg, J.R., Weidman, C., 2006. A spatial model to estimate gear effi-ciency and animal density from depletion experiments. Canadian Journal ofFisheries and Aquatic Sciences 63, 2377–2388.
Seber, G.A.F., 1982. The Estimation of Animal Abundance and Related Parameters.The Blackburn Press, Caldwell.
Sharov, A.F., Vølstad, J.H., Davis, G.R., Davis, B.K., Lipcius, R.N., Montane, M.M., 2003.Abundance and exploitation rate of the blue crab (Callinectes sapidus) in Chesa-peake Bay. Bulletin of Marine Science 72, 543–565.
rs on estimates of dredge catchability from depletion based methods.
Vølstad, J.H., Sharov, A.F., Davis, G.R., Davis, B.K., 2000. A method for estimatingdredge catching efficiency for blue crabs, Callinectes sapidus, in Chesapeake Bay.Fishery Bulletin 98, 410–420.
Witte, T.E., Wilson, A.M., 2005. Accuracy of WAAS-enabled GPS for the determinationof position and speed over ground. Journal of Biomechanics 38, 1717–1722.