FY2018 Financial Results · We continued investing in ongoing projects from the previous 3-year...
48
Copyright 2019 Keio Corporation All Rights Reserved FY2018 Financial Results May 8, 2019
Transcript of FY2018 Financial Results · We continued investing in ongoing projects from the previous 3-year...

Copyright 2019 Keio Corporation All Rights Reserved
FY2018Financial Results
May 8, 2019

1
Copyright 2019 Keio Corporation All Rights Reserved
I. Update on 3-Year Medium-Term Management Plan(FY2018-2020)
President and Representative Director Yasushi Komura
II. FY2018 Earnings and FY2019 Forecasts
Managing Director Shunji Ito(in charge of Finance and Information Disclosure)
Reference 1: Detailed Earnings Report for FY2018
Reference 2: Detailed Earnings Forecasts for FY2019
Contents

2
Copyright 2019 Keio Corporation All Rights Reserved
I. Update on 3-Year Medium-Term Management Plan (FY2018-2020)
1. Performance Summary
2. Actions Taken
3. 3-Year Business Projections
4. Investments
5. 3-Year Cash Flow Projections
6. Trends in Net Income and Dividends
President and Representative Director Yasushi Komura

3
Copyright 2019 Keio Corporation All Rights Reserved
I. Update on 3-Year Medium-Term Management Plan (FY2018-2020)
1. Performance Summary
FY2018 results
Operating revenues rose year-on-year to 4,475 hmy, thanks to brisk performance in the development for selling by lots and hotels businesses. Operating profit increased to 400 hmy, and profit attributable to owners of parent reached a record high of 272 hmy.
Profit margin and ROA were as anticipated, at 9.0% and 4.4%. We continued investing in ongoing projects from the previous 3-year plan.
FY2019 forecasts
Buoyed by the hotels (new openings) and development for selling by lots, operating revenues will reach 4,600 hmy and operating profit will reach a record high of 433 hmy.
Profit margin will reach 9.4% and ROA 4.7%, bringing us a step closer to the FY2020 targets of 10% and 5%.
We are on course to hitting the FY2020 targets. We will continue strategic investment over the medium to long term.

4
Copyright 2019 Keio Corporation All Rights Reserved
I. Update on 3-Year Medium-Term Management Plan (FY2018-2020)
Actions taken in FY2018 Actions for FY2019
Make Railways safer and more profitable
Strengthen profitability of existing businessesStrengthen profitability of existing businesses
Key policies
Establish Revenue Base in Growth FieldsEstablish Revenue Base in Growth Fields
Obtain returns on the Strategic Investment made in first-half plan and thus achieve the growth necessary to prepare a solid foundation for the coming era of
depopulation and large-scale investment
Revitalize line-side areas
Selection and concentration of businesses
Construction of grade crossing and elevated lines along Keio Line (between Sasazuka and Sengawa stations)
Strengthen profitability of existing hotels
Develop hotels business
Develop renovation business
Renovated commercial facilities
Consolidated (closed under-performing businesses)
Keio Plaza Hotel opened more rooms on Premier Grand floor
Keio Prelia Hotel Kyoto Karasuma-Gojo
Acquired Opus Arisugawa Terrace and Residence Further develop the business
(Redevelopment project in Shinjuku Station area)
Open three new locations (Kyoto, Hiroshima, Tokyo)
Renovate rooms
■In FY2018, we made headway in key actions.■In FY2019, we will continue working on the key policies (see below) to achieve growth.
Explore further service expansionExpanded Keio Liner services
Complete new wing of Takayama Green Hotel
Open new Keio Prelia Hotel Sapporo
“The Share Hotels” opened its fifth location (Kyoto)
Basic approach
2. Actions Taken
5
Copyright 2019 Keio Corporation All Rights Reserved
I. Update on 3-Year Medium-Term Management Plan (FY2018-2020)
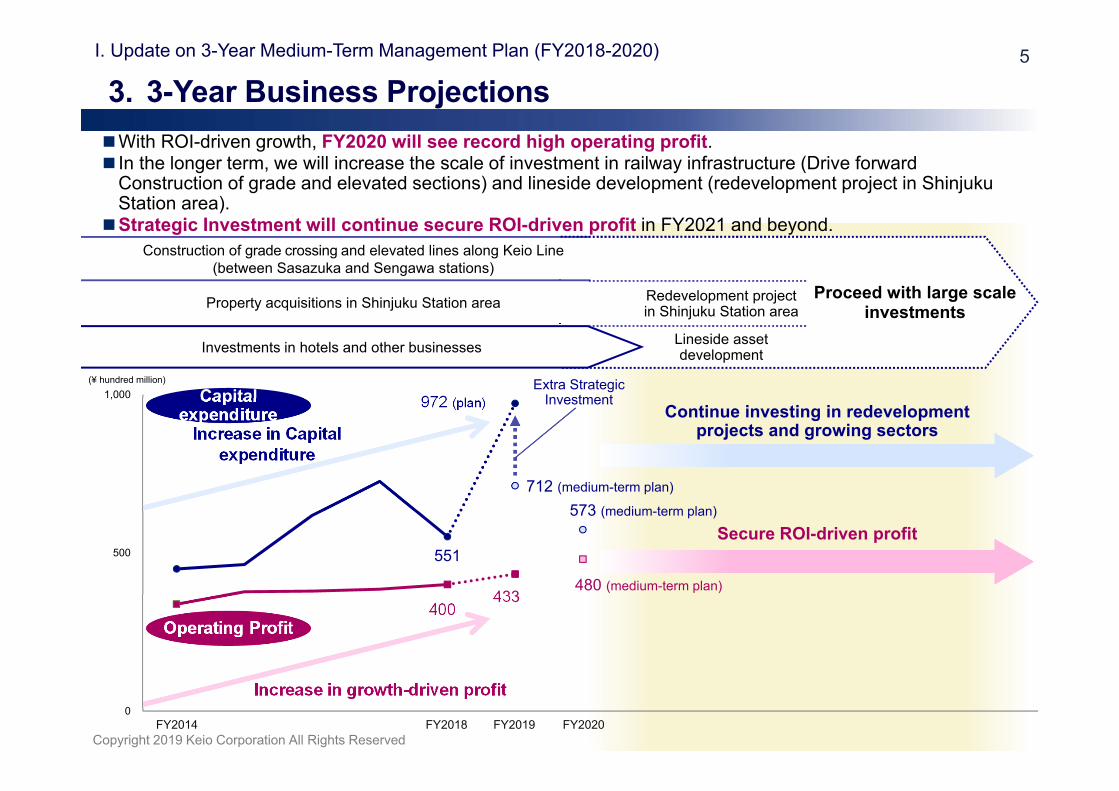
■With ROI-driven growth, FY2020 will see record high operating profit.■In the longer term, we will increase the scale of investment in railway infrastructure (Drive forward
Construction of grade and elevated sections) and lineside development (redevelopment project in Shinjuku Station area).
■Strategic Investment will continue secure ROI-driven profit in FY2021 and beyond.
551
972 (plan)
712 (medium-term plan)
573 (medium-term plan)
400433
480 (medium-term plan)
0
500
1,000
Increase in Capital expenditure
(¥ hundred million)
Capital expenditure
Operating Profit
Property acquisitions in Shinjuku Station area
Construction of grade crossing and elevated lines along Keio Line (between Sasazuka and Sengawa stations)
Redevelopment project in Shinjuku Station area
Increase in growth-driven profit
Extra Strategic Investment
FY2014 FY2018 FY2019 FY2020
Continue investing in redevelopment projects and growing sectors
Secure ROI-driven profit
Investments in hotels and other businesses
Proceed with large scale investments
Lineside asset development
3. 3-Year Business Projections

6
Copyright 2019 Keio Corporation All Rights Reserved
I. Update on 3-Year Medium-Term Management Plan (FY2018-2020)
390 158 162
(うち、鉄道事業投資 623)
■In FY2018, a total of 711 hmy was invested (549 hmy in regular investments, and 162 hmy in strategic investment).■In FY2019, a total of 1,161 hmy will be invested (including in hotels, inbound tourist services, and lineside
assets).■In view of steady investment performance, we raised the level of expenditure, aiming for further ROI in the
medium to long term.
FY2018 investments
Total investment includes real-estate and lending investments.Strategic InvestmentOrdinary investment: 549
Total: 711 hmy(CapEx: 551 hmy)
513
529
206
184
203
446
Initial investment budget for FY2019
Planned investment for FY2019
Strategic InvestmentOrdinary investment: 720
Total: 923 hmy(CapEx: 712 hmy)
Total: 1,161 hmy(CapEx: 972 hmy)
+16 +243 +238 hmy
Real-estate:
Real-estate:
Real-estate:
Ordinary investment: 714 Strategic Investment
-21
(Units: ¥ hundred million)
(Units: ¥ hundred million)
(Railways: 197)
(Railways: 307)
(Railways: 297)
4. Investments

7
Copyright 2019 Keio Corporation All Rights Reserved
I. Update on 3-Year Medium-Term Management Plan (FY2018-2020)
■In FY2019, extra investment will result in a net outflow.■We will continue to base shareholder dividends upon stable profits.■The D/E ratio will remain at the 1.0 level, among the best in the industry.
Operating cash flowFY2019: 638 hmy(FY2018: 606 hmy)
Free (operating + investing) cash flow FY2019: -259 hmy(FY2018: 130 hmy)
Investing cash flowFY2019: -898 hmy(FY2018: -476 hmy)
Int. bearing debtFY2019: 129 hmy(FY2018: -138 hmy) Shareholder dividend
FY2019: -61 hmy(FY2018: -61 hmy)
-553 -659 -712-476
-898-593
542 494 627 606 638 693
-10 -164 -85
130
-259
100
-1,000
-500
0
500
1,000
FY2015 FY2016 FY2017 FY2018 FY2019 (plan)
FY2020 (medium-term
plan)
Operating cash flowInvesting cash flowFree cash flow
(¥ hundred million) Free (operating + investing) cash flow
Reference
Other cash flows
D/E ratio 1.1 1.0 1.0 0.9 0.9 1.0
5. 3-Year Cash Flow Projections
8
Copyright 2019 Keio Corporation All Rights Reserved
I. Update on 3-Year Medium-Term Management Plan (FY2018-2020)
37.5
47.5
30.0
50.0
40.0
30.0
20.0
10.0
0.0(FY)
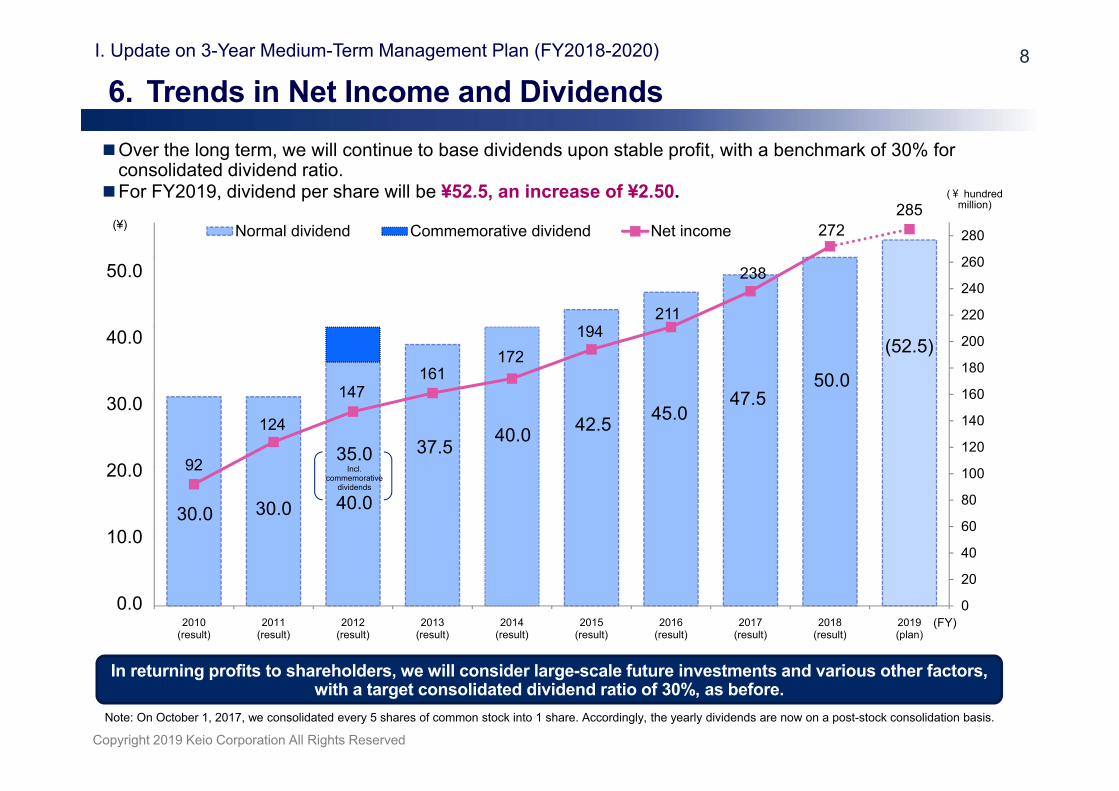
■Over the long term, we will continue to base dividends upon stable profit, with a benchmark of 30% for consolidated dividend ratio.
■For FY2019, dividend per share will be ¥52.5, an increase of ¥2.50.(¥)
(¥ hundred million)
In returning profits to shareholders, we will consider large-scale future investments and various other factors, with a target consolidated dividend ratio of 30%, as before.
Note: On October 1, 2017, we consolidated every 5 shares of common stock into 1 share. Accordingly, the yearly dividends are now on a post-stock consolidation basis.
6. Trends in Net Income and Dividends
30.0
35.0 Incl.
commemorative dividends
40.0
40.0 42.5 45.0
50.0
92
124
147 161
172194
211
238
272 285
0
20
40
60
80
100
120
140
160
180
200
220
240
260
280
0.0
2.0
4.0
6.0
8.0
10.0
2010(result)
2011(result)
2012(result)
2013(result)
2014(result)
2015(result)
2016(result)
2017(result)
2018(result)
2019(plan)
Normal dividend Commemorative dividend Net income
30.0
37.5
47.5
(52.5)

9
Copyright 2019 Keio Corporation All Rights Reserved
Memo

10
Copyright 2019 Keio Corporation All Rights Reserved
Managing Director Shunji Ito (in Charge of Finance and Information Disclosure)
II. FY2018 Earnings and FY2019 Forecasts
1. Management Goals Status Report2. Operating Revenues / Operating Profit Change Factors
(FY2018 Earnings Report)3. Operating Revenues / Operating Profit Change Factors
(FY2019 Earnings Forecasts)4. Railways5. Merchandise Sales6. Real Estate7. Hotels8. Other Policies9. Investment Plan10. Corporate Governance
11
Copyright 2019 Keio Corporation All Rights Reserved
II. FY2018 Earnings and FY2019 Forecasts
Reference Indicators
FY2018 result YOY change
Change from forecast FY2019 forecast YOY
changeChange from initial target
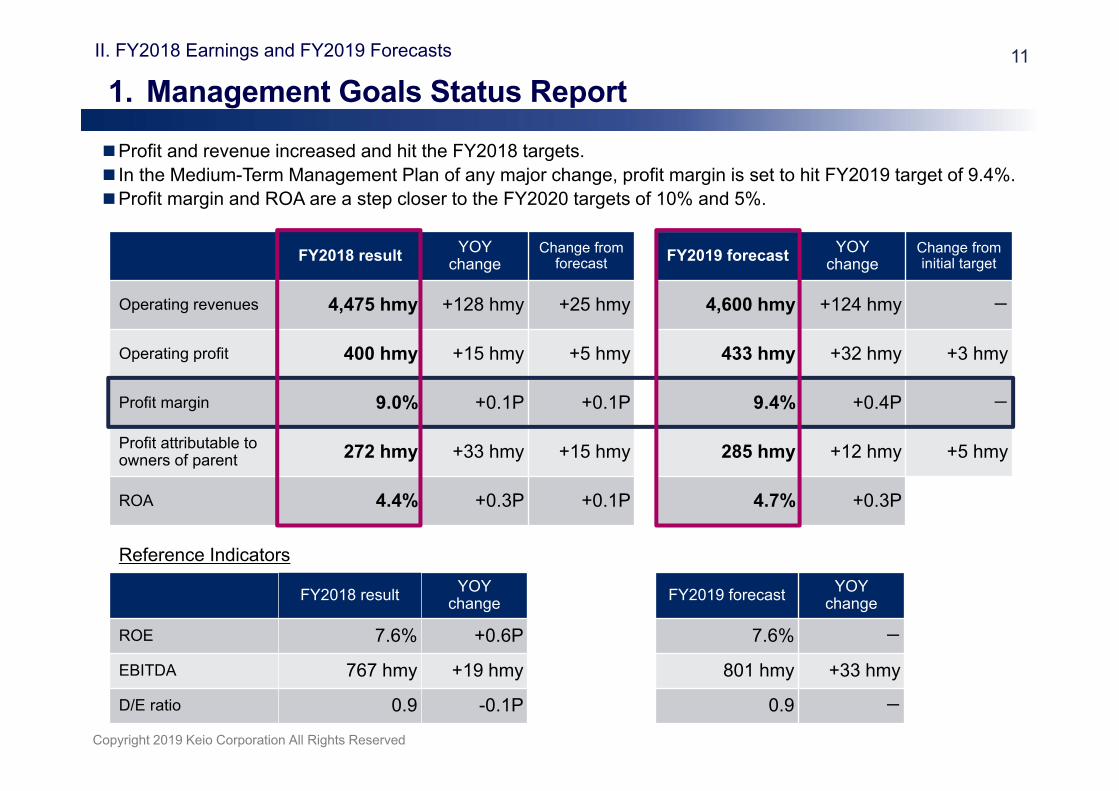
Operating revenues 4,475 hmy +128 hmy +25 hmy 4,600 hmy +124 hmy ー
Operating profit 400 hmy +15 hmy +5 hmy 433 hmy +32 hmy +3 hmy
Profit margin 9.0% +0.1P +0.1P 9.4% +0.4P ー
Profit attributable to owners of parent 272 hmy +33 hmy +15 hmy 285 hmy +12 hmy +5 hmy
ROA 4.4% +0.3P +0.1P 4.7% +0.3P
■Profit and revenue increased and hit the FY2018 targets.■In the Medium-Term Management Plan of any major change, profit margin is set to hit FY2019 target of 9.4%.■Profit margin and ROA are a step closer to the FY2020 targets of 10% and 5%.
FY2018 result YOY change FY2019 forecast YOY
change
ROE 7.6% +0.6P 7.6% ーEBITDA 767 hmy +19 hmy 801 hmy +33 hmy
D/E ratio 0.9 -0.1P 0.9 ー
1. Management Goals Status Report

12
Copyright 2019 Keio Corporation All Rights Reserved
II. FY2018 Earnings and FY2019 Forecasts
(Units: ¥ hundred million)
Operating revenues
Operating Profit
(Units: ¥ hundred million)
405,338(+4,265)396,860(+6,387)
-7
-0
Higher revenues from retail stores, department stores, and shopping centers
Higher revenues from building maintenance and construction
Higher revenues from hotels
Higher revenues from development for selling by lots and land and building leasing
Higher revenues from bus services and railways
Lower profit from advertising services and hotels
Lower profit from land and building leasing
Higher profit from railways
Lower profit from construction
Higher profit from shopping centers
4,346
4,475 (+128)
385
400 (+15)
+54
+41
+5
+8
+25
+11
+10
-1
-2
-2
■Operating revenue rose 128 hmy, with each segment posting a revenue increase. ■Operating profit rose 15 hmy, with the main increases in transportation and merchandise sales.
2. Operating Revenues / Operating Profit Change Factors(FY2018 Earnings Report)
FY2017 Results
Real Estate
Merchandise Sales
Leisure
Transportation
Other Businesses
Elimination
FY2018 result
FY2017 Results
Transportation
Merchandise Sales
Leisure
Other Businesses
Real Estate
Elimination
FY2018 result

13
Copyright 2019 Keio Corporation All Rights Reserved
II. FY2018 Earnings and FY2019 Forecasts
(Units: ¥ hundred million)
Operating Revenues
Operating Profit
(Units: ¥ hundred million)
405,338(+4,265)396,860(+6,387)
+6
+0
Higher revenues from department stores and retail stores
Higher revenues from construction
Higher revenues from hotels
Higher revenues from railways
Higher profit from hotels
4,475
4,600 (+124)
400
433 (+32)
+47
+26
+2
+20
+21
+11
+6
+1
+5
+6
■Operating revenue will rise 124 hmy, with each segment posting a revenue increase.■Operating profit will rise 32 hmy, with each segment posting a profit increase.
Higher revenues from development for selling by lots and land and building leasing
Higher profit from development for selling by lots and land and building leasing
3. Operating Revenues / Operating Profit Change Factors(FY2019 Earnings Forecasts)
FY2018 Results
Real Estate
Other Businesses
Merchandise Sales
Leisure
Transportation
Elimination
FY2019 Plan
FY2018 Results
Leisure
Real Estate
Other Businesses
Transportation
Merchandise Sales
Elimination
FY2019 Plan

14
Copyright 2019 Keio Corporation All Rights Reserved
II. FY2018 Earnings and FY2019 Forecasts
■Passengers transported increased thanks to better improvement in employment conditions and larger line-side populations.
■Operating revenue increased. Although passenger revenue was down due to a lower fare surcharge,this was offset by increased income from the Keio Liner (reserved seat) surcharge.
FY2018 results Y/y change Change from target
FY2019target Y/y change Change from
initial target
Passengers Transported
Commuter-Pass 402,729 + 1.6% + 1.0% 406,065 + 0.8% ―
Non-Commuter-Pass 275,259 + 0.5% - 0.0% 276,830 + 0.6% ―
Total 677,988 + 1.2% + 0.6% 682,895 + 0.7% + 0.5%
Passenger revenue
Commuter-Pass 35,852 + 0.2% + 1.3% 36,008 + 0.4% ―
Non-Commuter-Pass 46,407 - 0.7% + 0.2% 46,425 + 0.0% ―
Total 82,259 - 0.3% + 0.7% 82,433 + 0.2% + 0.5%Railways Operating Revenues
(includes reserved-seat surcharge)
86,179 + 0.1% + 0.7% 86,662 + 0.6% + 0.7%
(1) FY2018 Report, FY2019 Forecasts
(Units: Thousands of people, ¥ million)
FY2018 results
■Despite a decrease in fare surcharge scheduled for October, passenger revenue will be driven up by an increased passengers transported.
■ Operating revenue will increase. Income from the reserved seating surcharge will increase as Keio Liner services expand.
FY2019 forecasts
4. Railways Strengthen profitability of existing businesses

15
Copyright 2019 Keio Corporation All Rights Reserved
II. FY2018 Earnings and FY2019 Forecasts
(2) Keio Liner’s expanded services
(3) Drive forward Construction of grade and elevated sections along Keio Line
■In FY2018, we started construction in part of the work zone.■In FY2019, we will continue obtaining land in the work zone,
developing construction plans, and laying foundations for elevated sections.
Feb 2018
Keio Liner launched (evening service only)
Nov 2018
Feb 2019
2019 and beyond
Mt. Takao special reserved service launched
Introduce further services
Lower fare surcharge for Sagamihara Line
Morning services launched
■Surcharge lowered in March 2018FY2018: 12 hmy less revenue
■Further decrease in October 2019FY2019: 4 hmy less revenue
■These decreases will scarcely affect performance in this 3-year period (their impact was taken into account when formulating the 3-year plan)
■In FY2018, Keio Liner saw strong (evening) weekday ridership, at over 80%.■A morning service to Shinjuku begun in February 2019, bringing the weekday ridership to over 90%.■Revenue from reserved seating was 4 hmy in FY2018. The target for FY2019 is 6 hmy.
Construction around Meidaimae Station
・ Services per day: 10 Shinjuku → Keio Hachioji ×5Shinjuku → Hashimoto ×5
・Morning services: 4Keio Hachioji → Shinjuku ×2 Hashimoto → Shinjuku ×2・ Three more evening services at weekends
4. Railways Strengthen profitability of existing businesses

16
Copyright 2019 Keio Corporation All Rights Reserved
II. FY2018 Earnings and FY2019 Forecasts
(1) Merchandise Sales Performance
(2) Renovation of Keio Department Store (Shinjuku)
FY2018 results
FY2019target
Department stores +1.3% +2.2%
Retail stores +3.8% +2.0%
(supermarkets) +4.4% +2.5%
Shopping centers +6.7% -0.2%
(existing stores*) -0.3%* Existing stores = Stores opened before FY2017
■Department stores: There were strong cosmetic sales underpinned by inbound tourist demand, and the share of tax-free sales increased.
■Retail stores, shopping centers: Locations that opened in FY2017 contributed to revenue in FY2018. ■In FY2019, operating revenue will be hit slightly by renovation work in shopping centers.
YOY change in operating revenues
■Each floor is being renovated incrementally to attract more, and a wider variety of, customers.
■The renovation work in FY2018 included the cosmetics area (floor 1) and food area (lower level).
■The renovation work in April 2019 will include the cosmetics area. New outlets will be introduced too.
Floor FY2018 Major rennovations
FY2019 Major rennovations
8 Heartful Plaza
6 Jewelry, watches
4 Handbags Ladieswear
3 Ladieswear Ladieswear
2 Accessories
1 Cosmetics CosmeticsLower Level Confectionery, deli DeliCosmetics area (floor 1)
Trie Keio Chofu (opened in September 2017)
5. Merchandise Sales Strengthen profitability of existing businesses

17
Copyright 2019 Keio Corporation All Rights Reserved
II. FY2018 Earnings and FY2019 Forecasts
(1) Leasing and Sales PerformanceEstablish revenue base in growth fields
347 354 365
92 90 94
0
50
100
0
100
200
300
400
500
FY2017 FY2018 FY2019(plan)
Operating revenues(left axis)
Operating profit(right axis)
Performance of land and building leasing(¥ hundred million)
164209
259
10 1221
0
50
100
0
100
200
300
400
500
FY2017 FY2018 FY2019(plan)
Operating revenues(left axis)
Operating profit(right axis)
Performance of development for selling by lots(¥ hundred million)
(¥ hundred million)
(¥ hundred million)
■In FY2018, earnings from development for selling by lots rose markedly. Much of the sales increase was in for-investment condos and renovated properties.
■In FY2019, segment earnings will increase with improved renovated apartment sales and the full-year operation of building leasing.
■We will make ongoing efforts to improve the earning power of existing assets. We will also promote brand recognition of our high-end renovated homes business among wealthy demographics.
6. Real Estate Strengthen profitability of existing businesses

18
Copyright 2019 Keio Corporation All Rights Reserved
II. FY2018 Earnings and FY2019 Forecasts
(2) Strategic Property Acquisitions■In November 2018, we acquired part of Opus Arisugawa Terrace and Residence.■The “Residence” consists of high-end units for lease. The acquisition will help increase our leasing earnings.■The “Terrace” consists of second-hand units. The acquisition will help increase our profile in the
renovated apartment market. The renovation work is performed by ReBITA’s “R100 Tokyo” business, which specializes in renovating city center apartments over 100 m2 in size.
Residence TerraceAverage
apartment size 90 m2 210 m2
Layouts Layouts range from studio apartments to two-bedroom apartments
Layouts range from two-bedroom apartments to four-bedroom apartments
No. of units 40 33 (condo units)
Accounting Recorded under land and building leasing from FY2018
Will be recorded under development for selling by lots in FY2018–2021
Opus Arisugawa Terrace and Residence Location: Minami-Azabu, Minato-ku, TokyoCompleted: 2004
(3) Kario Sasazuka Terrace■Kario Sasazuka Terrace consists of apartments for medium or long term stays. The property opened in March
2019.■The apartments cater to inbound visitors and Japan’s increasingly diverse accommodation market.■The apartments emphasize connectivity with the local neighborhood, encouraging residents (many of whom
are inbound visitors) to use Keio rail lines and contribute to the local economy.Kario Sasazuka Terrace
Location Floors 4 to 6 of Sasazuka Terrace, 1 minute from Keio Sasazuka Station(Sasazuka Terrace was originally built in 1971 and renovated in November 2018)
No. of units 18 (12 two-bedroom apartments, 5 studio apartments with kitchen, 1 studio apartment)
6. Real Estate Strengthen profitability of existing businesses
Establish revenue base in growth fields
19
Copyright 2019 Keio Corporation All Rights Reserved
II. FY2018 Earnings and FY2019 Forecasts
(1) Business Expansion
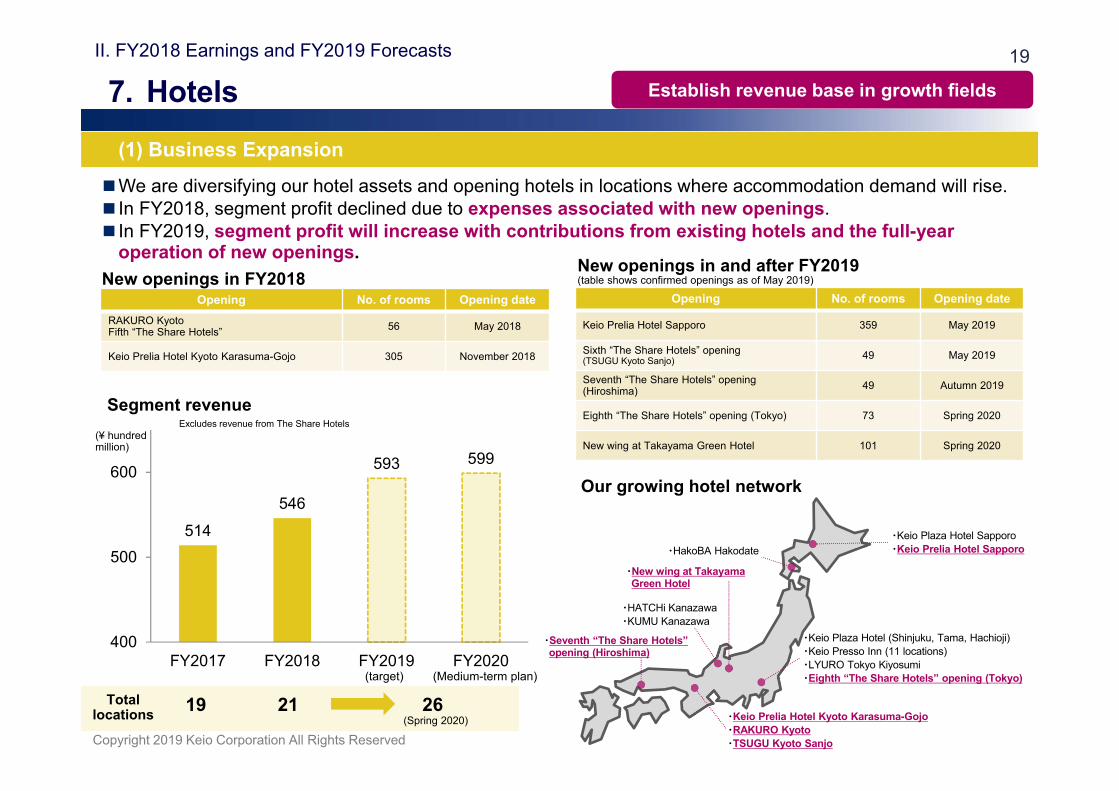
■We are diversifying our hotel assets and opening hotels in locations where accommodation demand will rise.■In FY2018, segment profit declined due to expenses associated with new openings.■In FY2019, segment profit will increase with contributions from existing hotels and the full-year
operation of new openings.
514546
593 599
400
500
600
FY2017 FY2018 FY2019 FY2020
Opening No. of rooms Opening date
Keio Prelia Hotel Sapporo 359 May 2019
Sixth “The Share Hotels” opening (TSUGU Kyoto Sanjo) 49 May 2019
Seventh “The Share Hotels” opening (Hiroshima) 49 Autumn 2019
Eighth “The Share Hotels” opening (Tokyo) 73 Spring 2020
New wing at Takayama Green Hotel 101 Spring 2020
Segment revenue
Total locations 19 21 26
(target) (Medium-term plan)
Opening No. of rooms Opening dateRAKURO KyotoFifth “The Share Hotels” 56 May 2018
Keio Prelia Hotel Kyoto Karasuma-Gojo 305 November 2018
(Spring 2020)
New openings in FY2018New openings in and after FY2019(table shows confirmed openings as of May 2019)
・Keio Plaza Hotel (Shinjuku, Tama, Hachioji) ・Keio Presso Inn (11 locations) ・LYURO Tokyo Kiyosumi・Eighth “The Share Hotels” opening (Tokyo)
・Keio Plaza Hotel Sapporo・Keio Prelia Hotel Sapporo・HakoBA Hakodate
・HATCHi Kanazawa・KUMU Kanazawa
・New wing at Takayama Green Hotel
・Keio Prelia Hotel Kyoto Karasuma-Gojo・RAKURO Kyoto・TSUGU Kyoto Sanjo
・Seventh “The Share Hotels” opening (Hiroshima)
Our growing hotel network
Excludes revenue from The Share Hotels(¥ hundred million)
7. Hotels Establish revenue base in growth fields
20
Copyright 2019 Keio Corporation All Rights Reserved
II. FY2018 Earnings and FY2019 Forecasts
100.0%
108.1% 109.1%
100.0
110.0
120.0
0
50
100
FY2017 FY2018 FY2019
Sales(existing locations)
Sales (locationsopened in FY2017)
Average roomunit price
(2) Strengthen profitability of existing hotels
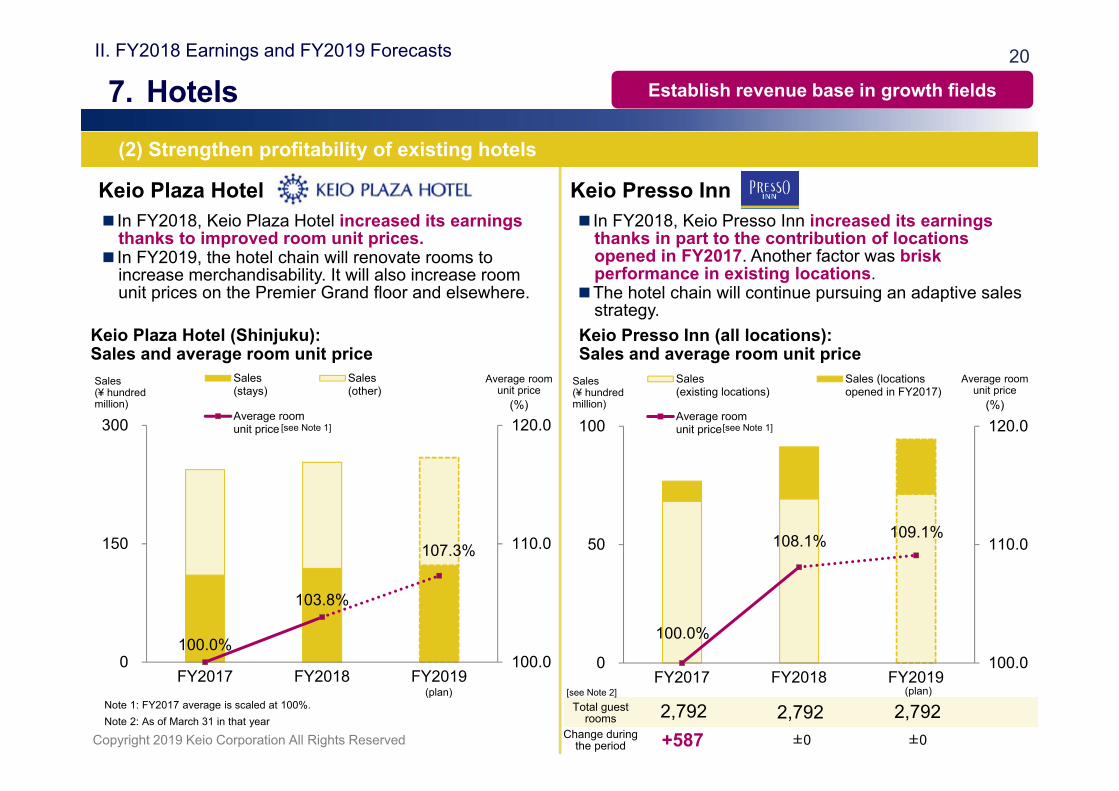
■In FY2018, Keio Plaza Hotel increased its earnings thanks to improved room unit prices.
■In FY2019, the hotel chain will renovate rooms to increase merchandisability. It will also increase room unit prices on the Premier Grand floor and elsewhere.
100.0%
103.8%
107.3%
100.0
110.0
120.0
0
150
300
FY2017 FY2018 FY2019
Sales(stays)
Sales(other)
Average roomunit price
Keio Plaza Hotel
Average room unit price
Keio Plaza Hotel (Shinjuku): Sales and average room unit priceSales (¥ hundred million)
Keio Presso Inn (all locations): Sales and average room unit price
■In FY2018, Keio Presso Inn increased its earnings thanks in part to the contribution of locations opened in FY2017. Another factor was brisk performance in existing locations.
■The hotel chain will continue pursuing an adaptive sales strategy.
Keio Presso Inn
(plan)
Change during the period
Note 2: As of March 31 in that year
Average room unit price
+587
Note 1: FY2017 average is scaled at 100%.
(%) (%)
Total guest rooms 2,792 2,792 2,792
±0 ±0
Sales (¥ hundred million)
7. Hotels Establish revenue base in growth fields
[see Note 1] [see Note 1]
(plan)[see Note 2]
21
Copyright 2019 Keio Corporation All Rights Reserved
II. FY2018 Earnings and FY2019 Forecasts
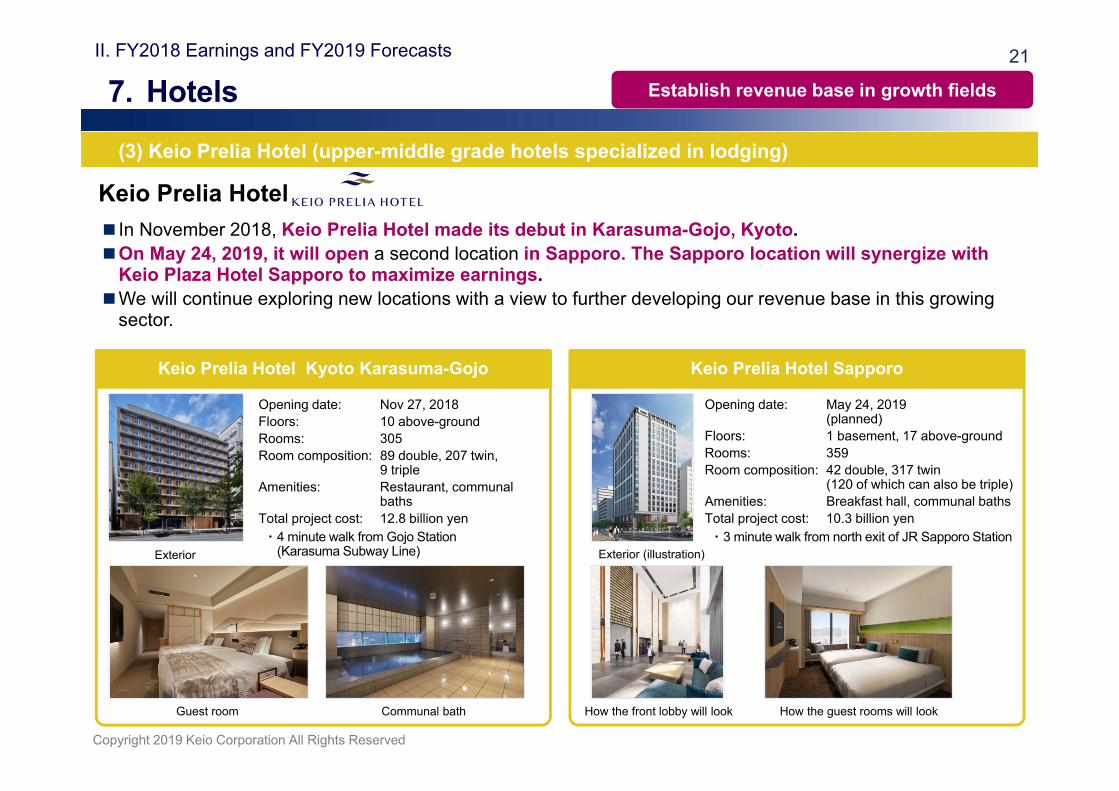
(3) Keio Prelia Hotel (upper-middle grade hotels specialized in lodging)
Keio Prelia Hotel■In November 2018, Keio Prelia Hotel made its debut in Karasuma-Gojo, Kyoto.■On May 24, 2019, it will open a second location in Sapporo. The Sapporo location will synergize with
Keio Plaza Hotel Sapporo to maximize earnings.■We will continue exploring new locations with a view to further developing our revenue base in this growing
sector.
How the front lobby will look
Keio Prelia Hotel Kyoto Karasuma-Gojo
Exterior
Opening date: Nov 27, 2018Floors: 10 above-groundRooms: 305Room composition: 89 double, 207 twin,
9 triple Amenities: Restaurant, communal
bathsTotal project cost: 12.8 billion yen ・ 4 minute walk from Gojo Station
(Karasuma Subway Line)
Keio Prelia Hotel Sapporo
Opening date: May 24, 2019(planned)
Floors: 1 basement, 17 above-groundRooms: 359Room composition: 42 double, 317 twin
(120 of which can also be triple)Amenities: Breakfast hall, communal bathsTotal project cost: 10.3 billion yen・ 3 minute walk from north exit of JR Sapporo Station
Exterior (illustration)
How the guest rooms will lookGuest room Communal bath
7. Hotels Establish revenue base in growth fields

22
Copyright 2019 Keio Corporation All Rights Reserved
II. FY2018 Earnings and FY2019 Forecasts
(1) Preparations for the 2019 Rugby World Cup, etc.
These sliding platform doors went into service on platform 2 of Tobitakyu Station in March 2019
■We are drastically reforming our taxi services by selecting and concentrating business units and operation areas.
■In March 2019, we ended taxi services in the Kawasaki & Yokohama area and transferred the entire stock of Keio Jidousha Keihin outside the group.
■In the Merchandise Sales segment, we have consolidated under-performing stores.
(2) Selection and concentration of businesses
■To help ensure the success of the 2019 Rugby World Cup (September – November 2019) and other international sporting events, we are enhancing the safety, convenience, and stability of our rail services.
■In FY2018, we upgraded Tobitakyu Station, the closest station to the stadium, by installing an extra elevator and refurbishing the toilets. We will make more improvements to the station in FY2019, including the installation of platform edge doors.
A new elevator opened at Tobitakyu Station in March 2019
8. Other Policies Strengthen profitability of existing businesses
Establish revenue base in growth fields
23
Copyright 2019 Keio Corporation All Rights Reserved
II. FY2018 Earnings and FY2019 Forecasts
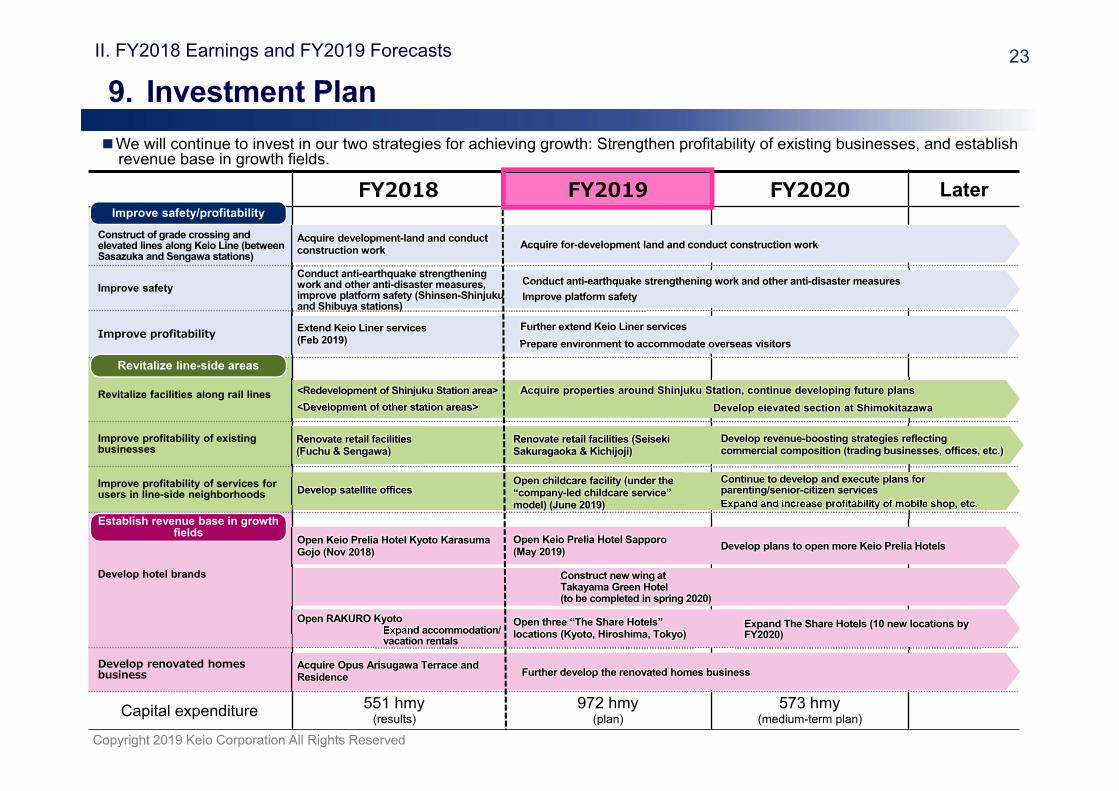
FY2018 FY2019 FY2020 Later
Construct of grade crossing and elevated lines along Keio Line (between Sasazuka and Sengawa stations)
Improve safety
Improve profitability
Revitalize facilities along rail lines
Improve profitability of existing businesses
Improve profitability of services for users in line-side neighborhoods
Develop hotel brands
Develop renovated homes business
Improve safety/profitability
Establish revenue base in growth fields
Revitalize line-side areas
Expand accommodation/vacation rentals
Open RAKURO Kyoto
Open Keio Prelia Hotel Kyoto Karasuma Gojo (Nov 2018)
Expand The Share Hotels (10 new locations by FY2020)
Develop plans to open more Keio Prelia HotelsOpen Keio Prelia Hotel Sapporo (May 2019)
<Development of other station areas> Develop elevated section at Shimokitazawa
Develop satellite offices
Capital expenditure 551 hmy 972 hmy 573 hmy
Acquire development-land and conduct construction work
Conduct anti-earthquake strengthening work and other anti-disaster measures, improve platform safety (Shinsen-Shinjuku and Shibuya stations)
Extend Keio Liner services (Feb 2019)
Renovate retail facilities (Fuchu & Sengawa)
■We will continue to invest in our two strategies for achieving growth: Strengthen profitability of existing businesses, and establish revenue base in growth fields.
Open three “The Share Hotels” locations (Kyoto, Hiroshima, Tokyo)
Further develop the renovated homes business
Expand and increase profitability of mobile shop, etc.
Continue to develop and execute plans for parenting/senior-citizen services
Develop revenue-boosting strategies reflecting commercial composition (trading businesses, offices, etc.)
Prepare environment to accommodate overseas visitors
(results) (plan) (medium-term plan)
Acquire for-development land and conduct construction work
Renovate retail facilities (Seiseki Sakuragaoka & Kichijoji)
Further extend Keio Liner services
<Redevelopment of Shinjuku Station area>
Open childcare facility (under the “company-led childcare service” model) (June 2019)
Construct new wing at Takayama Green Hotel (to be completed in spring 2020)
Acquire properties around Shinjuku Station, continue developing future plans
Conduct anti-earthquake strengthening work and other anti-disaster measuresImprove platform safety
Acquire Opus Arisugawa Terrace and Residence
9. Investment Plan

24
Copyright 2019 Keio Corporation All Rights Reserved
II. FY2018 Earnings and FY2019 Forecasts
■We are continuing to strengthen supervision of the group by further integrating Keio Corporation’s audit and supervisory functions with that of group companies.
10. Corporate Governance
Corporate Governance
Shareholders Meeting
Business unitsGeneral administration
departmentsGroup companies
Audits
Audit & Supervisory Board
(Outside Audit & Supervisory Board
members)
Audits Board of Directors(Outside Directors)
Special Directors
Compliance Committee
Disclosures Committee
Audit & Supervisory Board Office
Nomination and Compensation
Committee(Outside Directors)
Auditors/supervisors in group companies
Executive Committee
Group Management Council President
Internal Control Committees
Audits
Risk Control Committee
Governance CommitteeOutside DirectorsOutside Audit &
Supervisory Board members
Accounting Auditor
Internal Audit Departm
ent
25
Copyright 2019 Keio Corporation All Rights Reserved
Memo

26
Copyright 2019 Keio Corporation All Rights Reserved
Reference 1: Detailed Earnings Report for FY2018
1. Consolidated Statements of Income (Full-Year FY2018 Earnings)
2. Ordinary Profit / Profit Change Factors (vs. PY) (Full-Year FY2018 Earnings)
3. Segment Composition
4. Segment Information: Transportation
5. Segment Information: Merchandise Sales
6. Segment Information: Real Estate
7. Segment Information: Leisure
8. Segment Information: Other Businesses
9. Consolidated Balance Sheets
10. Consolidated Statements of Cash Flows

27
Copyright 2019 Keio Corporation All Rights Reserved
Reference 1: Detailed Earnings Report for FY2018
Note: EBITDA = operating profit + depreciation and amortization + amortization of goodwill
(Units:¥ hundred million)
■Operating revenues rose year-on-year to 4,475 hmy, thanks to brisk performance in the development for selling by lots and hotels businesses. Operating profit increased to 400 hmy, and profit attributable to owners of parent reached a record high of 272 hmy.
■Profit margin and ROA were as anticipated, at 9.0% and 4.4%.■We continued investing in ongoing projects from the previous 3-year plan.
1. Consolidated Statements of Income (Full-Year FY2018 Earnings)
FY2017 result
FY2018 result Change (%)
FY2018plan
(as announced on April 27, 2018)
Difference from forecast (%)
Operating Revenues 4,346 4,475 128 ( 2.9) 4,450 25 ( 0.6)
Operating Profit 385 400 15 ( 4.0) 395 5 ( 1.5)
Profit Margin 8.9 9.0 0.1P - 8.9 0.1P -
Ordinary Profit 357 392 35 ( 9.9) 378 14 ( 3.9)Profit Attributable to Owners of Parent 238 272 33 ( 13.9) 257 15 ( 5.9)
EBITDA 748 767 19 ( 2.6)Depreciation and Amortization 358 362 3 ( 1.1)
Capital Expenditures 726 551 -174 ( -24.1)

28
Copyright 2019 Keio Corporation All Rights Reserved
Reference 1: Detailed Earnings Report for FY2018
Ordinary profit
Profit attributable to owners of parent
(Units: ¥ hundred million)
(Units: ¥ hundred million)
+15
+17
+0
+1
+35
+11
-13
+0
357
392 (+35)
238
272 (+33)
2. Ordinary Profit / Profit Change Factors (vs. PY) (Full-Year FY2018 Earnings)
FY2017 Result
Change in operating profit
Change in financial revenue
Change in non-operating miscellaneous revenue
Change in equity earnings of affiliates
FY2018 Result
FY2017 Result
Change in ordinary profit
Change in extraordinary profit and loss
Change in income taxes
Change in non-controlling interests
FY2018 Result

29
Copyright 2019 Keio Corporation All Rights Reserved
Reference 1: Detailed Earnings Report for FY2018
1,322
1,664 500
804
651
147
5194
69
52
FY2018(Units: ¥ hundred
million)(Units: ¥ hundred
million)
Consolidated
Operating revenues
Operating profit
4,475hundred
million yen
400hundred
million yen
(26.7%)
(33.7%)
(10.1%)
(16.3%)
(13.2%) (12.7%)
(35.4%)
(12.4%)(22.7%)
(16.8%)
Transportation
Keio CorporationKeio Dentetsu Bus
Keio Jidousha13 others
Merchandise Sales
Keio Department StoreKeio Store
Keio Shoseki HanbaiFive others
Real Estate
Keio CorporationKeio Realty & Development
ReBITAThree others
Leisure
Keio Plaza HotelKeio Travel Agency
Keio AgencySix others
Other Businesses
Keio Setsubi ServiceKeio Juuki Seibi
Keio ConstructionNine others
48 companies as of the end of Mar, 2019(Keio Corporation and Keio Juuki Seibi overlap multiple business segments)
Note: Segment figures include intersegment amounts and ratios.
3. Segment Composition

30
Copyright 2019 Keio Corporation All Rights Reserved
Reference 1: Detailed Earnings Report for FY2018
■ Railways: Passengers transported increased thanks to better employment rates and larger line-side populations. Operating revenues increased too; although passenger revenue was down due to a lower fare surcharge, this was offset by increased income from the Keio Liner (reserved seat) surcharge.
■ Bus services: Earnings improved in local voutes and expressways (expressway) services
(Units:¥ hundred million)
FY2017 result
FY2018 result Change (%) Change
factorsFY2018 plan
(as announced on April 27, 2018)
Difference from forecast (%)
(Railways) 860 861 1 ( 0.1) See next page 855 5 ( 0.7)
(Bus Services) 356 365 8 ( 2.5) 358 7 ( 2.1)
(Taxi Services) 129 130 0 ( 0.7) 131 -0 ( -0.6)
(Other) 25 26 0 ( 1.8) 25 0 ( 3.3)
(Elimination) -58 -61 -2 - -58 -2 -Operating Revenues 1,313 1,322 8 ( 0.6) 1,311 11 ( 0.9)
(Railways) 106 116 9 ( 9.3) 109 6 ( 6.0)
(Bus Services) 23 25 2 ( 9.6) 16 8 ( 53.8)
Operating Profit 135 147 11 ( 8.8) 136 11 ( 8.2)
Profit Margin 10.3 11.1 0.8P - 10.4 0.7P -EBITDA 368 379 10 ( 3.0)Depreciation and Amortization 233 232 -1 ( -0.4)
Capital Expenditures 328 243 -84 ( -25.8)
4. Segment Information: Transportation

31
Copyright 2019 Keio Corporation All Rights Reserved
Reference 1: Detailed Earnings Report for FY2018
FY2017 result
FY2018 result Change (%) Change factors
Passengers Transported
Commuter-Pass 396,434 402,729 6,295 ( 1.6)
(Business) 302,563 309,170 6,607 ( 2.2)
(Student) 93,871 93,559 -312 ( -0.3)
Non-Commuter-Pass 273,808 275,259 1,451 ( 0.5)
Total 670,242 677,988 7,746 ( 1.2)
Passenger Revenue
Commuter-Pass 35,782 35,852 69 ( 0.2)
(Business) 32,099 32,264 165 ( 0.5)
(Student) 3,683 3,587 -96 ( -2.6)
Non-Commuter-Pass 46,751 46,407 -344 ( -0.7)
Total 82,534 82,259 -275 ( -0.3)
(Units: Thousands of people, ¥ million)
4. Segment Information: Transportation

32
Copyright 2019 Keio Corporation All Rights Reserved
Reference 1: Detailed Earnings Report for FY2018
■ Department stores: Earnings increased thanks to favorable inbound sales.■ Retail stores, shopping centers: Earnings increased thanks to the contribution of locations opened last year.
(Units:¥ hundred million)
FY2017 result
FY2018 result Change (%) Change
factorsFY2018 plan
(as announced on April 27, 2018)
Difference from forecast (%)
(Department Stores) 883 895 11 ( 1.3) 907 -12 ( -1.3)(Retail Stores) 484 503 18 ( 3.8) 505 -2 ( -0.4)(Retail Stores for Books) 66 64 -1 ( -2.5) 60 4 ( 7.2)
(Shopping Centers) 134 143 9 ( 6.7) 141 2 ( 1.6)
(Other) 116 121 5 ( 4.4) 121 -0 ( -0.3)
(Elimination) -62 -64 -1 - -70 6 -Operating Revenues 1,622 1,664 41 ( 2.6) 1,665 -0 ( -0.0)
(Department Stores) 10 11 0 ( 8.7) 12 -1 ( -13.3)(Retail Stores) 4 6 1 ( 29.7) 3 2 ( 52.8)
Operating Profit 41 51 10 ( 24.9) 46 5 ( 11.7)Profit Margin 2.5 3.1 0.6P - 2.8 0.3P -EBITDA 80 92 11 ( 14.8)Depreciation and Amortization 39 41 1 ( 4.2)Capital Expenditures 117 31 -86 ( -72.9)
5. Segment Information: Merchandise Sales

33
Copyright 2019 Keio Corporation All Rights Reserved
Reference 1: Detailed Earnings Report for FY2018
■ Land and Building Leasing: Earnings increased thanks to a rise in building leasing.■ Development for Selling by Lots: Earnings increased thanks to higher sales of for-investment condos and renovations of sales
spaces.■ The segment’s operating profit was negatively affected by higher operating expenses in Land and Building Leasing.
(Units:¥ hundred million)
6. Segment Information: Real Estate
FY2017 result
FY2018 result Change (%) Change
FactorsFY2018 plan
(as announced on April 27, 2018)
Difference from forecast (%)
(Land and Building Leasing) 347 354 7 ( 2.2) 353 1 ( 0.4)(Development for Selling by Lots) 164 209 45 ( 27.4) 202 6 ( 3.4)
(Other) 21 24 3 ( 16.6) 25 -0 ( -2.3)
(Elimination) -87 -89 -1 - -102 12 -Operating revenues 445 500 54 ( 12.2) 479 21 ( 4.4)
(Land and Building Leasing) 92 90 -2 ( -2.9) 90 -0 ( -0.5)(Development for Selling by Lots) 10 12 1 ( 16.0) 14 -2 ( -19.1)
Operating profit 94 94 -0 ( -0.1) 100 -5 ( -5.7)
Profit margin 21.2 18.9 -2.3P - 20.9 -2.0P -EBITDA 143 143 -0 ( -0.2)Depreciation and Amortization 45 44 -0 ( -0.3)Capital Expenditures 190 116 -74 ( -39.1)
34
Copyright 2019 Keio Corporation All Rights Reserved
Reference 1: Detailed Earnings Report for FY2018
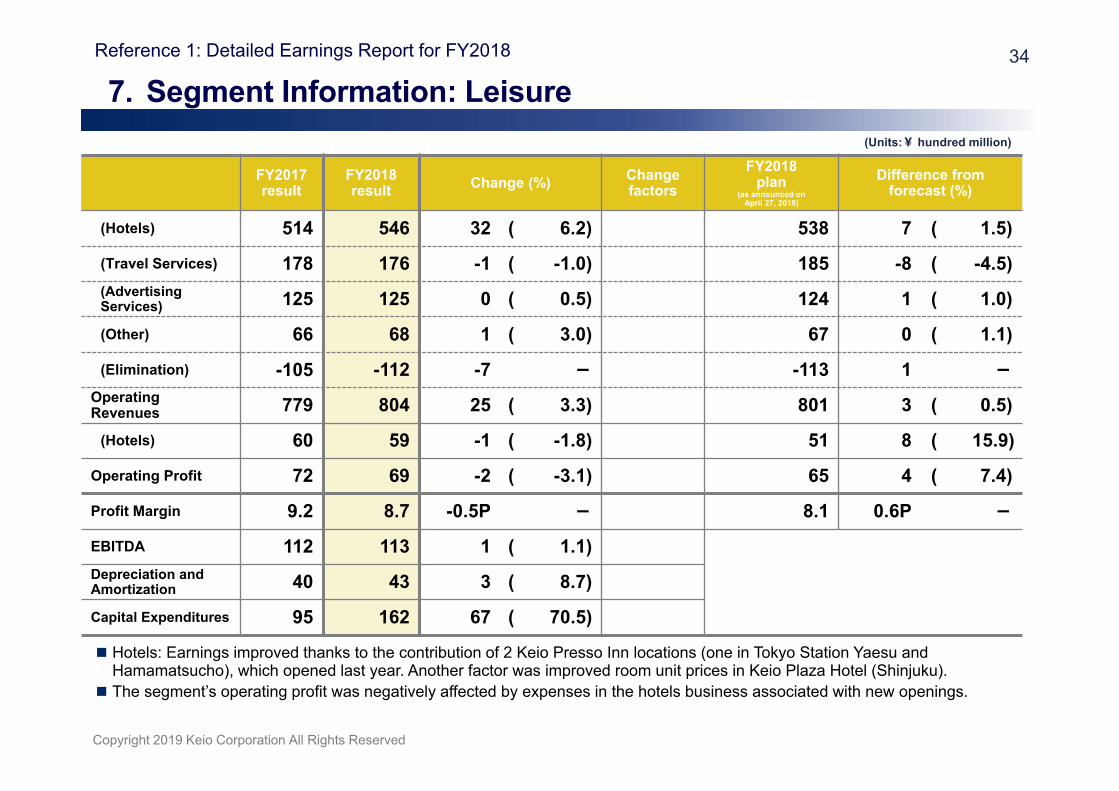
■Hotels: Earnings improved thanks to the contribution of 2 Keio Presso Inn locations (one in Tokyo Station Yaesu and Hamamatsucho), which opened last year. Another factor was improved room unit prices in Keio Plaza Hotel (Shinjuku).
■The segment’s operating profit was negatively affected by expenses in the hotels business associated with new openings.
(Units:¥ hundred million)
FY2017 result
FY2018 result Change (%) Change
factorsFY2018
plan(as announced on
April 27, 2018)
Difference from forecast (%)
(Hotels) 514 546 32 ( 6.2) 538 7 ( 1.5)
(Travel Services) 178 176 -1 ( -1.0) 185 -8 ( -4.5)(Advertising Services) 125 125 0 ( 0.5) 124 1 ( 1.0)
(Other) 66 68 1 ( 3.0) 67 0 ( 1.1)
(Elimination) -105 -112 -7 - -113 1 -Operating Revenues 779 804 25 ( 3.3) 801 3 ( 0.5)
(Hotels) 60 59 -1 ( -1.8) 51 8 ( 15.9)
Operating Profit 72 69 -2 ( -3.1) 65 4 ( 7.4)
Profit Margin 9.2 8.7 -0.5P - 8.1 0.6P -EBITDA 112 113 1 ( 1.1)Depreciation and Amortization 40 43 3 ( 8.7)
Capital Expenditures 95 162 67 ( 70.5)
7. Segment Information: Leisure
35
Copyright 2019 Keio Corporation All Rights Reserved
Reference 1: Detailed Earnings Report for FY2018
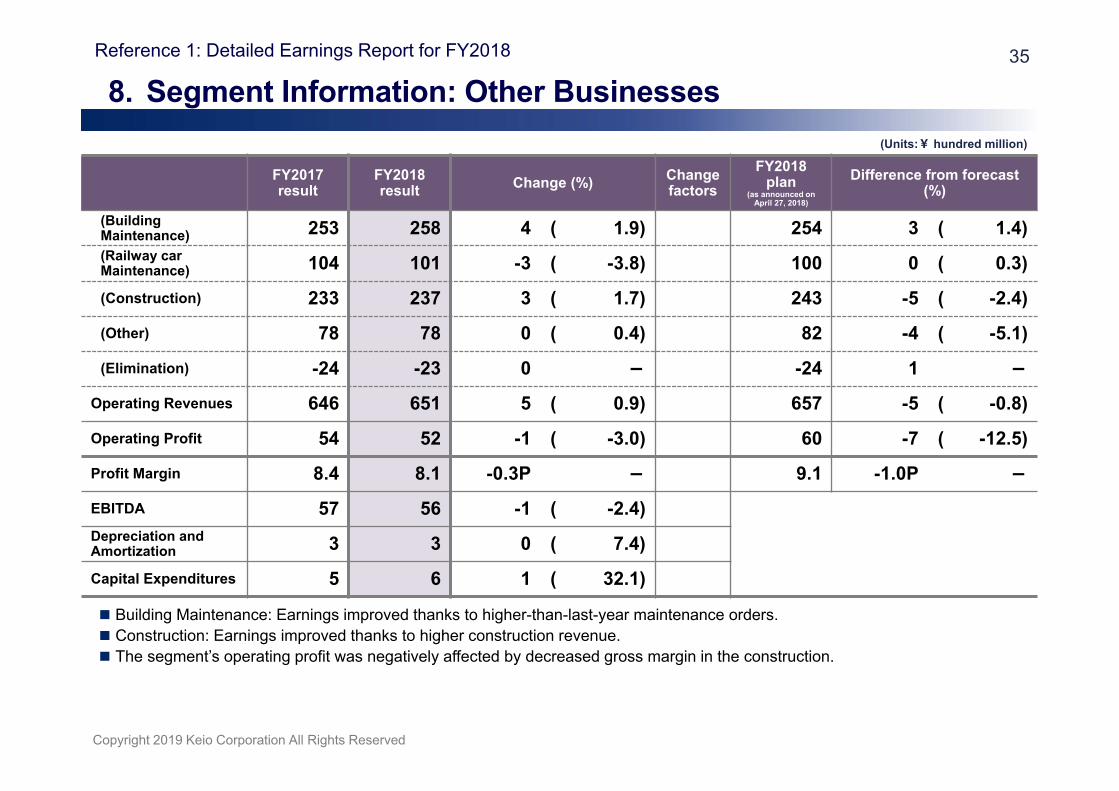
■Building Maintenance: Earnings improved thanks to higher-than-last-year maintenance orders.■Construction: Earnings improved thanks to higher construction revenue.■The segment’s operating profit was negatively affected by decreased gross margin in the construction.
(Units:¥ hundred million)
8. Segment Information: Other Businesses
FY2017 result
FY2018 result Change (%) Change
factorsFY2018
plan(as announced on
April 27, 2018)
Difference from forecast (%)
(Building Maintenance) 253 258 4 ( 1.9) 254 3 ( 1.4)(Railway car Maintenance) 104 101 -3 ( -3.8) 100 0 ( 0.3)
(Construction) 233 237 3 ( 1.7) 243 -5 ( -2.4)
(Other) 78 78 0 ( 0.4) 82 -4 ( -5.1)
(Elimination) -24 -23 0 - -24 1 -Operating Revenues 646 651 5 ( 0.9) 657 -5 ( -0.8)
Operating Profit 54 52 -1 ( -3.0) 60 -7 ( -12.5)
Profit Margin 8.4 8.1 -0.3P - 9.1 -1.0P -EBITDA 57 56 -1 ( -2.4)Depreciation and Amortization 3 3 0 ( 7.4)
Capital Expenditures 5 6 1 ( 32.1)

36
Copyright 2019 Keio Corporation All Rights Reserved
Reference 1: Detailed Earnings Report for FY2018
(Units: ¥ hundred million)
FY2017 result
FY2018 result Change Change factors
Total Assets 8,891 8,893 2 Increase in property, plant and equipment
Liabilities 5,368 5,213 -155 Redemption of 28th debenture, decrease in advances received, etc.
Net Assets 3,522 3,680 157 Booking of Profit Attributable to Owners of Parent, etc.
Total Liabilitiesand Net Assets 8,891 8,893 2
Interest-Bearing Debt 3,521 3,383 -138
Note: Interest-bearing Debt is Loans Payable + Bonds Payable.
9. Consolidated Balance Sheets

37
Copyright 2019 Keio Corporation All Rights Reserved
Reference 1: Detailed Earnings Report for FY2018
FY2017 result FY2018 result Change Change Factors
Net Cash Provided by (used in) Operating Activities
627 606 -20
Net Cash Provided by (used in) Investing Activities
-712 -476 236Decrease in expenditure following purchase of property, plant and equipment and intangible assets
Net Cash Provided by (used in) Financing Activities
173 -203 -377 Long-term borrowings, redemption of bonds payable, etc.
Cash and Cash Equivalents at End of Period
644 579 -65
10. Consolidated Statements of Cash Flows(Units: ¥ hundred million)

38
Copyright 2019 Keio Corporation All Rights Reserved
Reference 2: Detailed Earnings Forecasts for FY2019
1. FY2019 Full-Year Forecasts (Consolidated Statements of Income)
2. Segment Information: Transportation
3. Segment Information: Merchandise Sales
4. Segment Information: Real Estate
5. Segment Information: Leisure
6. Segment Information: Other Businesses
7. FY2019 2nd Quarter Forecasts (Consolidated Statements of Income, Segment Information)

39
Copyright 2019 Keio Corporation All Rights Reserved
Reference 2: Detailed Earnings Forecasts for FY2019
Note: EBITDA is operating profit + depreciation and amortization + amortization of goodwill
■Buoyed by the hotels (new openings) and development for selling by lots, operating revenues will reach 4,600 hmy and operating profit will reach a record high of 433 hmy.
■Profit margin will reach 9.4% and ROA 4.7%, bringing us a step closer to the FY2020 targets of 10% and 5%.■We are on course to hitting the FY2020 targets. We will continue strategically investing over the medium to long term.
1. FY2019 Full-Year Forecasts (Consolidated Statements of Income)
FY2018result
FY2019plan Change (%)
FY2019forecast
(as announced on May 8, 2018)
Change from forecast
Operating Revenues 4,475 4,600 124 ( 2.8) 4,600 -
Operating Profit 400 433 32 ( 8.0) 430 3
Profit Margin 9.0 9.4 0.4P - 9.4 -
Ordinary Profit 392 419 26 ( 6.7) - -Profit Attributable to Owners of Parent 272 285 12 ( 4.7) 280 5
EBITDA 767 801 33 ( 4.4)
Depreciation and Amortization 362 363 1 ( 0.4)
Capital Expenditures 551 972 420 ( 76.3)
(Units:¥ hundred million)

40
Copyright 2019 Keio Corporation All Rights Reserved
Reference 2: Detailed Earnings Forecasts for FY2019
2. Segment Information: Transportation
FY2018result
FY2019plan Change (%) Change factors
(Railways) 861 866 4 ( 0.6 ) See next page
(Bus Services) 365 364 -0 ( -0.2 )
(Taxi Services) 130 126 -3 ( -2.8 ) Transfer of Keio Jidousha Keihin’s stock
(Other) 26 26 -0 ( -1.1 )
(Elimination) -61 -58 2 -Operating Revenues 1,322 1,325 2 ( 0.2 )
(Railways) 116 114 -1 ( -1.1 )
(Bus Services) 25 24 -0 ( -1.6 )
Operating Profit 147 149 1 ( 1.3 )
Profit Margin 11.1 11.3 0.2P -EBITDA 379 374 -4 ( -1.3 )
Depreciation and Amortization 232 224 -7 ( -3.1 )
Capital Expenditures 243 348 105 ( 43.2 )
(Units:¥ hundred million)
41
Copyright 2019 Keio Corporation All Rights Reserved
Reference 2: Detailed Earnings Forecasts for FY2019
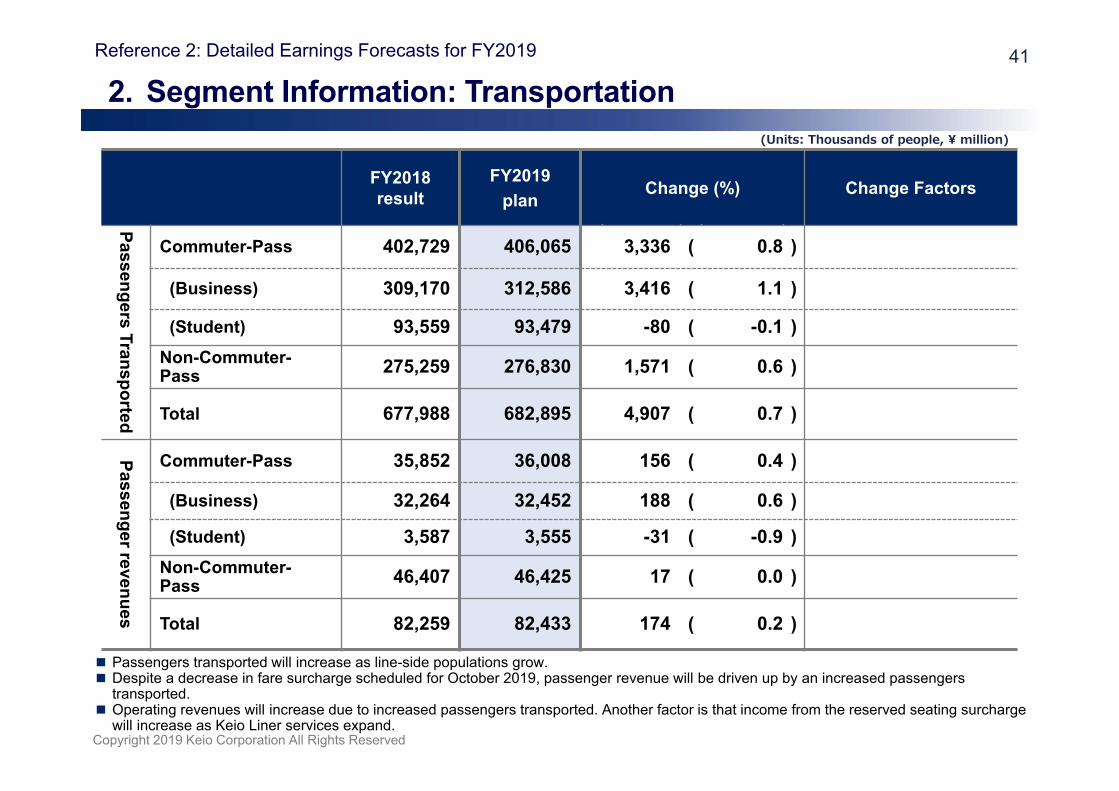
■ Passengers transported will increase as line-side populations grow.■ Despite a decrease in fare surcharge scheduled for October 2019, passenger revenue will be driven up by an increased passengers
transported.■ Operating revenues will increase due to increased passengers transported. Another factor is that income from the reserved seating surcharge
will increase as Keio Liner services expand.
2. Segment Information: Transportation
FY2018 result
FY2019plan
Change (%) Change Factors
Passengers Transported
Commuter-Pass 402,729 406,065 3,336 ( 0.8 )
(Business) 309,170 312,586 3,416 ( 1.1 )
(Student) 93,559 93,479 -80 ( -0.1 )Non-Commuter-Pass 275,259 276,830 1,571 ( 0.6 )
Total 677,988 682,895 4,907 ( 0.7 )
Passenger revenues
Commuter-Pass 35,852 36,008 156 ( 0.4 )
(Business) 32,264 32,452 188 ( 0.6 )
(Student) 3,587 3,555 -31 ( -0.9 )Non-Commuter-Pass 46,407 46,425 17 ( 0.0 )
Total 82,259 82,433 174 ( 0.2 )
(Units: Thousands of people, ¥ million)

42
Copyright 2019 Keio Corporation All Rights Reserved
Reference 2: Detailed Earnings Forecasts for FY2019
3. Segment Information: Merchandise Sales
FY2018result
FY2019plan Change (%) Change factors
(Department Stores) 895 915 19 ( 2.2 ) Renovation of sales spaces
(Retail Stores) 503 513 10 ( 2.0 )(Retail Stores for Books) 64 58 -6 ( -9.7 )
(Shopping Centers) 143 143 -0 ( -0.2 )
(Others) 121 122 1 ( 1.1 )
(Elimination) -64 -66 -2 -Operating Revenues 1,664 1,686 21 ( 1.3 )
(Department Stores) 11 13 2 ( 19.9 )
(Retail Stores) 6 6 0 ( 7.3 )
Operating Profit 51 52 0 ( 1.2 )
Profit Margin 3.1 3.1 - -EBITDA 92 94 2 ( 2.6 )Depreciation and Amortization 41 42 1 ( 2.4 )
Capital Expenditures 31 55 23 ( 73.4 )
(Units:¥ hundred million)

43
Copyright 2019 Keio Corporation All Rights Reserved
Reference 2: Detailed Earnings Forecasts for FY2019
4. Segment Information: Real Estate(Units:¥ hundred million)
FY2018result
FY2019plan Change (%) Change factors
(Land and Building Leasing) 354 365 10 ( 3.0 )(Development for Selling by Lots) 209 259 49 ( 23.6 ) Increase in sales of renovated
property, etc.
(Other) 24 29 5 ( 20.5 )
(Elimination) -89 -105 -16 -
Operating Revenues 500 548 47 ( 9.6 )(Land and Building Leasing) 90 94 4 ( 5.1 )(Development for Selling by Lots) 12 21 9 ( 80.6 )
Operating Profit 94 101 6 ( 7.1 )
Profit Margin 18.9 18.5 -0.4P -
EBITDA 143 152 8 ( 6.3 )
Depreciation and Amortization 44 46 1 ( 3.7 )
Capital Expenditures 116 347 231 ( 199.2 )

44
Copyright 2019 Keio Corporation All Rights Reserved
Reference 2: Detailed Earnings Forecasts for FY2019
5. Segment Information: Leisure(Units:¥ hundred million)
FY2018result
FY2019plan Change (%) Change factors
(Hotels) 546 593 46 ( 8.6 ) Full-year contribution of newly opened and hotels opened last year
(Travel Services) 176 160 -16 ( -9.3 )
(Advertising Services) 125 127 2 ( 1.8 )
(Others) 68 67 -0 ( -1.4 )
(Elimination) -112 -122 -10 -
Operating Revenues 804 825 20 ( 2.5 )
(Hotels) 59 72 13 ( 22.2 )
Operating Profit 69 81 11 ( 16.0 )
Profit Margin 8.7 9.9 1.2P -
EBITDA 113 130 17 ( 15.0 )
Depreciation and Amortization 43 48 4 ( 11.3 )
Capital Expenditures 162 219 57 ( 35.1 )

45
Copyright 2019 Keio Corporation All Rights Reserved
Reference 2: Detailed Earnings Forecasts for FY2019
6. Segment Information: Other Businesses(Units:¥ hundred million)
FY2018 result
FY2019plan Change (%) Change factors
(Building Maintenance) 258 264 5 ( 2.2 )
(Railway Car Maintenance) 101 102 1 ( 1.8 )
(Construction) 237 248 10 ( 4.6 ) Increase in construction revenue, etc.
(Others) 78 89 10 ( 13.3 )
(Elimination) -23 -25 -2 -
Operating Revenues 651 678 26 ( 4.0 )
Operating Profit 52 58 5 ( 10.5 )
Profit Margin 8.1 8.6 0.5P -
EBITDA 56 63 6 ( 12.4 )
Depreciation and Amortization 3 5 1 ( 37.3 )
Capital Expenditures 6 16 9 ( 145.9 )

46
Copyright 2019 Keio Corporation All Rights Reserved
Reference 2: Detailed Earnings Forecasts for FY20197. FY2019 2nd Quarter Forecasts
(Consolidated Statements of Income, Segment Information)
Operating Revenues Operating Profit
FY2018 2Qresult
FY2019 2Q
planChange (%) FY2018 2Q
resultFY2019
2Qplan
Change (%)
Transportation 665 668 2 ( 0.4) 105 108 3 ( 3.3)
Merchandise Sales 799 827 27 ( 3.5) 24 27 2 ( 11.0)
Real Estate 233 272 38 ( 16.4) 52 55 2 ( 5.4)
Leisure 401 408 6 ( 1.7) 42 39 -3 ( -7.9)
Other Businesses 237 265 27 ( 11.7) 10 13 2 ( 22.2)
Elimination -161 -178 -17 ― 0 -0 -1 ―
Total 2,176 2,263 86 ( 4.0) 236 243 6 ( 2.8)
FY2018 2Qresult
FY2019 2Qplan Change (%)
Ordinary Profit 237 235 -2 ( -1.1)
Profit Attributable to Owners of Parent 151 161 9 ( 6.4)
(Units:¥ hundred million)
(Units:¥ hundred million)

The earnings forecasts and outlines on future performance noted in these materials include projections based on certain forecasts/assumptions made at the time of publication. Actual performance may differ from forecast figures due to various factors.