FY2017/2018 Results Announcement
20
1 FY2017/2018 Results Announcement Second Quarter ended 31 December 2017 27 February 2018
Transcript of FY2017/2018 Results Announcement
1
FY2017/2018 Results AnnouncementSecond Quarter ended 31 December 2017
27 February 2018
Sime Darby Property Berhad2
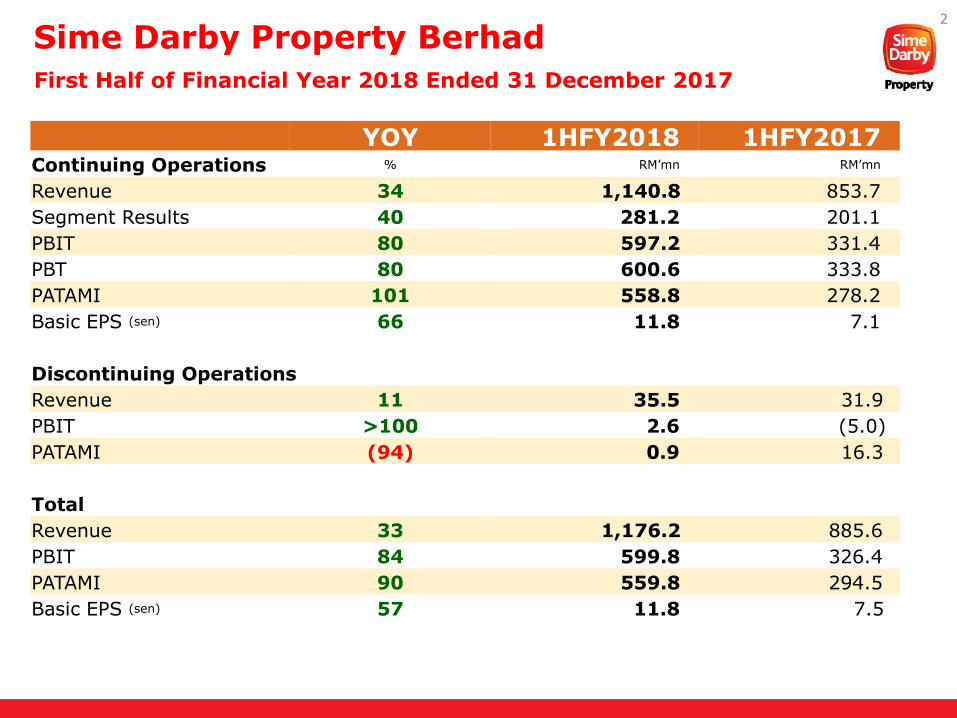
First Half of Financial Year 2018 Ended 31 December 2017
YOY 1HFY2018 1HFY2017Continuing Operations % RM’mn RM’mn
Revenue 34 1,140.8 853.7
Segment Results 40 281.2 201.1
PBIT 80 597.2 331.4
PBT 80 600.6 333.8
PATAMI 101 558.8 278.2
Basic EPS (sen) 66 11.8 7.1
Discontinuing Operations
Revenue 11 35.5 31.9
PBIT >100 2.6 (5.0)
PATAMI (94) 0.9 16.3
Total
Revenue 33 1,176.2 885.6
PBIT 84 599.8 326.4
PATAMI 90 559.8 294.5
Basic EPS (sen) 57 11.8 7.5
3
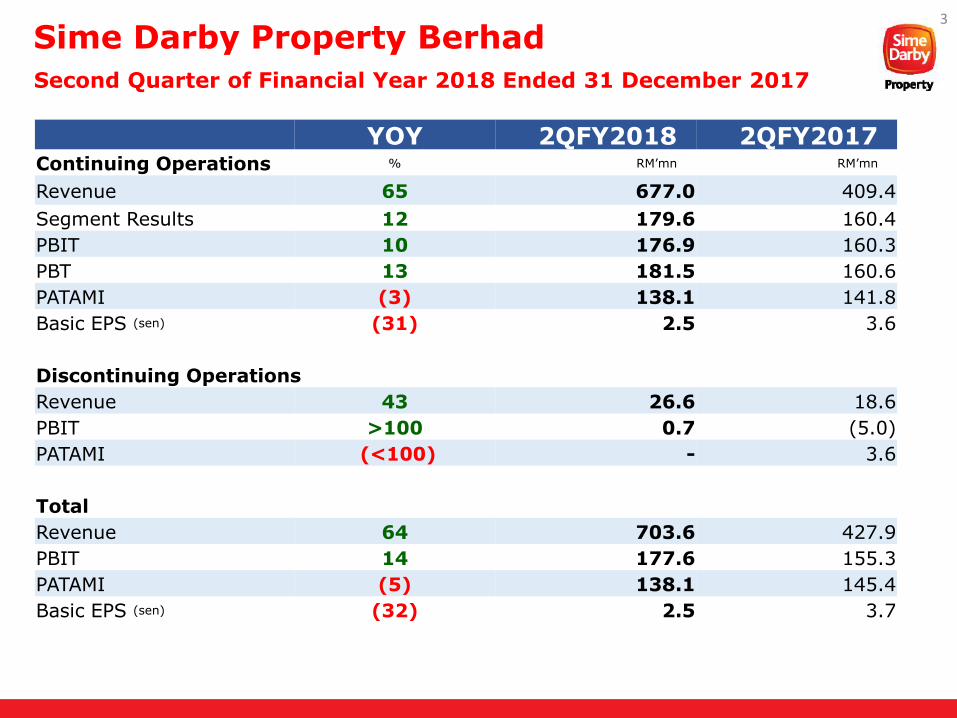
YOY 2QFY2018 2QFY2017Continuing Operations % RM’mn RM’mn
Revenue 65 677.0 409.4
Segment Results 12 179.6 160.4
PBIT 10 176.9 160.3
PBT 13 181.5 160.6
PATAMI (3) 138.1 141.8
Basic EPS (sen) (31) 2.5 3.6
Discontinuing Operations
Revenue 43 26.6 18.6
PBIT >100 0.7 (5.0)
PATAMI (<100) - 3.6
Total
Revenue 64 703.6 427.9
PBIT 14 177.6 155.3
PATAMI (5) 138.1 145.4
Basic EPS (sen) (32) 2.5 3.7
Sime Darby Property Berhad
Second Quarter of Financial Year 2018 Ended 31 December 2017
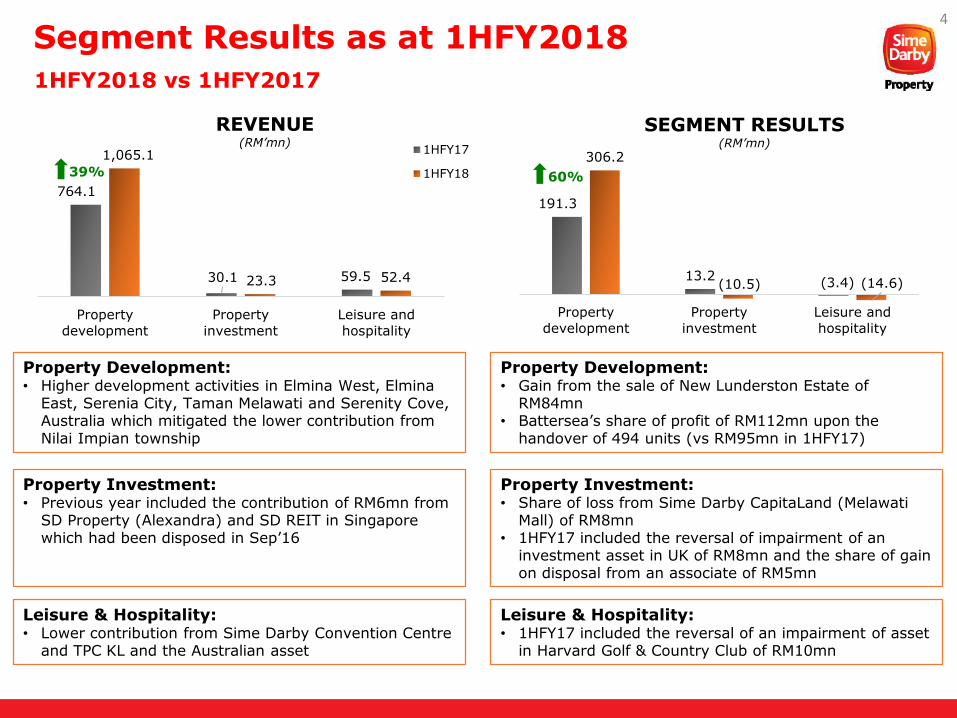
Segment Results as at 1HFY20184
1HFY2018 vs 1HFY2017
191.3
13.2(3.4)
306.2
(10.5) (14.6)
Property
development
Property
investment
Leisure and
hospitality
SEGMENT RESULTS(RM’mn)
764.1
30.1 59.5
1,065.1
23.3 52.4
Property
development
Property
investment
Leisure and
hospitality
REVENUE(RM’mn)
1HFY17
1HFY18 60%39%
Property Development: • Higher development activities in Elmina West, Elmina
East, Serenia City, Taman Melawati and Serenity Cove, Australia which mitigated the lower contribution from Nilai Impian township
Property Investment: • Previous year included the contribution of RM6mn from
SD Property (Alexandra) and SD REIT in Singapore which had been disposed in Sep’16
Leisure & Hospitality: • Lower contribution from Sime Darby Convention Centre
and TPC KL and the Australian asset
Property Development: • Gain from the sale of New Lunderston Estate of
RM84mn • Battersea’s share of profit of RM112mn upon the
handover of 494 units (vs RM95mn in 1HFY17)
Property Investment: • Share of loss from Sime Darby CapitaLand (Melawati
Mall) of RM8mn• 1HFY17 included the reversal of impairment of an
investment asset in UK of RM8mn and the share of gain on disposal from an associate of RM5mn
Leisure & Hospitality: • 1HFY17 included the reversal of an impairment of asset
in Harvard Golf & Country Club of RM10mn
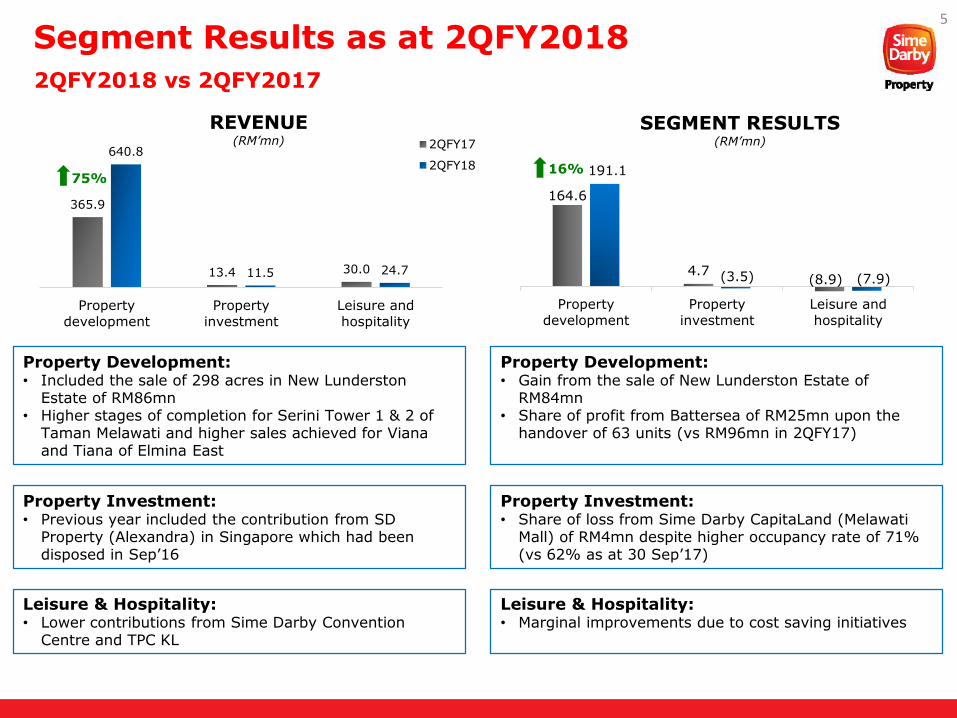
Segment Results as at 2QFY20185
2QFY2018 vs 2QFY2017
164.6
4.7(8.9)
191.1
(3.5) (7.9)
Property
development
Property
investment
Leisure and
hospitality
SEGMENT RESULTS(RM’mn)
16%
365.9
13.4 30.0
640.8
11.5 24.7
Property
development
Property
investment
Leisure and
hospitality
REVENUE(RM’mn) 2QFY17
2QFY1875%
Property Development: • Included the sale of 298 acres in New Lunderston
Estate of RM86mn• Higher stages of completion for Serini Tower 1 & 2 of
Taman Melawati and higher sales achieved for Vianaand Tiana of Elmina East
Property Investment: • Previous year included the contribution from SD
Property (Alexandra) in Singapore which had been disposed in Sep’16
Leisure & Hospitality: • Lower contributions from Sime Darby Convention
Centre and TPC KL
Property Development: • Gain from the sale of New Lunderston Estate of
RM84mn• Share of profit from Battersea of RM25mn upon the
handover of 63 units (vs RM96mn in 2QFY17)
Property Investment: • Share of loss from Sime Darby CapitaLand (Melawati
Mall) of RM4mn despite higher occupancy rate of 71% (vs 62% as at 30 Sep’17)
Leisure & Hospitality: • Marginal improvements due to cost saving initiatives
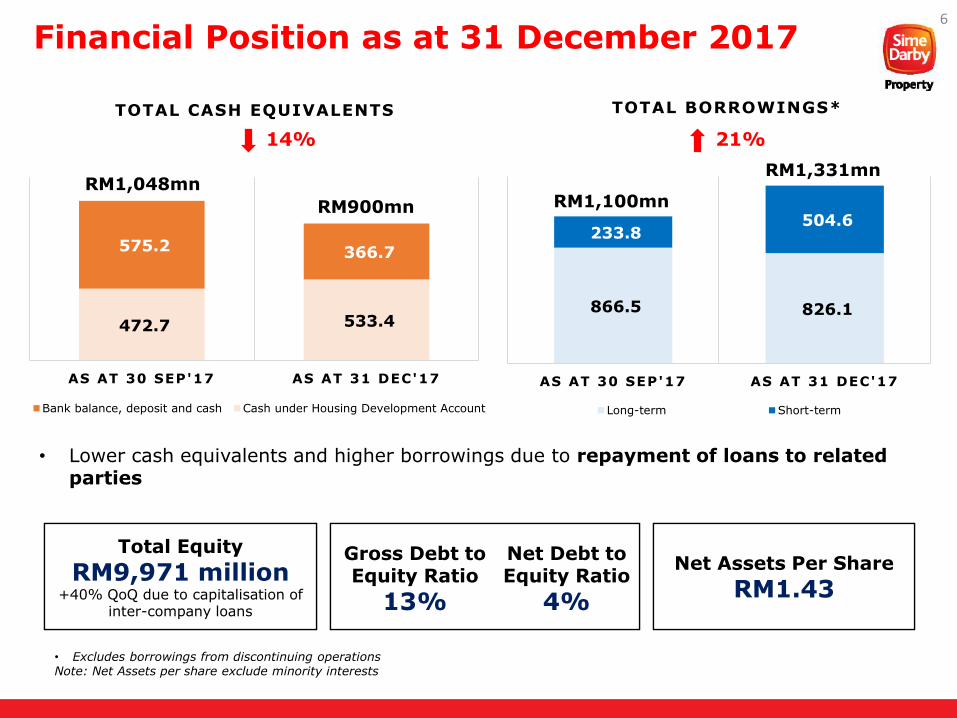
472.7 533.4
575.2 366.7
AS AT 30 SEP'17 AS AT 31 DEC'17
TOTAL CASH EQUIVALENTS
Bank balance, deposit and cash Cash under Housing Development Account
866.5 826.1
233.8 504.6
AS AT 30 SEP'17 AS AT 31 DEC'17
TOTAL BORROWINGS*
Long-term Short-term
Financial Position as at 31 December 20176
• Lower cash equivalents and higher borrowings due to repayment of loans to related parties
• Excludes borrowings from discontinuing operationsNote: Net Assets per share exclude minority interests
RM900mn
RM1,048mn
14% 21%
RM1,331mn
RM1,100mn
Total Equity
RM9,971 million+40% QoQ due to capitalisation of
inter-company loans
Total Equity
RM9,971 million+40% QoQ due to capitalisation of
inter-company loans
Net Assets Per Share
RM1.43Net Assets Per Share
RM1.43
Gross Debt to Equity Ratio
13%
Net Debt to Equity Ratio
4%
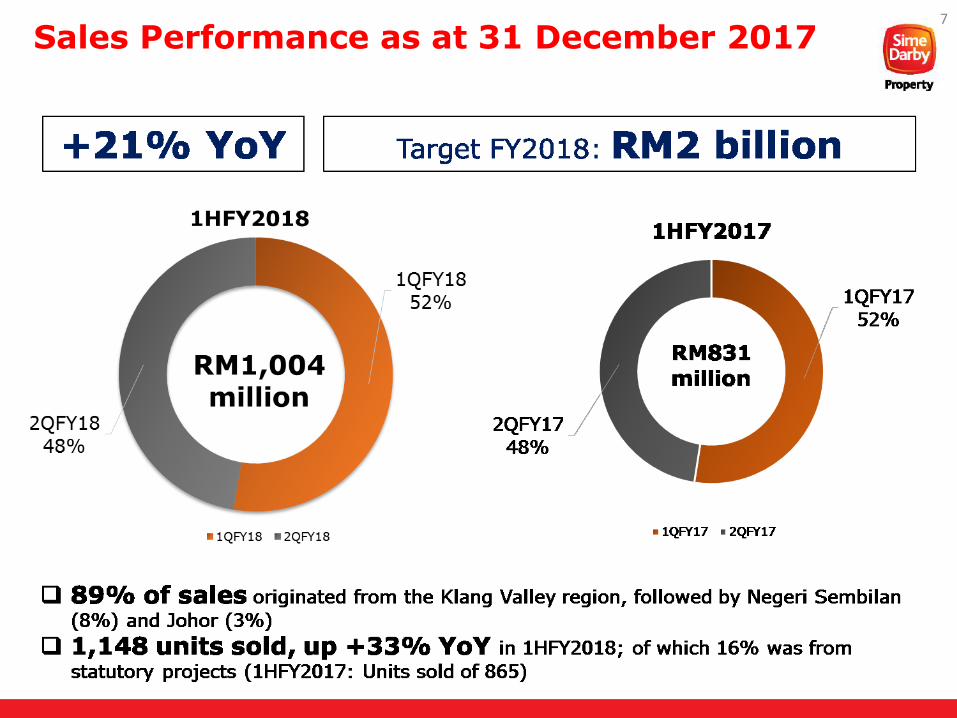
Sales Performance as at 31 December 20177
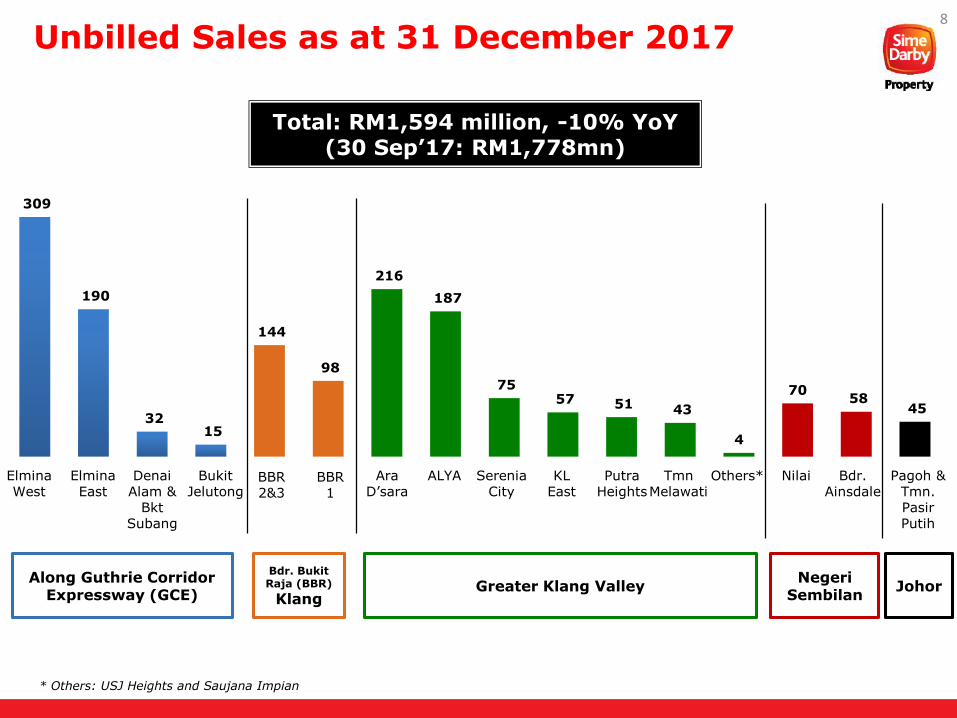
309
190
32 15
144
98
216
187
75 57 51 43
4
7058
45
Unbilled Sales as at 31 December 20178
Total: RM1,594 million, -10% YoY(30 Sep’17: RM1,778mn)
Along Guthrie Corridor Expressway (GCE)
Elmina West
Elmina East
DenaiAlam &
BktSubang
Bukit Jelutong
Bdr. Bukit Raja (BBR)
KlangGreater Klang Valley
NegeriSembilan
BBR 2&3
BBR 1
Ara D’sara
ALYA SereniaCity
KLEast
PutraHeights
TmnMelawati
Nilai Bdr.Ainsdale
Pagoh & Tmn. PasirPutih
Johor
Others*
* Others: USJ Heights and Saujana Impian
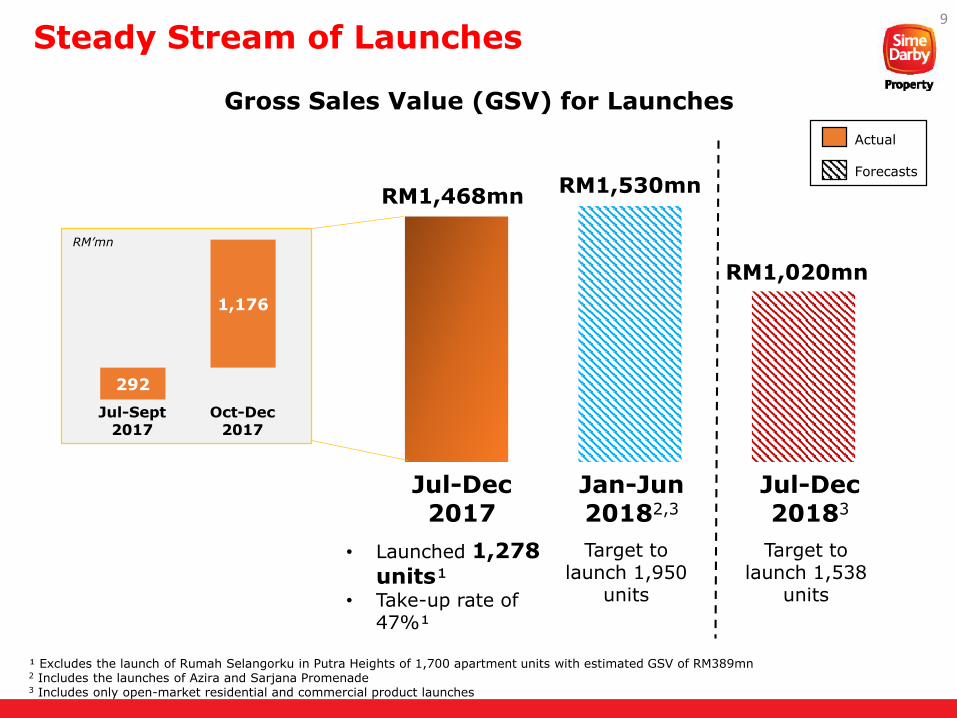
RM1,468mnRM1,530mn
RM1,020mn
1H2018 2H2018 1H2019
Gross Sales Value (GSV) for Launches
9
Steady Stream of Launches
292
1,176
Actual
Forecasts
Jul-Dec2017
Jan-Jun20182,3
Jul-Dec20183
• Launched 1,278 units¹
• Take-up rate of 47%¹
¹ Excludes the launch of Rumah Selangorku in Putra Heights of 1,700 apartment units with estimated GSV of RM389mn2 Includes the launches of Azira and Sarjana Promenade3 Includes only open-market residential and commercial product launches
Target to launch 1,950
units
Target to launch 1,538
units
Jul-Sept2017
Oct-Dec2017
RM’mn
10
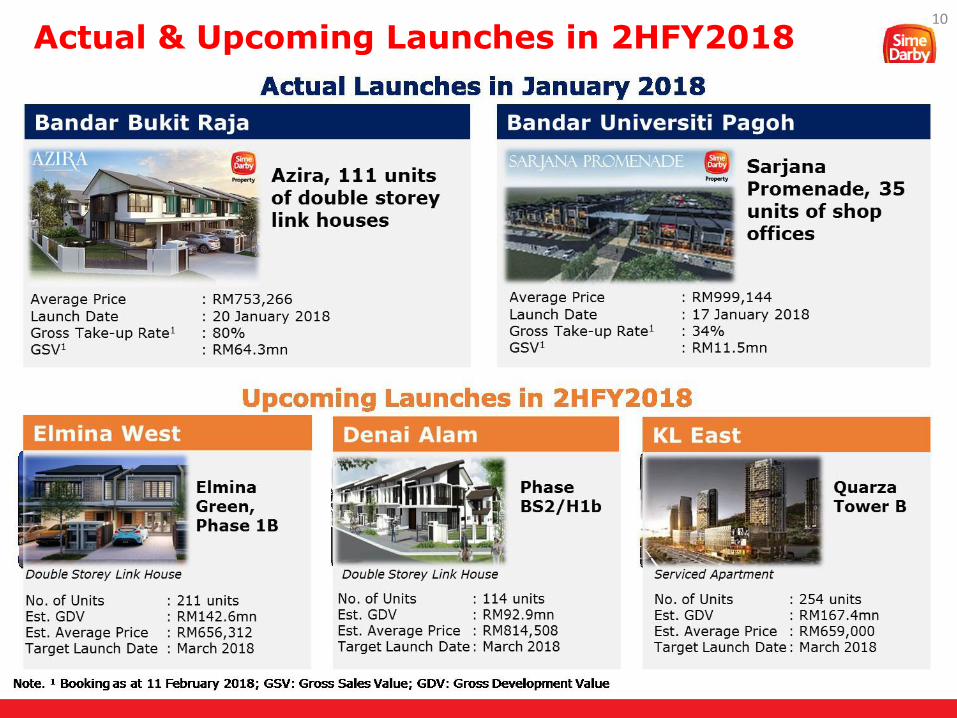
Actual & Upcoming Launches in 2HFY2018
11
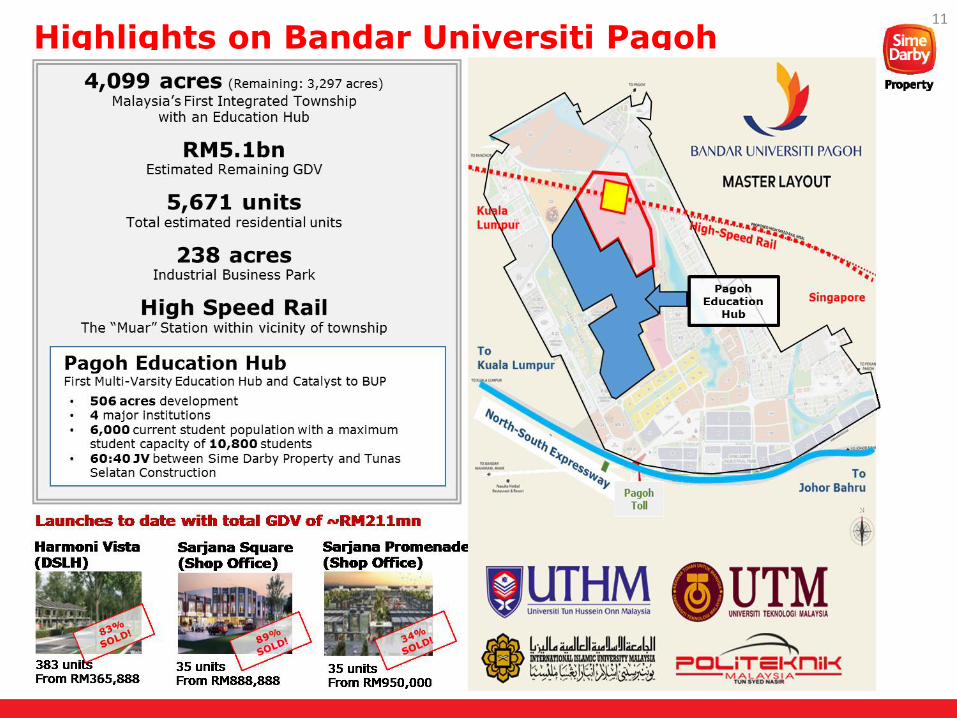
Highlights on Bandar Universiti Pagoh
12
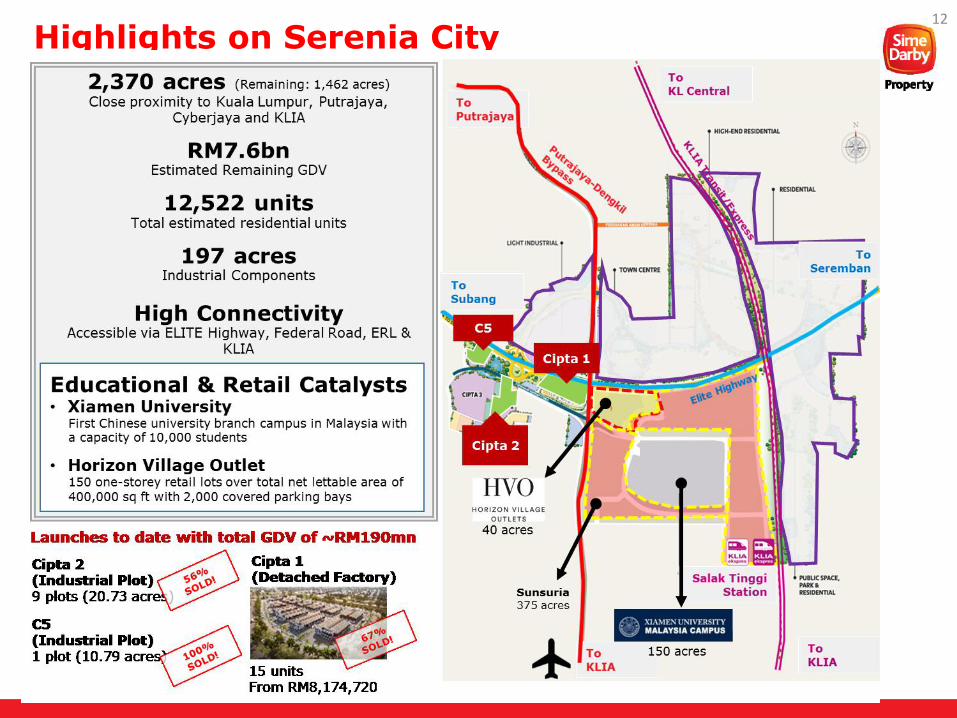
Highlights on Serenia City
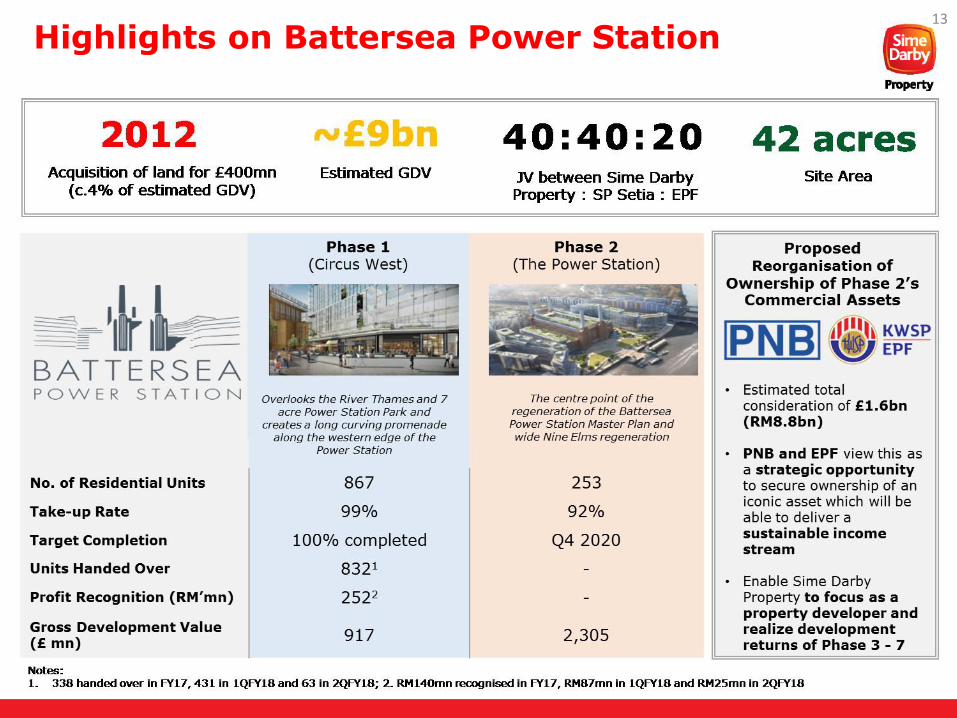
Highlights on Battersea Power Station13
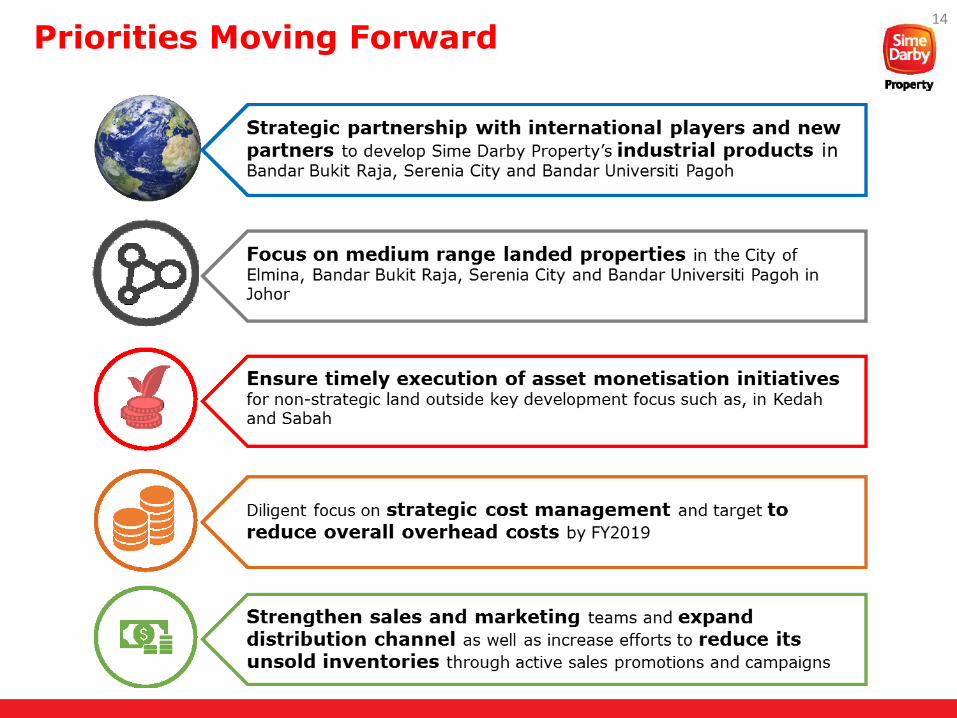
Priorities Moving Forward14

THANK YOU
15
Appendix
16
17
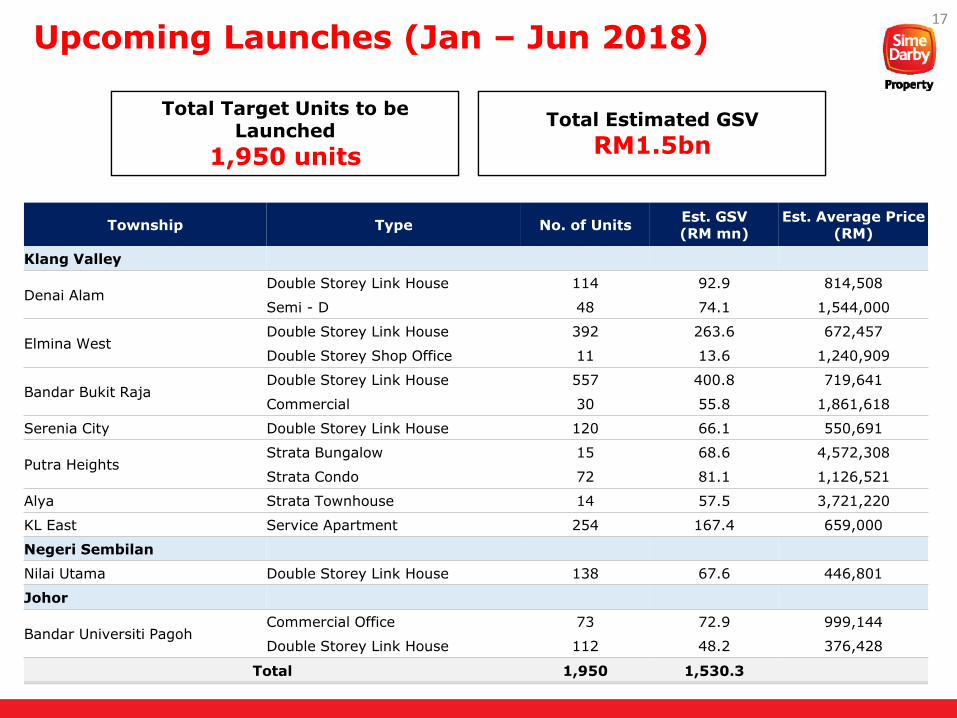
Upcoming Launches (Jan – Jun 2018)
Total Target Units to be Launched
1,950 units
Total Target Units to be Launched
1,950 units
Total Estimated GSV
RM1.5bnTotal Estimated GSV
RM1.5bn
Township Type No. of UnitsEst. GSV (RM mn)
Est. Average Price (RM)
Klang Valley
Denai AlamDouble Storey Link House 114 92.9 814,508
Semi - D 48 74.1 1,544,000
Elmina WestDouble Storey Link House 392 263.6 672,457
Double Storey Shop Office 11 13.6 1,240,909
Bandar Bukit RajaDouble Storey Link House 557 400.8 719,641
Commercial 30 55.8 1,861,618
Serenia City Double Storey Link House 120 66.1 550,691
Putra HeightsStrata Bungalow 15 68.6 4,572,308
Strata Condo 72 81.1 1,126,521
Alya Strata Townhouse 14 57.5 3,721,220
KL East Service Apartment 254 167.4 659,000
Negeri Sembilan
Nilai Utama Double Storey Link House 138 67.6 446,801
Johor
Bandar Universiti PagohCommercial Office 73 72.9 999,144
Double Storey Link House 112 48.2 376,428
Total 1,950 1,530.3
18
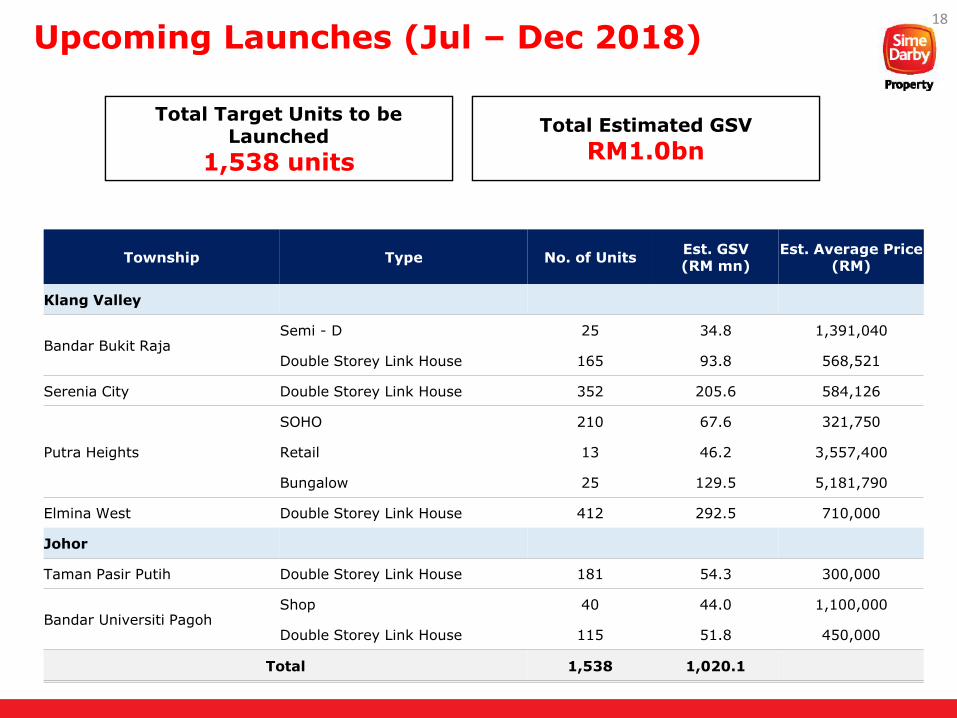
Upcoming Launches (Jul – Dec 2018)
Total Target Units to be Launched
1,538 units
Total Target Units to be Launched
1,538 units
Total Estimated GSV
RM1.0bnTotal Estimated GSV
RM1.0bn
Township Type No. of UnitsEst. GSV (RM mn)
Est. Average Price (RM)
Klang Valley
Bandar Bukit RajaSemi - D 25 34.8 1,391,040
Double Storey Link House 165 93.8 568,521
Serenia City Double Storey Link House 352 205.6 584,126
Putra Heights
SOHO 210 67.6 321,750
Retail 13 46.2 3,557,400
Bungalow 25 129.5 5,181,790
Elmina West Double Storey Link House 412 292.5 710,000
Johor
Taman Pasir Putih Double Storey Link House 181 54.3 300,000
Bandar Universiti PagohShop 40 44.0 1,100,000
Double Storey Link House 115 51.8 450,000
Total 1,538 1,020.1
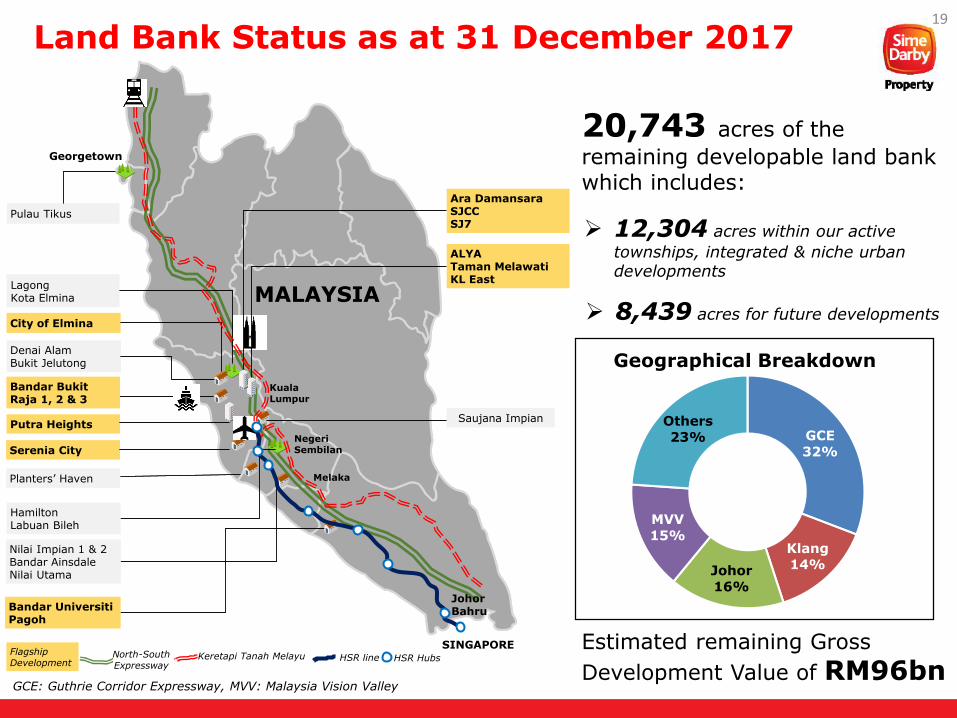
GCE
32%
Klang
14%Johor
16%
MVV
15%
Others
23%
Geographical Breakdown
19
Land Bank Status as at 31 December 2017
20,743 acres of the
remaining developable land bank which includes:
12,304 acres within our active
townships, integrated & niche urban developments
8,439 acres for future developments
Estimated remaining Gross
Development Value of RM96bnGCE: Guthrie Corridor Expressway, MVV: Malaysia Vision Valley
LagongKota Elmina
Pulau Tikus
Georgetown
Melaka
Johor Bahru
Kuala Lumpur
NegeriSembilan
MALAYSIA
SINGAPORE
Hamilton Labuan Bileh
Ara DamansaraSJCC SJ7
Serenia City
ALYATaman MelawatiKL East
Nilai Impian 1 & 2 Bandar AinsdaleNilai Utama
Bandar Universiti Pagoh
Saujana Impian
Denai AlamBukit Jelutong
Putra Heights
Planters’ Haven
City of Elmina
Bandar Bukit Raja 1, 2 & 3
North-South Expressway
Keretapi Tanah Melayu HSR Hubs Flagship Development
HSR line
20
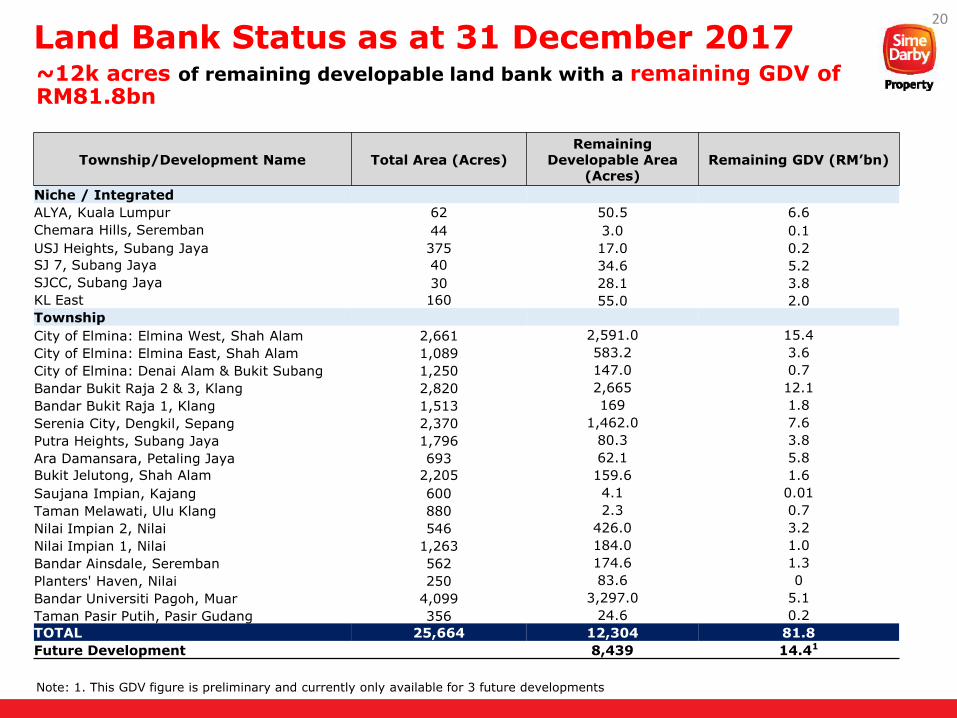
~12k acres of remaining developable land bank with a remaining GDV of RM81.8bn
Land Bank Status as at 31 December 2017
Township/Development Name Total Area (Acres)Remaining
Developable Area (Acres)
Remaining GDV (RM’bn)
Niche / Integrated
ALYA, Kuala Lumpur 62 50.5 6.6
Chemara Hills, Seremban 44 3.0 0.1
USJ Heights, Subang Jaya 375 17.0 0.2
SJ 7, Subang Jaya 40 34.6 5.2
SJCC, Subang Jaya 30 28.1 3.8
KL East 160 55.0 2.0
Township
City of Elmina: Elmina West, Shah Alam 2,661 2,591.0 15.4
City of Elmina: Elmina East, Shah Alam 1,089 583.2 3.6
City of Elmina: Denai Alam & Bukit Subang 1,250 147.0 0.7
Bandar Bukit Raja 2 & 3, Klang 2,820 2,665 12.1
Bandar Bukit Raja 1, Klang 1,513 169 1.8
Serenia City, Dengkil, Sepang 2,370 1,462.0 7.6
Putra Heights, Subang Jaya 1,796 80.3 3.8
Ara Damansara, Petaling Jaya 693 62.1 5.8
Bukit Jelutong, Shah Alam 2,205 159.6 1.6
Saujana Impian, Kajang 600 4.1 0.01
Taman Melawati, Ulu Klang 880 2.3 0.7
Nilai Impian 2, Nilai 546 426.0 3.2
Nilai Impian 1, Nilai 1,263 184.0 1.0
Bandar Ainsdale, Seremban 562 174.6 1.3
Planters' Haven, Nilai 250 83.6 0
Bandar Universiti Pagoh, Muar 4,099 3,297.0 5.1
Taman Pasir Putih, Pasir Gudang 356 24.6 0.2
TOTAL 25,664 12,304 81.8
Future Development 8,439 14.41
Note: 1. This GDV figure is preliminary and currently only available for 3 future developments