FY2013 Business Results - Yamaha Motor Company
29
Yamaha Motor Co., Ltd. February 12, 2014 FY2013 Business Results Yamaha Booth at the 43rd Tokyo Motor Show
Transcript of FY2013 Business Results - Yamaha Motor Company

Yamaha Motor Co., Ltd. February 12, 2014
FY2013 Business Results
Yamaha Booth at the 43rd Tokyo Motor Show

Regarding the Forecast Consolidated Results Forecast consolidated results stated herein are based on the management's assumptions and beliefs in light of the information currently available, and involve risks and uncertainties. Please be advised that actual results may differ significantly from those discussed in the forecast consolidated results. Potential risks and uncertainties include, but are not limited to, general economic conditions in Yamaha Motor’s major markets, changing consumer preferences and currency exchange rate fluctuations.
Agenda
FY2013 Business Results
Outline: Hiroyuki Yanagi, President, CEO and Representative Director
Details: Kozo Shinozaki, Managing Executive Officer and Director

Outline

2012 Results 2013 Results 2014 Forecast
Net Sales 1,207.7 1,410.5 1,500.0 Operating Income 18.6 55.1 75.0
Operating Income Ratio 1.5% 3.9% 5.0% Ordinary Income 27.3 60.1 77.0
Net Income 7.5 44.1 45.0
Currency Rate ($/€)
80 yen/103 yen 98 yen/130 yen 100 yen/135 yen
Operational Results
2013: Net Sales up 202.8 ¥bil. / Operating Income up 36.5 ¥bil. over the previous year. (Developed Markets) Turn into Black (Motorcycles in Emerging Markets) Similar level as the previous year (Other) Net Sales +10%
2014: Forecast of 89.5 ¥bil. increase in Net Sales / 19.9 ¥bil. increase in Operating Income over the previous year. Reinforcement / review of business strategy and bring forward the achievement of MTP goal.
(¥ Bil.)
4 * Includes an additional allocation of deferred tax assets (9.9 billion yen) through the review of the possibility of deferred tax assets return in overseas subsidiaries
*

Business Summary (2013)
5
Developed Markets • Turn into black due to marine sales increase and yen depreciation, etc. • Motorcycle unit sales decline bottomed out after the global financial crisis.
Motorcycle Business in Emerging Markets • The market continued to be flat due to economic slowdown and financial restrictions. • Increase in sales from last year in each market (except Vietnam and Thailand).
Other Business Segments • RV: With the launch of new products, business is improving. • SPV & Power Products: Business improvement continues due to the introduction of new
products & new customer development.
Long-term Strategies • Preparations for the launch of the LMW and development projects for new areas continue to
progress. • Preparations for entering the market (e.g. Motorcycles in Pakistan, Marine market in China)
continues to progress.
Structural Reforms • Progression of the reorganization of domestic factories (8 factories, 16 units), medium-term
cost reductions (10.4 billion yen in the first year), and European operational structual reform.
*RV: Recreational Vehicle SPV: Smart Power Vehicle LMW: Leaning Multi Wheel

Motorcycle Business: Global Sales Status
2013: Total 6.01 million units. Sales increased in each market (except Thailand and Vietnam). 2014: Total 6.57 million units. Increase forecast in developed markets, India, and Brazil.
347 366 408
3,895 3,606 3,753
348 462
613
1,500 1,581
1,798
India
ASEAN
Other
Developed Markets
Unit Sales (Thousand units)
* Developed Markets: Japan, North America, Europe (including Russia), Oceania ASEAN: Indonesia, Vietnam, Thailand 6
6,090
2012 2013 2014 Forecast
6,572
6,014

Motorcycle Business: Developed Markets
Unit Sales (Thousand units)
2013: Yamaha sales at 370,000 units / 106%. Decline bottoms out, recovery in progress. Japan: 115%, North America: 99% (first half-year), 118% (second half-year) Europe: 89% (first half-year), 113% (second half-year)
2014: Overall demand increases in Japan and North America. In Europe, the figures are similar to last year. Yamaha forecasts sales of 410,000 units / 111%.
Main Initiatives (2014) - High-performance, lightweight, fuel-efficient + design concept - Expansion of MT and other categories
94 109 108
71 76 82
165 162
198
17 19
20
Europe
North America
Oceania
Japan
7
2012 2013 2014 Forecast
347
408
366
MT-09 MT-07

Motorcycle Business: Indian Market
2013: Overall demand recovered after 3Q, 14.34 million units / 104%. Yamaha sales is set at 650,000 units, (Domestic)133%, (Export) 136%. 2014: Forecast of overall demand at 15 million units, with Yamaha sales forecast at 830,000 units / 127%.
Main Initiatives (2014) - Strengthen Scooter and Deluxe categories - Market / customer development - from urban areas to regional areas - New factory launch (scheduled for October)
CYGNUS RAY Z CYGNUS α 8
348 462
613
140
190
213
Exports
Domestic
Unit Sales (Thousand
units)
488
2012 2013 2014 Forecast
651
826

Motorcycle Business: Indonesian Market
Unit Sales (Thousand
units)
2013: Overall demand turned upward after down-payment restriction, with sales of 7.74 million units / 110%. Yamaha sales also overturned, with sales of 2.49 million units / 103%. 2014: Forecast of overall demand at 7.8 million units, with Yamaha sales forecast of 2.6 million units / 104%.
9
Main Initiatives (2014) - Strengthen the Sports category, etc. - New-generation engine + Platform, global model launch
2,423
2,600
2012 2013 2014 Forecast
2,492
R15 GT125

10
Global Models
Launch of 2 models in 2014, and continuously launch new products in 2015 and beyond. • Combining individual product features (high-performance, lightweight, fuel-efficient +
design) with cost • Offer new values, gain new customers • From Asia to the global market
R25 (Prototype exhibited at the Tokyo Motor Show)
TRICITY Concept (Prototype exhibited at the Tokyo Motor Show)

2013: Profitability & revenue improved, with notable gains achieved in the operating income ratio. Sales of outboard motors in North America increased due to new product launches (200 H.P. models, etc.). 2014: Aiming for further increases in sales and income.
Marine Products Business
Main Initiatives (2014) • Developed Markets: Continue launches of new products
(115 H.P. models, etc.) • Emerging Markets: Commence production of outboard motors
(Thailand) • China: Launch fishing boat manufacturing plant
(scheduled for September)
116.1 138.5 143.0
37.8
47.4 49.0 16.7
24.0 25.5
25.7
33.4 32.5
2012 2013 2014 Forecast
Outboard Motors
Water Vehicles
Boats
Parts etc.
196.3
5.5% 13.1% 14.4% Operating Income Ratio
Net Sales (¥ Bil.)
Chinese Fishing Boat Market
Yamaha FRP Aquaculture Boat + Yamaha Outboard Motors
243.4
11
250.0

77 64 67
87
21 25 29
31
VIKING
Recreational Vehicles Business
SR VIPER
Main Initiatives (2014) - Creating products both high performance and high reliability - Expanding lineup to widen customer base
ATV ROV
SMB
98
2013: Yamaha reached sales of 89,000 units/91%, an increase in sales of 127%. • ROV: Work towards rebuilding a strengthened lineup by continued product introduction over
the next 5 years. • Snowmobiles: New products Introduction through OEMs, sales increase in Russian market.
2014: Yamaha forecasts sales of 96,000 units/108%, increase in sales of 116%.
12
Net Sales (¥ Bil.)
54.9
2012 2013 2014 Forecast
Unit Sales (Thousand units)
2015 Target
89 96
118
69.7
* RV: Recreational Vehicle ROV: Recreational Off-Highway Vehicles SMB:Snowmobile
81.0 110.0

SPV Business (PAS)
2013: Yamaha sales of 230,000 units /122%. • Domestic: Introduction of a triple sensor , new demand development. • Europe: Business tie-ups from 3 to 4 companies (+ several more expected),
expansion preparations in progress. 2014: Yamaha forecasts sales of 280,000 units /121%.
Main Initiatives (2014) - Introduction of a new power unit, further expansion of high-performance features - Widening of customer base in domestic and international markets
PAS KISS MINI (child seat model) Europe E-Kit
Domestic (PAS
+OEM)
Exports (E-Kit)
13
186 229 243
279
4
3
38
88
2012 2013 2014 Forecast
2015 Target
190
Unit Sales (Thousand
units)
EVINO (Prototype exhibited at the Tokyo Motor Show)
232
281
367
*SPV: Smart Power Vehicles, PAS: Electrically power-assisted bicycles

2013 Dividend / 2014 Forecast Consolidated Results
14
2013: Scheduled to set yearly dividend to 26 yen per share (payout ratio: 20%). 2014: Net sales of 1.5 trillion yen forecast, with operating income of 75 billion yen and yearly dividend of 26 yen. Reinforcement / review of business strategy and bring forward the achievement of MTP goal.
Net Sales/ Operating Income (¥ Bil.)
1.5%
2012 2014 Forecast 2015 Targets (98/130) ($/€) (100/135) (80/103)
1,207.7
18.6
2013 (80/105)
80.0
Yearly dividend 10 yen 26 yen 26 yen
5.0%
75.0
3.9%
55.1
1,410.5 1,500.0
1,600.0
5.0%
Net Income 7.5 billion 44.1 billion 45.0 billion

Details

Net Sales / Operating Income Trends
12.4 8.4
2.0
-4.2
13.9 16.4
11.9 13.0
315.9 316.3 277.3
298.2 327.6
375.2 345.1 362.6
FY12 1Q (79/104)
FY12 2Q (80/103)
FY12 3Q (79/98)
FY12 4Q (81/105)
FY13 2Q (99/129)
FY13 3Q (99/131)
FY13 4Q (100/137)
FY13 1Q (92/122) ($/€)
2012: Income reduced in the second half-year due to inventory adjustments in emerging markets. 2013: Stable income due to sales increases in developed markets and recovering sales in emerging markets.
16
Net Sales
Operating Income
(¥ Bil.)

18.6 20.2
8.7
7.6 55.1 11.7
4.9 3.3
75.0
17
Factors Impacting Operating Income
2013: Improvements in developed markets, an income increase in Indonesia and India absorbed the loss in Thailand . 2014: Income improves through further profitability improvement in developed markets and an sales increase in emerging motorcycle markets.
2012 ($/€:80/103)
2014 (100/135)
(¥ Bil.)
2013 (98/130)
Developed Markets
Emerging Markets Motorcycles
Other
Developed Markets
Emerging Markets Motorcycles
Other

Motorcycles Unit Sales and Net Sales
94 109 108 76 82
165 162 198
5,228 5,077 5,478
533 590
706 6,090
6,014
6,572
36.1 37.4 40.0 41.6 50.3 53.0 79.2 89.0 107.0
533.0 610.0
632.0
108.7 141.5
163.0 798.7
928.2 995.0
Net Sales Unit Sales
2013: Net sales increased from the previous year due to yen depreciation and model mix 2014: Both the unit sales and net sales have increased from the previous year
(¥ Bil.)
Asia
Europe North
America JAPAN
Other
(Thousand units)
2012 2013 2012 2013
(98/130) (80/103) ($/€) 2014
Forecast 2014
Forecast (100/135)
18
71

Net Sales of Marine, Power Products, and Others
26.7 26.3
91.3 124.7
31.0
36.8 11.1
12.1 36.2
43.5 196.3
243.4 250.0
Asia
Europe
North America
Japan
Other
15.3 15.9
51.0 68.1
20.7
25.4 6.3
6.9 10.4
10.4 103.6
126.7 140.0
74.2 68.2
1.3 1.8 3.0 5.5
15.2 17.6 15.4 19.1
109.1 112.2 115.0
Marine Products Power Products Other
Marine: Favorable sales of larger models in North America, and sales increase in Russia. Power Products: Effects of the new ROV and sales increase of golf cars and snowmobiles. Other: Sales increased in electrically power-assisted bicycles and IM.
(¥ Bil.)
* IM: Intelligent Machinery
2012 2013 (98/130) (80/103) ($/€)
2014 Forecast (100/135)
2012 2013 2014 Forecast 2012 2013 2014 Forecast (98/130) (80/103) (100/135) (98/130) (80/103) (100/135)
19

Sales and Operating Income by Business Segment
798.7 928.2 995.0
196.3
243.4 250.0
103.6
126.7 140.0
109.1
112.2 115.0
1,207.7
1,410.5 1,500.0
8.4 20.0
10.8
31.8
36.0
0.5
5.3
8.0
7.4
9.7
110
18.6
55.1
75.0
Net Sales Operating Income
Other
Marine Products
Power Products
Motorcycles
(¥ Bil.)
2012 2013 (98/130) (80/103) ($/€)
2014 Forecast (100/135)
2012 2013 2014 Forecast (98/130) (80/103) (100/135)
-0.2
2013: Operating Income: Motorcycles bottoming out, large improvements in Marine. 2014: Increases in sales and income for all business segments.
20

15.1
13.0
Sales and Operating Income
*Developed markets: Motorcycles in Japan, U.S. and Europe; and All-Terrain Vehicles, Outboard Motors, Personal Watercraft and Snowmobiles Others: Except Developed markets and Motorcycles in Emerging markets
(¥ Bil.)
(98/130) (80/103)
Emerging Markets Motorcycles
Other
Developed Markets
Other
Developed Markets
(Europe, U.S.)
2013 2012
Net Sales
Operating Income Emerging
Markets Motorcycles
(Asia / Latin America)
(100/135) 2014 Forecast
($/€)
1,207.7
18.6 641.8
333.8
232.1
-18.9
22.4
1,410.5
55.1 751.5
402.5
256.4
1.4
31.1
22.7
1,500.0
75.0 795.0
440.0
265.0
2013: Achieved profitability in developed-market. 2014: Recovery in developed markets through the effects of new products. Target sales expansion in emerging markets.
26.0
36.0
21

56 77
21
126 129
Over 200
7.5
9.7
2.5
12.7 11.2
15.0
0 15.5 10
26 26
Dividends per share (yen)
EPS (yen)
2010 2011 2012 2013 2014 Forecast
Goal
Returns to Shareholders, ROE
ROE (%)
Consolidated Equity Ratio 28% 31% 32% 33.5% 34.4% 40%
22
A stable shareholder return was achieved due to increased income per share. Goals: ROE of 15%, Per-share income of 200 yen.


Total Demand (Yamaha estimate) 2012
Results 2013
Results 2014
Forecasts
Japan 442 460 463
North America 502 520 548
Europe 1,744 1,649 1,659
Indonesia 7,064 7,744 7,800
Thailand 2,129 2,004 1,800
India 13,806 14,343 15,000
Vietnam 3,109 2,793 2,800
Taiwan 628 668 680
China 12,630 11,627 10,697
Other 4,537 4,365 4,468
Asia Total 43,903 43,544 43,245
Brazil 1,654 1,515 1,500
Other 7,244 7,989 8,772
Other Total 8,897 9,504 10,272
Motorcycles 55,490 55,678 56,187
Outboard Motors 759 781 816
ATVs 516 523 522 Electrically Power-assisted Bicycles (Japan)
386 435 467
Yamaha Wholesales 2012
Results 2013
Results 2014
Forecasts
Japan 94 109 108
North America 71 76 82
Europe 165 162 198
Indonesia 2,423 2,492 2,600
Thailand 550 348 350
India 348 462 613
Vietnam 922 766 803
Taiwan 179 189 226
China 492 465 505
Other 313 355 381
Asia Total 5,228 5,077 5,478
Brazil 164 179 222
Other 369 411 485
Other Total 533 590 706
Motorcycles 6,090 6,014 6,572
Outboard Motors 322 313 326
ATVs 70 55 49
PASs 104 131 144
(1,000 units)
24
Unit Data (Total Demand/Yamaha Wholesales)

Details of Net Sales and Operating Income
Yearly 4Q 2012
Results 2013
Results 2014
Forecast 2012
Results 2013
Results Motorcycles 798.7 928.2 995.0 200.9 232.6 Marine Products 196.3 243.4 250.0 42.3 58.1 Power Products 103.6 126.7 140.0 30.8 42.6 Other 109.1 112.2 115.0 24.1 29.3
Total 1,207.7 1,410.5 1,500.0 298.2 362.6
Motorcycles -0.2 8.4 20.0 -2.9 2.2 Marine Products 10.8 31.8 36.0 0.1 7.2 Power Products 0.5 5.3 8.0 -2.1 1.1 Other 7.4 9.7 11.0 0.8 2.5
Total 18.6 55.1 75.0 -4.2 13.0
Motorcycles -0.0% 0.9 2.0 -1.5% 1.0 Marine Products 5.5 13.1 14.4 0.3 12.4 Power Products 0.5 4.2 5.7 -7.0 2.5 Other 6.8 8.7 9.6 3.2 8.4
Total 1.5 3.9 5.0 -1.4 3.6
Net Sales (¥ Bil.)
Operating Income (¥ Bil.)
Operating Income Ratio (%)
25

2012 Motorcycles
Outboard Motors
(Thousand units)
Jan.-Dec. +2%
ATV
2013
Monthly Total Demands for Major U.S. Products
4 5 6 7 8 9 1 2 3
(-22%)
20
29
61
20
47
27 (-8%)
(+1%)
11 14
25 22
11 13
(-11%)
(-10%) (-6%)
6 9 6 9 (-4%) (+5%)
27 27 (+0%)
(+4%) 52 55 50
53 51 56 (+3%) (+1%)
22 20 18 19 21 21 (+5%) (+6%) (-2%)
17 22
17 24
(+9%) (-5%)
31 34 (+12%)
17 15 22 21
(+40%) (+26%)
15 12
(-17%)
14 18 20 20 17 21
(-1%) (+15%) (+22%)
40 38 32
45 36
46 (+21%) (+12%)
(+15%)
10
8 9
(+15%)
19 19 (+1%)
27 30
(+12%)
11
7 11
(+55%)
20 18 (-11%)
22 24 (+9%)
12
9 6
(-27%)
25 27 (+9%)
28 27
(-5%)
Oct.-Dec. +5%
Oct.-Dec. +0%
Oct.-Dec. +11%
Jan.-Dec. +1%
Jan.-Dec. +8%
26 Data) Motorcycle and ATV: MIC, Outboard motor: NMMA

18.6
43.2
4.8 10.4 -2.1 -6.4
-4.0 -2.4 -12.8 5.8 55.1
2012 ($/€:80/103)
2013 (98/130)
(¥ Bil.)
Causes of Changes in Operating Income (FY12 Results vs. FY13 Results)
Cost reduction
Other
Increase in SG&A expenses
Increase in gross Income through Sales increase Impact of
exchange rate
Restructuring costs in Europe
Increase in depreciation expenses Decrease of
the profit by the reversal of product liability accrual
Increase in R&D expenses
27

55.1 4.5
21.1
11.0 -3.1 -4.6 -7.9
-3.8 2.7
75.0
2013 ($/€:98/130)
2014 (100/135)
(¥ Bil.)
Cost reduction
Other
Increase in SG&A expenses
Increase in gross Income through Sales increase
Impact of exchange rate
Impact of increased Raw material prices Increase in
R&D expenses
Increase in depreciation expenses
Causes of Changes in Operating Income (FY13 Results vs. FY14 Forecast)
28
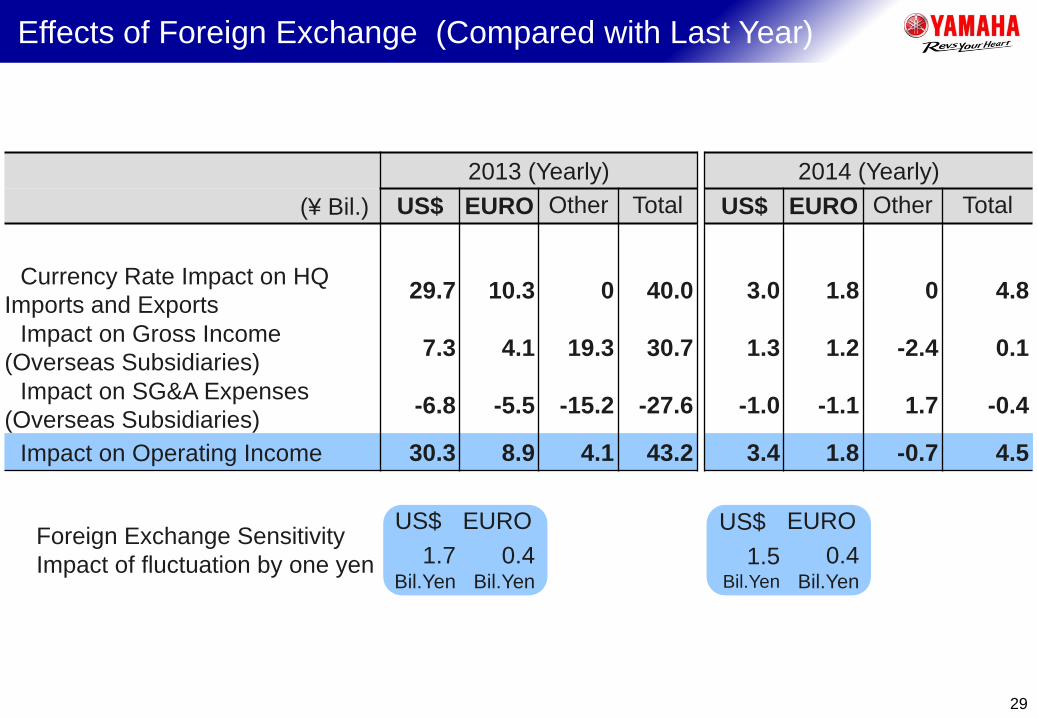
2013 (Yearly) 2014 (Yearly) (¥ Bil.) US$ EURO Other Total US$ EURO Other Total
Currency Rate Impact on HQ Imports and Exports 29.7 10.3 0 40.0 3.0 1.8 0 4.8
Impact on Gross Income (Overseas Subsidiaries) 7.3 4.1 19.3 30.7 1.3 1.2 -2.4 0.1
Impact on SG&A Expenses (Overseas Subsidiaries) -6.8 -5.5 -15.2 -27.6 -1.0 -1.1 1.7 -0.4
Impact on Operating Income 30.3 8.9 4.1 43.2 3.4 1.8 -0.7 4.5
Foreign Exchange Sensitivity Impact of fluctuation by one yen
US$ 1.7
Bil.Yen
EURO 0.4
Bil.Yen
US$ 1.5
Bil.Yen
EURO 0.4
Bil.Yen
Effects of Foreign Exchange (Compared with Last Year)
29