FY2013 Budget Document - 8-jun-12 - Tennessee
69
Budget Document FY 2012 - 2013
Transcript of FY2013 Budget Document - 8-jun-12 - Tennessee
Budget
Document
FY 2012 - 2013
THE UNIVERSITY of TENNESSEE
University of Tennessee at Chattanooga
University of Tennessee, Knoxville
University of Tennessee at Martin
University of Tennessee Space Institute
University of Tennessee Health Science Center Memphis Other Specialized Units
College of Medicine Units Family Medicine Units
University of Tennessee Institute of Agriculture Agricultural Experiment Station
UT Extension College of Veterinary Medicine
University of Tennessee Institute for Public Service Institute for Public Service
Municipal Technical Advisory Service County Technical Assistance Service
University of Tennessee System Administration
FY2013 PROPOSED BUDGET
1
THE UNIVERSITY OF TENNESSEE
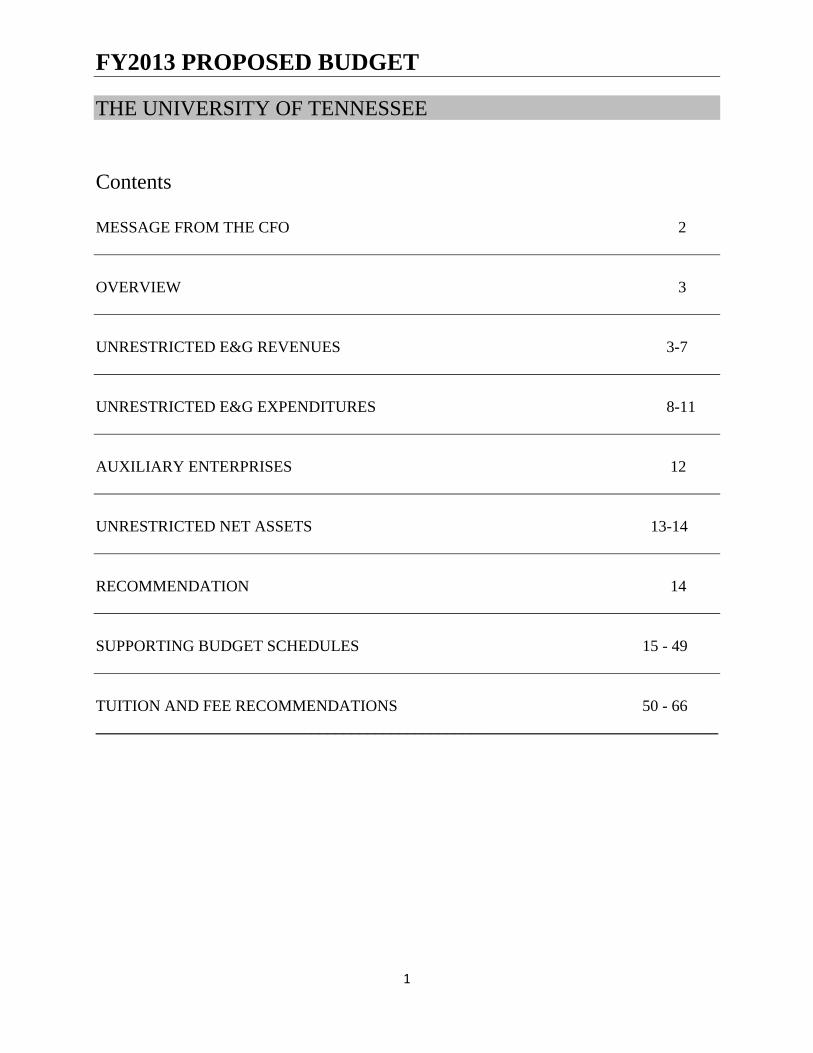
Contents
MESSAGE FROM THE CFO 2
OVERVIEW 3
UNRESTRICTED E&G REVENUES 3-7
UNRESTRICTED E&G EXPENDITURES 8-11
AUXILIARY ENTERPRISES 12
UNRESTRICTED NET ASSETS 13-14
RECOMMENDATION 14
SUPPORTING BUDGET SCHEDULES 15 - 49
TUITION AND FEE RECOMMENDATIONS 50 - 66 ______________________________________________________________________________
2
Message from the CFO
Message from the CFO
The FY2013 proposed operating budget allocates available funding to the University’s current operations for the fiscal year beginning July 1, 2012 and ending June 30, 2013. It is the result of input from hundreds of dedicated faculty, staff, students and citizens involved in setting priorities for the University’s campuses, colleges, and institutes across the state of Tennessee. FY 2013 appropriations contain partial funding for a 2.5% salary increase and a $10.6 million operating increase “to reflect greater institutional productivity … in student progression, degree production, research and service, efficiency metrics, and other outcome measures” documented through the Tennessee Higher Education Commission’s outcomes-based funding formula. These gains are offset in part by reductions in base appropriations, but it is still a step in the right direction for the faculty, staff and students of the University of Tennessee. Compensation continues as a top priority. The University’s Compensation Advisory Board (CAB) developed UT’s first-ever strategic compensation plan to assist each campus and institute in creating their own multi-year compensation plans. Based on the CAB’s employer of choice model, each campus and institute has developed their own model. A recent compensation market assessment showed that salaries in some areas are too low to attract and retain the kind of talent UT needs to remain effective. State appropriations, tuition and fees, grants, contracts, gifts and efficiency measures will be used to fund salary improvements for only the second time since 2007. Tuition and fee adjustments will generate $29.4 million to help fund salary adjustments, institutional scholarships, classroom infrastructure, academic promotions, and student support services. The improvements are focused in areas that support student success, helping students stay in school and graduate on time.
While state funding is stronger than any other time since FY 2008, UT is dealing with the long-term consequences of nearly $125 million reductions in recurring appropriations. Enrollments have grown by over 6,000 student FTEs since 2002. Inflation adjusted revenue-per-student from appropriations, tuition and fees is 6.8% lower today than ten years ago. UT’s faculty and staff have worked hard to find efficiencies. UT tuition and fees remain competitively priced compared to similar institutions even after proposed increases are implemented to help offset the reductions in state support since 2008. Scholarship and fellowship budgets have grown 45.5% since 2008, a far higher percentage than any other expense category, helping keep net costs as low as possible. Budgets for instruction have seen the largest dollar increase since 2008 ($98.7 million), targeting new revenues where they will make the most difference for students. While the focus on students is paramount on each campus, UT goes well beyond the classroom. Extension has a presence in every county of the state, serving farmers, families, youth and community leaders, conducting 114,000 group meetings and demonstrations and over 43,000 visits to farms, homes and workplaces in FY 2011 alone. AgResearch focuses on research vital to the bottom line of Tennessee farmers and agribusiness, supporting Tennessee’s overall economy. The Institute for Public Service promotes good government and strengthens economic vitality through training and technical assistance for Tennessee state and local government and industry and law enforcement professionals nationwide. Revenue and expenditure data for each operating unit is provided in this budget document. Also included is information on athletics and auxiliary budgets. A separate publication containing detailed supporting schedules is available in printed or electronic format. Respectfully,
Charles M. Peccolo Treasurer and Interim Chief Financial Officer
FY2013 PROPOSED BUDGET
3
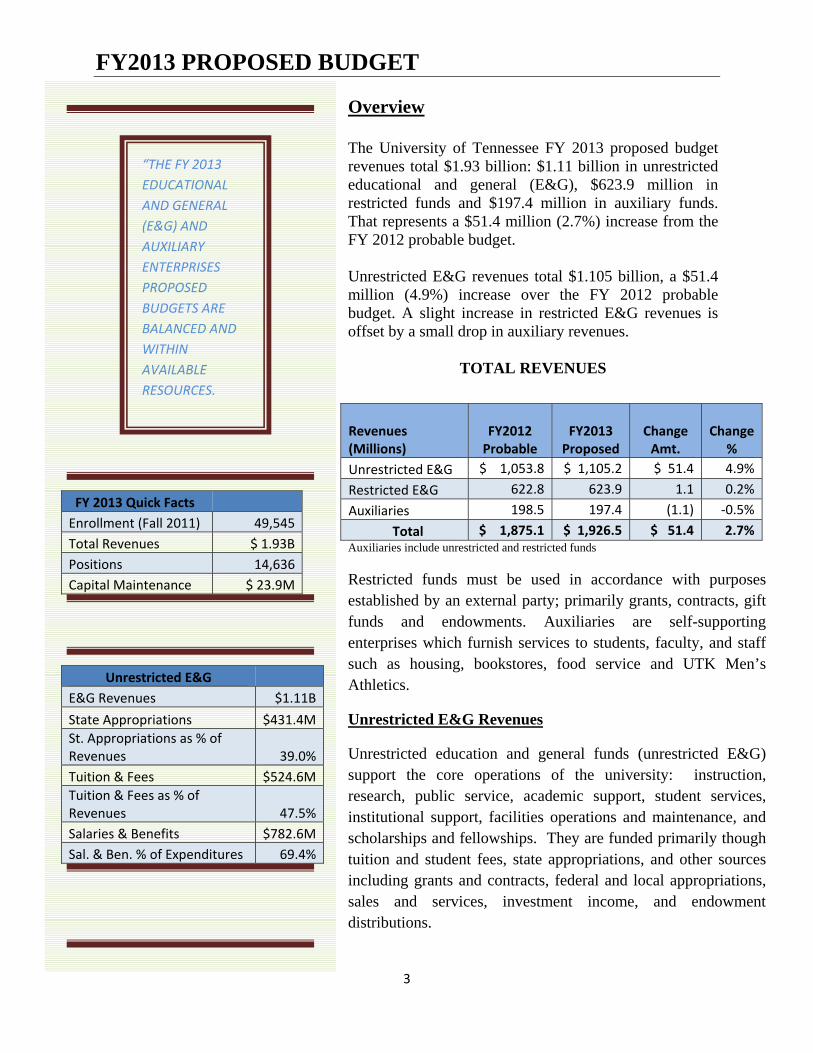
Overview The University of Tennessee FY 2013 proposed budget revenues total $1.93 billion: $1.11 billion in unrestricted educational and general (E&G), $623.9 million in restricted funds and $197.4 million in auxiliary funds. That represents a $51.4 million (2.7%) increase from the FY 2012 probable budget. Unrestricted E&G revenues total $1.105 billion, a $51.4 million (4.9%) increase over the FY 2012 probable budget. A slight increase in restricted E&G revenues is offset by a small drop in auxiliary revenues.
TOTAL REVENUES
Auxiliaries include unrestricted and restricted funds
Restricted funds must be used in accordance with purposes established by an external party; primarily grants, contracts, gift funds and endowments. Auxiliaries are self-supporting enterprises which furnish services to students, faculty, and staff such as housing, bookstores, food service and UTK Men’s Athletics.
Unrestricted E&G Revenues
Unrestricted education and general funds (unrestricted E&G) support the core operations of the university: instruction, research, public service, academic support, student services, institutional support, facilities operations and maintenance, and scholarships and fellowships. They are funded primarily though tuition and student fees, state appropriations, and other sources including grants and contracts, federal and local appropriations, sales and services, investment income, and endowment distributions.
Revenues (Millions)
FY2012 Probable
FY2013 Proposed
Change Amt.
Change %
Unrestricted E&G $ 1,053.8 $ 1,105.2 $ 51.4 4.9%
Restricted E&G 622.8 623.9 1.1 0.2%
Auxiliaries 198.5 197.4 (1.1) ‐0.5%
Total $ 1,875.1 $ 1,926.5 $ 51.4 2.7%
FY 2013 Quick Facts
Enrollment (Fall 2011) 49,545
Total Revenues $ 1.93B
Positions 14,636
Capital Maintenance $ 23.9M
Unrestricted E&G
E&G Revenues $1.11B
State Appropriations $431.4M
St. Appropriations as % of Revenues 39.0%
Tuition & Fees $524.6M
Tuition & Fees as % of Revenues 47.5%
Salaries & Benefits $782.6M
Sal. & Ben. % of Expenditures 69.4%
“THE FY 2013
EDUCATIONAL
AND GENERAL
(E&G) AND
AUXILIARY
ENTERPRISES
PROPOSED
BUDGETS ARE
BALANCED AND
WITHIN
AVAILABLE
RESOURCES.
FY2013 PROPOSED BUDGET
4
Unrestricted E&G Revenues (Continued) The following table shows the change in unrestricted E&G revenues.
Unrestricted E&G Revenues Summary (in millions)
Revenues FY 2012 Probable
FY 2013 Proposed
Change Amount Change %
Tuition & Fees $ 495.2 $ 524.6 $ 29.4 5.9%
State Appropriations 413.2 431.4 18.2 4.4%
Other Revenues 145.4 149.2 3.8 2.6%
Total E&G Revenues $ 1,053.8 $ 1,105.2 $ 51.4 4.9%
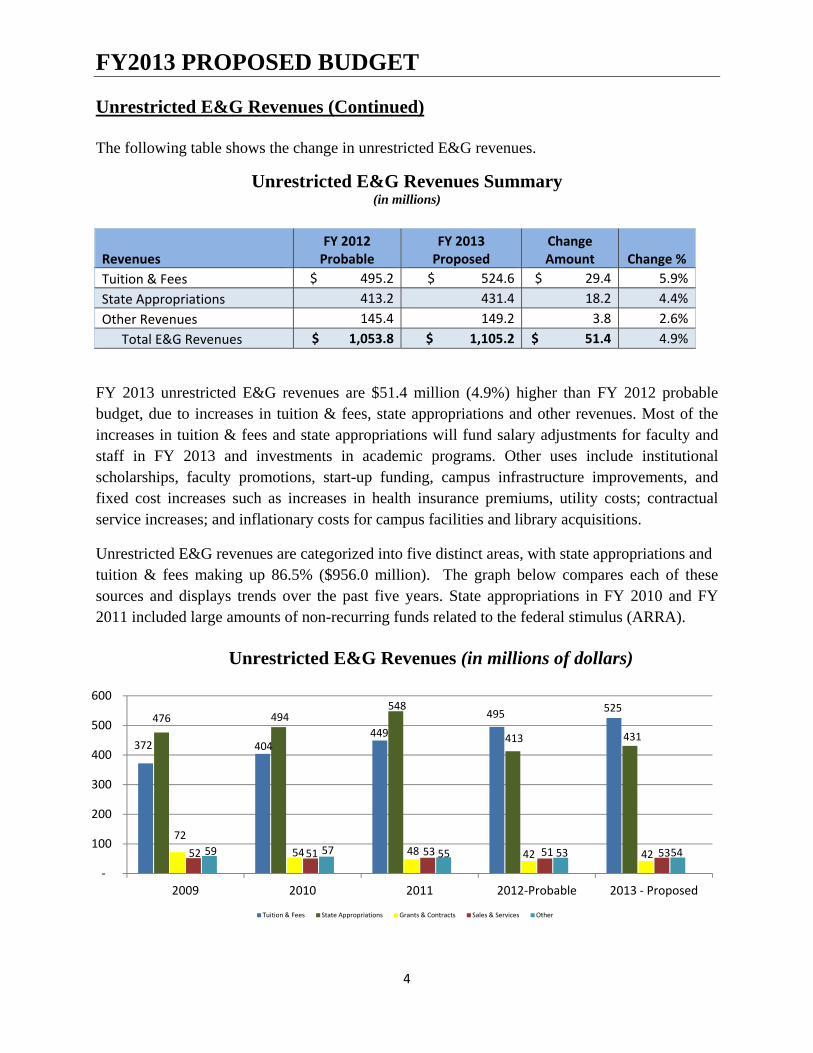
FY 2013 unrestricted E&G revenues are $51.4 million (4.9%) higher than FY 2012 probable budget, due to increases in tuition & fees, state appropriations and other revenues. Most of the increases in tuition & fees and state appropriations will fund salary adjustments for faculty and staff in FY 2013 and investments in academic programs. Other uses include institutional scholarships, faculty promotions, start-up funding, campus infrastructure improvements, and fixed cost increases such as increases in health insurance premiums, utility costs; contractual service increases; and inflationary costs for campus facilities and library acquisitions.
Unrestricted E&G revenues are categorized into five distinct areas, with state appropriations and tuition & fees making up 86.5% ($956.0 million). The graph below compares each of these sources and displays trends over the past five years. State appropriations in FY 2010 and FY 2011 included large amounts of non-recurring funds related to the federal stimulus (ARRA).
Unrestricted E&G Revenues (in millions of dollars)
372 404 449
495 525
476 494 548
413 431
72
54 48 42 42 52 51 53 51 53 59 57 55 53 54
‐
100
200
300
400
500
600
2009 2010 2011 2012‐Probable 2013 ‐ Proposed
Tuition & Fees State Appropriations Grants & Contracts Sales & Services Other
FY2013 PROPOSED BUDGET
5
Unrestricted E&G Revenues (Continued)
State Appropriations
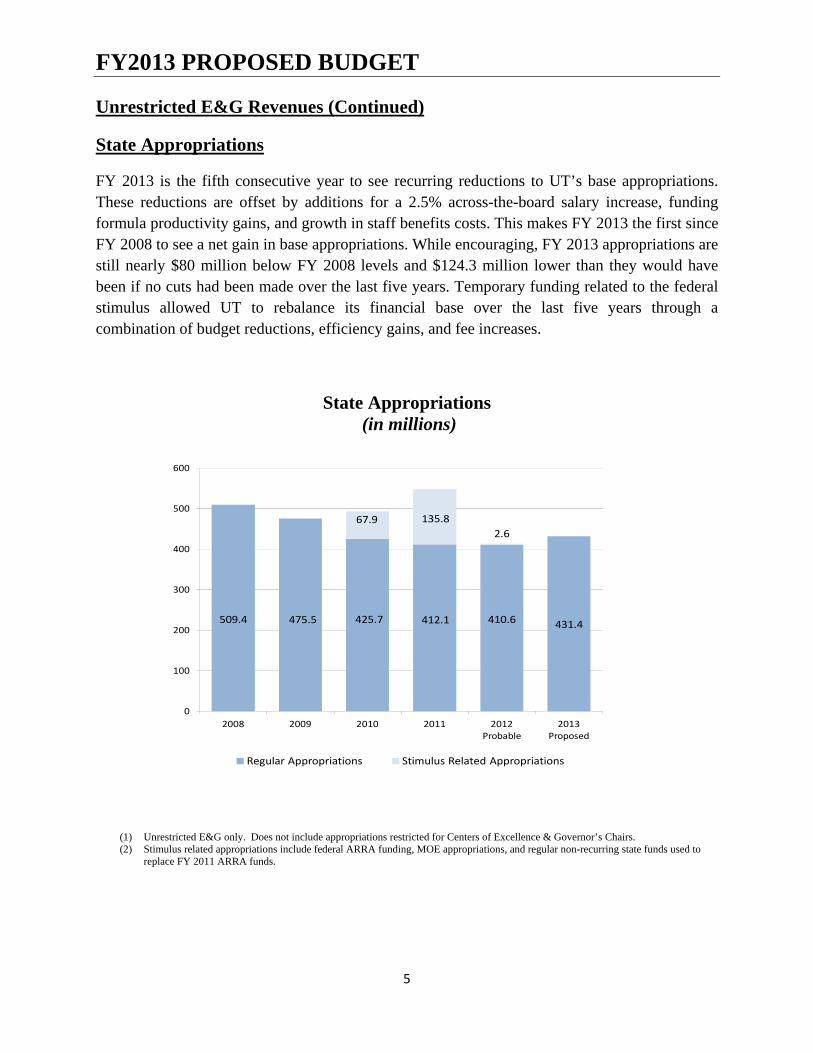
FY 2013 is the fifth consecutive year to see recurring reductions to UT’s base appropriations. These reductions are offset by additions for a 2.5% across-the-board salary increase, funding formula productivity gains, and growth in staff benefits costs. This makes FY 2013 the first since FY 2008 to see a net gain in base appropriations. While encouraging, FY 2013 appropriations are still nearly $80 million below FY 2008 levels and $124.3 million lower than they would have been if no cuts had been made over the last five years. Temporary funding related to the federal stimulus allowed UT to rebalance its financial base over the last five years through a combination of budget reductions, efficiency gains, and fee increases.
State Appropriations (in millions)
(1) Unrestricted E&G only. Does not include appropriations restricted for Centers of Excellence & Governor’s Chairs. (2) Stimulus related appropriations include federal ARRA funding, MOE appropriations, and regular non-recurring state funds used to
replace FY 2011 ARRA funds.
509.4 475.5 425.7 412.1 410.6 431.4
67.9 135.8
2.6
0
100
200
300
400
500
600
2008 2009 2010 2011 2012 Probable
2013 Proposed
Regular Appropriations Stimulus Related Appropriations
FY2013 PROPOSED BUDGET
6
Unrestricted E&G Revenues (Continued) State Appropriations (Continued)
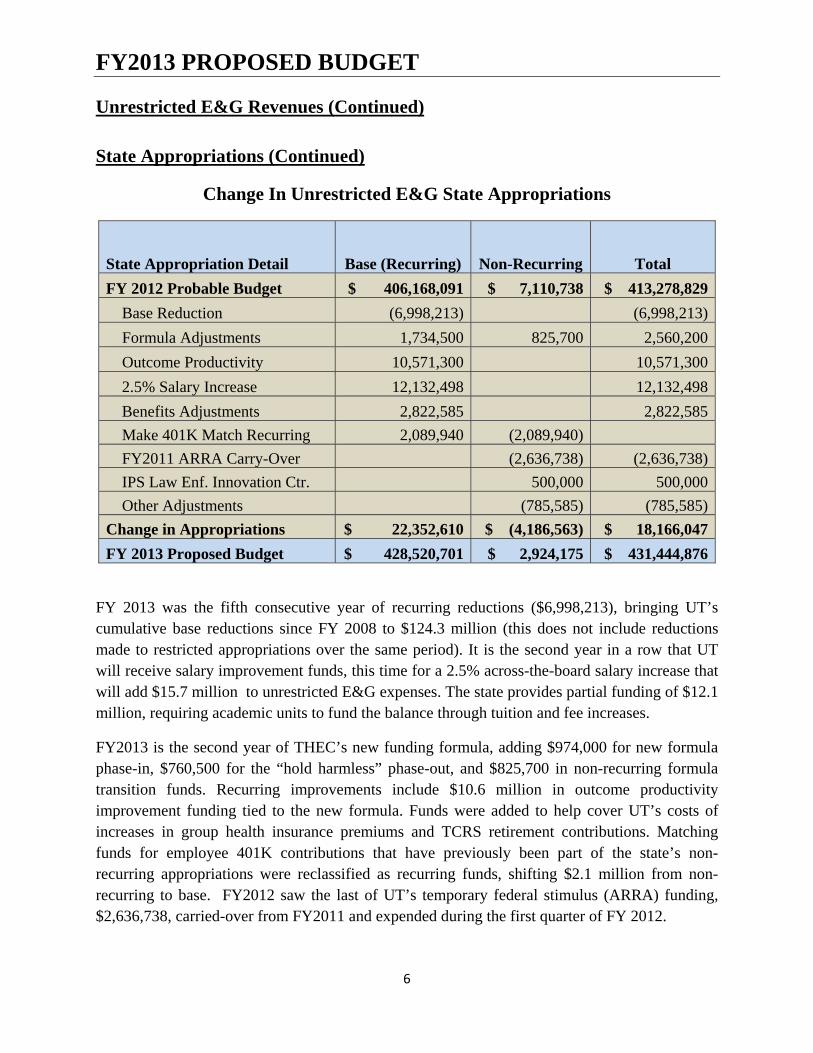
Change In Unrestricted E&G State Appropriations
State Appropriation Detail Base (Recurring) Non-Recurring Total
FY 2012 Probable Budget $ 406,168,091 $ 7,110,738 $ 413,278,829
Base Reduction (6,998,213) (6,998,213)
Formula Adjustments 1,734,500 825,700 2,560,200
Outcome Productivity 10,571,300 10,571,300
2.5% Salary Increase 12,132,498 12,132,498
Benefits Adjustments 2,822,585 2,822,585
Make 401K Match Recurring 2,089,940 (2,089,940)
FY2011 ARRA Carry-Over (2,636,738) (2,636,738)
IPS Law Enf. Innovation Ctr. 500,000 500,000
Other Adjustments (785,585) (785,585)
Change in Appropriations $ 22,352,610 $ (4,186,563) $ 18,166,047
FY 2013 Proposed Budget $ 428,520,701 $ 2,924,175 $ 431,444,876
FY 2013 was the fifth consecutive year of recurring reductions ($6,998,213), bringing UT’s cumulative base reductions since FY 2008 to $124.3 million (this does not include reductions made to restricted appropriations over the same period). It is the second year in a row that UT will receive salary improvement funds, this time for a 2.5% across-the-board salary increase that will add $15.7 million to unrestricted E&G expenses. The state provides partial funding of $12.1 million, requiring academic units to fund the balance through tuition and fee increases.
FY2013 is the second year of THEC’s new funding formula, adding $974,000 for new formula phase-in, $760,500 for the “hold harmless” phase-out, and $825,700 in non-recurring formula transition funds. Recurring improvements include $10.6 million in outcome productivity improvement funding tied to the new formula. Funds were added to help cover UT’s costs of increases in group health insurance premiums and TCRS retirement contributions. Matching funds for employee 401K contributions that have previously been part of the state’s non-recurring appropriations were reclassified as recurring funds, shifting $2.1 million from non-recurring to base. FY2012 saw the last of UT’s temporary federal stimulus (ARRA) funding, $2,636,738, carried-over from FY2011 and expended during the first quarter of FY 2012.
FY2013 PROPOSED BUDGET
7
Unrestricted E&G Revenues (Continued)
Tuition and Fees
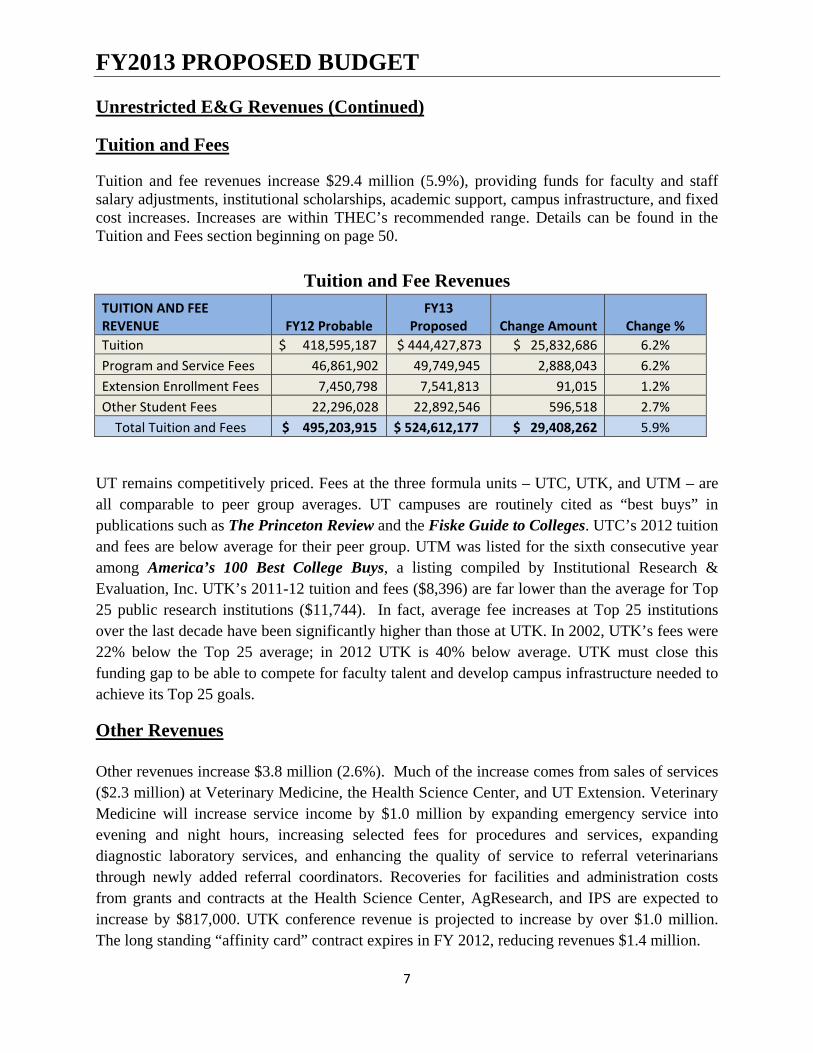
Tuition and fee revenues increase $29.4 million (5.9%), providing funds for faculty and staff salary adjustments, institutional scholarships, academic support, campus infrastructure, and fixed cost increases. Increases are within THEC’s recommended range. Details can be found in the Tuition and Fees section beginning on page 50.
Tuition and Fee Revenues
TUITION AND FEE REVENUE FY12 Probable
FY13 Proposed Change Amount Change %
Tuition $ 418,595,187 $ 444,427,873 $ 25,832,686 6.2%
Program and Service Fees 46,861,902 49,749,945 2,888,043 6.2%
Extension Enrollment Fees 7,450,798 7,541,813 91,015 1.2%
Other Student Fees 22,296,028 22,892,546 596,518 2.7%
Total Tuition and Fees $ 495,203,915 $ 524,612,177 $ 29,408,262 5.9%
UT remains competitively priced. Fees at the three formula units – UTC, UTK, and UTM – are all comparable to peer group averages. UT campuses are routinely cited as “best buys” in publications such as The Princeton Review and the Fiske Guide to Colleges. UTC’s 2012 tuition and fees are below average for their peer group. UTM was listed for the sixth consecutive year among America’s 100 Best College Buys, a listing compiled by Institutional Research & Evaluation, Inc. UTK’s 2011-12 tuition and fees ($8,396) are far lower than the average for Top 25 public research institutions ($11,744). In fact, average fee increases at Top 25 institutions over the last decade have been significantly higher than those at UTK. In 2002, UTK’s fees were 22% below the Top 25 average; in 2012 UTK is 40% below average. UTK must close this funding gap to be able to compete for faculty talent and develop campus infrastructure needed to achieve its Top 25 goals.
Other Revenues Other revenues increase $3.8 million (2.6%). Much of the increase comes from sales of services ($2.3 million) at Veterinary Medicine, the Health Science Center, and UT Extension. Veterinary Medicine will increase service income by $1.0 million by expanding emergency service into evening and night hours, increasing selected fees for procedures and services, expanding diagnostic laboratory services, and enhancing the quality of service to referral veterinarians through newly added referral coordinators. Recoveries for facilities and administration costs from grants and contracts at the Health Science Center, AgResearch, and IPS are expected to increase by $817,000. UTK conference revenue is projected to increase by over $1.0 million. The long standing “affinity card” contract expires in FY 2012, reducing revenues $1.4 million.
FY2013 PROPOSED BUDGET
8
Unrestricted E&G Expenditures
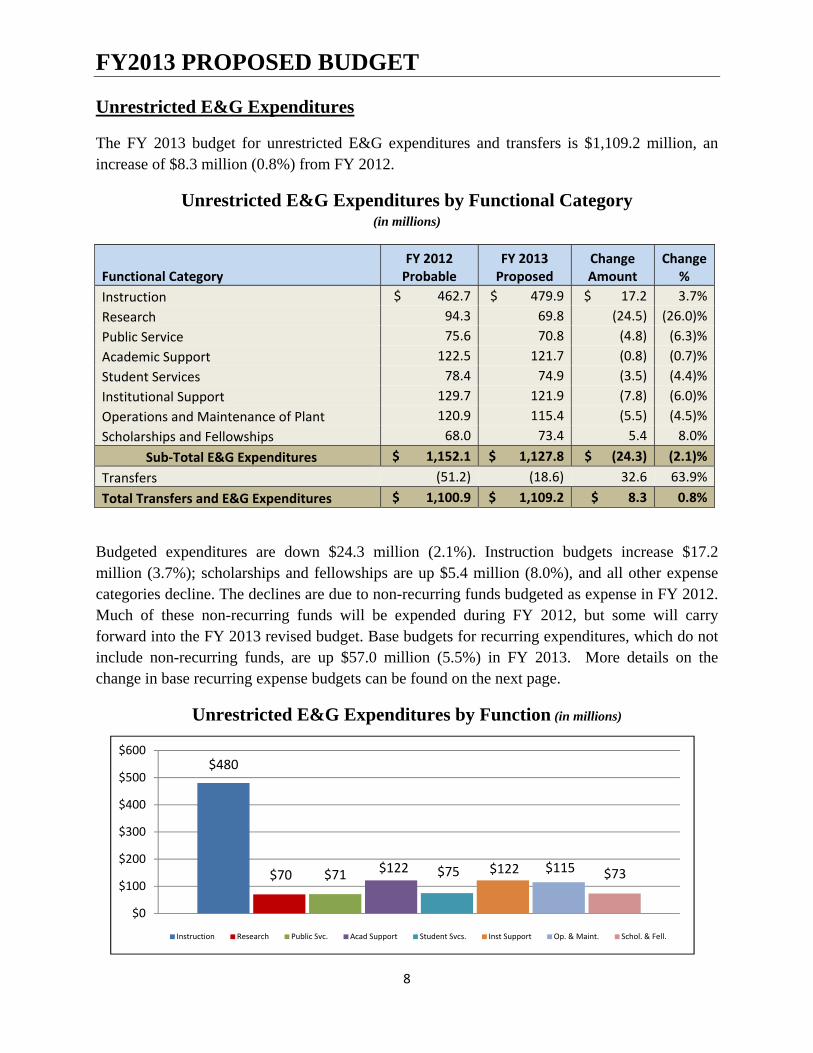
The FY 2013 budget for unrestricted E&G expenditures and transfers is $1,109.2 million, an increase of $8.3 million (0.8%) from FY 2012.
Unrestricted E&G Expenditures by Functional Category (in millions)
Functional Category FY 2012 Probable
FY 2013 Proposed
Change Amount
Change %
Instruction $ 462.7 $ 479.9 $ 17.2 3.7%
Research 94.3 69.8 (24.5) (26.0)%
Public Service 75.6 70.8 (4.8) (6.3)%
Academic Support 122.5 121.7 (0.8) (0.7)%
Student Services 78.4 74.9 (3.5) (4.4)%
Institutional Support 129.7 121.9 (7.8) (6.0)%
Operations and Maintenance of Plant 120.9 115.4 (5.5) (4.5)%
Scholarships and Fellowships 68.0 73.4 5.4 8.0%
Sub‐Total E&G Expenditures $ 1,152.1 $ 1,127.8 $ (24.3) (2.1)%
Transfers (51.2) (18.6) 32.6 63.9%
Total Transfers and E&G Expenditures $ 1,100.9 $ 1,109.2 $ 8.3 0.8%
Budgeted expenditures are down $24.3 million (2.1%). Instruction budgets increase $17.2 million (3.7%); scholarships and fellowships are up $5.4 million (8.0%), and all other expense categories decline. The declines are due to non-recurring funds budgeted as expense in FY 2012. Much of these non-recurring funds will be expended during FY 2012, but some will carry forward into the FY 2013 revised budget. Base budgets for recurring expenditures, which do not include non-recurring funds, are up $57.0 million (5.5%) in FY 2013. More details on the change in base recurring expense budgets can be found on the next page.
Unrestricted E&G Expenditures by Function (in millions)
$480
$70 $71 $122 $75 $122 $115 $73
$0
$100
$200
$300
$400
$500
$600
Instruction Research Public Svc. Acad Support Student Svcs. Inst Support Op. & Maint. Schol. & Fell.
FY2013 PROPOSED BUDGET
9
Unrestricted E&G Expenditures (Continued)
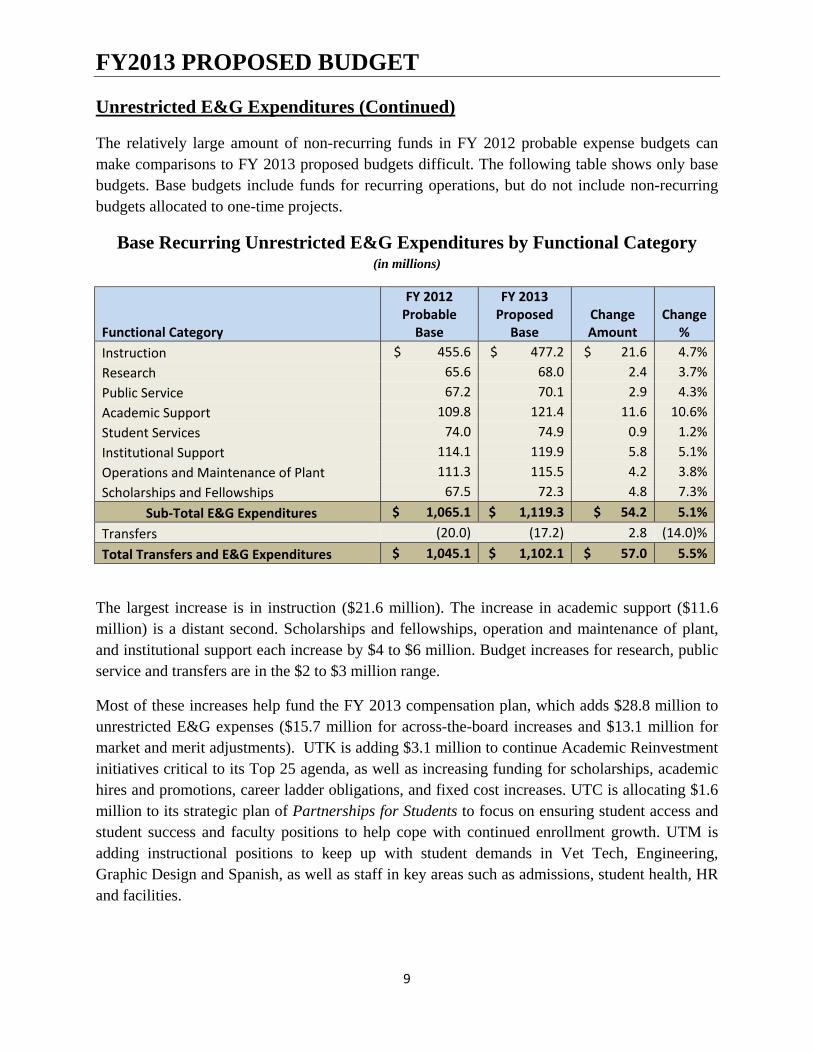
The relatively large amount of non-recurring funds in FY 2012 probable expense budgets can make comparisons to FY 2013 proposed budgets difficult. The following table shows only base budgets. Base budgets include funds for recurring operations, but do not include non-recurring budgets allocated to one-time projects.
Base Recurring Unrestricted E&G Expenditures by Functional Category (in millions)
Functional Category
FY 2012 Probable Base
FY 2013 Proposed Base
Change Amount
Change
%
Instruction $ 455.6 $ 477.2 $ 21.6 4.7%
Research 65.6 68.0 2.4 3.7%
Public Service 67.2 70.1 2.9 4.3%
Academic Support 109.8 121.4 11.6 10.6%
Student Services 74.0 74.9 0.9 1.2%
Institutional Support 114.1 119.9 5.8 5.1%
Operations and Maintenance of Plant 111.3 115.5 4.2 3.8%
Scholarships and Fellowships 67.5 72.3 4.8 7.3%
Sub‐Total E&G Expenditures $ 1,065.1 $ 1,119.3 $ 54.2 5.1%
Transfers (20.0) (17.2) 2.8 (14.0)%
Total Transfers and E&G Expenditures $ 1,045.1 $ 1,102.1 $ 57.0 5.5%
The largest increase is in instruction ($21.6 million). The increase in academic support ($11.6 million) is a distant second. Scholarships and fellowships, operation and maintenance of plant, and institutional support each increase by $4 to $6 million. Budget increases for research, public service and transfers are in the $2 to $3 million range.
Most of these increases help fund the FY 2013 compensation plan, which adds $28.8 million to unrestricted E&G expenses ($15.7 million for across-the-board increases and $13.1 million for market and merit adjustments). UTK is adding $3.1 million to continue Academic Reinvestment initiatives critical to its Top 25 agenda, as well as increasing funding for scholarships, academic hires and promotions, career ladder obligations, and fixed cost increases. UTC is allocating $1.6 million to its strategic plan of Partnerships for Students to focus on ensuring student access and student success and faculty positions to help cope with continued enrollment growth. UTM is adding instructional positions to keep up with student demands in Vet Tech, Engineering, Graphic Design and Spanish, as well as staff in key areas such as admissions, student health, HR and facilities.
FY2013 PROPOSED BUDGET
10
Unrestricted E&G Expenditures (Continued)
The Health Science Center will see expense increases for faculty positions, the Strategic Investment Fund, SACS accreditation efforts, infrastructure improvements and debt service. Additional service revenues in Veterinary Medicine will fund projected utilities increases, career ladder/CPS increases and departmental growth opportunities in areas such as Emergency and Critical Care, Internal Medicine, Shelter Medicine, Dentistry, Equine Rehabilitation and Sports Medicine and MR and CT Imaging. AgResearch continues to redirect resources towards its core research mission including the new Beef and Forage Center, Water and Environment Center, Organic Agriculture and Turf research program. UT Extension will continue to reduce operating expenses such as travel, maintenance and supplies.
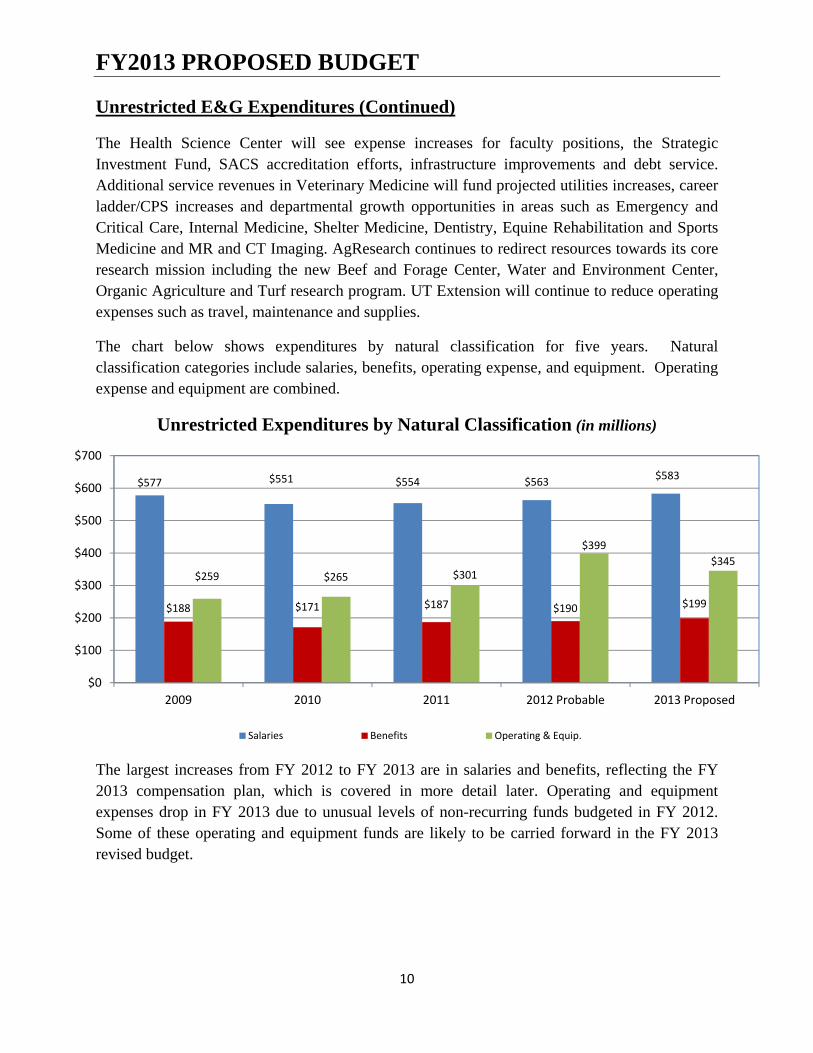
The chart below shows expenditures by natural classification for five years. Natural classification categories include salaries, benefits, operating expense, and equipment. Operating expense and equipment are combined.
Unrestricted Expenditures by Natural Classification (in millions)
The largest increases from FY 2012 to FY 2013 are in salaries and benefits, reflecting the FY 2013 compensation plan, which is covered in more detail later. Operating and equipment expenses drop in FY 2013 due to unusual levels of non-recurring funds budgeted in FY 2012. Some of these operating and equipment funds are likely to be carried forward in the FY 2013 revised budget.
$577 $551 $554 $563$583
$188 $171 $187 $190 $199
$259 $265 $301
$399
$345
$0
$100
$200
$300
$400
$500
$600
$700
2009 2010 2011 2012 Probable 2013 Proposed
Salaries Benefits Operating & Equip.
FY2013 PROPOSED BUDGET
11
Unrestricted E&G Expenditures (Continued)
FY 2013 Compensation Plan
Faculty and staff went four years with no general salary adjustments until funding from the state helped pay for a modest increase in FY 2012. The effects of going so long with no across-the-board salary increases were apparent in a comprehensive compensation market assessment conducted for UT which found that salaries for many faculty and staff were not competitive. The study estimated the costs of closing the gap at $153 million ($185 million including benefits), far more than can be funded in a single year. Each campus and institute is working on long range plans to improve compensation. The FY 2013 compensation plans are one important step in a multi-year effort to bring UT compensation to competitive levels.
The FY 2013 compensation plans have two major components: (1) a 2.5% across-the-board increase consistent with the plan for all state employees and (2) increases for market and merit adjustments consistent with each unit’s long-range compensation plan. The across-the-board increase includes a $1,000 minimum increase for full-time employees, pro-rated for part-time staff, to provide additional assistance to employees making less than $40,000 per year.
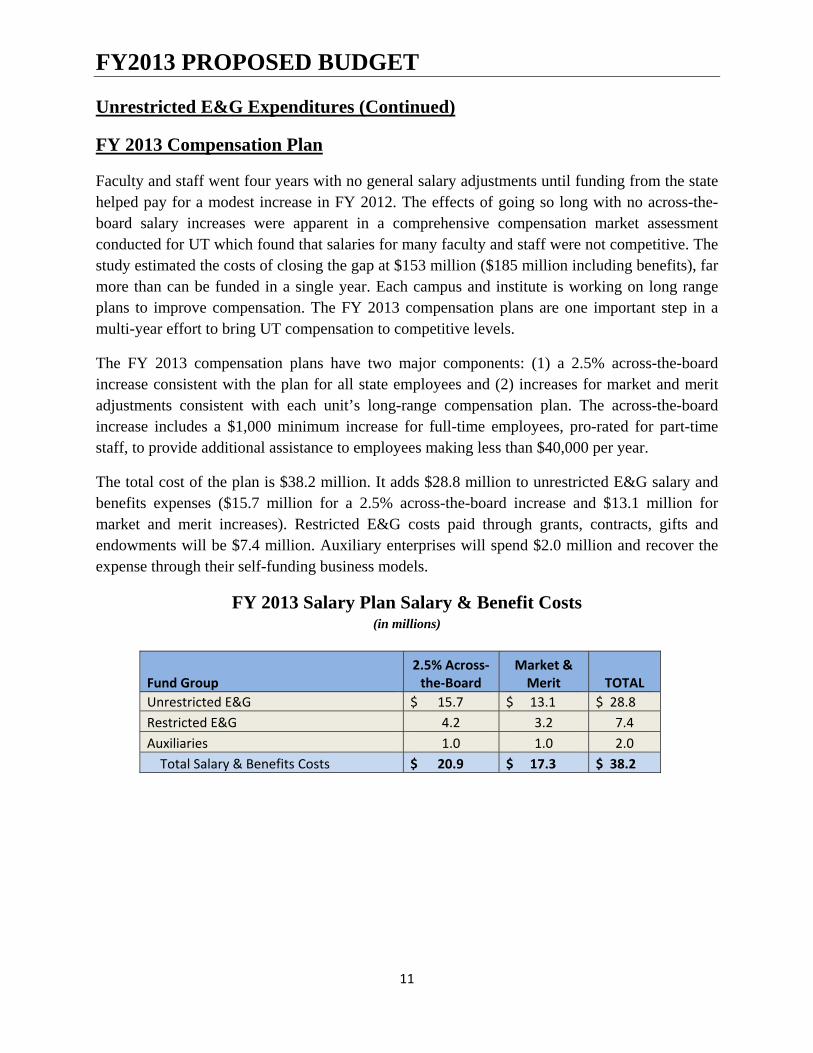
The total cost of the plan is $38.2 million. It adds $28.8 million to unrestricted E&G salary and benefits expenses ($15.7 million for a 2.5% across-the-board increase and $13.1 million for market and merit increases). Restricted E&G costs paid through grants, contracts, gifts and endowments will be $7.4 million. Auxiliary enterprises will spend $2.0 million and recover the expense through their self-funding business models.
FY 2013 Salary Plan Salary & Benefit Costs (in millions)
Fund Group 2.5% Across‐the‐Board
Market & Merit TOTAL
Unrestricted E&G $ 15.7 $ 13.1 $ 28.8
Restricted E&G 4.2 3.2 7.4
Auxiliaries 1.0 1.0 2.0
Total Salary & Benefits Costs $ 20.9 $ 17.3 $ 38.2
FY2013 PROPOSED BUDGET
12
Auxiliary Enterprises
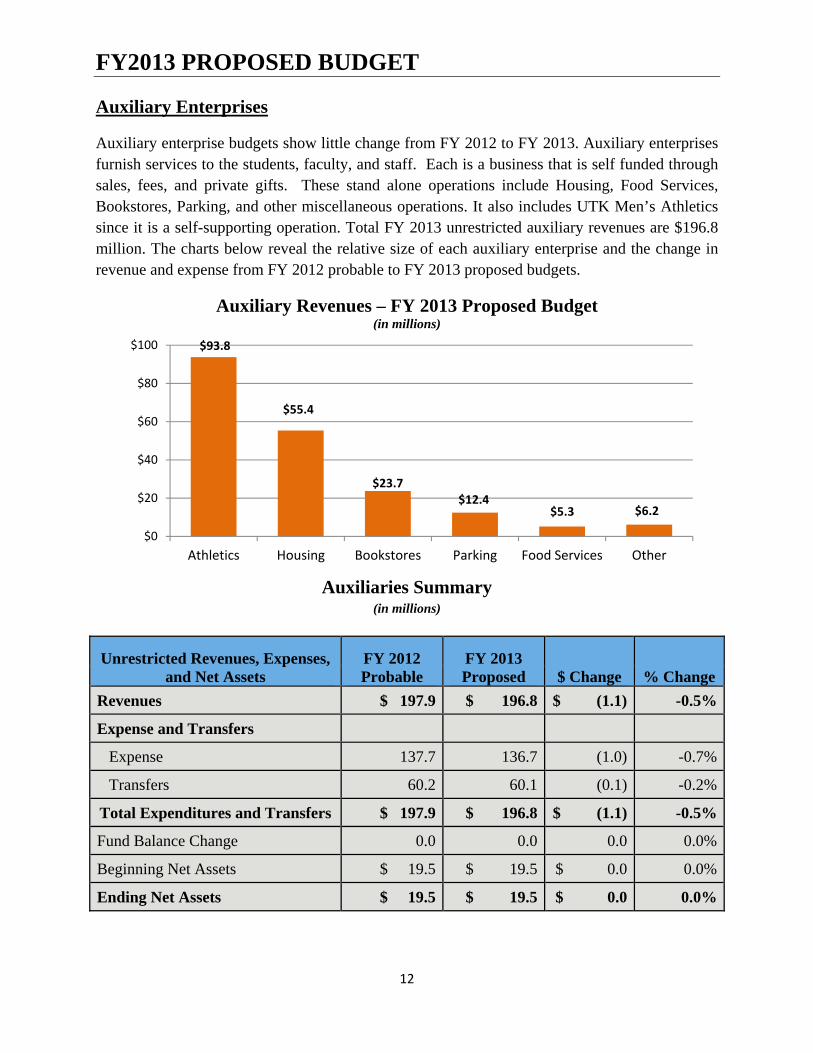
Auxiliary enterprise budgets show little change from FY 2012 to FY 2013. Auxiliary enterprises furnish services to the students, faculty, and staff. Each is a business that is self funded through sales, fees, and private gifts. These stand alone operations include Housing, Food Services, Bookstores, Parking, and other miscellaneous operations. It also includes UTK Men’s Athletics since it is a self-supporting operation. Total FY 2013 unrestricted auxiliary revenues are $196.8 million. The charts below reveal the relative size of each auxiliary enterprise and the change in revenue and expense from FY 2012 probable to FY 2013 proposed budgets.
Auxiliary Revenues – FY 2013 Proposed Budget (in millions)
Auxiliaries Summary (in millions)
Unrestricted Revenues, Expenses, and Net Assets
FY 2012 Probable
FY 2013 Proposed $ Change % Change
Revenues $ 197.9 $ 196.8 $ (1.1) -0.5%
Expense and Transfers
Expense 137.7 136.7 (1.0) -0.7%
Transfers 60.2 60.1 (0.1) -0.2%
Total Expenditures and Transfers $ 197.9 $ 196.8 $ (1.1) -0.5%
Fund Balance Change 0.0 0.0 0.0 0.0%
Beginning Net Assets $ 19.5 $ 19.5 $ 0.0 0.0%
Ending Net Assets $ 19.5 $ 19.5 $ 0.0 0.0%
$93.8
$55.4
$23.7$12.4
$5.3 $6.2
$0
$20
$40
$60
$80
$100
Athletics Housing Bookstores Parking Food Services Other
FY2013 PROPOSED BUDGET
13
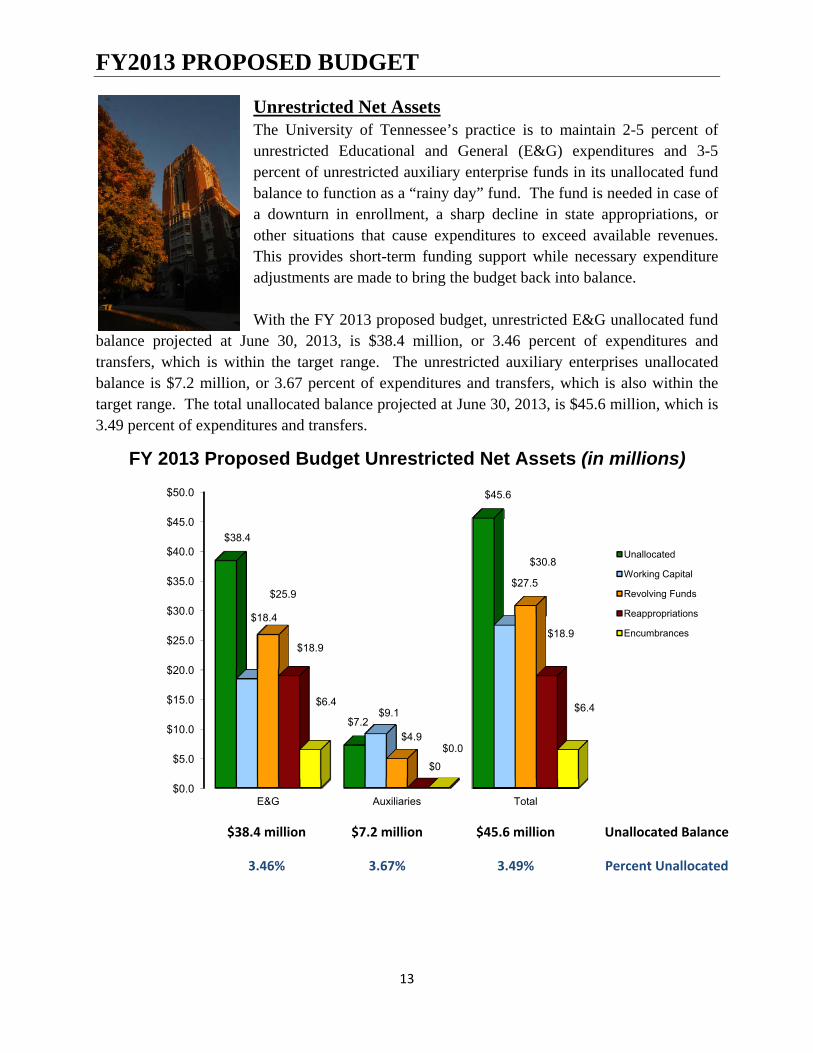
Unrestricted Net Assets The University of Tennessee’s practice is to maintain 2-5 percent of unrestricted Educational and General (E&G) expenditures and 3-5 percent of unrestricted auxiliary enterprise funds in its unallocated fund balance to function as a “rainy day” fund. The fund is needed in case of a downturn in enrollment, a sharp decline in state appropriations, or other situations that cause expenditures to exceed available revenues. This provides short-term funding support while necessary expenditure adjustments are made to bring the budget back into balance. With the FY 2013 proposed budget, unrestricted E&G unallocated fund
balance projected at June 30, 2013, is $38.4 million, or 3.46 percent of expenditures and transfers, which is within the target range. The unrestricted auxiliary enterprises unallocated balance is $7.2 million, or 3.67 percent of expenditures and transfers, which is also within the target range. The total unallocated balance projected at June 30, 2013, is $45.6 million, which is 3.49 percent of expenditures and transfers.
FY 2013 Proposed Budget Unrestricted Net Assets (in millions)
$38.4 million
3.46%
$7.2 million
3.67%
$45.6 million
3.49%
Unallocated Balance
Percent Unallocated
$0.0
$5.0
$10.0
$15.0
$20.0
$25.0
$30.0
$35.0
$40.0
$45.0
$50.0
E&G Auxiliaries Total
$38.4
$7.2
$45.6
$18.4
$9.1
$27.5$25.9
$4.9
$30.8
$18.9
$0
$18.9
$6.4
$0.0
$6.4
Unallocated
Working Capital
Revolving Funds
Reappropriations
Encumbrances
FY2013 PROPOSED BUDGET
14
Recommendation The FY 2013 Educational and General (E&G) and Auxiliary Enterprises Proposed budgets are balanced and within available resources. The Proposed Budget complies with all applicable policies and guidelines. The following action by the Board of Trustees is recommended:
1. The FY 2013 proposed operating budget is approved with the understanding that if the General Assembly or the Department of Finance and Administration further alters the FY 2013 appropriations or if changes in estimated resources require, the budget shall be modified accordingly so expenditures will not exceed available resources.
2. The Board of Trustees expressly authorizes the campus, institute, and unit
administrations, in response to budget reductions or a budgetary shortfall, to implement mandatory furloughs without pay, reduction of time worked, across-the-board salary reductions, and similar salary-related measures during FY 2013, subject to approval by the Executive and Compensation Committee, the President, and the Treasurer and Interim Chief Financial Officer in consultation with the General Counsel and Human Resources.
3. The proposed fee and tuition schedules are adopted for FY 2012-13.
4. The proposed FY 2013 salary and wage compensation plan and the FY 2013 Compensation Guidelines are approved.
5. Any additional general salary increases that exceed the FY 2013 salary and wage plan may only be granted upon approval by the Board of Trustees.
6. Any remaining balance of Net Assets may be considered as a reserve for contingencies to be used for:
a) Employing additional staff where enrollments and reorganization requirements warrant;
b) Modifying departmental operating budgets where changing conditions during the year require funding adjustments;
c) Funding to make salary adjustments for personnel as may be necessary during the year in keeping with state and university salary guidelines;
d) Improving physical facilities for academic and research departments as opportunities arise;
e) Mandated cost increases; and f) State impoundment of funds or appropriations rescission during the budget year.
All such changes shall be reported to the Board in a Revised Budget for the Board’s approval.
FY2013 PROPOSED BUDGET
15
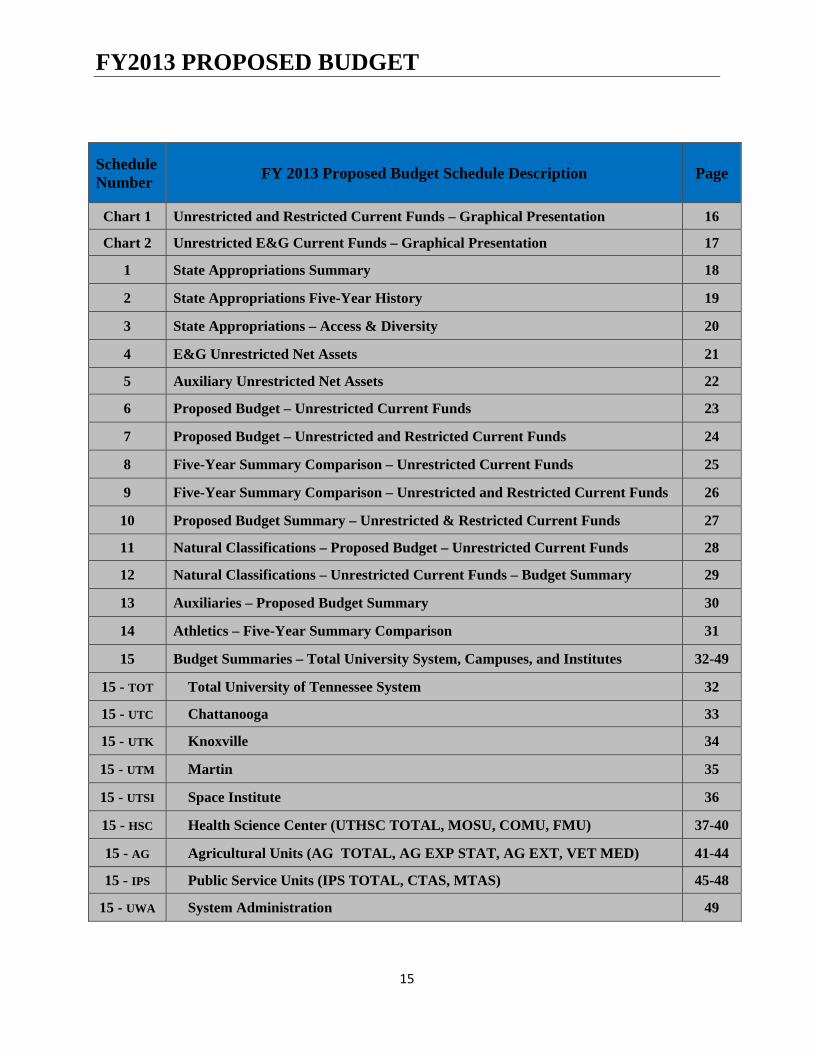
Schedule Number
FY 2013 Proposed Budget Schedule Description Page
Chart 1 Unrestricted and Restricted Current Funds – Graphical Presentation 16
Chart 2 Unrestricted E&G Current Funds – Graphical Presentation 17
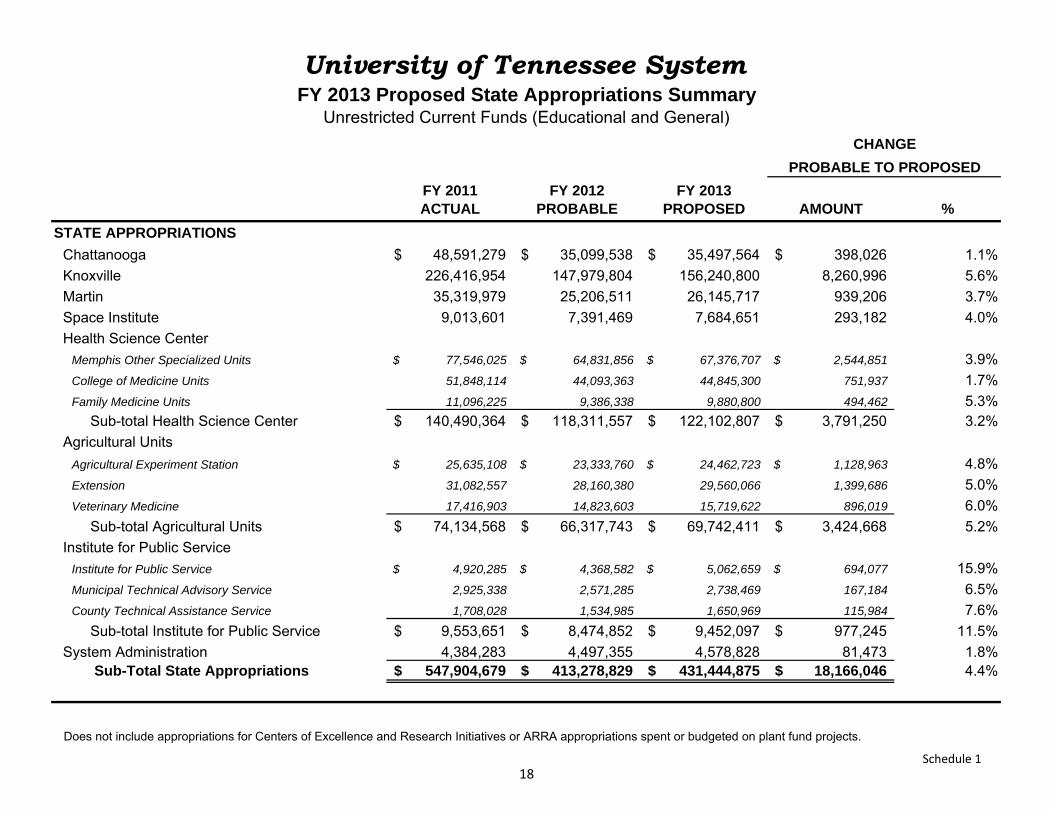
1 State Appropriations Summary 18
2 State Appropriations Five-Year History 19
3 State Appropriations – Access & Diversity 20
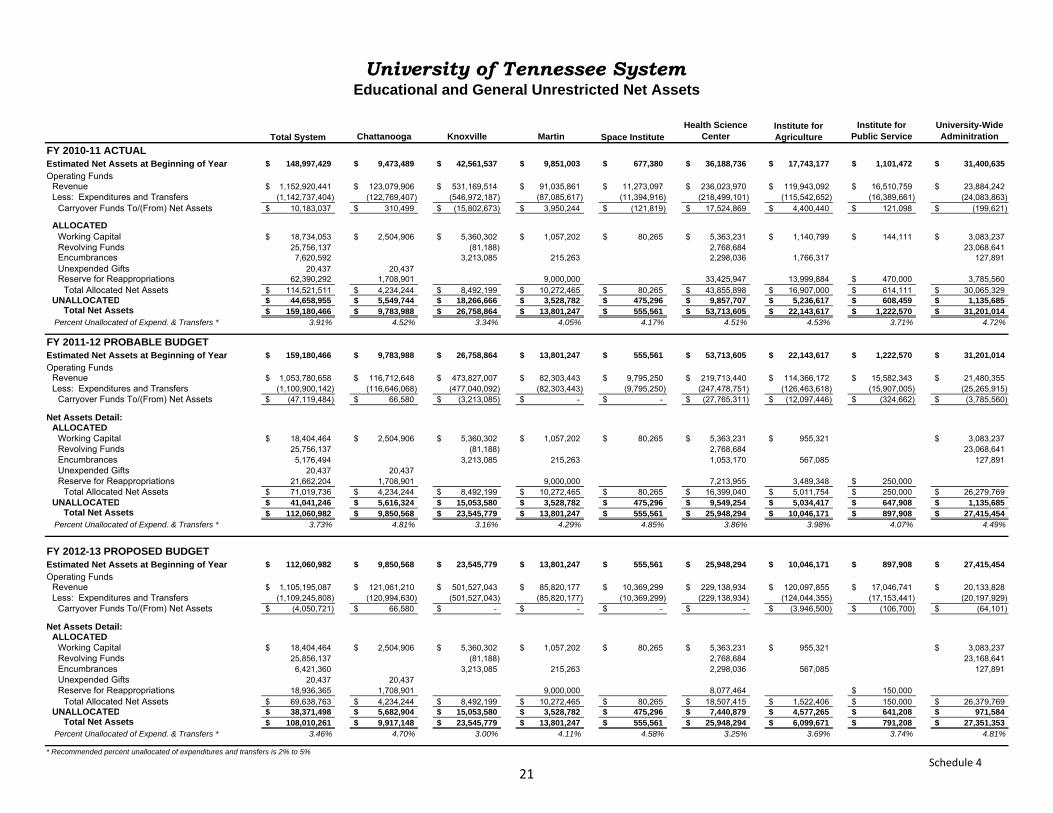
4 E&G Unrestricted Net Assets 21
5 Auxiliary Unrestricted Net Assets 22
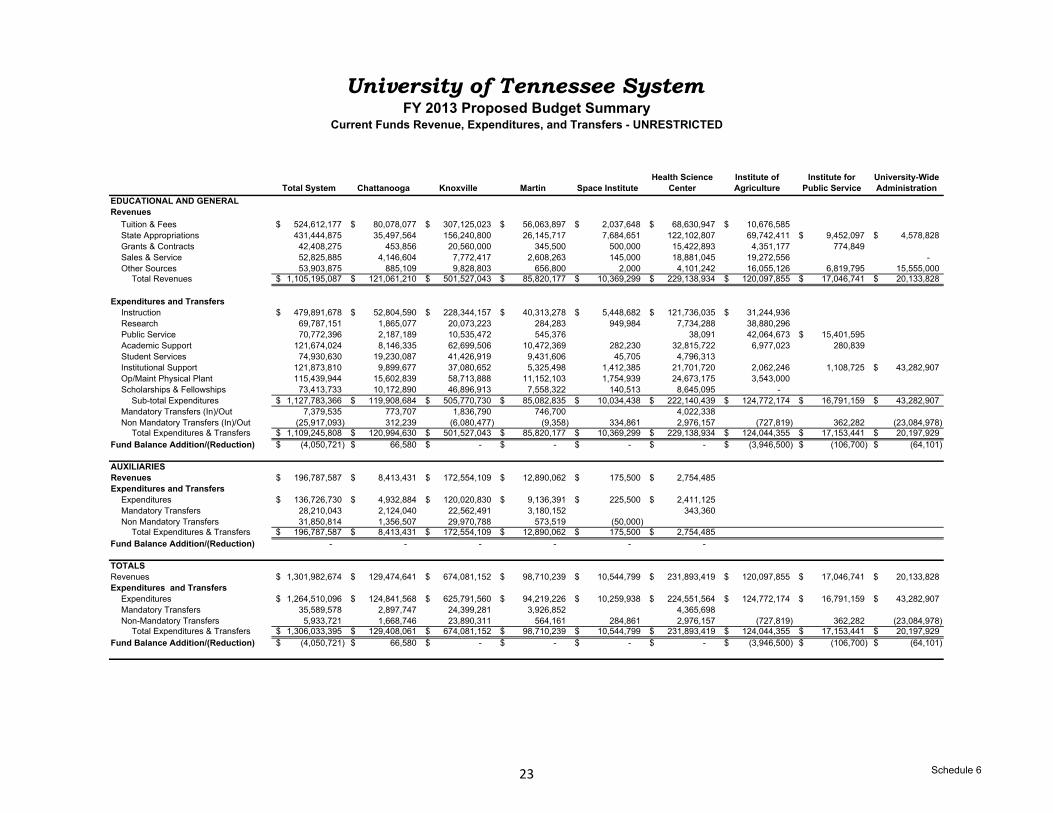
6 Proposed Budget – Unrestricted Current Funds 23
7 Proposed Budget – Unrestricted and Restricted Current Funds 24
8 Five-Year Summary Comparison – Unrestricted Current Funds 25
9 Five-Year Summary Comparison – Unrestricted and Restricted Current Funds 26
10 Proposed Budget Summary – Unrestricted & Restricted Current Funds 27
11 Natural Classifications – Proposed Budget – Unrestricted Current Funds 28
12 Natural Classifications – Unrestricted Current Funds – Budget Summary 29
13 Auxiliaries – Proposed Budget Summary 30
14 Athletics – Five-Year Summary Comparison 31
15 Budget Summaries – Total University System, Campuses, and Institutes 32-49
15 - TOT Total University of Tennessee System 32
15 - UTC Chattanooga 33
15 - UTK Knoxville 34
15 - UTM Martin 35
15 - UTSI Space Institute 36
15 - HSC Health Science Center (UTHSC TOTAL, MOSU, COMU, FMU) 37-40
15 - AG Agricultural Units (AG TOTAL, AG EXP STAT, AG EXT, VET MED) 41-44
15 - IPS Public Service Units (IPS TOTAL, CTAS, MTAS) 45-48
15 - UWA System Administration 49
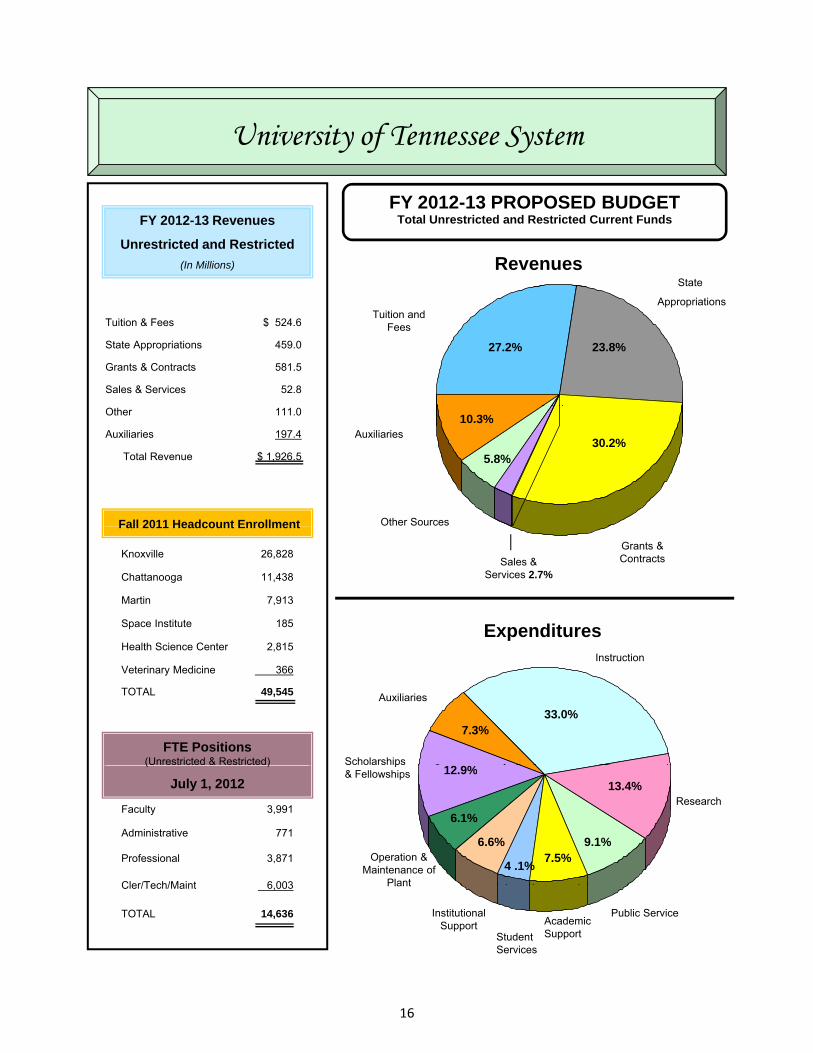
University of Tennessee System
FY 2012-13 PROPOSED BUDGETTotal Unrestricted and Restricted Current Funds
RevenuesState
FY 2012-13 Revenues
Unrestricted and Restricted
(In Millions)
Appropriations Tuition and
Fees
27.2% 23.8%
Tuition & Fees $ 524.6
State Appropriations 459.0
Grants & Contracts 581.5
Sales & Services 52.8
5.8%30.2%
Auxiliaries10.3%
Fall 2011 Headcount Enrollment Other Sources
Other 111.0
Auxiliaries 197.4
Total Revenue $ 1,926.5
Expenditures
Sales & Services 2.7%
Grants & Contracts
Fall 2011 Headcount Enrollment
Knoxville 26,828
Chattanooga 11,438
Martin 7,913
Space Institute 185
Health Science Center 2 815
33.0%
FTE Positions (Unrestricted & Restricted)
Instruction
Scholarships
Auxiliaries
12 9%
7.3%
Health Science Center 2,815
Veterinary Medicine 366
TOTAL 49,545
Research
9.1%
Faculty 3,991
Administrative 771
Professional 3,871
Cler/Tech/Maint 6 003
( )
July 1, 2012
Operation & Maintenance of
Plant
7.5%
p& Fellowships
6.1%
13.4%
6.6%
12.9%
4 .1%
Institutional Support Academic
Support Student Services
Public Service
Cler/Tech/Maint 6,003
TOTAL 14,636
Plant
16
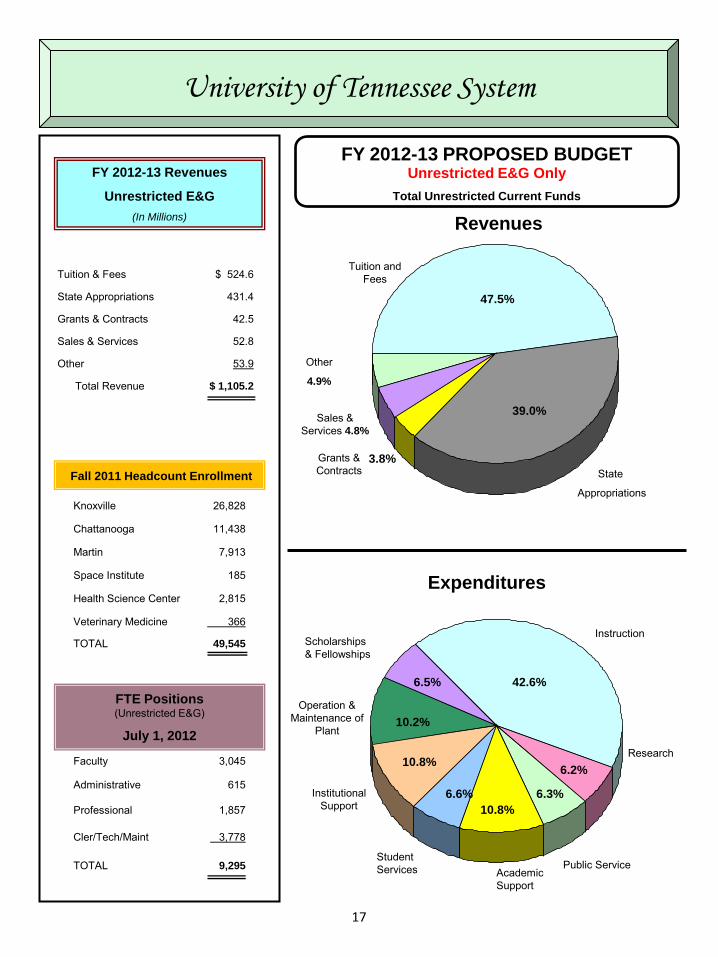
FY 2012-13 PROPOSED BUDGET Unrestricted E&G Only
Total Unrestricted Current Funds
Research
Institutional Support
Academic Support
Student Services
Expenditures
42.6%
Public Service
Revenues
State
Appropriations
Tuition and Fees
47.5%
39.0% Sales & Services 4.8%
6.3%
Faculty 3,045
Administrative 615
Professional 1,857
Cler/Tech/Maint 3,778
TOTAL 9,295
FTE Positions (Unrestricted E&G)
July 1, 2012
Grants & Contracts
Instruction
Operation & Maintenance of
Plant
10.8%
Scholarships & Fellowships
10.8%
3.8%
6.2%
6.6%
10.2%
6.5%
Fall 2011 Headcount Enrollment
Other
4.9%
Knoxville 26,828
Chattanooga 11,438
Martin 7,913
Space Institute 185
Health Science Center 2,815
Veterinary Medicine 366
TOTAL
49,545
University of Tennessee System
FY 2012-13 Revenues
Unrestricted E&G
(In Millions)
Tuition & Fees $ 524.6
State Appropriations 431.4
Grants & Contracts 42.5
Sales & Services 52.8
Other 53.9
Total Revenue $ 1,105.2
17
FY 2011 ACTUAL
FY 2012 PROBABLE
FY 2013 PROPOSED AMOUNT %
STATE APPROPRIATIONS
Chattanooga 48,591,279$ 35,099,538$ 35,497,564$ 398,026$ 1.1%Knoxville 226,416,954 147,979,804 156,240,800 8,260,996 5.6%Martin 35,319,979 25,206,511 26,145,717 939,206 3.7%Space Institute 9,013,601 7,391,469 7,684,651 293,182 4.0%Health Science Center
Memphis Other Specialized Units 77,546,025$ 64,831,856$ 67,376,707$ 2,544,851$ 3.9%College of Medicine Units 51,848,114 44,093,363 44,845,300 751,937 1.7%Family Medicine Units 11,096,225 9,386,338 9,880,800 494,462 5.3%
Sub-total Health Science Center 140,490,364$ 118,311,557$ 122,102,807$ 3,791,250$ 3.2%Agricultural Units
Agricultural Experiment Station 25,635,108$ 23,333,760$ 24,462,723$ 1,128,963$ 4.8%Extension 31,082,557 28,160,380 29,560,066 1,399,686 5.0%Veterinary Medicine 17,416,903 14,823,603 15,719,622 896,019 6.0%
Sub-total Agricultural Units 74,134,568$ 66,317,743$ 69,742,411$ 3,424,668$ 5.2%Institute for Public Service
Institute for Public Service 4,920,285$ 4,368,582$ 5,062,659$ 694,077$ 15.9%Municipal Technical Advisory Service 2,925,338 2,571,285 2,738,469 167,184 6.5%County Technical Assistance Service 1,708,028 1,534,985 1,650,969 115,984 7.6%
Sub-total Institute for Public Service 9,553,651$ 8,474,852$ 9,452,097$ 977,245$ 11.5%System Administration 4,384,283 4,497,355 4,578,828 81,473 1.8%
Sub-Total State Appropriations 547,904,679$ 413,278,829$ 431,444,875$ 18,166,046$ 4.4%
Does not include appropriations for Centers of Excellence and Research Initiatives or ARRA appropriations spent or budgeted on plant fund projects.
University of Tennessee SystemFY 2013 Proposed State Appropriations Summary
Unrestricted Current Funds (Educational and General)CHANGE
PROBABLE TO PROPOSED
Schedule 118

FY 2009 ACTUAL
FY 2010 ACTUAL
FY 2011 ACTUAL
FY 2012 PROBABLE
FY 2013 PROPOSED AMOUNT % (1)
STATE APPROPRIATIONS
Chattanooga 43,330,000$ 45,848,095$ 48,591,279$ 35,099,538$ 35,497,564$ (7,832,436)$ -18.1%Knoxville 183,109,300 190,749,695 226,416,954 147,979,804 156,240,800 (26,868,500) -14.7%Martin 31,480,300 33,629,882 35,319,979 25,206,511 26,145,717 (5,334,583) -16.9%Space Institute 7,955,900 8,304,400 9,013,601 7,391,469 7,684,651 (271,249) -3.4%Health Science Center
Memphis Other Specialized Units 70,001,900$ 70,224,887$ 77,546,025$ 64,831,856$ 67,376,707$ (2,625,193)$ -3.8%College of Medicine Units 46,745,500 46,280,784 51,848,114 44,093,363 44,845,300 (1,900,200) -4.1%Family Medicine Units 9,713,100 9,929,437 11,096,225 9,386,338 9,880,800 167,700 1.7%
Sub-total Health Science Center 126,460,500$ 126,435,108$ 140,490,364$ 118,311,557$ 122,102,807$ (4,357,693)$ -3.4%Agricultural Units
Agricultural Experiment Station 24,093,200$ 26,753,807$ 25,635,108$ 23,333,760$ 24,462,723$ 369,523$ 1.5%Extension 29,009,600 31,614,019 31,082,557 28,160,380 29,560,066 550,466 1.9%Veterinary Medicine 16,277,800 16,219,185 17,416,903 14,823,603 15,719,622 (558,178) -3.4%
Sub-total Agricultural Units 69,380,600$ 74,587,011$ 74,134,568$ 66,317,743$ 69,742,411$ 361,811$ 0.5%Institute for Public Service
Institute for Public Service 4,835,100$ 5,150,772$ 4,920,285$ 4,368,582$ 5,062,659$ 227,559$ 4.7%Municipal Technical Advisory Service 2,628,000 2,796,101 2,925,338 2,571,285 2,738,469 110,469 4.2%County Technical Assistance Service 1,540,000 1,669,011 1,708,028 1,534,985 1,650,969 110,969 7.2%
Sub-total Institute for Public Service 9,003,100$ 9,615,884$ 9,553,651$ 8,474,852$ 9,452,097$ 448,997$ 5.0%System Administration 4,773,400 4,485,900 4,384,283 4,497,355 4,578,828 (194,572) -4.1%
Total State Appropriations 475,493,100$ 493,655,975$ 547,904,679$ 413,278,829$ 431,444,875$ (44,048,225)$ -9.3%
Does not include appropriations for Centers of Excellence and Research Initiatives or ARRA appropriations spent or budgeted on plant fund projects.
Footnote:
(1) Figures in the percent change column were presented incorrectly in the Original FY 2012-13 Budget Document. This has been corrected as of 9-12-2012.
FY 2009 TO FY 2013
University of Tennessee SystemState Appropriations Five Year History
Unrestricted Current Funds (Educational and General)CHANGE
Schedule 2
19
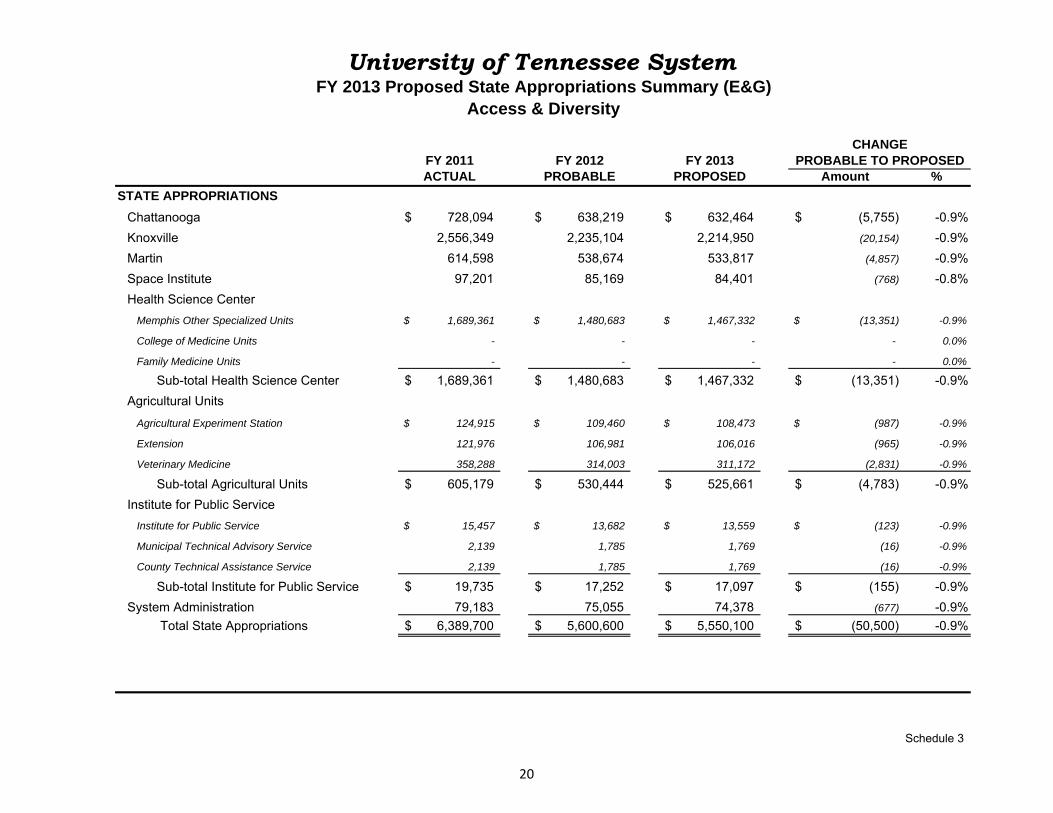
FY 2011 FY 2012 FY 2013ACTUAL PROBABLE PROPOSED Amount %
STATE APPROPRIATIONS
Chattanooga 728,094$ 638,219$ 632,464$ (5,755)$ -0.9%Knoxville 2,556,349 2,235,104 2,214,950 (20,154) -0.9%Martin 614,598 538,674 533,817 (4,857) -0.9%Space Institute 97,201 85,169 84,401 (768) -0.8%Health Science Center
Memphis Other Specialized Units 1,689,361$ 1,480,683$ 1,467,332$ (13,351)$ -0.9%
College of Medicine Units - - - - 0.0%
Family Medicine Units - - - - 0.0%
Sub-total Health Science Center 1,689,361$ 1,480,683$ 1,467,332$ (13,351)$ -0.9%Agricultural Units
Agricultural Experiment Station 124,915$ 109,460$ 108,473$ (987)$ -0.9%
Extension 121,976 106,981 106,016 (965) -0.9%
Veterinary Medicine 358,288 314,003 311,172 (2,831) -0.9%
Sub-total Agricultural Units 605,179$ 530,444$ 525,661$ (4,783)$ -0.9%Institute for Public Service
Institute for Public Service 15,457$ 13,682$ 13,559$ (123)$ -0.9%
Municipal Technical Advisory Service 2,139 1,785 1,769 (16) -0.9%
County Technical Assistance Service 2,139 1,785 1,769 (16) -0.9%
Sub-total Institute for Public Service 19,735$ 17,252$ 17,097$ (155)$ -0.9%System Administration 79,183 75,055 74,378 (677) -0.9%
Total State Appropriations 6,389,700$ 5,600,600$ 5,550,100$ (50,500)$ -0.9%
PROBABLE TO PROPOSED
University of Tennessee SystemFY 2013 Proposed State Appropriations Summary (E&G)
Access & Diversity
CHANGE
Schedule 3
20
Chattanooga Knoxville Martin
FY 2010-11 ACTUALEstimated Net Assets at Beginning of Year 148,997,429$ 9,473,489$ 42,561,537$ 9,851,003$ 677,380$ 36,188,736$ 17,743,177$ 1,101,472$ 31,400,635$
Operating FundsRevenue 1,152,920,441$ 123,079,906$ 531,169,514$ 91,035,861$ 11,273,097$ 236,023,970$ 119,943,092$ 16,510,759$ 23,884,242$ Less: Expenditures and Transfers (1,142,737,404) (122,769,407) (546,972,187) (87,085,617) (11,394,916) (218,499,101) (115,542,652) (16,389,661) (24,083,863)
Carryover Funds To/(From) Net Assets 10,183,037$ 310,499$ (15,802,673)$ 3,950,244$ (121,819)$ 17,524,869$ 4,400,440$ 121,098$ (199,621)$
ALLOCATEDWorking Capital 18,734,053$ 2,504,906$ 5,360,302$ 1,057,202$ 80,265$ 5,363,231$ 1,140,799$ 144,111$ 3,083,237$ Revolving Funds 25,756,137 (81,188) 2,768,684 23,068,641 Encumbrances 7,620,592 3,213,085 215,263 2,298,036 1,766,317 127,891 Unexpended Gifts 20,437 20,437 Reserve for Reappropriations 62,390,292 1,708,901 9,000,000 33,425,947 13,999,884 470,000$ 3,785,560
Total Allocated Net Assets 114,521,511$ 4,234,244$ 8,492,199$ 10,272,465$ 80,265$ 43,855,898$ 16,907,000$ 614,111$ 30,065,329$ UNALLOCATED 44,658,955$ 5,549,744$ 18,266,666$ 3,528,782$ 475,296$ 9,857,707$ 5,236,617$ 608,459$ 1,135,685$
Total Net Assets 159,180,466$ 9,783,988$ 26,758,864$ 13,801,247$ 555,561$ 53,713,605$ 22,143,617$ 1,222,570$ 31,201,014$ Percent Unallocated of Expend. & Transfers * 3.91% 4.52% 3.34% 4.05% 4.17% 4.51% 4.53% 3.71% 4.72%
FY 2011-12 PROBABLE BUDGETEstimated Net Assets at Beginning of Year 159,180,466$ 9,783,988$ 26,758,864$ 13,801,247$ 555,561$ 53,713,605$ 22,143,617$ 1,222,570$ 31,201,014$
Operating FundsRevenue 1,053,780,658$ 116,712,648$ 473,827,007$ 82,303,443$ 9,795,250$ 219,713,440$ 114,366,172$ 15,582,343$ 21,480,355$ Less: Expenditures and Transfers (1,100,900,142) (116,646,068) (477,040,092) (82,303,443) (9,795,250) (247,478,751) (126,463,618) (15,907,005) (25,265,915)
Carryover Funds To/(From) Net Assets (47,119,484)$ 66,580$ (3,213,085)$ -$ -$ (27,765,311)$ (12,097,446)$ (324,662)$ (3,785,560)$
Net Assets Detail:ALLOCATED
Working Capital 18,404,464$ 2,504,906$ 5,360,302$ 1,057,202$ 80,265$ 5,363,231$ 955,321$ 3,083,237$ Revolving Funds 25,756,137 (81,188) 2,768,684 23,068,641 Encumbrances 5,176,494 3,213,085 215,263 1,053,170 567,085 127,891 Unexpended Gifts 20,437 20,437 Reserve for Reappropriations 21,662,204 1,708,901 9,000,000 7,213,955 3,489,348 250,000$
Total Allocated Net Assets 71,019,736$ 4,234,244$ 8,492,199$ 10,272,465$ 80,265$ 16,399,040$ 5,011,754$ 250,000$ 26,279,769$ UNALLOCATED 41,041,246$ 5,616,324$ 15,053,580$ 3,528,782$ 475,296$ 9,549,254$ 5,034,417$ 647,908$ 1,135,685$
Total Net Assets 112,060,982$ 9,850,568$ 23,545,779$ 13,801,247$ 555,561$ 25,948,294$ 10,046,171$ 897,908$ 27,415,454$ Percent Unallocated of Expend. & Transfers * 3.73% 4.81% 3.16% 4.29% 4.85% 3.86% 3.98% 4.07% 4.49%
FY 2012-13 PROPOSED BUDGETEstimated Net Assets at Beginning of Year 112,060,982$ 9,850,568$ 23,545,779$ 13,801,247$ 555,561$ 25,948,294$ 10,046,171$ 897,908$ 27,415,454$
Operating FundsRevenue 1,105,195,087$ 121,061,210$ 501,527,043$ 85,820,177$ 10,369,299$ 229,138,934$ 120,097,855$ 17,046,741$ 20,133,828$ Less: Expenditures and Transfers (1,109,245,808) (120,994,630) (501,527,043) (85,820,177) (10,369,299) (229,138,934) (124,044,355) (17,153,441) (20,197,929)
Carryover Funds To/(From) Net Assets (4,050,721)$ 66,580$ -$ -$ -$ -$ (3,946,500)$ (106,700)$ (64,101)$
Net Assets Detail:ALLOCATED
Working Capital 18,404,464$ 2,504,906$ 5,360,302$ 1,057,202$ 80,265$ 5,363,231$ 955,321$ 3,083,237$ Revolving Funds 25,856,137 (81,188) 2,768,684 23,168,641 Encumbrances 6,421,360 3,213,085 215,263 2,298,036 567,085 127,891 Unexpended Gifts 20,437 20,437 Reserve for Reappropriations 18,936,365 1,708,901 9,000,000 8,077,464 150,000$
Total Allocated Net Assets 69,638,763$ 4,234,244$ 8,492,199$ 10,272,465$ 80,265$ 18,507,415$ 1,522,406$ 150,000$ 26,379,769$ UNALLOCATED 38,371,498$ 5,682,904$ 15,053,580$ 3,528,782$ 475,296$ 7,440,879$ 4,577,265$ 641,208$ 971,584$
Total Net Assets 108,010,261$ 9,917,148$ 23,545,779$ 13,801,247$ 555,561$ 25,948,294$ 6,099,671$ 791,208$ 27,351,353$ Percent Unallocated of Expend. & Transfers * 3.46% 4.70% 3.00% 4.11% 4.58% 3.25% 3.69% 3.74% 4.81%
* Recommended percent unallocated of expenditures and transfers is 2% to 5%
Total System Space InstituteInstitute for Agriculture
University of Tennessee SystemEducational and General Unrestricted Net Assets
Health Science Center
Institute for Public Service
University-Wide Adminitration
Schedule 421
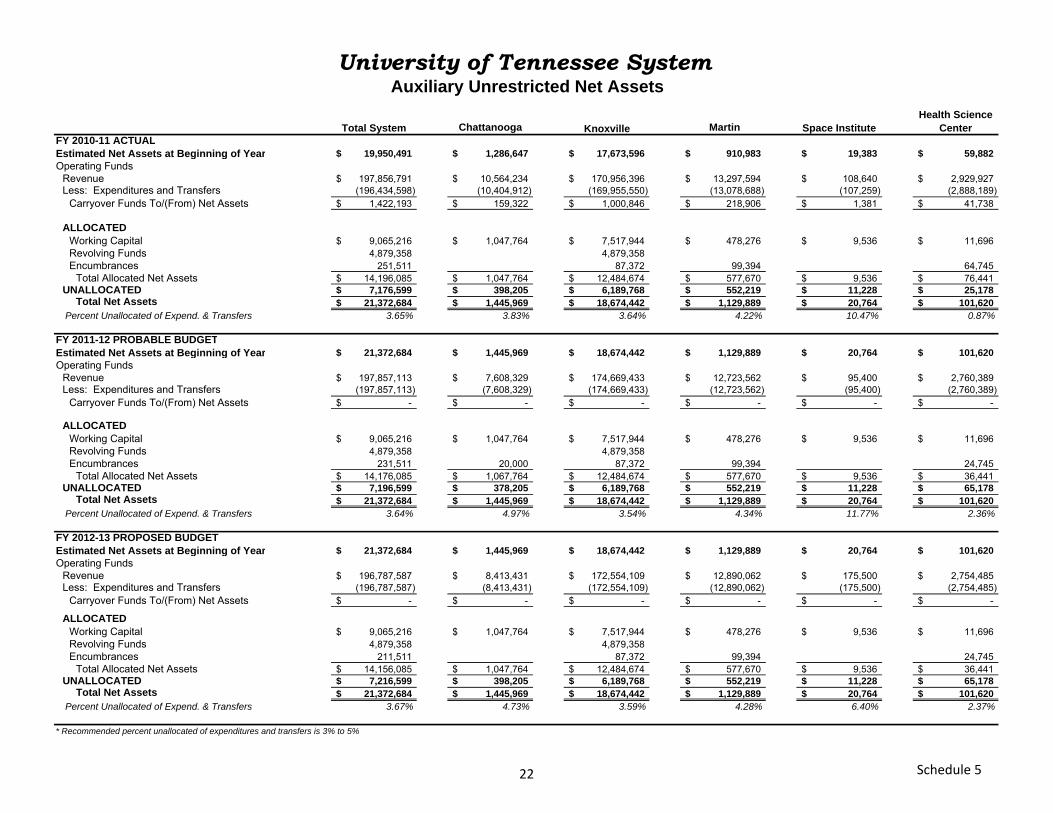
Chattanooga Knoxville MartinFY 2010-11 ACTUALEstimated Net Assets at Beginning of Year 19,950,491$ 1,286,647$ 17,673,596$ 910,983$ 19,383$ 59,882$ Operating Funds
Revenue 197,856,791$ 10,564,234$ 170,956,396$ 13,297,594$ 108,640$ 2,929,927$ Less: Expenditures and Transfers (196,434,598) (10,404,912) (169,955,550) (13,078,688) (107,259) (2,888,189)
Carryover Funds To/(From) Net Assets 1,422,193$ 159,322$ 1,000,846$ 218,906$ 1,381$ 41,738$
ALLOCATEDWorking Capital 9,065,216$ 1,047,764$ 7,517,944$ 478,276$ 9,536$ 11,696$ Revolving Funds 4,879,358 4,879,358 Encumbrances 251,511 87,372 99,394 64,745
Total Allocated Net Assets 14,196,085$ 1,047,764$ 12,484,674$ 577,670$ 9,536$ 76,441$ UNALLOCATED 7,176,599$ 398,205$ 6,189,768$ 552,219$ 11,228$ 25,178$
Total Net Assets 21,372,684$ 1,445,969$ 18,674,442$ 1,129,889$ 20,764$ 101,620$ Percent Unallocated of Expend. & Transfers 3.65% 3.83% 3.64% 4.22% 10.47% 0.87%
FY 2011-12 PROBABLE BUDGETEstimated Net Assets at Beginning of Year 21,372,684$ 1,445,969$ 18,674,442$ 1,129,889$ 20,764$ 101,620$ Operating Funds
Revenue 197,857,113$ 7,608,329$ 174,669,433$ 12,723,562$ 95,400$ 2,760,389$ Less: Expenditures and Transfers (197,857,113) (7,608,329) (174,669,433) (12,723,562) (95,400) (2,760,389)
Carryover Funds To/(From) Net Assets -$ -$ -$ -$ -$ -$
ALLOCATEDWorking Capital 9,065,216$ 1,047,764$ 7,517,944$ 478,276$ 9,536$ 11,696$ Revolving Funds 4,879,358 4,879,358 Encumbrances 231,511 20,000 87,372 99,394 24,745
Total Allocated Net Assets 14,176,085$ 1,067,764$ 12,484,674$ 577,670$ 9,536$ 36,441$ UNALLOCATED 7,196,599$ 378,205$ 6,189,768$ 552,219$ 11,228$ 65,178$
Total Net Assets 21,372,684$ 1,445,969$ 18,674,442$ 1,129,889$ 20,764$ 101,620$ Percent Unallocated of Expend. & Transfers 3.64% 4.97% 3.54% 4.34% 11.77% 2.36%
FY 2012-13 PROPOSED BUDGETEstimated Net Assets at Beginning of Year 21,372,684$ 1,445,969$ 18,674,442$ 1,129,889$ 20,764$ 101,620$ Operating Funds
Revenue 196,787,587$ 8,413,431$ 172,554,109$ 12,890,062$ 175,500$ 2,754,485$ Less: Expenditures and Transfers (196,787,587) (8,413,431) (172,554,109) (12,890,062) (175,500) (2,754,485)
Carryover Funds To/(From) Net Assets -$ -$ -$ -$ -$ -$
ALLOCATEDWorking Capital 9,065,216$ 1,047,764$ 7,517,944$ 478,276$ 9,536$ 11,696$ Revolving Funds 4,879,358 4,879,358 Encumbrances 211,511 87,372 99,394 24,745
Total Allocated Net Assets 14,156,085$ 1,047,764$ 12,484,674$ 577,670$ 9,536$ 36,441$ UNALLOCATED 7,216,599$ 398,205$ 6,189,768$ 552,219$ 11,228$ 65,178$
Total Net Assets 21,372,684$ 1,445,969$ 18,674,442$ 1,129,889$ 20,764$ 101,620$ Percent Unallocated of Expend. & Transfers 3.67% 4.73% 3.59% 4.28% 6.40% 2.37%
* Recommended percent unallocated of expenditures and transfers is 3% to 5%
University of Tennessee SystemAuxiliary Unrestricted Net Assets
Health Science CenterTotal System Space Institute
Schedule 522
Total System Chattanooga Knoxville Martin Space InstituteHealth Science
CenterInstitute of Agriculture
Institute for Public Service
University-Wide Administration
EDUCATIONAL AND GENERALRevenues
Tuition & Fees 524,612,177$ 80,078,077$ 307,125,023$ 56,063,897$ 2,037,648$ 68,630,947$ 10,676,585$ State Appropriations 431,444,875 35,497,564 156,240,800 26,145,717 7,684,651 122,102,807 69,742,411 9,452,097$ 4,578,828$ Grants & Contracts 42,408,275 453,856 20,560,000 345,500 500,000 15,422,893 4,351,177 774,849 Sales & Service 52,825,885 4,146,604 7,772,417 2,608,263 145,000 18,881,045 19,272,556 - Other Sources 53,903,875 885,109 9,828,803 656,800 2,000 4,101,242 16,055,126 6,819,795 15,555,000
Total Revenues 1,105,195,087$ 121,061,210$ 501,527,043$ 85,820,177$ 10,369,299$ 229,138,934$ 120,097,855$ 17,046,741$ 20,133,828$
Expenditures and TransfersInstruction 479,891,678$ 52,804,590$ 228,344,157$ 40,313,278$ 5,448,682$ 121,736,035$ 31,244,936$ Research 69,787,151 1,865,077 20,073,223 284,283 949,984 7,734,288 38,880,296 Public Service 70,772,396 2,187,189 10,535,472 545,376 38,091 42,064,673 15,401,595$ Academic Support 121,674,024 8,146,335 62,699,506 10,472,369 282,230 32,815,722 6,977,023 280,839 Student Services 74,930,630 19,230,087 41,426,919 9,431,606 45,705 4,796,313 Institutional Support 121,873,810 9,899,677 37,080,652 5,325,498 1,412,385 21,701,720 2,062,246 1,108,725 43,282,907$ Op/Maint Physical Plant 115,439,944 15,602,839 58,713,888 11,152,103 1,754,939 24,673,175 3,543,000 Scholarships & Fellowships 73,413,733 10,172,890 46,896,913 7,558,322 140,513 8,645,095 -
Sub-total Expenditures 1,127,783,366$ 119,908,684$ 505,770,730$ 85,082,835$ 10,034,438$ 222,140,439$ 124,772,174$ 16,791,159$ 43,282,907$ Mandatory Transfers (In)/Out 7,379,535 773,707 1,836,790 746,700 4,022,338 Non Mandatory Transfers (In)/Out (25,917,093) 312,239 (6,080,477) (9,358) 334,861 2,976,157 (727,819) 362,282 (23,084,978)
Total Expenditures & Transfers 1,109,245,808$ 120,994,630$ 501,527,043$ 85,820,177$ 10,369,299$ 229,138,934$ 124,044,355$ 17,153,441$ 20,197,929$ Fund Balance Addition/(Reduction) (4,050,721)$ 66,580$ -$ -$ -$ -$ (3,946,500)$ (106,700)$ (64,101)$
AUXILIARIESRevenues 196,787,587$ 8,413,431$ 172,554,109$ 12,890,062$ 175,500$ 2,754,485$ Expenditures and Transfers
Expenditures 136,726,730$ 4,932,884$ 120,020,830$ 9,136,391$ 225,500$ 2,411,125$ Mandatory Transfers 28,210,043 2,124,040 22,562,491 3,180,152 343,360 Non Mandatory Transfers 31,850,814 1,356,507 29,970,788 573,519 (50,000)
Total Expenditures & Transfers 196,787,587$ 8,413,431$ 172,554,109$ 12,890,062$ 175,500$ 2,754,485$ Fund Balance Addition/(Reduction) - - - - - -
TOTALSRevenues 1,301,982,674$ 129,474,641$ 674,081,152$ 98,710,239$ 10,544,799$ 231,893,419$ 120,097,855$ 17,046,741$ 20,133,828$ Expenditures and Transfers
Expenditures 1,264,510,096$ 124,841,568$ 625,791,560$ 94,219,226$ 10,259,938$ 224,551,564$ 124,772,174$ 16,791,159$ 43,282,907$ Mandatory Transfers 35,589,578 2,897,747 24,399,281 3,926,852 4,365,698 Non-Mandatory Transfers 5,933,721 1,668,746 23,890,311 564,161 284,861 2,976,157 (727,819) 362,282 (23,084,978)
Total Expenditures & Transfers 1,306,033,395$ 129,408,061$ 674,081,152$ 98,710,239$ 10,544,799$ 231,893,419$ 124,044,355$ 17,153,441$ 20,197,929$ Fund Balance Addition/(Reduction) (4,050,721)$ 66,580$ -$ -$ -$ -$ (3,946,500)$ (106,700)$ (64,101)$
University of Tennessee SystemFY 2013 Proposed Budget Summary
Current Funds Revenue, Expenditures, and Transfers - UNRESTRICTED
Schedule 623
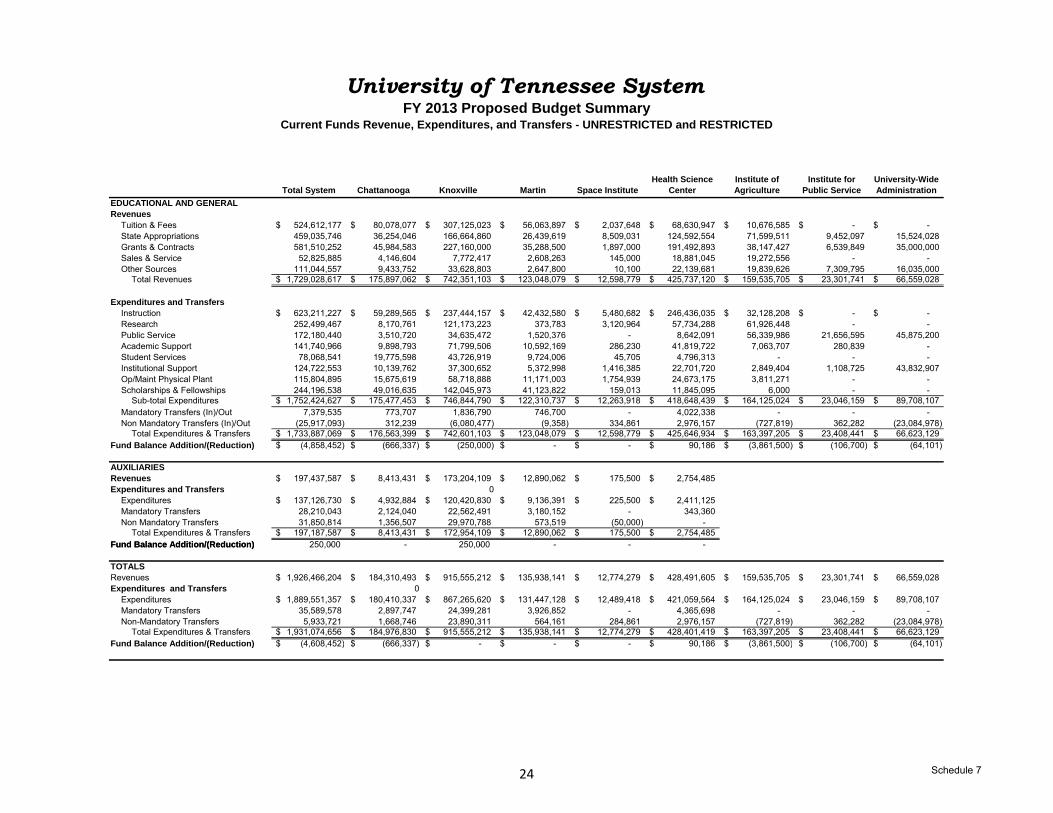
University of Tennessee SystemFY 2013 Proposed Budget Summary
Current Funds Revenue, Expenditures, and Transfers - UNRESTRICTED and RESTRICTED
Total System Chattanooga Knoxville Martin Space InstituteHealth Science
CenterInstitute of Agriculture
Institute for Public Service
University-Wide Administration
EDUCATIONAL AND GENERALRevenues
Tuition & Fees 524,612,177$ 80,078,077$ 307,125,023$ 56,063,897$ 2,037,648$ 68,630,947$ 10,676,585$ -$ -$ State Appropriations 459,035,746 36,254,046 166,664,860 26,439,619 8,509,031 124,592,554 71,599,511 9,452,097 15,524,028 Grants & Contracts 581,510,252 45,984,583 227,160,000 35,288,500 1,897,000 191,492,893 38,147,427 6,539,849 35,000,000 Sales & Service 52,825,885 4,146,604 7,772,417 2,608,263 145,000 18,881,045 19,272,556 - - , , , , , , , , , , , , ,Other Sources 111,044,557 9,433,752 33,628,803 2,647,800 10,100 22,139,681 19,839,626 7,309,795 16,035,000
Total Revenues 1,729,028,617$ 175,897,062$ 742,351,103$ 123,048,079$ 12,598,779$ 425,737,120$ 159,535,705$ 23,301,741$ 66,559,028$
Expenditures and TransfersInstruction 623,211,227$ 59,289,565$ 237,444,157$ 42,432,580$ 5,480,682$ 246,436,035$ 32,128,208$ -$ -$ Research 252,499,467 8,170,761 121,173,223 373,783 3,120,964 57,734,288 61,926,448 - - Public Service 172,180,440 3,510,720 34,635,472 1,520,376 - 8,642,091 56,339,986 21,656,595 45,875,200 Academic Support 141,740,966 9,898,793 71,799,506 10,592,169 286,230 41,819,722 7,063,707 280,839 - Student Services 78 068 541 19 775 598 43 726 919 9 724 006 45 705 4 796 313Student Services 78,068,541 19,775,598 43,726,919 9,724,006 45,705 4,796,313 - - - Institutional Support 124,722,553 10,139,762 37,300,652 5,372,998 1,416,385 22,701,720 2,849,404 1,108,725 43,832,907 Op/Maint Physical Plant 115,804,895 15,675,619 58,718,888 11,171,003 1,754,939 24,673,175 3,811,271 - - Scholarships & Fellowships 244,196,538 49,016,635 142,045,973 41,123,822 159,013 11,845,095 6,000 - -
Sub-total Expenditures 1,752,424,627$ 175,477,453$ 746,844,790$ 122,310,737$ 12,263,918$ 418,648,439$ 164,125,024$ 23,046,159$ 89,708,107$ Mandatory Transfers (In)/Out 7,379,535 773,707 1,836,790 746,700 - 4,022,338 - - - Non Mandatory Transfers (In)/Out (25,917,093) 312,239 (6,080,477) (9,358) 334,861 2,976,157 (727,819) 362,282 (23,084,978)
Total Expenditures & Transfers 1,733,887,069$ 176,563,399$ 742,601,103$ 123,048,079$ 12,598,779$ 425,646,934$ 163,397,205$ 23,408,441$ 66,623,129$ Fund Balance Addition/(Reduction) (4,858,452)$ (666,337)$ (250,000)$ -$ -$ 90,186$ (3,861,500)$ (106,700)$ (64,101)$
AUXILIARIESRevenues 197,437,587$ 8,413,431$ 173,204,109$ 12,890,062$ 175,500$ 2,754,485$ Expenditures and Transfers 0
Expenditures 137,126,730$ 4,932,884$ 120,420,830$ 9,136,391$ 225,500$ 2,411,125$ Mandatory Transfers 28,210,043 2,124,040 22,562,491 3,180,152 - 343,360 Non Mandatory Transfers 31,850,814 1,356,507 29,970,788 573,519 (50,000) -
Total Expenditures & Transfers 197,187,587$ 8,413,431$ 172,954,109$ 12,890,062$ 175,500$ 2,754,485$ Fund Balance Addition/(Reduction) - - - - - -Fund Balance Addition/(Reduction) 250,000 250,000
TOTALSRevenues 1,926,466,204$ 184,310,493$ 915,555,212$ 135,938,141$ 12,774,279$ 428,491,605$ 159,535,705$ 23,301,741$ 66,559,028$ Expenditures and Transfers 0
Expenditures 1,889,551,357$ 180,410,337$ 867,265,620$ 131,447,128$ 12,489,418$ 421,059,564$ 164,125,024$ 23,046,159$ 89,708,107$ Mandatory Transfers 35,589,578 2,897,747 24,399,281 3,926,852 - 4,365,698 - - - Non-Mandatory Transfers 5,933,721 1,668,746 23,890,311 564,161 284,861 2,976,157 (727,819) 362,282 (23,084,978)
Total Expenditures & Transfers 1,931,074,656$ 184,976,830$ 915,555,212$ 135,938,141$ 12,774,279$ 428,401,419$ 163,397,205$ 23,408,441$ 66,623,129$ Fund Balance Addition/(Reduction) (4 608 452)$ (666 337)$ $ $ $ 90 186$ (3 861 500)$ (106 700)$ (64 101)$Fund Balance Addition/(Reduction) (4,608,452)$ (666,337)$ -$ -$ -$ 90,186$ (3,861,500)$ (106,700)$ (64,101)$
Schedule 7 24
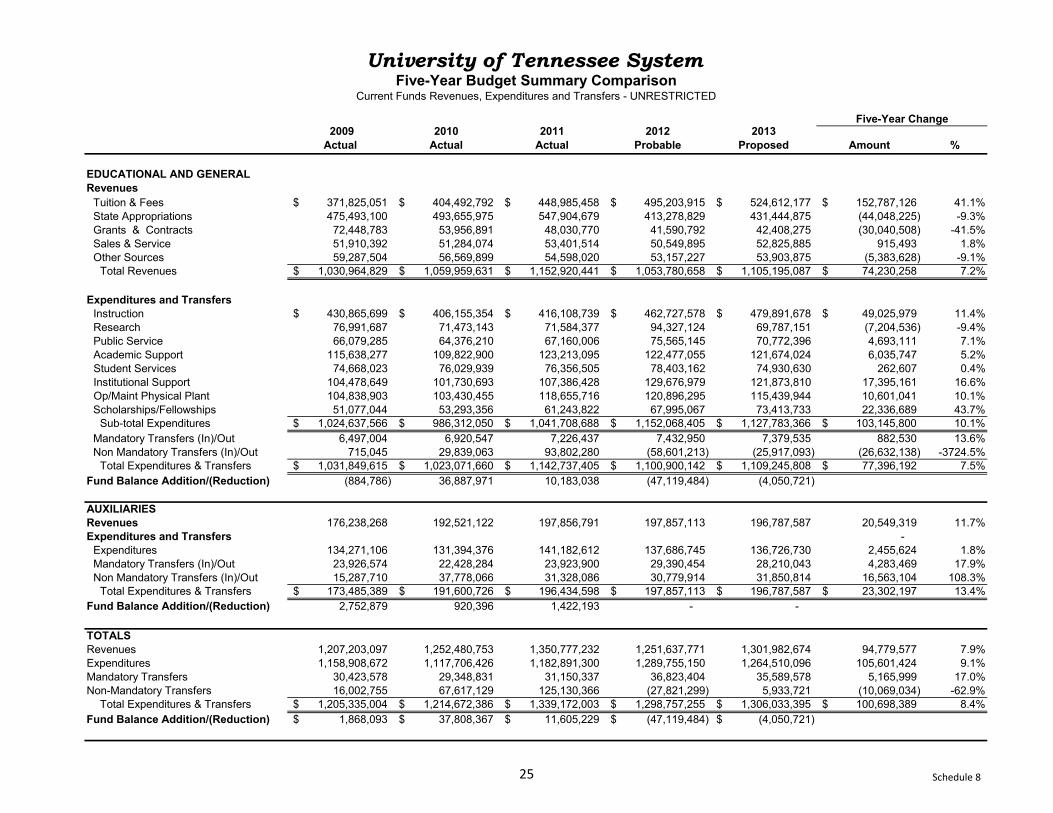
2009 Actual
2010 Actual
2011 Actual
2012 Probable
2013 Proposed Amount %
EDUCATIONAL AND GENERALRevenues
Tuition & Fees 371,825,051$ 404,492,792$ 448,985,458$ 495,203,915$ 524,612,177$ 152,787,126$ 41.1%State Appropriations 475,493,100 493,655,975 547,904,679 413,278,829 431,444,875 (44,048,225) -9.3%Grants & Contracts 72,448,783 53,956,891 48,030,770 41,590,792 42,408,275 (30,040,508) -41.5%Sales & Service 51,910,392 51,284,074 53,401,514 50,549,895 52,825,885 915,493 1.8%Other Sources 59,287,504 56,569,899 54,598,020 53,157,227 53,903,875 (5,383,628) -9.1%
Total Revenues 1,030,964,829$ 1,059,959,631$ 1,152,920,441$ 1,053,780,658$ 1,105,195,087$ 74,230,258$ 7.2%
Expenditures and TransfersInstruction 430,865,699$ 406,155,354$ 416,108,739$ 462,727,578$ 479,891,678$ 49,025,979$ 11.4%Research 76,991,687 71,473,143 71,584,377 94,327,124 69,787,151 (7,204,536) -9.4%Public Service 66,079,285 64,376,210 67,160,006 75,565,145 70,772,396 4,693,111 7.1%Academic Support 115,638,277 109,822,900 123,213,095 122,477,055 121,674,024 6,035,747 5.2%Student Services 74,668,023 76,029,939 76,356,505 78,403,162 74,930,630 262,607 0.4%Institutional Support 104,478,649 101,730,693 107,386,428 129,676,979 121,873,810 17,395,161 16.6%Op/Maint Physical Plant 104,838,903 103,430,455 118,655,716 120,896,295 115,439,944 10,601,041 10.1%Scholarships/Fellowships 51,077,044 53,293,356 61,243,822 67,995,067 73,413,733 22,336,689 43.7%
Sub-total Expenditures 1,024,637,566$ 986,312,050$ 1,041,708,688$ 1,152,068,405$ 1,127,783,366$ 103,145,800$ 10.1%
University of Tennessee SystemFive-Year Budget Summary Comparison
Current Funds Revenues, Expenditures and Transfers - UNRESTRICTED
Five-Year Change
p , , , , , , , , , , , , , , , ,Mandatory Transfers (In)/Out 6,497,004 6,920,547 7,226,437 7,432,950 7,379,535 882,530 13.6%Non Mandatory Transfers (In)/Out 715,045 29,839,063 93,802,280 (58,601,213) (25,917,093) (26,632,138) -3724.5%
Total Expenditures & Transfers 1,031,849,615$ 1,023,071,660$ 1,142,737,405$ 1,100,900,142$ 1,109,245,808$ 77,396,192$ 7.5%Fund Balance Addition/(Reduction) (884,786) 36,887,971 10,183,038 (47,119,484) (4,050,721)
AUXILIARIESRevenues 176,238,268 192,521,122 197,856,791 197,857,113 196,787,587 20,549,319 11.7%Expenditures and Transfers -
Expenditures 134,271,106 131,394,376 141,182,612 137,686,745 136,726,730 2,455,624 1.8%Mandatory Transfers (In)/Out 23,926,574 22,428,284 23,923,900 29,390,454 28,210,043 4,283,469 17.9%Non Mandatory Transfers (In)/Out 15,287,710 37,778,066 31,328,086 30,779,914 31,850,814 16,563,104 108.3%
Total Expenditures & Transfers 173,485,389$ 191,600,726$ 196,434,598$ 197,857,113$ 196,787,587$ 23,302,197$ 13.4%Fund Balance Addition/(Reduction) 2,752,879 920,396 1,422,193 - -
TOTALSRevenues 1,207,203,097 1,252,480,753 1,350,777,232 1,251,637,771 1,301,982,674 94,779,577 7.9%Expenditures 1,158,908,672 1,117,706,426 1,182,891,300 1,289,755,150 1,264,510,096 105,601,424 9.1%Mandatory Transfers 30,423,578 29,348,831 31,150,337 36,823,404 35,589,578 5,165,999 17.0%Non-Mandatory Transfers 16,002,755 67,617,129 125,130,366 (27,821,299) 5,933,721 (10,069,034) -62.9%
Total Expenditures & Transfers 1,205,335,004$ 1,214,672,386$ 1,339,172,003$ 1,298,757,255$ 1,306,033,395$ 100,698,389$ 8.4%Fund Balance Addition/(Reduction) 1,868,093$ 37,808,367$ 11,605,229$ (47,119,484)$ (4,050,721)$
Schedule 825
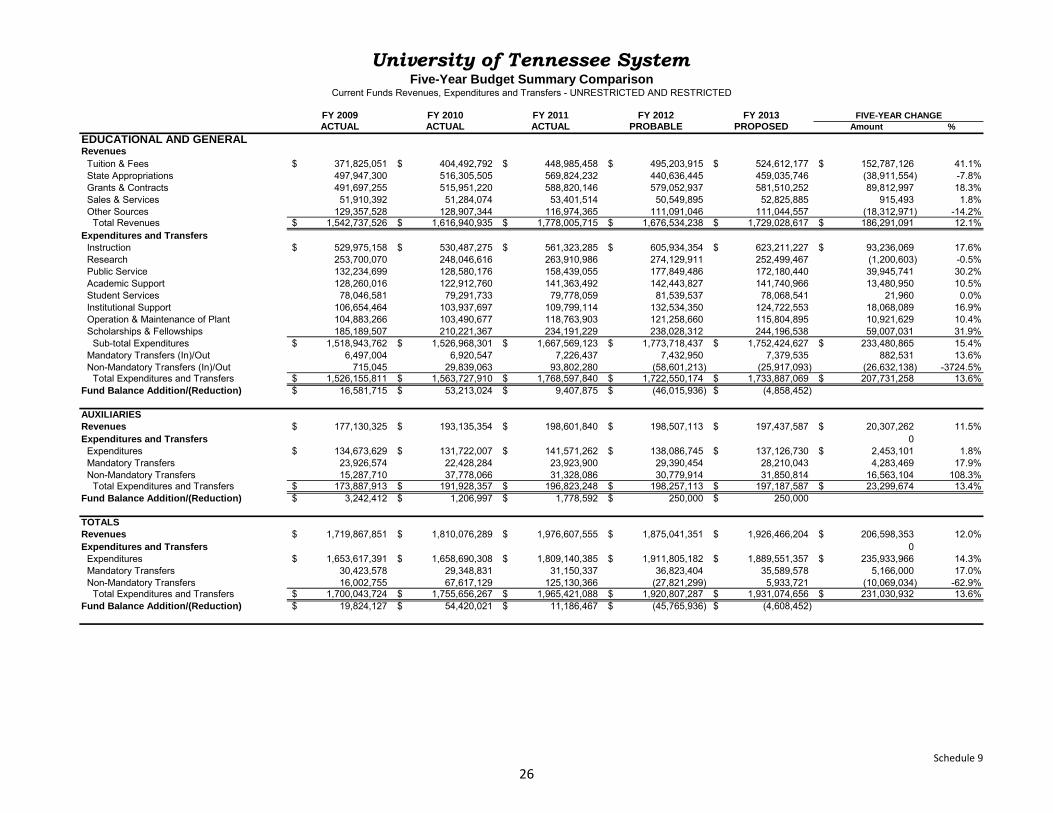
FY 2009 FY 2010 FY 2011 FY 2012 FY 2013ACTUAL ACTUAL ACTUAL PROBABLE PROPOSED Amount %
RevenuesTuition & Fees 371,825,051$ 404,492,792$ 448,985,458$ 495,203,915$ 524,612,177$ 152,787,126$ 41.1%State Appropriations 497,947,300 516,305,505 569,824,232 440,636,445 459,035,746 (38,911,554) -7.8%Grants & Contracts 491,697,255 515,951,220 588,820,146 579,052,937 581,510,252 89,812,997 18.3%Sales & Services 51,910,392 51,284,074 53,401,514 50,549,895 52,825,885 915,493 1.8%Other Sources 129,357,528 128,907,344 116,974,365 111,091,046 111,044,557 (18,312,971) -14.2%
Total Revenues 1,542,737,526$ 1,616,940,935$ 1,778,005,715$ 1,676,534,238$ 1,729,028,617$ 186,291,091$ 12.1%Expenditures and Transfers
Instruction 529,975,158$ 530,487,275$ 561,323,285$ 605,934,354$ 623,211,227$ 93,236,069$ 17.6%Research 253,700,070 248,046,616 263,910,986 274,129,911 252,499,467 (1,200,603) -0.5%Public Service 132,234,699 128,580,176 158,439,055 177,849,486 172,180,440 39,945,741 30.2%Academic Support 128,260,016 122,912,760 141,363,492 142,443,827 141,740,966 13,480,950 10.5%Student Services 78,046,581 79,291,733 79,778,059 81,539,537 78,068,541 21,960 0.0%Institutional Support 106,654,464 103,937,697 109,799,114 132,534,350 124,722,553 18,068,089 16.9%Operation & Maintenance of Plant 104,883,266 103,490,677 118,763,903 121,258,660 115,804,895 10,921,629 10.4%Scholarships & Fellowships 185,189,507 210,221,367 234,191,229 238,028,312 244,196,538 59,007,031 31.9%
Sub-total Expenditures 1,518,943,762$ 1,526,968,301$ 1,667,569,123$ 1,773,718,437$ 1,752,424,627$ 233,480,865$ 15.4%Mandatory Transfers (In)/Out 6,497,004 6,920,547 7,226,437 7,432,950 7,379,535 882,531 13.6%Non-Mandatory Transfers (In)/Out 715,045 29,839,063 93,802,280 (58,601,213) (25,917,093) (26,632,138) -3724.5%
Total Expenditures and Transfers 1,526,155,811$ 1,563,727,910$ 1,768,597,840$ 1,722,550,174$ 1,733,887,069$ 207,731,258$ 13.6%Fund Balance Addition/(Reduction) 16,581,715$ 53,213,024$ 9,407,875$ (46,015,936)$ (4,858,452)$
Revenues 177 130 325$ 193 135 354$ 198 601 840$ 198 507 113$ 197 437 587$ 20 307 262$ 11 5%
University of Tennessee SystemFive-Year Budget Summary Comparison
Current Funds Revenues, Expenditures and Transfers - UNRESTRICTED AND RESTRICTED
FIVE-YEAR CHANGE
EDUCATIONAL AND GENERAL
AUXILIARIESRevenues 177,130,325$ 193,135,354$ 198,601,840$ 198,507,113$ 197,437,587$ 20,307,262$ 11.5%Expenditures and Transfers 0
Expenditures 134,673,629$ 131,722,007$ 141,571,262$ 138,086,745$ 137,126,730$ 2,453,101$ 1.8%Mandatory Transfers 23,926,574 22,428,284 23,923,900 29,390,454 28,210,043 4,283,469 17.9%Non-Mandatory Transfers 15,287,710 37,778,066 31,328,086 30,779,914 31,850,814 16,563,104 108.3%
Total Expenditures and Transfers 173,887,913$ 191,928,357$ 196,823,248$ 198,257,113$ 197,187,587$ 23,299,674$ 13.4%Fund Balance Addition/(Reduction) 3,242,412$ 1,206,997$ 1,778,592$ 250,000$ 250,000$
Revenues 1,719,867,851$ 1,810,076,289$ 1,976,607,555$ 1,875,041,351$ 1,926,466,204$ 206,598,353$ 12.0%Expenditures and Transfers 0
Expenditures 1,653,617,391$ 1,658,690,308$ 1,809,140,385$ 1,911,805,182$ 1,889,551,357$ 235,933,966$ 14.3%Mandatory Transfers 30,423,578 29,348,831 31,150,337 36,823,404 35,589,578 5,166,000 17.0%Non-Mandatory Transfers 16,002,755 67,617,129 125,130,366 (27,821,299) 5,933,721 (10,069,034) -62.9%
Total Expenditures and Transfers 1,700,043,724$ 1,755,656,267$ 1,965,421,088$ 1,920,807,287$ 1,931,074,656$ 231,030,932$ 13.6%Fund Balance Addition/(Reduction) 19,824,127$ 54,420,021$ 11,186,467$ (45,765,936)$ (4,608,452)$
TOTALS
Schedule 9
26
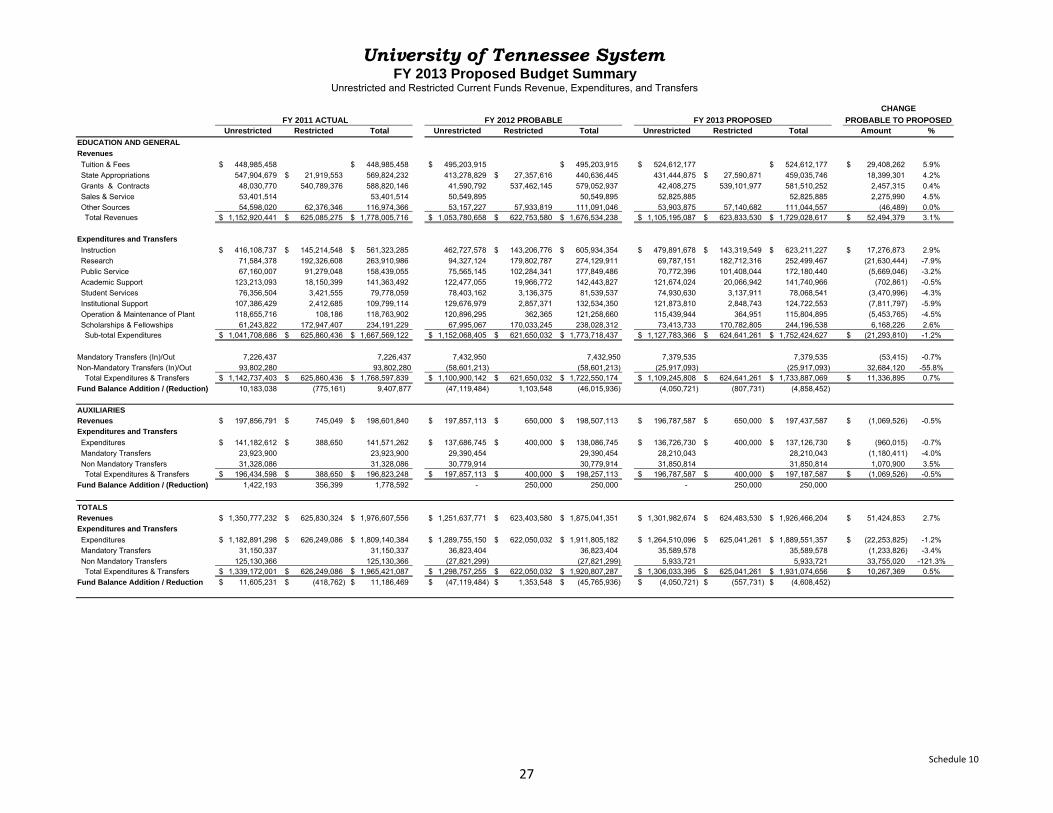
Unrestricted Restricted Total Unrestricted Restricted Total Unrestricted Restricted Total Amount %
EDUCATION AND GENERAL
Revenues
Tuition & Fees 448,985,458$ 448,985,458$ 495,203,915$ 495,203,915$ 524,612,177$ 524,612,177$ 29,408,262$ 5.9%State Appropriations 547,904,679 21,919,553$ 569,824,232 413,278,829 27,357,616$ 440,636,445 431,444,875 27,590,871$ 459,035,746 18,399,301 4.2%Grants & Contracts 48,030,770 540,789,376 588,820,146 41,590,792 537,462,145 579,052,937 42,408,275 539,101,977 581,510,252 2,457,315 0.4%Sales & Service 53,401,514 53,401,514 50,549,895 50,549,895 52,825,885 52,825,885 2,275,990 4.5%Other Sources 54,598,020 62,376,346 116,974,366 53,157,227 57,933,819 111,091,046 53,903,875 57,140,682 111,044,557 (46,489) 0.0%Total Revenues 1,152,920,441$ 625,085,275$ 1,778,005,716$ 1,053,780,658$ 622,753,580$ 1,676,534,238$ 1,105,195,087$ 623,833,530$ 1,729,028,617$ 52,494,379$ 3.1%
Expenditures and Transfers
Instruction 416,108,737$ 145,214,548$ 561,323,285$ 462,727,578 143,206,776$ 605,934,354$ 479,891,678$ 143,319,549$ 623,211,227$ 17,276,873$ 2.9%Research 71,584,378 192,326,608 263,910,986 94,327,124 179,802,787 274,129,911 69,787,151 182,712,316 252,499,467 (21,630,444) -7.9%Public Service 67,160,007 91,279,048 158,439,055 75,565,145 102,284,341 177,849,486 70,772,396 101,408,044 172,180,440 (5,669,046) -3.2%Academic Support 123,213,093 18,150,399 141,363,492 122,477,055 19,966,772 142,443,827 121,674,024 20,066,942 141,740,966 (702,861) -0.5%Student Services 76,356,504 3,421,555 79,778,059 78,403,162 3,136,375 81,539,537 74,930,630 3,137,911 78,068,541 (3,470,996) -4.3%Institutional Support 107,386,429 2,412,685 109,799,114 129,676,979 2,857,371 132,534,350 121,873,810 2,848,743 124,722,553 (7,811,797) -5.9%Operation & Maintenance of Plant 118,655,716 108,186 118,763,902 120,896,295 362,365 121,258,660 115,439,944 364,951 115,804,895 (5,453,765) -4.5%Scholarships & Fellowships 61,243,822 172,947,407 234,191,229 67,995,067 170,033,245 238,028,312 73,413,733 170,782,805 244,196,538 6,168,226 2.6%Sub-total Expenditures 1,041,708,686$ 625,860,436$ 1,667,569,122$ 1,152,068,405$ 621,650,032$ 1,773,718,437$ 1,127,783,366$ 624,641,261$ 1,752,424,627$ (21,293,810)$ -1.2%
Mandatory Transfers (In)/Out 7,226,437 7,226,437 7,432,950 7,432,950 7,379,535 7,379,535 (53,415) -0.7%Non-Mandatory Transfers (In)/Out 93,802,280 93,802,280 (58,601,213) (58,601,213) (25,917,093) (25,917,093) 32,684,120 -55.8%
Total Expenditures & Transfers 1,142,737,403$ 625,860,436$ 1,768,597,839$ 1,100,900,142$ 621,650,032$ 1,722,550,174$ 1,109,245,808$ 624,641,261$ 1,733,887,069$ 11,336,895$ 0.7%Fund Balance Addition / (Reduction) 10,183,038 (775,161) 9,407,877 (47,119,484) 1,103,548 (46,015,936) (4,050,721) (807,731) (4,858,452)
AUXILIARIES
Revenues 197,856,791$ 745,049$ 198,601,840$ 197,857,113$ 650,000$ 198,507,113$ 196,787,587$ 650,000$ 197,437,587$ (1,069,526)$ -0.5%Expenditures and Transfers
Expenditures 141,182,612$ 388,650$ 141,571,262 137,686,745$ 400,000$ 138,086,745$ 136,726,730$ 400,000$ 137,126,730$ (960,015)$ -0.7%Mandatory Transfers 23,923,900 23,923,900 29,390,454 29,390,454 28,210,043 28,210,043 (1,180,411) -4.0%Non Mandatory Transfers 31,328,086 31,328,086 30,779,914 30,779,914 31,850,814 31,850,814 1,070,900 3.5%Total Expenditures & Transfers 196,434,598$ 388,650$ 196,823,248$ 197,857,113$ 400,000$ 198,257,113$ 196,787,587$ 400,000$ 197,187,587$ (1,069,526)$ -0.5%
Fund Balance Addition / (Reduction) 1,422,193 356,399 1,778,592 - 250,000 250,000 - 250,000 250,000
TOTALS
Revenues 1,350,777,232$ 625,830,324$ 1,976,607,556$ 1,251,637,771$ 623,403,580$ 1,875,041,351$ 1,301,982,674$ 624,483,530$ 1,926,466,204$ 51,424,853$ 2.7%Expenditures and Transfers
Expenditures 1,182,891,298$ 626,249,086$ 1,809,140,384$ 1,289,755,150$ 622,050,032$ 1,911,805,182$ 1,264,510,096$ 625,041,261$ 1,889,551,357$ (22,253,825)$ -1.2%Mandatory Transfers 31,150,337 31,150,337 36,823,404 36,823,404 35,589,578 35,589,578 (1,233,826) -3.4%Non Mandatory Transfers 125,130,366 125,130,366 (27,821,299) (27,821,299) 5,933,721 5,933,721 33,755,020 -121.3%Total Expenditures & Transfers 1,339,172,001$ 626,249,086$ 1,965,421,087$ 1,298,757,255$ 622,050,032$ 1,920,807,287$ 1,306,033,395$ 625,041,261$ 1,931,074,656$ 10,267,369$ 0.5%
Fund Balance Addition / Reduction 11,605,231$ (418,762)$ 11,186,469$ (47,119,484)$ 1,353,548$ (45,765,936)$ (4,050,721)$ (557,731)$ (4,608,452)$
University of Tennessee SystemFY 2013 Proposed Budget Summary
Unrestricted and Restricted Current Funds Revenue, Expenditures, and Transfers
CHANGE
FY 2011 ACTUAL FY 2012 PROBABLE FY 2013 PROPOSED PROBABLE TO PROPOSED
Schedule 10
27
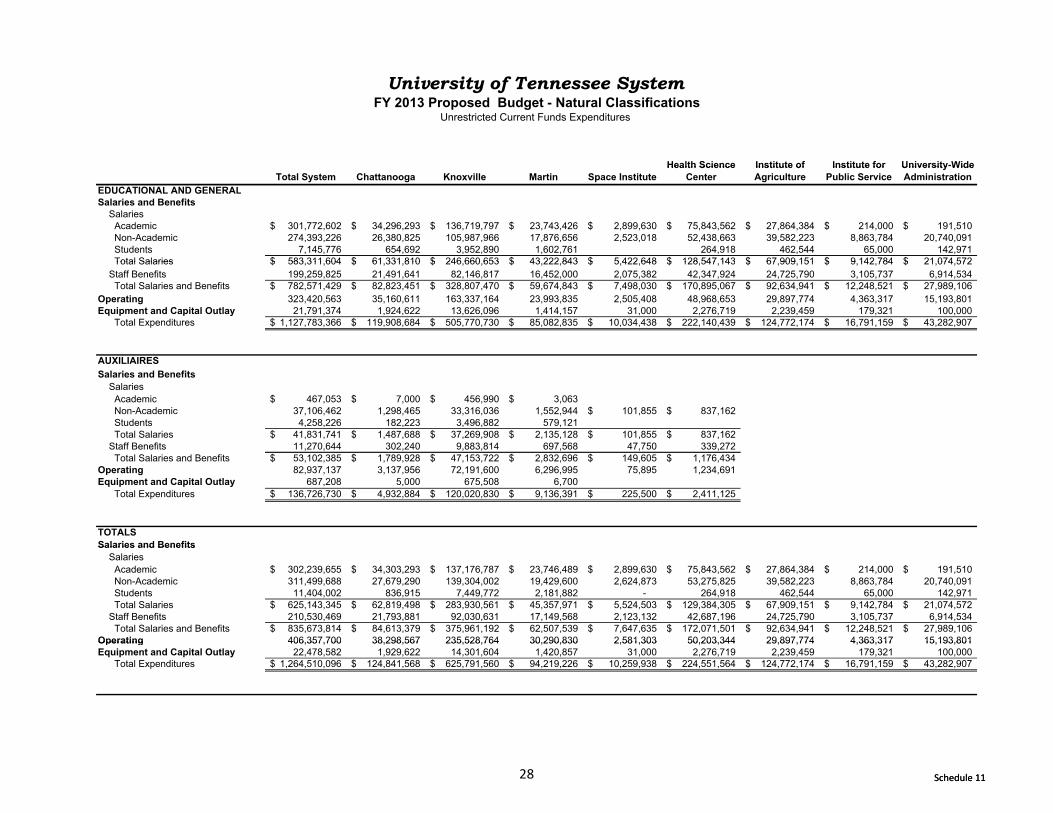
Health Science Institute of Institute for University-Wide
University of Tennessee SystemFY 2013 Proposed Budget - Natural Classifications
Unrestricted Current Funds Expenditures
Schedule 11
Total System Chattanooga Knoxville Martin Space InstituteHealth Science
CenterInstitute of Agriculture
Institute for Public Service
University Wide Administration
EDUCATIONAL AND GENERALSalaries and Benefits
SalariesAcademic 301,772,602$ 34,296,293$ 136,719,797$ 23,743,426$ 2,899,630$ 75,843,562$ 27,864,384$ 214,000$ 191,510$ Non-Academic 274,393,226 26,380,825 105,987,966 17,876,656 2,523,018 52,438,663 39,582,223 8,863,784 20,740,091 Students 7,145,776 654,692 3,952,890 1,602,761 264,918 462,544 65,000 142,971 Total Salaries 583 311 604$ 61 331 810$ 246 660 653$ 43 222 843$ 5 422 648$ 128 547 143$ 67 909 151$ 9 142 784$ 21 074 572$Total Salaries 583,311,604$ 61,331,810$ 246,660,653$ 43,222,843$ 5,422,648$ 128,547,143$ 67,909,151$ 9,142,784$ 21,074,572$
Staff Benefits 199,259,825 21,491,641 82,146,817 16,452,000 2,075,382 42,347,924 24,725,790 3,105,737 6,914,534 Total Salaries and Benefits 782,571,429$ 82,823,451$ 328,807,470$ 59,674,843$ 7,498,030$ 170,895,067$ 92,634,941$ 12,248,521$ 27,989,106$
Operating 323,420,563 35,160,611 163,337,164 23,993,835 2,505,408 48,968,653 29,897,774 4,363,317 15,193,801 Equipment and Capital Outlay 21,791,374 1,924,622 13,626,096 1,414,157 31,000 2,276,719 2,239,459 179,321 100,000
Total Expenditures 1,127,783,366$ 119,908,684$ 505,770,730$ 85,082,835$ 10,034,438$ 222,140,439$ 124,772,174$ 16,791,159$ 43,282,907$
AUXILIAIRESAUXILIAIRESSalaries and Benefits
SalariesAcademic 467,053$ 7,000$ 456,990$ 3,063$ Non-Academic 37,106,462 1,298,465 33,316,036 1,552,944 101,855$ 837,162$ Students 4,258,226 182,223 3,496,882 579,121 Total Salaries 41,831,741$ 1,487,688$ 37,269,908$ 2,135,128$ 101,855$ 837,162$
Staff Benefits 11,270,644 302,240 9,883,814 697,568 47,750 339,272 Total Salaries and Benefits 53,102,385$ 1,789,928$ 47,153,722$ 2,832,696$ 149,605$ 1,176,434$
Operating 82,937,137 3,137,956 72,191,600 6,296,995 75,895 1,234,691 Equipment and Capital Outlay 687,208 5,000 675,508 6,700
Total Expenditures 136,726,730$ 4,932,884$ 120,020,830$ 9,136,391$ 225,500$ 2,411,125$
TOTALSSalaries and BenefitsSalaries and Benefits
SalariesAcademic 302,239,655$ 34,303,293$ 137,176,787$ 23,746,489$ 2,899,630$ 75,843,562$ 27,864,384$ 214,000$ 191,510$ Non-Academic 311,499,688 27,679,290 139,304,002 19,429,600 2,624,873 53,275,825 39,582,223 8,863,784 20,740,091 Students 11,404,002 836,915 7,449,772 2,181,882 - 264,918 462,544 65,000 142,971 Total Salaries 625,143,345$ 62,819,498$ 283,930,561$ 45,357,971$ 5,524,503$ 129,384,305$ 67,909,151$ 9,142,784$ 21,074,572$
Staff Benefits 210,530,469 21,793,881 92,030,631 17,149,568 2,123,132 42,687,196 24,725,790 3,105,737 6,914,534 Total Salaries and Benefits 835,673,814$ 84,613,379$ 375,961,192$ 62,507,539$ 7,647,635$ 172,071,501$ 92,634,941$ 12,248,521$ 27,989,106$
Operating 406,357,700 38,298,567 235,528,764 30,290,830 2,581,303 50,203,344 29,897,774 4,363,317 15,193,801Operating 406,357,700 38,298,567 235,528,764 30,290,830 2,581,303 50,203,344 29,897,774 4,363,317 15,193,801 Equipment and Capital Outlay 22,478,582 1,929,622 14,301,604 1,420,857 31,000 2,276,719 2,239,459 179,321 100,000
Total Expenditures 1,264,510,096$ 124,841,568$ 625,791,560$ 94,219,226$ 10,259,938$ 224,551,564$ 124,772,174$ 16,791,159$ 43,282,907$
Schedule 1128
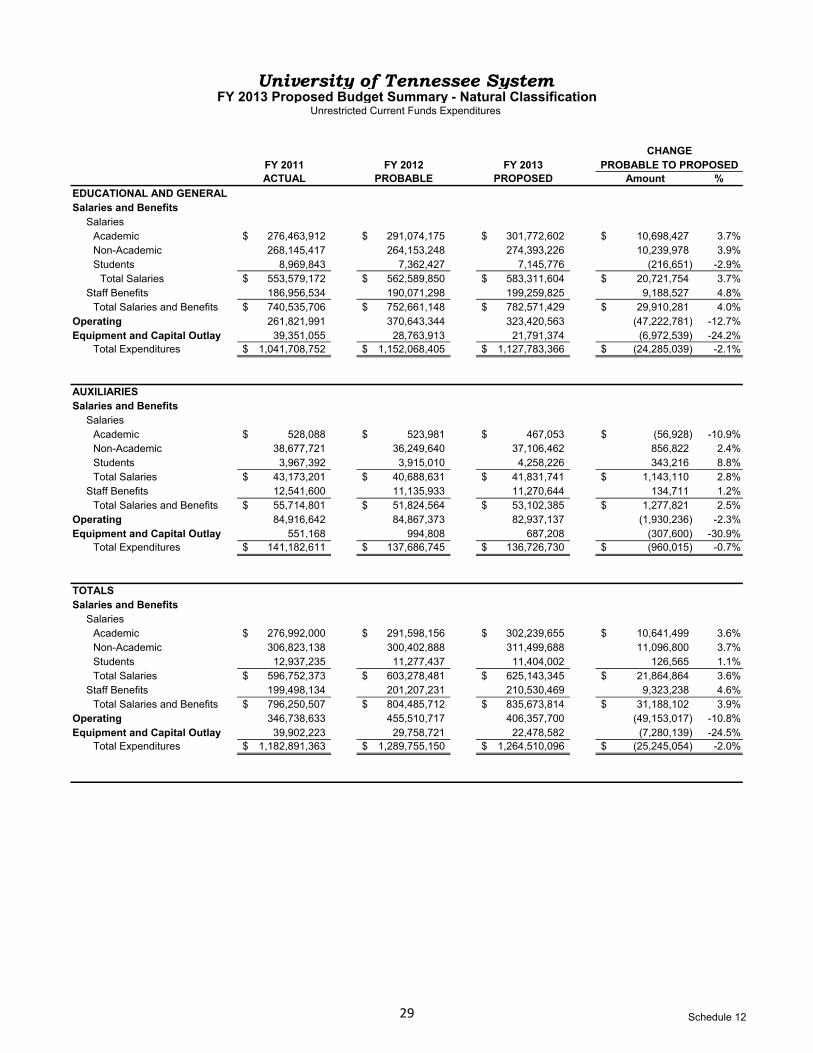
FY 2011 FY 2012 FY 2013ACTUAL PROBABLE PROPOSED Amount %
EDUCATIONAL AND GENERAL
PROBABLE TO PROPOSED
University of Tennessee SystemFY 2013 Proposed Budget Summary - Natural Classification
Unrestricted Current Funds Expenditures
CHANGE
EDUCATIONAL AND GENERALSalaries and Benefits
SalariesAcademic 276,463,912$ 291,074,175$ 301,772,602$ 10,698,427$ 3.7%Non-Academic 268,145,417 264,153,248 274,393,226 10,239,978 3.9%Students 8,969,843 7,362,427 7,145,776 (216,651) -2.9%
Total Salaries 553,579,172$ 562,589,850$ 583,311,604$ 20,721,754$ 3.7%Staff Benefits 186,956,534 190,071,298 199,259,825 9,188,527 4.8%
Total Salaries and Benefits 740,535,706$ 752,661,148$ 782,571,429$ 29,910,281$ 4.0%O ti 261 821 991 370 643 344 323 420 563 (47 222 781) 12 7%Operating 261,821,991 370,643,344 323,420,563 (47,222,781) -12.7%Equipment and Capital Outlay 39,351,055 28,763,913 21,791,374 (6,972,539) -24.2%
Total Expenditures 1,041,708,752$ 1,152,068,405$ 1,127,783,366$ (24,285,039)$ -2.1%
AUXILIARIESSalaries and Benefits
SalariesAcademic 528,088$ 523,981$ 467,053$ (56,928)$ -10.9%Non-Academic 38,677,721 36,249,640 37,106,462 856,822 2.4%Students 3,967,392 3,915,010 4,258,226 343,216 8.8%Total Salaries 43,173,201$ 40,688,631$ 41,831,741$ 1,143,110$ 2.8%
Staff Benefits 12,541,600 11,135,933 11,270,644 134,711 1.2%Total Salaries and Benefits 55,714,801$ 51,824,564$ 53,102,385$ 1,277,821$ 2.5%
Operating 84,916,642 84,867,373 82,937,137 (1,930,236) -2.3%Equipment and Capital Outlay 551,168 994,808 687,208 (307,600) -30.9%
Total Expenditures 141,182,611$ 137,686,745$ 136,726,730$ (960,015)$ -0.7%
TOTALSSalaries and Benefits
SalariesAcademic 276,992,000$ 291,598,156$ 302,239,655$ 10,641,499$ 3.6%Non-Academic 306,823,138 300,402,888 311,499,688 11,096,800 3.7%Students 12,937,235 11,277,437 11,404,002 126,565 1.1%Total Salaries 596,752,373$ 603,278,481$ 625,143,345$ 21,864,864$ 3.6%
St ff B fit 199 498 134 201 207 231 210 530 469 9 323 238 4 6%Staff Benefits 199,498,134 201,207,231 210,530,469 9,323,238 4.6%Total Salaries and Benefits 796,250,507$ 804,485,712$ 835,673,814$ 31,188,102$ 3.9%
Operating 346,738,633 455,510,717 406,357,700 (49,153,017) -10.8%Equipment and Capital Outlay 39,902,223 29,758,721 22,478,582 (7,280,139) -24.5%
Total Expenditures 1,182,891,363$ 1,289,755,150$ 1,264,510,096$ (25,245,054)$ -2.0%
Schedule 1229
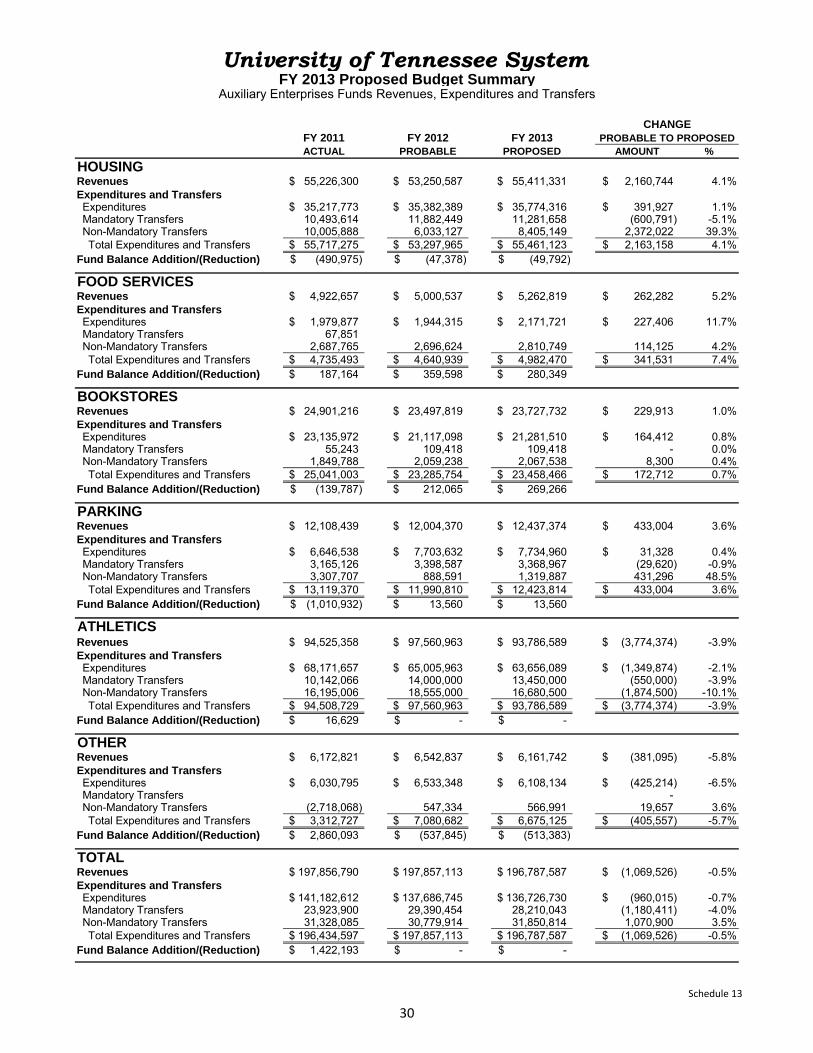
FY 2011 FY 2012 FY 2013ACTUAL PROBABLE PROPOSED AMOUNT %
HOUSINGRevenues 55,226,300$ 53,250,587$ 55,411,331$ 2,160,744$ 4.1%Expenditures and TransfersExpenditures 35,217,773$ 35,382,389$ 35,774,316$ 391,927$ 1.1%Mandatory Transfers 10,493,614 11,882,449 11,281,658 (600,791) -5.1%Non-Mandatory Transfers 10,005,888 6,033,127 8,405,149 2,372,022 39.3%Total Expenditures and Transfers 55,717,275$ 53,297,965$ 55,461,123$ 2,163,158$ 4.1%
Fund Balance Addition/(Reduction) (490,975)$ (47,378)$ (49,792)$
FOOD SERVICESRevenues 4,922,657$ 5,000,537$ 5,262,819$ 262,282$ 5.2%Expenditures and TransfersExpenditures 1,979,877$ 1,944,315$ 2,171,721$ 227,406$ 11.7%Mandatory Transfers 67,851Non-Mandatory Transfers 2,687,765 2,696,624 2,810,749 114,125 4.2%Total Expenditures and Transfers 4,735,493$ 4,640,939$ 4,982,470$ 341,531$ 7.4%
Fund Balance Addition/(Reduction) 187,164$ 359,598$ 280,349$
BOOKSTORESRevenues 24,901,216$ 23,497,819$ 23,727,732$ 229,913$ 1.0%Expenditures and TransfersExpenditures 23,135,972$ 21,117,098$ 21,281,510$ 164,412$ 0.8%Mandatory Transfers 55,243 109,418 109,418 - 0.0%Non-Mandatory Transfers 1,849,788 2,059,238 2,067,538 8,300 0.4%Total Expenditures and Transfers 25,041,003$ 23,285,754$ 23,458,466$ 172,712$ 0.7%
Fund Balance Addition/(Reduction) (139,787)$ 212,065$ 269,266$
PARKINGRevenues 12,108,439$ 12,004,370$ 12,437,374$ 433,004$ 3.6%Expenditures and Transfers
University of Tennessee SystemFY 2013 Proposed Budget Summary
Auxiliary Enterprises Funds Revenues, Expenditures and Transfers
CHANGEPROBABLE TO PROPOSED
Expenditures and TransfersExpenditures 6,646,538$ 7,703,632$ 7,734,960$ 31,328$ 0.4%Mandatory Transfers 3,165,126 3,398,587 3,368,967 (29,620) -0.9%Non-Mandatory Transfers 3,307,707 888,591 1,319,887 431,296 48.5%Total Expenditures and Transfers 13,119,370$ 11,990,810$ 12,423,814$ 433,004$ 3.6%
Fund Balance Addition/(Reduction) (1,010,932)$ 13,560$ 13,560$
ATHLETICSRevenues 94,525,358$ 97,560,963$ 93,786,589$ (3,774,374)$ -3.9%Expenditures and TransfersExpenditures 68,171,657$ 65,005,963$ 63,656,089$ (1,349,874)$ -2.1%Mandatory Transfers 10,142,066 14,000,000 13,450,000 (550,000) -3.9%Non-Mandatory Transfers 16,195,006 18,555,000 16,680,500 (1,874,500) -10.1%Total Expenditures and Transfers 94,508,729$ 97,560,963$ 93,786,589$ (3,774,374)$ -3.9%
Fund Balance Addition/(Reduction) 16,629$ -$ -$
OTHERRevenues 6,172,821$ 6,542,837$ 6,161,742$ (381,095)$ -5.8%Expenditures and TransfersExpenditures 6,030,795$ 6,533,348$ 6,108,134$ (425,214)$ -6.5%Mandatory Transfers - Non-Mandatory Transfers (2,718,068) 547,334 566,991 19,657 3.6%Total Expenditures and Transfers 3,312,727$ 7,080,682$ 6,675,125$ (405,557)$ -5.7%
Fund Balance Addition/(Reduction) 2,860,093$ (537,845)$ (513,383)$
TOTALRevenues 197,856,790$ 197,857,113$ 196,787,587$ (1,069,526)$ -0.5%Expenditures and TransfersExpenditures 141,182,612$ 137,686,745$ 136,726,730$ (960,015)$ -0.7%Mandatory Transfers 23,923,900 29,390,454 28,210,043 (1,180,411) -4.0%Non-Mandatory Transfers 31,328,085 30,779,914 31,850,814 1,070,900 3.5%Total Expenditures and Transfers 196,434,597$ 197,857,113$ 196,787,587$ (1,069,526)$ -0.5%
Fund Balance Addition/(Reduction) 1,422,193$ -$ -$
Schedule 13
30

FY 2009 FY 2010 FY 2011 FY 2012 FY 2013ACTUAL ACTUAL ACTUAL PROBABLE PROPOSED Amount %
KNOXVILLERevenues
General Funds
University of Tennessee SystemE&G and Auxiliary Funds for Men's and Women's Athletics
FIVE-YEAR CHANGE
Athletics Five-Year Budget Summary Comparison
Student Fees for Athletics 1,000,000$ 1,000,000$ 1,000,000$ 1,000,000$ 1,000,000$ -$ - Ticket Sales 34,465,000 37,689,669 34,799,207 38,125,000 33,585,000 (880,000) -2.6%Gifts 22,985,000 25,508,512 26,554,657 28,950,000 25,735,000 2,750,000 12.0%Other 29,050,000 36,532,258 40,141,340 36,175,000 38,680,000 9,630,000 33.1%
Total Revenues 87,500,000$ 100,730,439$ 102,495,204$ 104,250,000$ 99,000,000$ 11,500,000$ 13.1%
Expenditures and Transfers Salaries and Benefits 29,371,411$ 35,844,160$ 38,361,583$ 34,509,022$ 33,346,000$ 3,974,589$ 13.5%Travel 7,640,050 6,505,978 6,835,168 7,770,200 8,055,500 415,450 5.4%Student Aid 7,981,000 8,105,044 8,873,639 9,588,000 10,600,000 2,619,000 32.8%Other Operating 22,660,515 28,495,090 28,958,686 26,767,778 25,017,912 2,357,397 10.4%
Sub-total Expenditures 67,652,976$ 78,950,272$ 83,029,076$ 78,635,000$ 77,019,412$ 9,366,436$ 13.8%Debt Service Transfers 12,125,000 7,657,353 10,142,066 14,000,000 12,325,000 200,000 1.6%Other Transfers 7,722,024 12,513,832 9,309,616 10,615,000 9,655,588 1,933,564 25.0%
Total Expenditures and Transfers 87,500,000$ 99,121,457$ 102,480,758$ 103,250,000$ 99,000,000$ 11,500,000$ 13.1%
Fund Balance Addition / (Reduction) -$ 1,608,982$ 14,446$ 1,000,000$ -$
CHATTANOOGARevenues
General Funds 4,474,148$ 4,668,862$ 5,034,581$ 5,018,593$ 5,303,481$ 829,333$ 18.5%Student Fees for Athletics 2,726,457 3,033,232 3,070,180 3,976,695 4,942,633 2,216,176 81.3%Ticket Sales 1,018,500 620,608 637,888 702,000 702,000 (316,500) -31.1%Gifts 1,148,801 1,515,486 1,285,002 1,208,801 1,208,801 60,000 5.2%Other 1,703,589 1,748,433 1,747,848 1,893,369 1,793,369 89,780 5.3%
Total Revenues 11,071,495$ 11,586,621$ 11,775,499$ 12,799,458$ 13,950,284$ 2,878,789$ 26.0%
Expenditures and Transfers Salaries and Benefits 4,083,961$ 4,529,881$ 4,726,977$ 4,527,683$ 4,468,183$ 384,222$ 9.4%Travel 1,227,469 784,372 833,639 1,470,538 1,462,438 234,969 19.1%Student Aid 3,591,843 3,199,843 3,287,149 4,236,821 4,770,449 1,178,606 32.8%Other Operating 2,021,743 2,799,975 2,460,702 2,432,937 3,117,735 1,095,992 54.2%
Sub-total Expenditures 10,925,016$ 11,314,071$ 11,308,467$ 12,667,979$ 13,818,805$ 2,893,789$ 26.5%Debt Service Transfers 185,000 168,879 168,680 170,000 170,000 (15,000) -8.1%Other Transfers
Total Expenditures and Transfers 11,110,016$ 11,482,950$ 11,477,147$ 12,837,979$ 13,988,805$ 2,878,789$ 25.9%
Fund Balance Addition / (Reduction) (38,521)$ 103,671$ 298,352$ (38,521)$ (38,521)$
MARTINRevenues
General Funds 4,040,184$ 4,009,783$ 4,431,339$ 5,023,019$ 5,023,019$ 982,835$ 24.3%S f 1 8 000 2 000 630 2 081 8 2 0 000 2 0 000 200 000 10 %Student Fees for Athletics 1,875,000 2,000,630 2,081,875 2,075,000 2,075,000 200,000 10.7%Ticket Sales 133,019 109,873 107,596 100,000 100,000 (33,019) -24.8%Gifts 550,000 418,092 669,728 537,200 537,200 (12,800) -2.3%Other 1,506,242 1,057,866 1,384,606 1,208,513 1,208,513 (297,729) -19.8%
Total Revenues 8,104,445$ 7,596,244$ 8,675,144$ 8,943,732$ 8,943,732$ 839,287$ 10.4%
Expenditures and Transfers Salaries and Benefits 2,605,804$ 2,767,981$ 2,812,169$ 2,901,642$ 2,901,642$ 295,838$ 11.4%Travel 592,550 558,947 757,178 702,014 702,014 109,464 18.5%Student Aid 2,793,905 2,816,472 3,431,486 3,475,488 3,475,488 681,583 24.4%Other Operating 2,112,186 1,385,060 1,567,162 1,657,944 1,657,944 (454,242) -21.5%
Sub-total Expenditures 8,104,445$ 7,528,460$ 8,567,995$ 8,737,088$ 8,737,088$ 632,643$ 7.8%Debt Service Transfers 129,326 24,203Other Transfers 206,644 206,644 206,644 NA
T t l E dit d T f 8 104 445$ 7 657 786$ 8 592 198$ 8 943 732$ 8 943 732$ 839 287$ 10 4%Total Expenditures and Transfers 8,104,445$ 7,657,786$ 8,592,198$ 8,943,732$ 8,943,732$ 839,287$ 10.4%
Fund Balance Addition / (Reduction) -$ (61,542)$ 82,946$ -$ -$
TOTAL ATHLETICSRevenues
General Funds 8,514,332$ 8,678,645$ 9,465,920$ 10,041,612$ 10,326,500$ 1,812,168$ 21.3%Student Fees for Athletics 5,601,457 6,033,862 6,152,055 7,051,695 8,017,633 2,416,176 43.1%Ticket Sales 35,616,519 38,420,150 35,544,691 38,927,000 34,387,000 (1,229,519) -3.5%Gifts 24,683,801 27,442,090 28,509,387 30,696,001 27,481,001 2,797,200 11.3%Other 32,259,831 39,338,557 43,273,794 39,276,882 41,681,882 9,422,051 29.2%
Total Revenues 106,675,940$ 119,913,304$ 122,945,847$ 125,993,190$ 121,894,016$ 15,218,076$ 14.3%
E dit d T fExpenditures and Transfers Salaries and Benefits 36,061,176$ 43,142,022$ 45,900,729$ 41,938,347$ 40,715,825$ 4,654,649$ 12.9%Travel 9,460,069 7,849,297 8,425,985 9,942,752 10,219,952 759,883 8.0%Student Aid 14,366,748 14,121,359 15,592,274 17,300,309 18,845,937 4,479,189 31.2%Other Operating 26,794,444 32,680,125 32,986,550 30,858,659 29,793,591 2,999,147 11.2%
Sub-total Expenditures 86,682,437$ 97,792,803$ 102,905,538$ 100,040,067$ 99,575,305$ 12,892,868$ 14.9%Debt Service Transfers 12,310,000 7,955,558 10,334,949 14,170,000 12,495,000 185,000 1.5%Other Transfers 7,722,024 12,513,832 9,309,616 10,821,644 9,862,232 2,140,208 27.7%
Total Expenditures and Transfers 106,714,461$ 118,262,193$ 122,550,103$ 125,031,711$ 121,932,537$ 15,218,076$ 14.3%
Fund Balance Addition / (Reduction) (38,521)$ 1,651,111$ 395,744$ 961,479$ (38,521)$
NOTES: Data includes unrestricted and restricted funds. Other revenue sources include NCAA conference income, tournament income, program sales, concessions, parking, broadcasting, television, radio, internet, endowments, investments, royalties, advertisements, sponsorships, game guarantees, licensing fees, and sports camps.
Schedule 14
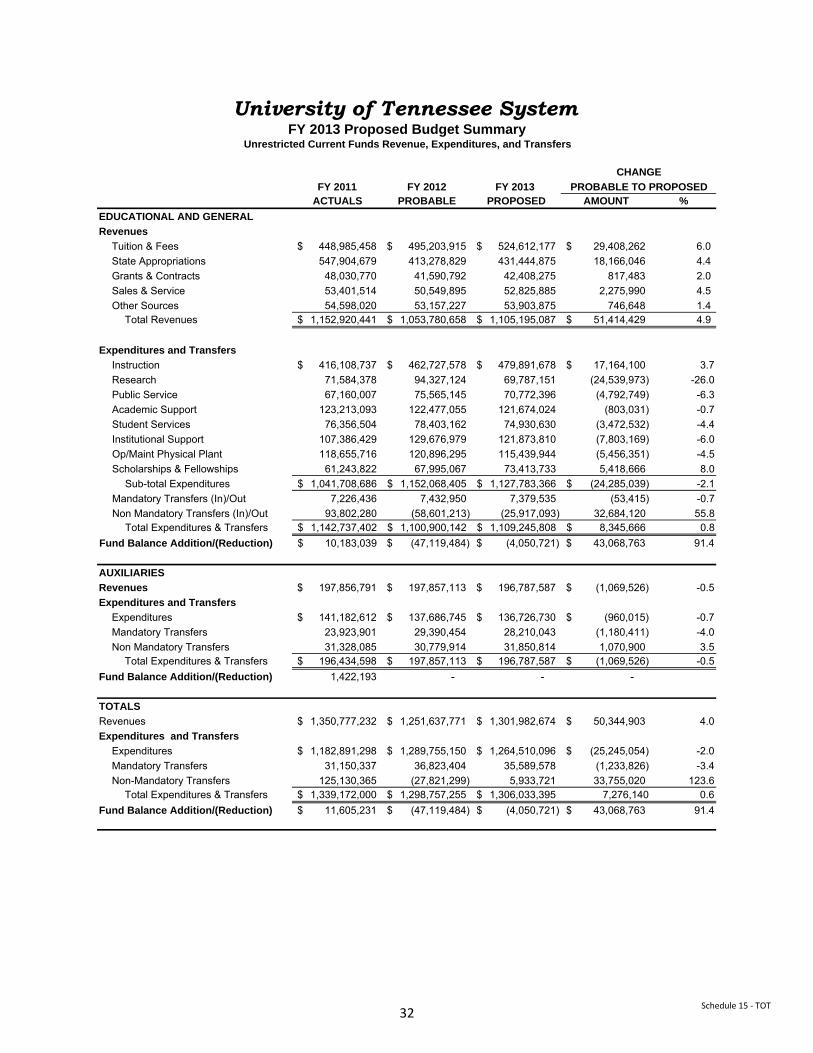
FY 2011 FY 2012 FY 2013 ACTUALS PROBABLE PROPOSED AMOUNT %
EDUCATIONAL AND GENERAL
Revenues
Tuition & Fees 448,985,458$ 495,203,915$ 524,612,177$ 29,408,262$ 6.0 State Appropriations 547,904,679 413,278,829 431,444,875 18,166,046 4.4 Grants & Contracts 48,030,770 41,590,792 42,408,275 817,483 2.0 Sales & Service 53,401,514 50,549,895 52,825,885 2,275,990 4.5 Other Sources 54,598,020 53,157,227 53,903,875 746,648 1.4
Total Revenues 1,152,920,441$ 1,053,780,658$ 1,105,195,087$ 51,414,429$ 4.9
Expenditures and Transfers
Instruction 416,108,737$ 462,727,578$ 479,891,678$ 17,164,100$ 3.7Research 71,584,378 94,327,124 69,787,151 (24,539,973) -26.0Public Service 67,160,007 75,565,145 70,772,396 (4,792,749) -6.3Academic Support 123,213,093 122,477,055 121,674,024 (803,031) -0.7Student Services 76,356,504 78,403,162 74,930,630 (3,472,532) -4.4Institutional Support 107,386,429 129,676,979 121,873,810 (7,803,169) -6.0Op/Maint Physical Plant 118,655,716 120,896,295 115,439,944 (5,456,351) -4.5Scholarships & Fellowships 61,243,822 67,995,067 73,413,733 5,418,666 8.0
Sub-total Expenditures 1,041,708,686$ 1,152,068,405$ 1,127,783,366$ (24,285,039)$ -2.1Mandatory Transfers (In)/Out 7,226,436 7,432,950 7,379,535 (53,415) -0.7Non Mandatory Transfers (In)/Out 93,802,280 (58,601,213) (25,917,093) 32,684,120 55.8
Total Expenditures & Transfers 1,142,737,402$ 1,100,900,142$ 1,109,245,808$ 8,345,666$ 0.8Fund Balance Addition/(Reduction) 10,183,039$ (47,119,484)$ (4,050,721)$ 43,068,763$ 91.4
AUXILIARIES
Revenues 197,856,791$ 197,857,113$ 196,787,587$ (1,069,526)$ -0.5Expenditures and Transfers
Expenditures 141,182,612$ 137,686,745$ 136,726,730$ (960,015)$ -0.7Mandatory Transfers 23,923,901 29,390,454 28,210,043 (1,180,411) -4.0Non Mandatory Transfers 31,328,085 30,779,914 31,850,814 1,070,900 3.5
Total Expenditures & Transfers 196,434,598$ 197,857,113$ 196,787,587$ (1,069,526)$ -0.5Fund Balance Addition/(Reduction) 1,422,193 - - -
TOTALS
Revenues 1,350,777,232$ 1,251,637,771$ 1,301,982,674$ 50,344,903$ 4.0Expenditures and Transfers
Expenditures 1,182,891,298$ 1,289,755,150$ 1,264,510,096$ (25,245,054)$ -2.0Mandatory Transfers 31,150,337 36,823,404 35,589,578 (1,233,826) -3.4Non-Mandatory Transfers 125,130,365 (27,821,299) 5,933,721 33,755,020 123.6
Total Expenditures & Transfers 1,339,172,000$ 1,298,757,255$ 1,306,033,395$ 7,276,140 0.6Fund Balance Addition/(Reduction) 11,605,231$ (47,119,484)$ (4,050,721)$ 43,068,763$ 91.4
University of Tennessee SystemFY 2013 Proposed Budget Summary
Unrestricted Current Funds Revenue, Expenditures, and Transfers
PROBABLE TO PROPOSED
CHANGE
Schedule 15 ‐ TOT32
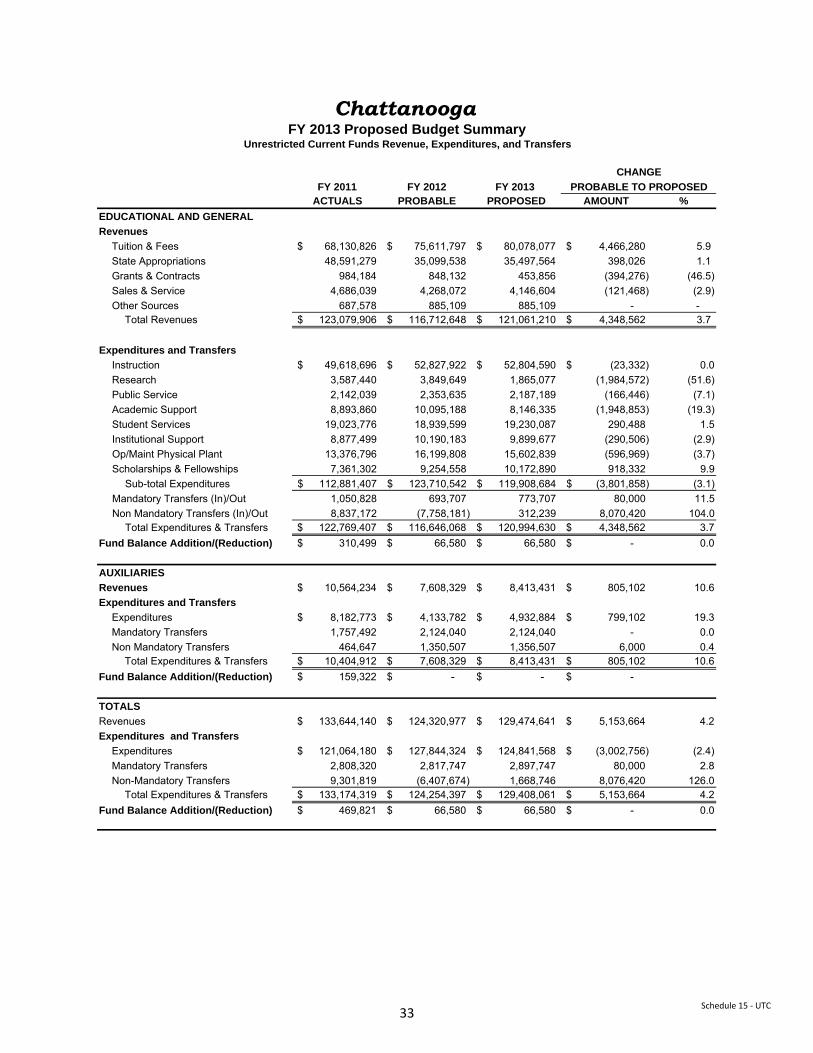
FY 2011 FY 2012 FY 2013 ACTUALS PROBABLE PROPOSED AMOUNT %
EDUCATIONAL AND GENERAL
Revenues
Tuition & Fees 68,130,826$ 75,611,797$ 80,078,077$ 4,466,280$ 5.9 State Appropriations 48,591,279 35,099,538 35,497,564 398,026 1.1 Grants & Contracts 984,184 848,132 453,856 (394,276) (46.5) Sales & Service 4,686,039 4,268,072 4,146,604 (121,468) (2.9) Other Sources 687,578 885,109 885,109 - -
Total Revenues 123,079,906$ 116,712,648$ 121,061,210$ 4,348,562$ 3.7
Expenditures and Transfers
Instruction 49,618,696$ 52,827,922$ 52,804,590$ (23,332)$ 0.0Research 3,587,440 3,849,649 1,865,077 (1,984,572) (51.6) Public Service 2,142,039 2,353,635 2,187,189 (166,446) (7.1) Academic Support 8,893,860 10,095,188 8,146,335 (1,948,853) (19.3) Student Services 19,023,776 18,939,599 19,230,087 290,488 1.5Institutional Support 8,877,499 10,190,183 9,899,677 (290,506) (2.9) Op/Maint Physical Plant 13,376,796 16,199,808 15,602,839 (596,969) (3.7) Scholarships & Fellowships 7,361,302 9,254,558 10,172,890 918,332 9.9
Sub-total Expenditures 112,881,407$ 123,710,542$ 119,908,684$ (3,801,858)$ (3.1) Mandatory Transfers (In)/Out 1,050,828 693,707 773,707 80,000 11.5Non Mandatory Transfers (In)/Out 8,837,172 (7,758,181) 312,239 8,070,420 104.0
Total Expenditures & Transfers 122,769,407$ 116,646,068$ 120,994,630$ 4,348,562$ 3.7Fund Balance Addition/(Reduction) 310,499$ 66,580$ 66,580$ -$ 0.0
AUXILIARIES
Revenues 10,564,234$ 7,608,329$ 8,413,431$ 805,102$ 10.6Expenditures and Transfers
Expenditures 8,182,773$ 4,133,782$ 4,932,884$ 799,102$ 19.3Mandatory Transfers 1,757,492 2,124,040 2,124,040 - 0.0Non Mandatory Transfers 464,647 1,350,507 1,356,507 6,000 0.4
Total Expenditures & Transfers 10,404,912$ 7,608,329$ 8,413,431$ 805,102$ 10.6Fund Balance Addition/(Reduction) 159,322$ -$ -$ -$
TOTALS
Revenues 133,644,140$ 124,320,977$ 129,474,641$ 5,153,664$ 4.2Expenditures and Transfers
Expenditures 121,064,180$ 127,844,324$ 124,841,568$ (3,002,756)$ (2.4) Mandatory Transfers 2,808,320 2,817,747 2,897,747 80,000 2.8Non-Mandatory Transfers 9,301,819 (6,407,674) 1,668,746 8,076,420 126.0
Total Expenditures & Transfers 133,174,319$ 124,254,397$ 129,408,061$ 5,153,664$ 4.2Fund Balance Addition/(Reduction) 469,821$ 66,580$ 66,580$ -$ 0.0
ChattanoogaFY 2013 Proposed Budget Summary
Unrestricted Current Funds Revenue, Expenditures, and Transfers
PROBABLE TO PROPOSED
CHANGE
Schedule 15 ‐ UTC33
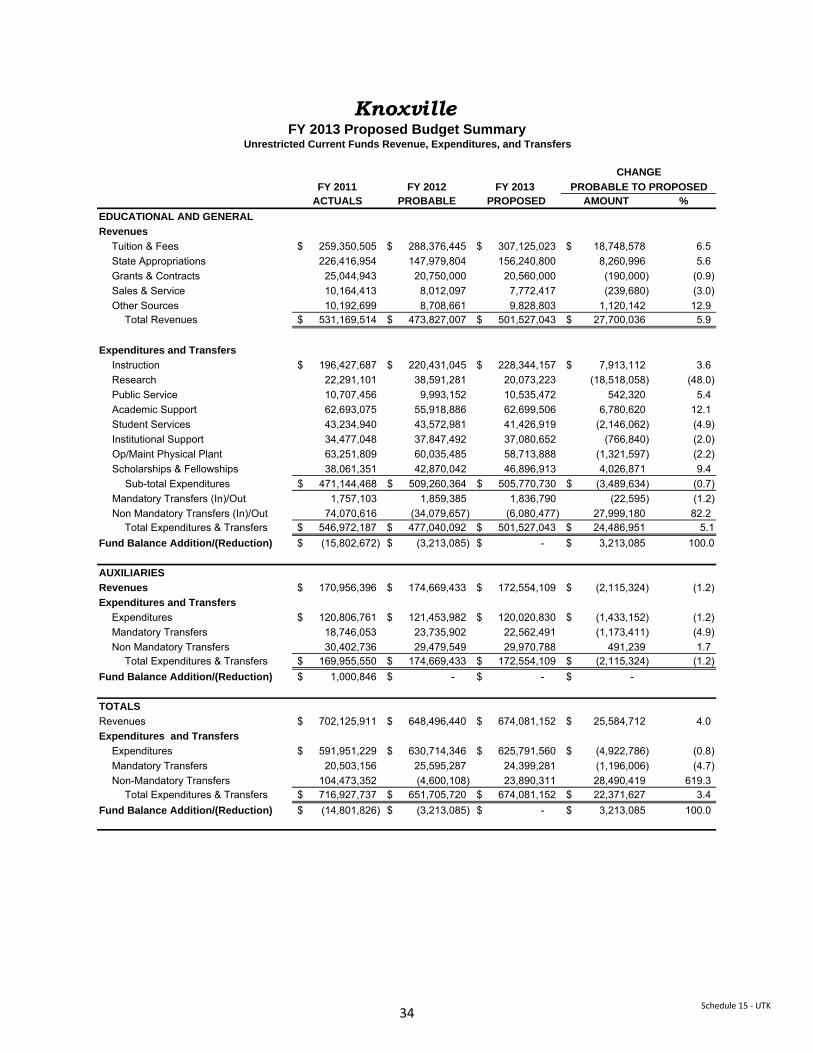
FY 2011 FY 2012 FY 2013 ACTUALS PROBABLE PROPOSED AMOUNT %
EDUCATIONAL AND GENERAL
Revenues
Tuition & Fees 259,350,505$ 288,376,445$ 307,125,023$ 18,748,578$ 6.5 State Appropriations 226,416,954 147,979,804 156,240,800 8,260,996 5.6 Grants & Contracts 25,044,943 20,750,000 20,560,000 (190,000) (0.9) Sales & Service 10,164,413 8,012,097 7,772,417 (239,680) (3.0) Other Sources 10,192,699 8,708,661 9,828,803 1,120,142 12.9
Total Revenues 531,169,514$ 473,827,007$ 501,527,043$ 27,700,036$ 5.9
Expenditures and Transfers
Instruction 196,427,687$ 220,431,045$ 228,344,157$ 7,913,112$ 3.6 Research 22,291,101 38,591,281 20,073,223 (18,518,058) (48.0) Public Service 10,707,456 9,993,152 10,535,472 542,320 5.4 Academic Support 62,693,075 55,918,886 62,699,506 6,780,620 12.1 Student Services 43,234,940 43,572,981 41,426,919 (2,146,062) (4.9) Institutional Support 34,477,048 37,847,492 37,080,652 (766,840) (2.0) Op/Maint Physical Plant 63,251,809 60,035,485 58,713,888 (1,321,597) (2.2) Scholarships & Fellowships 38,061,351 42,870,042 46,896,913 4,026,871 9.4
Sub-total Expenditures 471,144,468$ 509,260,364$ 505,770,730$ (3,489,634)$ (0.7) Mandatory Transfers (In)/Out 1,757,103 1,859,385 1,836,790 (22,595) (1.2) Non Mandatory Transfers (In)/Out 74,070,616 (34,079,657) (6,080,477) 27,999,180 82.2
Total Expenditures & Transfers 546,972,187$ 477,040,092$ 501,527,043$ 24,486,951$ 5.1Fund Balance Addition/(Reduction) (15,802,672)$ (3,213,085)$ -$ 3,213,085$ 100.0
AUXILIARIES
Revenues 170,956,396$ 174,669,433$ 172,554,109$ (2,115,324)$ (1.2) Expenditures and Transfers
Expenditures 120,806,761$ 121,453,982$ 120,020,830$ (1,433,152)$ (1.2) Mandatory Transfers 18,746,053 23,735,902 22,562,491 (1,173,411) (4.9) Non Mandatory Transfers 30,402,736 29,479,549 29,970,788 491,239 1.7
Total Expenditures & Transfers 169,955,550$ 174,669,433$ 172,554,109$ (2,115,324)$ (1.2) Fund Balance Addition/(Reduction) 1,000,846$ -$ -$ -$
TOTALS
Revenues 702,125,911$ 648,496,440$ 674,081,152$ 25,584,712$ 4.0 Expenditures and Transfers
Expenditures 591,951,229$ 630,714,346$ 625,791,560$ (4,922,786)$ (0.8) Mandatory Transfers 20,503,156 25,595,287 24,399,281 (1,196,006) (4.7) Non-Mandatory Transfers 104,473,352 (4,600,108) 23,890,311 28,490,419 619.3
Total Expenditures & Transfers 716,927,737$ 651,705,720$ 674,081,152$ 22,371,627$ 3.4 Fund Balance Addition/(Reduction) (14,801,826)$ (3,213,085)$ -$ 3,213,085$ 100.0
KnoxvilleFY 2013 Proposed Budget Summary
Unrestricted Current Funds Revenue, Expenditures, and Transfers
PROBABLE TO PROPOSED
CHANGE
Schedule 15 ‐ UTK34
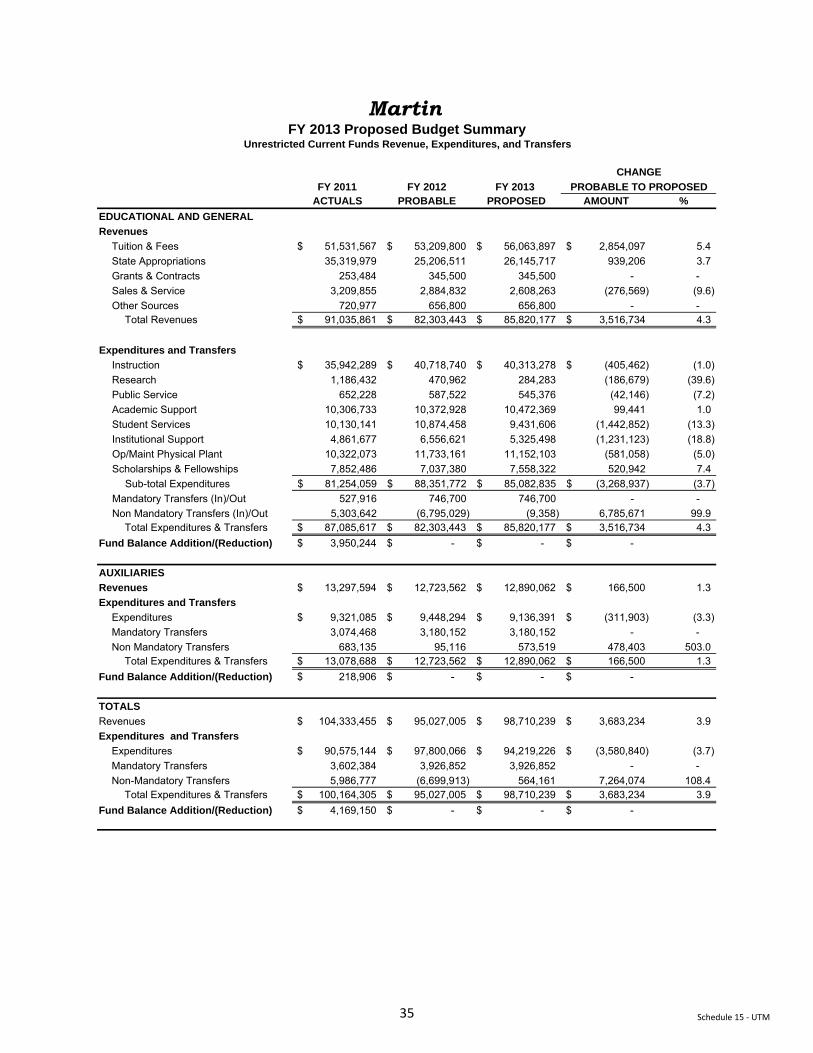
FY 2011 FY 2012 FY 2013 ACTUALS PROBABLE PROPOSED AMOUNT %
EDUCATIONAL AND GENERAL
Revenues
Tuition & Fees 51,531,567$ 53,209,800$ 56,063,897$ 2,854,097$ 5.4 State Appropriations 35,319,979 25,206,511 26,145,717 939,206 3.7 Grants & Contracts 253,484 345,500 345,500 - - Sales & Service 3,209,855 2,884,832 2,608,263 (276,569) (9.6) Other Sources 720,977 656,800 656,800 - -
Total Revenues 91,035,861$ 82,303,443$ 85,820,177$ 3,516,734$ 4.3
Expenditures and Transfers
Instruction 35,942,289$ 40,718,740$ 40,313,278$ (405,462)$ (1.0) Research 1,186,432 470,962 284,283 (186,679) (39.6) Public Service 652,228 587,522 545,376 (42,146) (7.2) Academic Support 10,306,733 10,372,928 10,472,369 99,441 1.0 Student Services 10,130,141 10,874,458 9,431,606 (1,442,852) (13.3) Institutional Support 4,861,677 6,556,621 5,325,498 (1,231,123) (18.8) Op/Maint Physical Plant 10,322,073 11,733,161 11,152,103 (581,058) (5.0) Scholarships & Fellowships 7,852,486 7,037,380 7,558,322 520,942 7.4
Sub-total Expenditures 81,254,059$ 88,351,772$ 85,082,835$ (3,268,937)$ (3.7) Mandatory Transfers (In)/Out 527,916 746,700 746,700 - - Non Mandatory Transfers (In)/Out 5,303,642 (6,795,029) (9,358) 6,785,671 99.9
Total Expenditures & Transfers 87,085,617$ 82,303,443$ 85,820,177$ 3,516,734$ 4.3 Fund Balance Addition/(Reduction) 3,950,244$ -$ -$ -$
AUXILIARIES
Revenues 13,297,594$ 12,723,562$ 12,890,062$ 166,500$ 1.3 Expenditures and Transfers
Expenditures 9,321,085$ 9,448,294$ 9,136,391$ (311,903)$ (3.3) Mandatory Transfers 3,074,468 3,180,152 3,180,152 - - Non Mandatory Transfers 683,135 95,116 573,519 478,403 503.0
Total Expenditures & Transfers 13,078,688$ 12,723,562$ 12,890,062$ 166,500$ 1.3 Fund Balance Addition/(Reduction) 218,906$ -$ -$ -$
TOTALS
Revenues 104,333,455$ 95,027,005$ 98,710,239$ 3,683,234$ 3.9 Expenditures and Transfers
Expenditures 90,575,144$ 97,800,066$ 94,219,226$ (3,580,840)$ (3.7) Mandatory Transfers 3,602,384 3,926,852 3,926,852 - - Non-Mandatory Transfers 5,986,777 (6,699,913) 564,161 7,264,074 108.4
Total Expenditures & Transfers 100,164,305$ 95,027,005$ 98,710,239$ 3,683,234$ 3.9 Fund Balance Addition/(Reduction) 4,169,150$ -$ -$ -$
MartinFY 2013 Proposed Budget Summary
Unrestricted Current Funds Revenue, Expenditures, and Transfers
PROBABLE TO PROPOSED
CHANGE
Schedule 15 ‐ UTM35
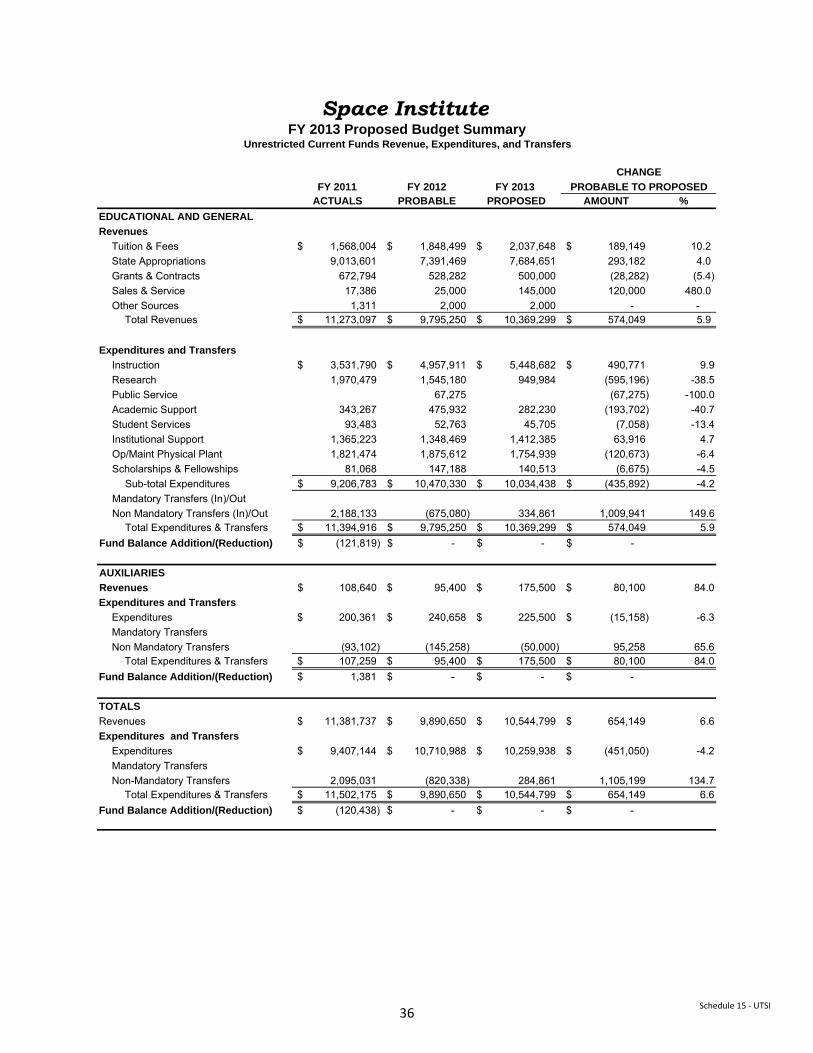
FY 2011 FY 2012 FY 2013 ACTUALS PROBABLE PROPOSED AMOUNT %
EDUCATIONAL AND GENERAL
Revenues
Tuition & Fees 1,568,004$ 1,848,499$ 2,037,648$ 189,149$ 10.2 State Appropriations 9,013,601 7,391,469 7,684,651 293,182 4.0 Grants & Contracts 672,794 528,282 500,000 (28,282) (5.4) Sales & Service 17,386 25,000 145,000 120,000 480.0 Other Sources 1,311 2,000 2,000 - -
Total Revenues 11,273,097$ 9,795,250$ 10,369,299$ 574,049$ 5.9
Expenditures and Transfers
Instruction 3,531,790$ 4,957,911$ 5,448,682$ 490,771$ 9.9Research 1,970,479 1,545,180 949,984 (595,196) -38.5Public Service 67,275 (67,275) -100.0Academic Support 343,267 475,932 282,230 (193,702) -40.7Student Services 93,483 52,763 45,705 (7,058) -13.4Institutional Support 1,365,223 1,348,469 1,412,385 63,916 4.7Op/Maint Physical Plant 1,821,474 1,875,612 1,754,939 (120,673) -6.4Scholarships & Fellowships 81,068 147,188 140,513 (6,675) -4.5
Sub-total Expenditures 9,206,783$ 10,470,330$ 10,034,438$ (435,892)$ -4.2Mandatory Transfers (In)/OutNon Mandatory Transfers (In)/Out 2,188,133 (675,080) 334,861 1,009,941 149.6
Total Expenditures & Transfers 11,394,916$ 9,795,250$ 10,369,299$ 574,049$ 5.9Fund Balance Addition/(Reduction) (121,819)$ -$ -$ -$
AUXILIARIES
Revenues 108,640$ 95,400$ 175,500$ 80,100$ 84.0Expenditures and Transfers
Expenditures 200,361$ 240,658$ 225,500$ (15,158)$ -6.3Mandatory TransfersNon Mandatory Transfers (93,102) (145,258) (50,000) 95,258 65.6
Total Expenditures & Transfers 107,259$ 95,400$ 175,500$ 80,100$ 84.0Fund Balance Addition/(Reduction) 1,381$ -$ -$ -$
TOTALS
Revenues 11,381,737$ 9,890,650$ 10,544,799$ 654,149$ 6.6Expenditures and Transfers
Expenditures 9,407,144$ 10,710,988$ 10,259,938$ (451,050)$ -4.2Mandatory TransfersNon-Mandatory Transfers 2,095,031 (820,338) 284,861 1,105,199 134.7
Total Expenditures & Transfers 11,502,175$ 9,890,650$ 10,544,799$ 654,149$ 6.6Fund Balance Addition/(Reduction) (120,438)$ -$ -$ -$
Space InstituteFY 2013 Proposed Budget Summary
Unrestricted Current Funds Revenue, Expenditures, and Transfers
PROBABLE TO PROPOSED
CHANGE
Schedule 15 ‐ UTSI36
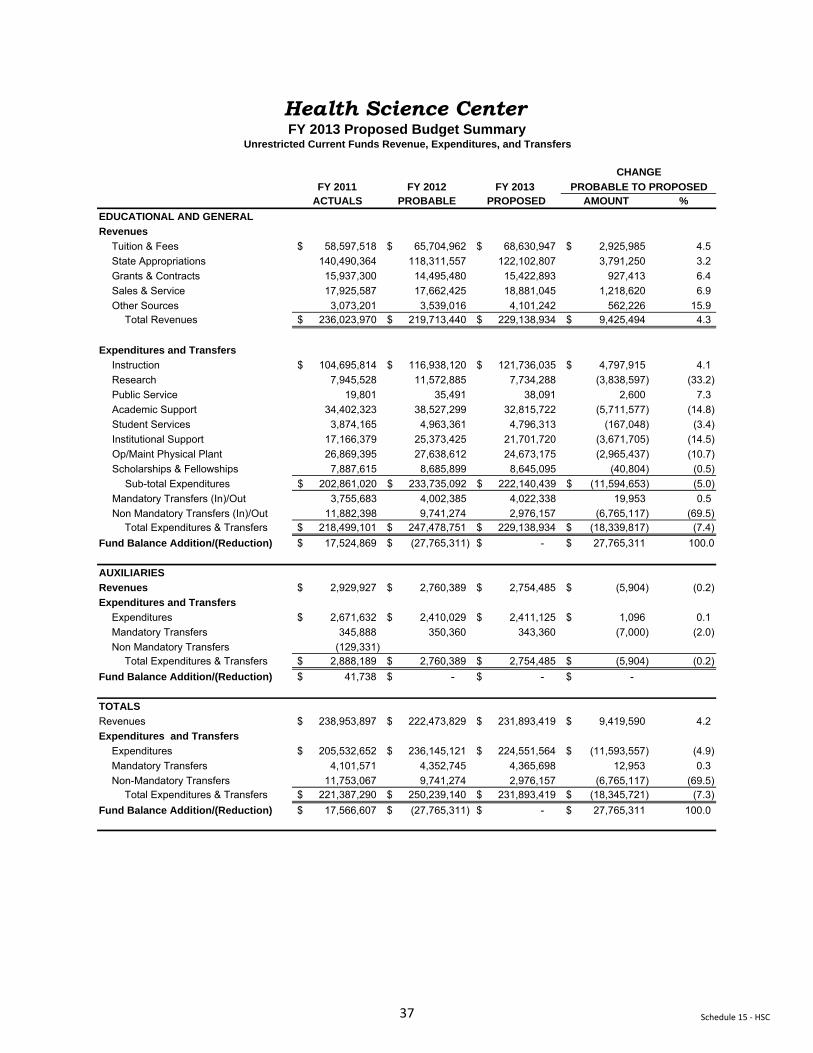
FY 2011 FY 2012 FY 2013 ACTUALS PROBABLE PROPOSED AMOUNT %
EDUCATIONAL AND GENERAL
Revenues
Tuition & Fees 58,597,518$ 65,704,962$ 68,630,947$ 2,925,985$ 4.5 State Appropriations 140,490,364 118,311,557 122,102,807 3,791,250 3.2 Grants & Contracts 15,937,300 14,495,480 15,422,893 927,413 6.4 Sales & Service 17,925,587 17,662,425 18,881,045 1,218,620 6.9 Other Sources 3,073,201 3,539,016 4,101,242 562,226 15.9
Total Revenues 236,023,970$ 219,713,440$ 229,138,934$ 9,425,494$ 4.3
Expenditures and Transfers
Instruction 104,695,814$ 116,938,120$ 121,736,035$ 4,797,915$ 4.1 Research 7,945,528 11,572,885 7,734,288 (3,838,597) (33.2) Public Service 19,801 35,491 38,091 2,600 7.3 Academic Support 34,402,323 38,527,299 32,815,722 (5,711,577) (14.8) Student Services 3,874,165 4,963,361 4,796,313 (167,048) (3.4) Institutional Support 17,166,379 25,373,425 21,701,720 (3,671,705) (14.5) Op/Maint Physical Plant 26,869,395 27,638,612 24,673,175 (2,965,437) (10.7) Scholarships & Fellowships 7,887,615 8,685,899 8,645,095 (40,804) (0.5)
Sub-total Expenditures 202,861,020$ 233,735,092$ 222,140,439$ (11,594,653)$ (5.0) Mandatory Transfers (In)/Out 3,755,683 4,002,385 4,022,338 19,953 0.5 Non Mandatory Transfers (In)/Out 11,882,398 9,741,274 2,976,157 (6,765,117) (69.5)
Total Expenditures & Transfers 218,499,101$ 247,478,751$ 229,138,934$ (18,339,817)$ (7.4) Fund Balance Addition/(Reduction) 17,524,869$ (27,765,311)$ -$ 27,765,311$ 100.0
AUXILIARIES
Revenues 2,929,927$ 2,760,389$ 2,754,485$ (5,904)$ (0.2) Expenditures and Transfers
Expenditures 2,671,632$ 2,410,029$ 2,411,125$ 1,096$ 0.1 Mandatory Transfers 345,888 350,360 343,360 (7,000) (2.0) Non Mandatory Transfers (129,331)
Total Expenditures & Transfers 2,888,189$ 2,760,389$ 2,754,485$ (5,904)$ (0.2) Fund Balance Addition/(Reduction) 41,738$ -$ -$ -$
TOTALS
Revenues 238,953,897$ 222,473,829$ 231,893,419$ 9,419,590$ 4.2 Expenditures and Transfers
Expenditures 205,532,652$ 236,145,121$ 224,551,564$ (11,593,557)$ (4.9) Mandatory Transfers 4,101,571 4,352,745 4,365,698 12,953 0.3 Non-Mandatory Transfers 11,753,067 9,741,274 2,976,157 (6,765,117) (69.5)
Total Expenditures & Transfers 221,387,290$ 250,239,140$ 231,893,419$ (18,345,721)$ (7.3) Fund Balance Addition/(Reduction) 17,566,607$ (27,765,311)$ -$ 27,765,311$ 100.0
Health Science CenterFY 2013 Proposed Budget Summary
Unrestricted Current Funds Revenue, Expenditures, and Transfers
PROBABLE TO PROPOSED
CHANGE
Schedule 15 ‐ HSC37
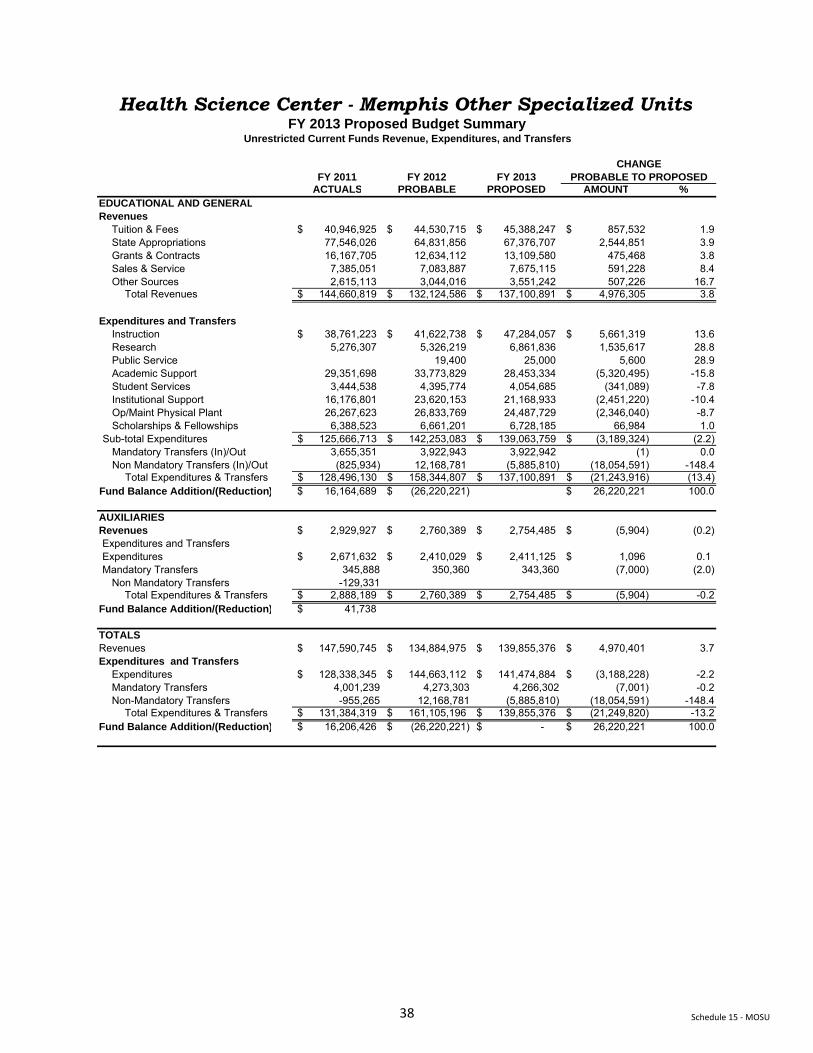
FY 2011 FY 2012 FY 2013ACTUALS PROBABLE PROPOSED AMOUNT %
EDUCATIONAL AND GENERALRevenues
Tuition & Fees 40,946,925$ 44,530,715$ 45,388,247$ 857,532$ 1.9State Appropriations 77,546,026 64,831,856 67,376,707 2,544,851 3.9Grants & Contracts 16,167,705 12,634,112 13,109,580 475,468 3.8Sales & Service 7,385,051 7,083,887 7,675,115 591,228 8.4Other Sources 2,615,113 3,044,016 3,551,242 507,226 16.7
Total Revenues 144,660,819$ 132,124,586$ 137,100,891$ 4,976,305$ 3.8
Expenditures and TransfersInstruction 38,761,223$ 41,622,738$ 47,284,057$ 5,661,319$ 13.6Research 5,276,307 5,326,219 6,861,836 1,535,617 28.8Public Service 19,400 25,000 5,600 28.9Academic Support 29,351,698 33,773,829 28,453,334 (5,320,495) -15.8Student Services 3,444,538 4,395,774 4,054,685 (341,089) -7.8Institutional Support 16,176,801 23,620,153 21,168,933 (2,451,220) -10.4Op/Maint Physical Plant 26,267,623 26,833,769 24,487,729 (2,346,040) -8.7Scholarships & Fellowships 6,388,523 6,661,201 6,728,185 66,984 1.0
Sub-total Expenditures 125,666,713$ 142,253,083$ 139,063,759$ (3,189,324)$ (2.2) Mandatory Transfers (In)/Out 3,655,351 3,922,943 3,922,942 (1) 0.0Non Mandatory Transfers (In)/Out (825,934) 12,168,781 (5,885,810) (18,054,591) -148.4
Total Expenditures & Transfers 128,496,130$ 158,344,807$ 137,100,891$ (21,243,916)$ (13.4) Fund Balance Addition/(Reduction) 16,164,689$ (26,220,221)$ 26,220,221$ 100.0
AUXILIARIESRevenues 2,929,927$ 2,760,389$ 2,754,485$ (5,904)$ (0.2) Expenditures and TransfersExpenditures 2,671,632$ 2,410,029$ 2,411,125$ 1,096$ 0.1 Mandatory Transfers 345,888 350,360 343,360 (7,000) (2.0)
Non Mandatory Transfers -129,331Total Expenditures & Transfers 2,888,189$ 2,760,389$ 2,754,485$ (5,904)$ -0.2
Fund Balance Addition/(Reduction) 41,738$
TOTALSRevenues 147,590,745$ 134,884,975$ 139,855,376$ 4,970,401$ 3.7Expenditures and Transfers
Expenditures 128,338,345$ 144,663,112$ 141,474,884$ (3,188,228)$ -2.2Mandatory Transfers 4,001,239 4,273,303 4,266,302 (7,001) -0.2Non-Mandatory Transfers -955,265 12,168,781 (5,885,810) (18,054,591) -148.4
Total Expenditures & Transfers 131,384,319$ 161,105,196$ 139,855,376$ (21,249,820)$ -13.2Fund Balance Addition/(Reduction) 16,206,426$ (26,220,221)$ -$ 26,220,221$ 100.0
PROBABLE TO PROPOSEDCHANGE
Unrestricted Current Funds Revenue, Expenditures, and TransfersFY 2013 Proposed Budget Summary
Health Science Center - Memphis Other Specialized Units
Schedule 15 ‐ MOSU38
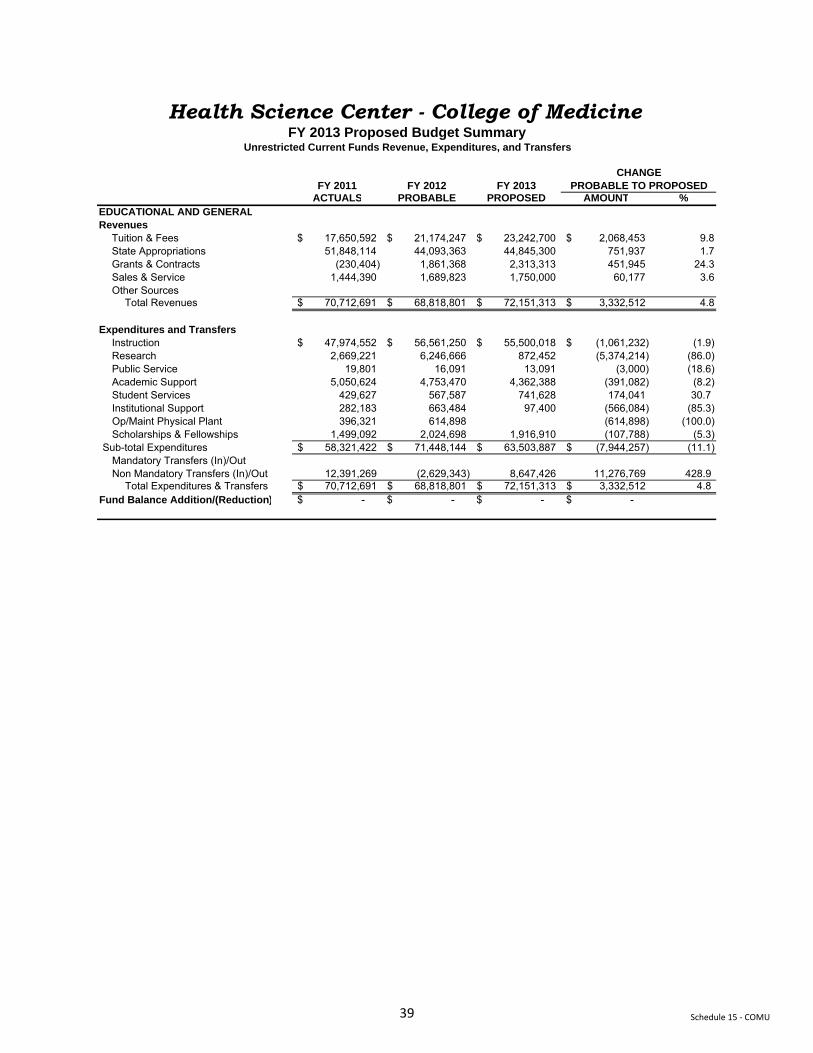
FY 2011 FY 2012 FY 2013ACTUALS PROBABLE PROPOSED AMOUNT %
EDUCATIONAL AND GENERALRevenues
Tuition & Fees 17,650,592$ 21,174,247$ 23,242,700$ 2,068,453$ 9.8State Appropriations 51,848,114 44,093,363 44,845,300 751,937 1.7Grants & Contracts (230,404) 1,861,368 2,313,313 451,945 24.3Sales & Service 1,444,390 1,689,823 1,750,000 60,177 3.6Other Sources
Total Revenues 70,712,691$ 68,818,801$ 72,151,313$ 3,332,512$ 4.8
Expenditures and TransfersInstruction 47,974,552$ 56,561,250$ 55,500,018$ (1,061,232)$ (1.9) Research 2,669,221 6,246,666 872,452 (5,374,214) (86.0) Public Service 19,801 16,091 13,091 (3,000) (18.6) Academic Support 5,050,624 4,753,470 4,362,388 (391,082) (8.2) Student Services 429,627 567,587 741,628 174,041 30.7 Institutional Support 282,183 663,484 97,400 (566,084) (85.3) Op/Maint Physical Plant 396,321 614,898 (614,898) (100.0) Scholarships & Fellowships 1,499,092 2,024,698 1,916,910 (107,788) (5.3)
Sub-total Expenditures 58,321,422$ 71,448,144$ 63,503,887$ (7,944,257)$ (11.1) Mandatory Transfers (In)/OutNon Mandatory Transfers (In)/Out 12,391,269 (2,629,343) 8,647,426 11,276,769 428.9
Total Expenditures & Transfers 70,712,691$ 68,818,801$ 72,151,313$ 3,332,512$ 4.8 Fund Balance Addition/(Reduction) -$ -$ -$ -$
PROBABLE TO PROPOSEDCHANGE
Unrestricted Current Funds Revenue, Expenditures, and TransfersFY 2013 Proposed Budget Summary
Health Science Center - College of Medicine
Schedule 15 ‐ COMU39
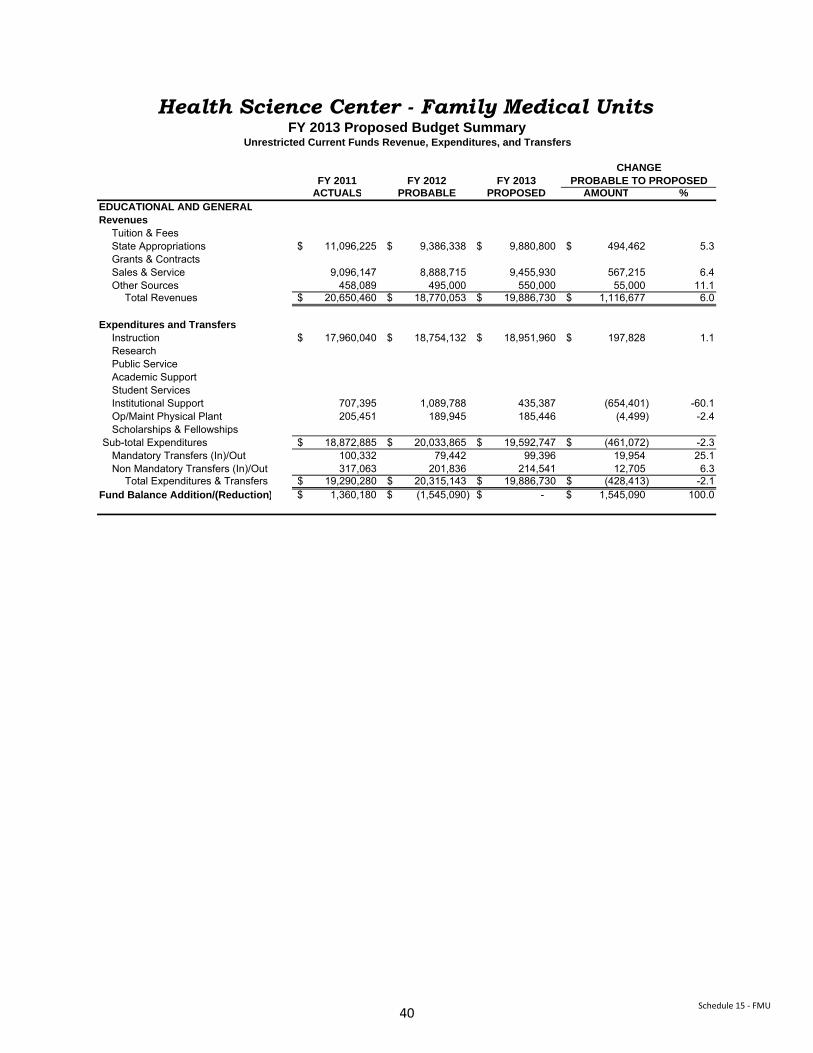
FY 2011 FY 2012 FY 2013ACTUALS PROBABLE PROPOSED AMOUNT %
EDUCATIONAL AND GENERALRevenues
Tuition & FeesState Appropriations 11,096,225$ 9,386,338$ 9,880,800$ 494,462$ 5.3Grants & ContractsSales & Service 9,096,147 8,888,715 9,455,930 567,215 6.4Other Sources 458,089 495,000 550,000 55,000 11.1
Total Revenues 20,650,460$ 18,770,053$ 19,886,730$ 1,116,677$ 6.0
Expenditures and TransfersInstruction 17,960,040$ 18,754,132$ 18,951,960$ 197,828$ 1.1ResearchPublic ServiceAcademic SupportStudent ServicesInstitutional Support 707,395 1,089,788 435,387 (654,401) -60.1Op/Maint Physical Plant 205,451 189,945 185,446 (4,499) -2.4Scholarships & Fellowships
Sub-total Expenditures 18,872,885$ 20,033,865$ 19,592,747$ (461,072)$ -2.3Mandatory Transfers (In)/Out 100,332 79,442 99,396 19,954 25.1Non Mandatory Transfers (In)/Out 317,063 201,836 214,541 12,705 6.3
Total Expenditures & Transfers 19,290,280$ 20,315,143$ 19,886,730$ (428,413)$ -2.1Fund Balance Addition/(Reduction) 1,360,180$ (1,545,090)$ -$ 1,545,090$ 100.0
PROBABLE TO PROPOSEDCHANGE
Unrestricted Current Funds Revenue, Expenditures, and TransfersFY 2013 Proposed Budget Summary
Health Science Center - Family Medical Units
Schedule 15 ‐ FMU40

FY 2011 FY 2012 FY 2013 ACTUALS PROBABLE PROPOSED AMOUNT %
EDUCATIONAL AND GENERALRevenues
Tuition & Fees 9,807,038$ 10,452,412$ 10,676,585$ 224,173$ 2.1 State Appropriations 74,134,568 66,317,743 69,742,411 3,424,668 5.2 Grants & Contracts 4,352,880 3,881,177 4,351,177 470,000 12.1 Sales & Service 17,398,234 17,697,469 19,272,556 1,575,087 8.9 Other Sources 14,250,371 16,017,371 16,055,126 37,755 0.2
Total Revenues 119,943,092$ 114,366,172$ 120,097,855$ 5,731,683$ 5.0
Expenditures and TransfersInstruction 25,892,462$ 26,853,840$ 31,244,936$ 4,391,096$ 16.4 Research 34,455,973 38,297,167 38,880,296 583,129 1.5 Public Service 39,325,612 48,405,185 42,064,673 (6,340,512) (13.1) Academic Support 6,335,973 6,840,093 6,977,023 136,930 2.0 Student ServicesInstitutional Support 1,814,931 2,063,659 2,062,246 (1,413) (0.1) Op/Maint Physical Plant 3,014,170 3,413,617 3,543,000 129,383 3.8 Scholarships & Fellowships - - -
Sub-total Expenditures 110,839,121$ 125,873,561$ 124,772,174$ (1,101,387)$ (0.9) Mandatory Transfers (In)/Out - Non Mandatory Transfers (In)/Out 4,703,531 590,057 (727,819) (1,317,876) (223.4)
Total Expenditures & Transfers 115,542,652$ 126,463,618$ 124,044,355$ (2,419,263)$ (1.9) Fund Balance Addition/(Reduction) 4,400,440$ (12,097,446)$ (3,946,500)$ 8,150,946$ 67.4
PROBABLE TO PROPOSED
Agricultural Units TotalFY 2013 Proposed Budget Summary
Unrestricted Current Funds Revenue, Expenditures, and Transfers
CHANGE
Schedule 15 ‐ AG41
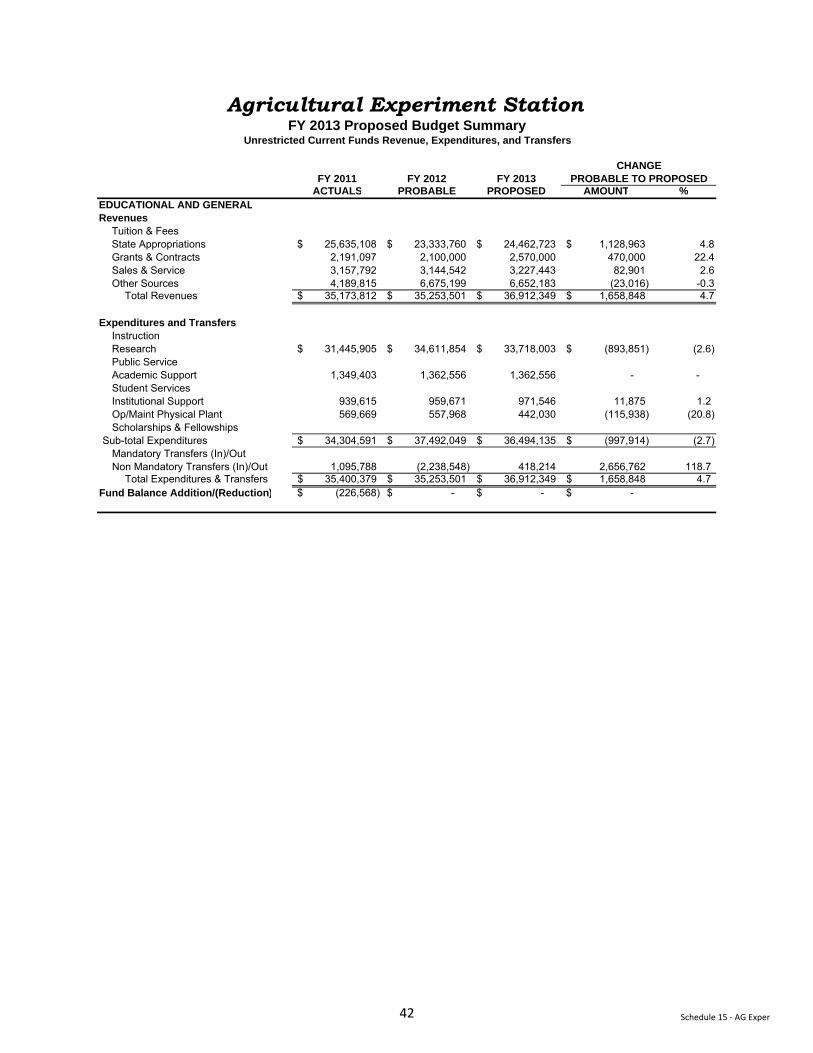
FY 2011 FY 2012 FY 2013ACTUALS PROBABLE PROPOSED AMOUNT %
EDUCATIONAL AND GENERALRevenues
Tuition & FeesState Appropriations 25,635,108$ 23,333,760$ 24,462,723$ 1,128,963$ 4.8Grants & Contracts 2,191,097 2,100,000 2,570,000 470,000 22.4Sales & Service 3,157,792 3,144,542 3,227,443 82,901 2.6Other Sources 4,189,815 6,675,199 6,652,183 (23,016) -0.3
Total Revenues 35,173,812$ 35,253,501$ 36,912,349$ 1,658,848$ 4.7
Expenditures and TransfersInstructionResearch 31,445,905$ 34,611,854$ 33,718,003$ (893,851)$ (2.6) Public ServiceAcademic Support 1,349,403 1,362,556 1,362,556 - - Student ServicesInstitutional Support 939,615 959,671 971,546 11,875 1.2 Op/Maint Physical Plant 569,669 557,968 442,030 (115,938) (20.8) Scholarships & Fellowships
Sub-total Expenditures 34,304,591$ 37,492,049$ 36,494,135$ (997,914)$ (2.7) Mandatory Transfers (In)/OutNon Mandatory Transfers (In)/Out 1,095,788 (2,238,548) 418,214 2,656,762 118.7
Total Expenditures & Transfers 35,400,379$ 35,253,501$ 36,912,349$ 1,658,848$ 4.7 Fund Balance Addition/(Reduction) (226,568)$ -$ -$ -$
PROBABLE TO PROPOSEDCHANGE
Unrestricted Current Funds Revenue, Expenditures, and TransfersFY 2013 Proposed Budget Summary
Agricultural Experiment Station
Schedule 15 ‐ AG Exper42

FY 2011 FY 2012 FY 2013ACTUALS PROBABLE PROPOSED AMOUNT %
EDUCATIONAL AND GENERALRevenues
Tuition & FeesState Appropriations 31,082,557$ 28,160,380$ 29,560,066$ 1,399,686$ 5.0Grants & Contracts 794,408 495,000 495,000 - 0.0Sales & Service 3,903,098 3,855,590 4,371,316 515,726 13.4Other Sources 9,883,300 9,134,225 9,197,997 63,772 0.7
Total Revenues 45,663,362$ 41,645,195$ 43,624,379$ 1,979,184$ 4.8
Expenditures and TransfersInstructionResearchPublic Service 39,325,612$ 48,330,618$ 41,990,706$ (6,339,912)$ (13.1) Academic Support 819,438 739,971 757,468 17,497 2.4 Student ServicesInstitutional Support 407,554 571,435 572,435 1,000 0.2 Op/Maint Physical PlantScholarships & Fellowships
Sub-total Expenditures 40,552,604$ 49,642,024$ 43,320,609$ (6,321,415)$ (12.7) Mandatory Transfers (In)/OutNon Mandatory Transfers (In)/Out 1,823,491 2,442,224 760,923 (1,681,301) (68.8)
Total Expenditures & Transfers 42,376,095$ 52,084,248$ 44,081,532$ (8,002,716)$ (15.4) Fund Balance Addition/(Reduction) 3,287,267$ (10,439,053)$ (457,153)$ 9,981,900$ 95.6
PROBABLE TO PROPOSEDCHANGE
Unrestricted Current Funds Revenue, Expenditures, and TransfersFY 2013 Proposed Budget Summary
UT Extension
Schedule 15 ‐ UT Extension43

FY 2011 FY 2012 FY 2013ACTUALS PROBABLE PROPOSED AMOUNT %
EDUCATIONAL AND GENERALRevenues
Tuition & Fees 9,807,038$ 10,452,412$ 10,676,585$ 224,173$ 2.1State Appropriations 17,416,903 14,823,603 15,719,622 896,019 6.0Grants & Contracts 1,367,376 1,286,177 1,286,177 - 0.0Sales & Service 10,337,345 10,697,337 11,673,797 976,460 9.1Other Sources 177,256 207,947 204,946 (3,001) -1.4
Total Revenues 39,105,918$ 37,467,476$ 39,561,127$ 2,093,651$ 5.6
Expenditures and TransfersInstruction 25,892,462$ 26,853,840$ 31,244,936$ 4,391,096$ 16.4 Research 3,010,068 3,685,313 5,162,293 1,476,980 40.1 Public Service 74,567$ 73,967$ (600)$ (0.8) Academic Support 4,167,133 4,737,566 4,856,999 119,433 2.5 Student ServicesInstitutional Support 467,762 532,553 518,265 (14,288) (2.7) Op/Maint Physical Plant 2,444,500 2,855,649 3,100,970 245,321 8.6 Scholarships & Fellowships - - -
Sub-total Expenditures 35,981,926$ 38,739,488$ 44,957,430$ 6,217,942$ 16.1 Mandatory Transfers (In)/Out - Non Mandatory Transfers (In)/Out 1,784,252 386,381 (1,906,956) (2,293,337) (593.5)
Total Expenditures & Transfers 37,766,178$ 39,125,869$ 43,050,474$ 3,924,605$ 10.0 Fund Balance Addition/(Reduction) 1,339,740$ (1,658,393)$ (3,489,347)$ (1,830,954)$ (110.4)
PROBABLE TO PROPOSEDCHANGE
Unrestricted Current Funds Revenue, Expenditures, and TransfersFY 2013 Proposed Budget Summary
College of Veterinary Medicine
Schedule 15 ‐ Vet Med44
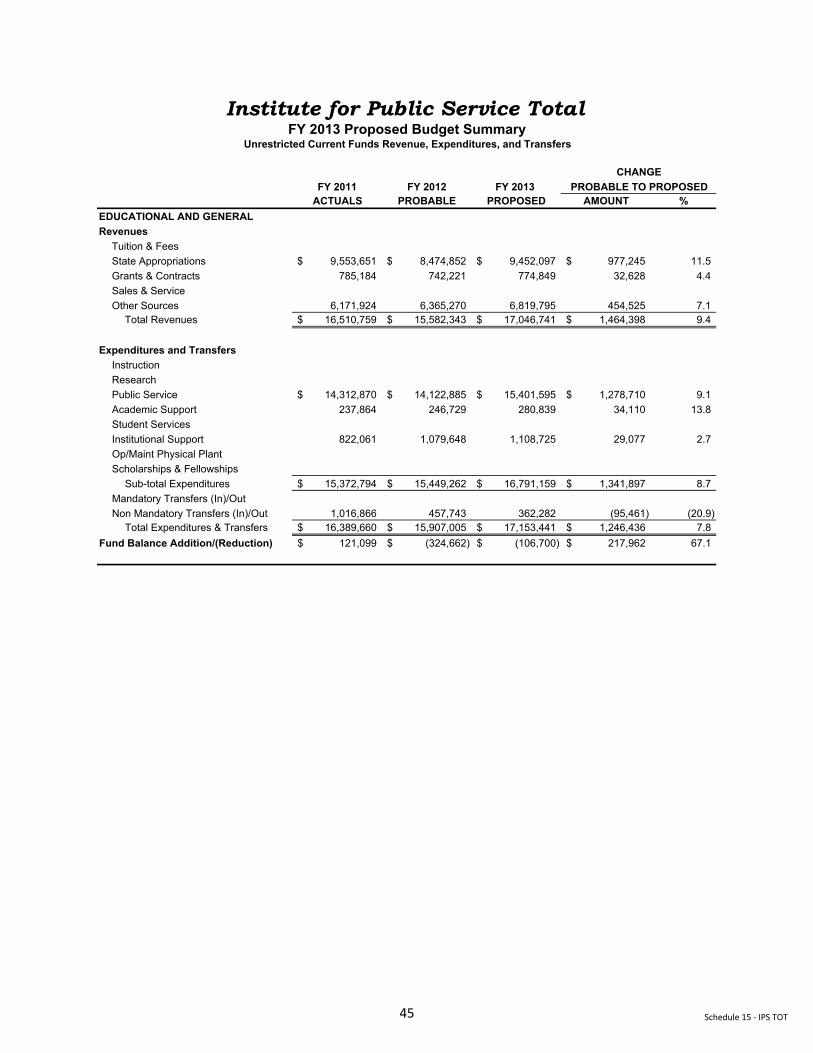
FY 2011 FY 2012 FY 2013 ACTUALS PROBABLE PROPOSED AMOUNT %
EDUCATIONAL AND GENERALRevenues
Tuition & FeesState Appropriations 9,553,651$ 8,474,852$ 9,452,097$ 977,245$ 11.5 Grants & Contracts 785,184 742,221 774,849 32,628 4.4 Sales & ServiceOther Sources 6,171,924 6,365,270 6,819,795 454,525 7.1
Total Revenues 16,510,759$ 15,582,343$ 17,046,741$ 1,464,398$ 9.4
Expenditures and TransfersInstructionResearchPublic Service 14,312,870$ 14,122,885$ 15,401,595$ 1,278,710$ 9.1 Academic Support 237,864 246,729 280,839 34,110 13.8 Student ServicesInstitutional Support 822,061 1,079,648 1,108,725 29,077 2.7 Op/Maint Physical PlantScholarships & Fellowships
Sub-total Expenditures 15,372,794$ 15,449,262$ 16,791,159$ 1,341,897$ 8.7 Mandatory Transfers (In)/OutNon Mandatory Transfers (In)/Out 1,016,866 457,743 362,282 (95,461) (20.9)
Total Expenditures & Transfers 16,389,660$ 15,907,005$ 17,153,441$ 1,246,436$ 7.8 Fund Balance Addition/(Reduction) 121,099$ (324,662)$ (106,700)$ 217,962$ 67.1
PROBABLE TO PROPOSED
Institute for Public Service TotalFY 2013 Proposed Budget Summary
Unrestricted Current Funds Revenue, Expenditures, and Transfers
CHANGE
Schedule 15 ‐ IPS TOT45

FY 2011 FY 2012 FY 2013ACTUALS PROBABLE PROPOSED AMOUNT %
EDUCATIONAL AND GENERALRevenues
Tuition & FeesState Appropriations 4,920,285$ 4,368,582$ 5,062,659$ 694,077$ 15.9 Grants & Contracts 717,770 707,221 774,849 67,628 9.6 Sales & ServiceOther Sources 444,683 489,996 733,900 243,904 49.8
Total Revenues 6,082,737$ 5,565,799$ 6,571,408$ 1,005,609$ 18.1
Expenditures and TransfersInstructionResearchPublic Service 4,366,578$ 3,948,883$ 4,905,210$ 956,327$ 24.2 Academic SupportStudent ServicesInstitutional Support 810,150 1,062,348 1,092,390 30,042 2.8 Op/Maint Physical PlantScholarships & Fellowships
Sub-total Expenditures 5,176,728$ 5,011,231$ 5,997,600$ 986,369$ 19.7 Mandatory Transfers (In)/OutNon Mandatory Transfers (In)/Out 946,851 526,102 573,808 47,706 9.1
Total Expenditures & Transfers 6,123,579$ 5,537,333$ 6,571,408$ 1,034,075$ 18.7 Fund Balance Addition/(Reduction) (40,842)$ 28,466$ -$ (28,466)$ (100.0)
PROBABLE TO PROPOSEDCHANGE
Unrestricted Current Funds Revenue, Expenditures, and TransfersFY 2013 Proposed Budget Summary
Institute for Public Service
Schedule 15 ‐ IPS46

FY 2011 FY 2012 FY 2013ACTUALS PROBABLE PROPOSED AMOUNT %
EDUCATIONAL AND GENERALRevenues
Tuition & FeesState Appropriations 2,925,338$ 2,571,285$ 2,738,469$ 167,184$ 6.5 Grants & Contracts 17,612 10,000 - (10,000) (100.0) Sales & ServiceOther Sources 2,772,017 2,918,374 2,939,174 20,800 0.7
Total Revenues 5,714,967$ 5,499,659$ 5,677,643$ 177,984$ 3.2
Expenditures and TransfersInstructionResearchPublic Service 5,099,506$ 5,421,282$ 5,647,899$ 226,617$ 4.2 Academic Support 237,864 246,729 280,839 34,110 13.8 Student ServicesInstitutional Support 6,911 8,500 8,500 - - Op/Maint Physical PlantScholarships & Fellowships
Sub-total Expenditures 5,344,281$ 5,676,511$ 5,937,238$ 260,727$ 4.6 Mandatory Transfers (In)/OutNon Mandatory Transfers (In)/Out 104,184 36,706 (107,568) (144,274) (393.1)
Total Expenditures & Transfers 5,448,464$ 5,713,217$ 5,829,670$ 116,453$ 2.0 Fund Balance Addition/(Reduction) 266,502 (213,558) (152,027) 61,531 28.8
PROBABLE TO PROPOSEDCHANGE
Unrestricted Current Funds Revenue, Expenditures, and TransfersFY 2013 Proposed Budget Summary
Municipal Technical Advisory Service
Schedule 15 ‐ MTAS47
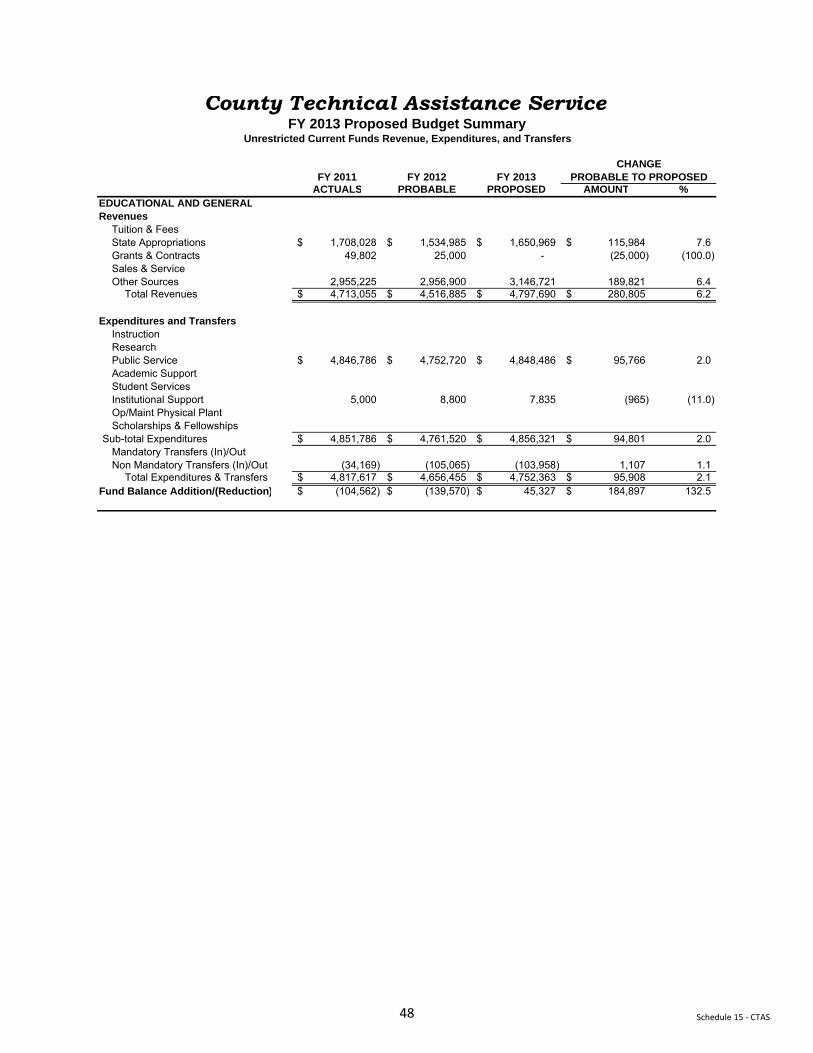
FY 2011 FY 2012 FY 2013ACTUALS PROBABLE PROPOSED AMOUNT %
EDUCATIONAL AND GENERALRevenues
Tuition & FeesState Appropriations 1,708,028$ 1,534,985$ 1,650,969$ 115,984$ 7.6 Grants & Contracts 49,802 25,000 - (25,000) (100.0) Sales & ServiceOther Sources 2,955,225 2,956,900 3,146,721 189,821 6.4
Total Revenues 4,713,055$ 4,516,885$ 4,797,690$ 280,805$ 6.2
Expenditures and TransfersInstructionResearchPublic Service 4,846,786$ 4,752,720$ 4,848,486$ 95,766$ 2.0 Academic SupportStudent ServicesInstitutional Support 5,000 8,800 7,835 (965) (11.0) Op/Maint Physical PlantScholarships & Fellowships
Sub-total Expenditures 4,851,786$ 4,761,520$ 4,856,321$ 94,801$ 2.0 Mandatory Transfers (In)/OutNon Mandatory Transfers (In)/Out (34,169) (105,065) (103,958) 1,107 1.1
Total Expenditures & Transfers 4,817,617$ 4,656,455$ 4,752,363$ 95,908$ 2.1 Fund Balance Addition/(Reduction) (104,562)$ (139,570)$ 45,327$ 184,897$ 132.5
PROBABLE TO PROPOSEDCHANGE
Unrestricted Current Funds Revenue, Expenditures, and TransfersFY 2013 Proposed Budget Summary
County Technical Assistance Service
Schedule 15 ‐ CTAS48
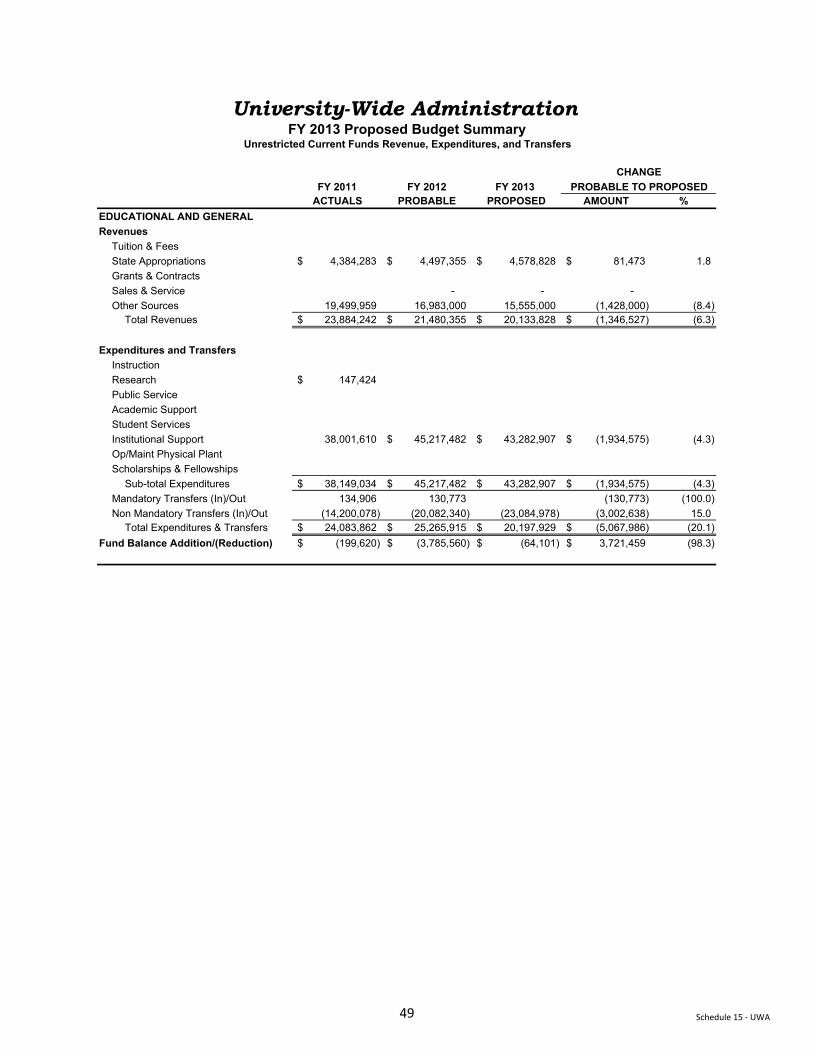
FY 2011 FY 2012 FY 2013 ACTUALS PROBABLE PROPOSED AMOUNT %
EDUCATIONAL AND GENERALRevenues
Tuition & FeesState Appropriations 4,384,283$ 4,497,355$ 4,578,828$ 81,473$ 1.8 Grants & ContractsSales & Service - - - Other Sources 19,499,959 16,983,000 15,555,000 (1,428,000) (8.4)
Total Revenues 23,884,242$ 21,480,355$ 20,133,828$ (1,346,527)$ (6.3)
Expenditures and TransfersInstructionResearch 147,424$ Public ServiceAcademic SupportStudent ServicesInstitutional Support 38,001,610 45,217,482$ 43,282,907$ (1,934,575)$ (4.3) Op/Maint Physical PlantScholarships & Fellowships
Sub-total Expenditures 38,149,034$ 45,217,482$ 43,282,907$ (1,934,575)$ (4.3) Mandatory Transfers (In)/Out 134,906 130,773 (130,773) (100.0) Non Mandatory Transfers (In)/Out (14,200,078) (20,082,340) (23,084,978) (3,002,638) 15.0
Total Expenditures & Transfers 24,083,862$ 25,265,915$ 20,197,929$ (5,067,986)$ (20.1) Fund Balance Addition/(Reduction) (199,620)$ (3,785,560)$ (64,101)$ 3,721,459$ (98.3)
PROBABLE TO PROPOSED
University-Wide AdministrationFY 2013 Proposed Budget Summary
Unrestricted Current Funds Revenue, Expenditures, and Transfers
CHANGE
Schedule 15 ‐ UWA49
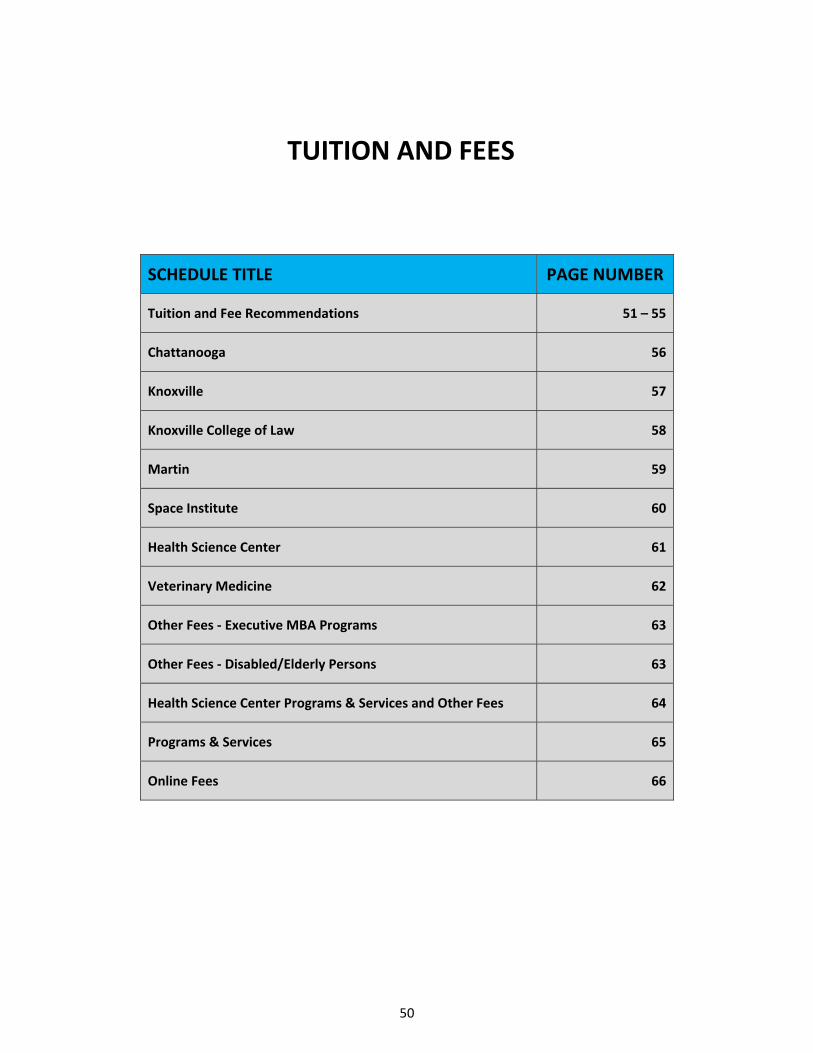
SCHEDULE TITLE PAGE NUMBER
Tuition and Fee Recommendations 51 – 55
Chattanooga 56
Knoxville 57
Knoxville College of Law 58
Martin 59
Space Institute 60
Health Science Center 61
Veterinary Medicine 62
Other Fees ‐ Executive MBA Programs 63
Other Fees ‐ Disabled/Elderly Persons 63
Health Science Center Programs & Services and Other Fees 64
Programs & Services 65
Online Fees 66
TUITION AND FEES
50
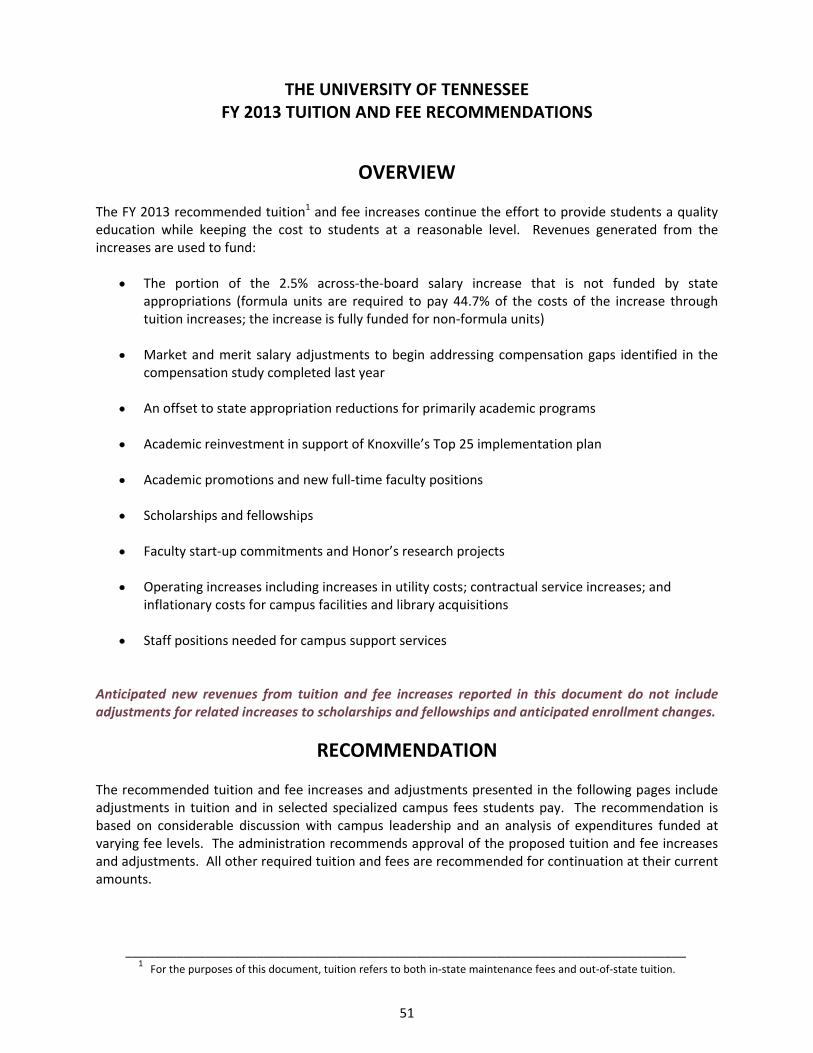
THE UNIVERSITY OF TENNESSEE FY 2013 TUITION AND FEE RECOMMENDATIONS
OVERVIEW The FY 2013 recommended tuition1 and fee increases continue the effort to provide students a quality education while keeping the cost to students at a reasonable level. Revenues generated from the increases are used to fund:
The portion of the 2.5% across‐the‐board salary increase that is not funded by state appropriations (formula units are required to pay 44.7% of the costs of the increase through tuition increases; the increase is fully funded for non‐formula units)
Market and merit salary adjustments to begin addressing compensation gaps identified in the compensation study completed last year
An offset to state appropriation reductions for primarily academic programs
Academic reinvestment in support of Knoxville’s Top 25 implementation plan
Academic promotions and new full‐time faculty positions
Scholarships and fellowships
Faculty start‐up commitments and Honor’s research projects
Operating increases including increases in utility costs; contractual service increases; and inflationary costs for campus facilities and library acquisitions
Staff positions needed for campus support services
Anticipated new revenues from tuition and fee increases reported in this document do not include adjustments for related increases to scholarships and fellowships and anticipated enrollment changes.
RECOMMENDATION The recommended tuition and fee increases and adjustments presented in the following pages include adjustments in tuition and in selected specialized campus fees students pay. The recommendation is based on considerable discussion with campus leadership and an analysis of expenditures funded at varying fee levels. The administration recommends approval of the proposed tuition and fee increases and adjustments. All other required tuition and fees are recommended for continuation at their current amounts.
_____________________________________________________________________________ 1 For the purposes of this document, tuition refers to both in‐state maintenance fees and out‐of‐state tuition.
51
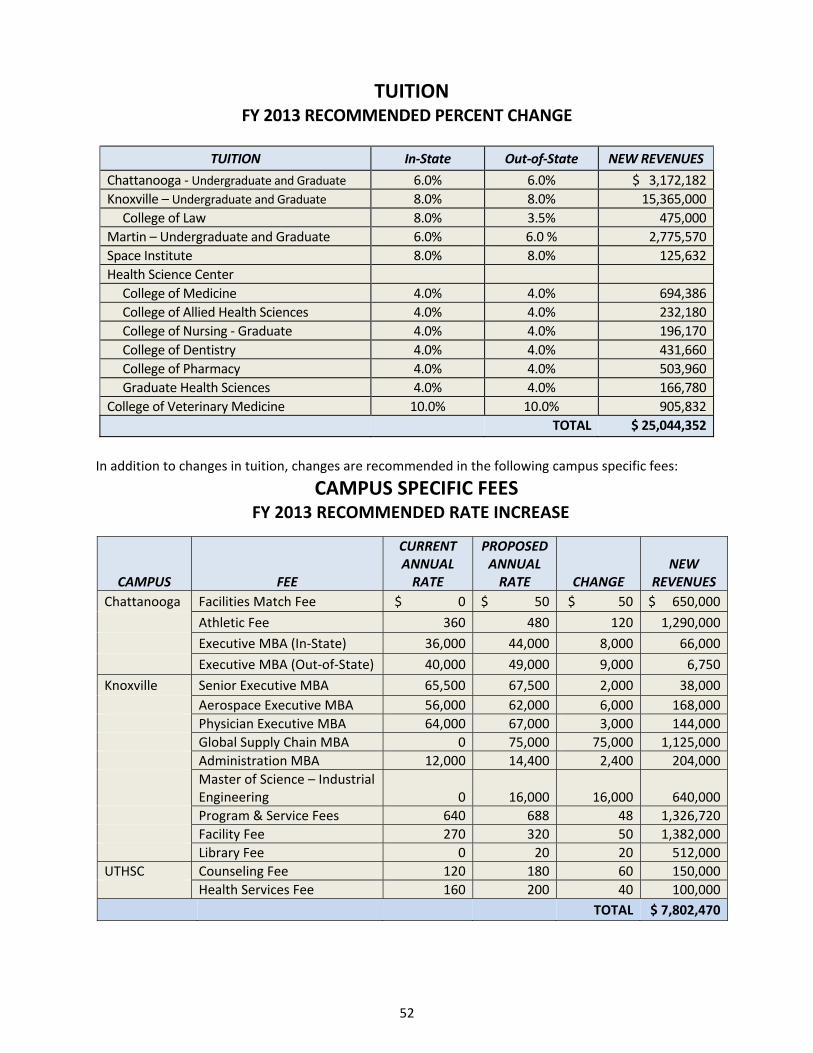
TUITION
FY 2013 RECOMMENDED PERCENT CHANGE
In addition to changes in tuition, changes are recommended in the following campus specific fees:
CAMPUS SPECIFIC FEES FY 2013 RECOMMENDED RATE INCREASE
CAMPUS
FEE
CURRENT ANNUAL RATE
PROPOSEDANNUAL RATE CHANGE
NEW REVENUES
Chattanooga Facilities Match Fee $ 0 $ 50 $ 50 $ 650,000
Athletic Fee 360 480 120 1,290,000
Executive MBA (In‐State) 36,000 44,000 8,000 66,000
Executive MBA (Out‐of‐State) 40,000 49,000 9,000 6,750
Knoxville Senior Executive MBA 65,500 67,500 2,000 38,000
Aerospace Executive MBA 56,000 62,000 6,000 168,000
Physician Executive MBA 64,000 67,000 3,000 144,000
Global Supply Chain MBA 0 75,000 75,000 1,125,000
Administration MBA 12,000 14,400 2,400 204,000
Master of Science – Industrial Engineering 0 16,000 16,000 640,000
Program & Service Fees 640 688 48 1,326,720
Facility Fee 270 320 50 1,382,000
Library Fee 0 20 20 512,000
UTHSC Counseling Fee 120 180 60 150,000
Health Services Fee 160 200 40 100,000
TOTAL $ 7,802,470
TUITION In‐State Out‐of‐State NEW REVENUES
Chattanooga ‐ Undergraduate and Graduate 6.0% 6.0% $ 3,172,182
Knoxville – Undergraduate and Graduate 8.0% 8.0% 15,365,000
College of Law 8.0% 3.5% 475,000
Martin – Undergraduate and Graduate 6.0% 6.0 % 2,775,570
Space Institute 8.0% 8.0% 125,632
Health Science Center
College of Medicine 4.0% 4.0% 694,386
College of Allied Health Sciences 4.0% 4.0% 232,180
College of Nursing ‐ Graduate 4.0% 4.0% 196,170
College of Dentistry 4.0% 4.0% 431,660
College of Pharmacy 4.0% 4.0% 503,960
Graduate Health Sciences 4.0% 4.0% 166,780
College of Veterinary Medicine 10.0% 10.0% 905,832
TOTAL $ 25,044,352
52
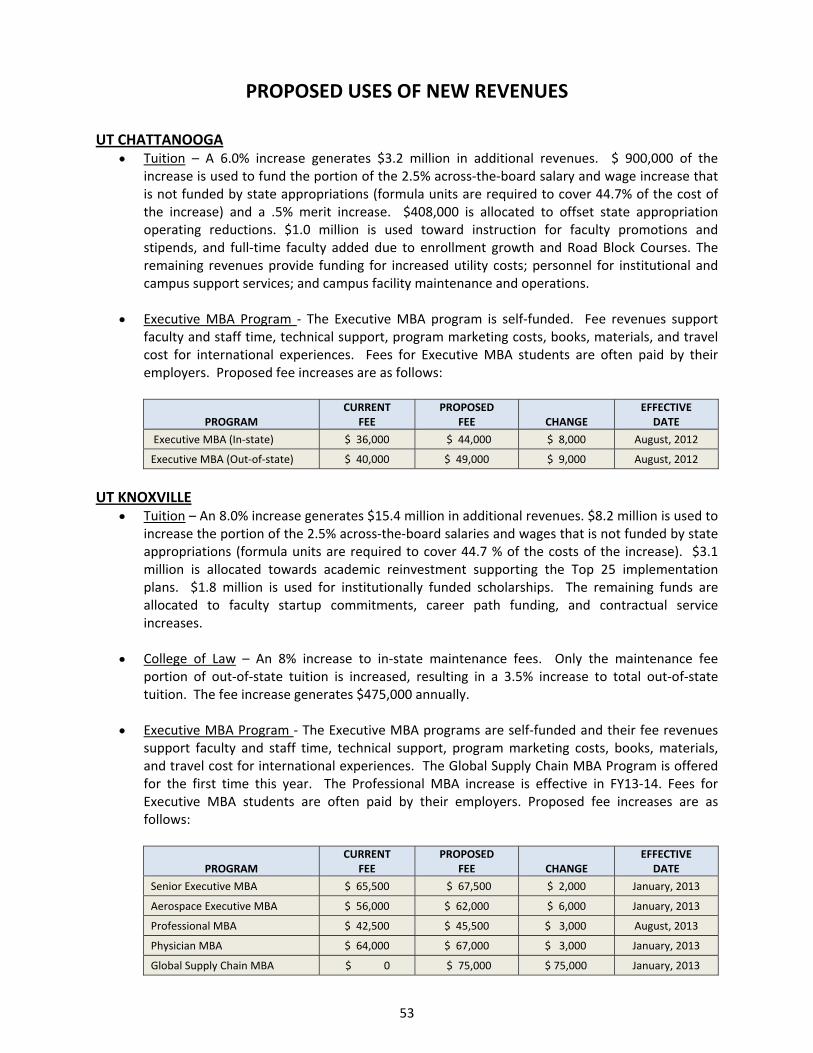
PROPOSED USES OF NEW REVENUES UT CHATTANOOGA
Tuition – A 6.0% increase generates $3.2 million in additional revenues. $ 900,000 of the increase is used to fund the portion of the 2.5% across‐the‐board salary and wage increase that is not funded by state appropriations (formula units are required to cover 44.7% of the cost of the increase) and a .5% merit increase. $408,000 is allocated to offset state appropriation operating reductions. $1.0 million is used toward instruction for faculty promotions and stipends, and full‐time faculty added due to enrollment growth and Road Block Courses. The remaining revenues provide funding for increased utility costs; personnel for institutional and campus support services; and campus facility maintenance and operations.
Executive MBA Program ‐ The Executive MBA program is self‐funded. Fee revenues support faculty and staff time, technical support, program marketing costs, books, materials, and travel cost for international experiences. Fees for Executive MBA students are often paid by their employers. Proposed fee increases are as follows:
PROGRAM
CURRENT FEE
PROPOSED FEE
CHANGE
EFFECTIVE DATE
Executive MBA (In‐state) $ 36,000 $ 44,000 $ 8,000 August, 2012
Executive MBA (Out‐of‐state) $ 40,000 $ 49,000 $ 9,000 August, 2012
UT KNOXVILLE Tuition – An 8.0% increase generates $15.4 million in additional revenues. $8.2 million is used to
increase the portion of the 2.5% across‐the‐board salaries and wages that is not funded by state appropriations (formula units are required to cover 44.7 % of the costs of the increase). $3.1 million is allocated towards academic reinvestment supporting the Top 25 implementation plans. $1.8 million is used for institutionally funded scholarships. The remaining funds are allocated to faculty startup commitments, career path funding, and contractual service increases.
College of Law – An 8% increase to in‐state maintenance fees. Only the maintenance fee portion of out‐of‐state tuition is increased, resulting in a 3.5% increase to total out‐of‐state tuition. The fee increase generates $475,000 annually.
Executive MBA Program ‐ The Executive MBA programs are self‐funded and their fee revenues
support faculty and staff time, technical support, program marketing costs, books, materials, and travel cost for international experiences. The Global Supply Chain MBA Program is offered for the first time this year. The Professional MBA increase is effective in FY13‐14. Fees for Executive MBA students are often paid by their employers. Proposed fee increases are as follows:
PROGRAM
CURRENT FEE
PROPOSED FEE
CHANGE
EFFECTIVE DATE
Senior Executive MBA $ 65,500 $ 67,500 $ 2,000 January, 2013
Aerospace Executive MBA $ 56,000 $ 62,000 $ 6,000 January, 2013
Professional MBA $ 42,500 $ 45,500 $ 3,000 August, 2013
Physician MBA $ 64,000 $ 67,000 $ 3,000 January, 2013
Global Supply Chain MBA $ 0 $ 75,000 $ 75,000 January, 2013
53
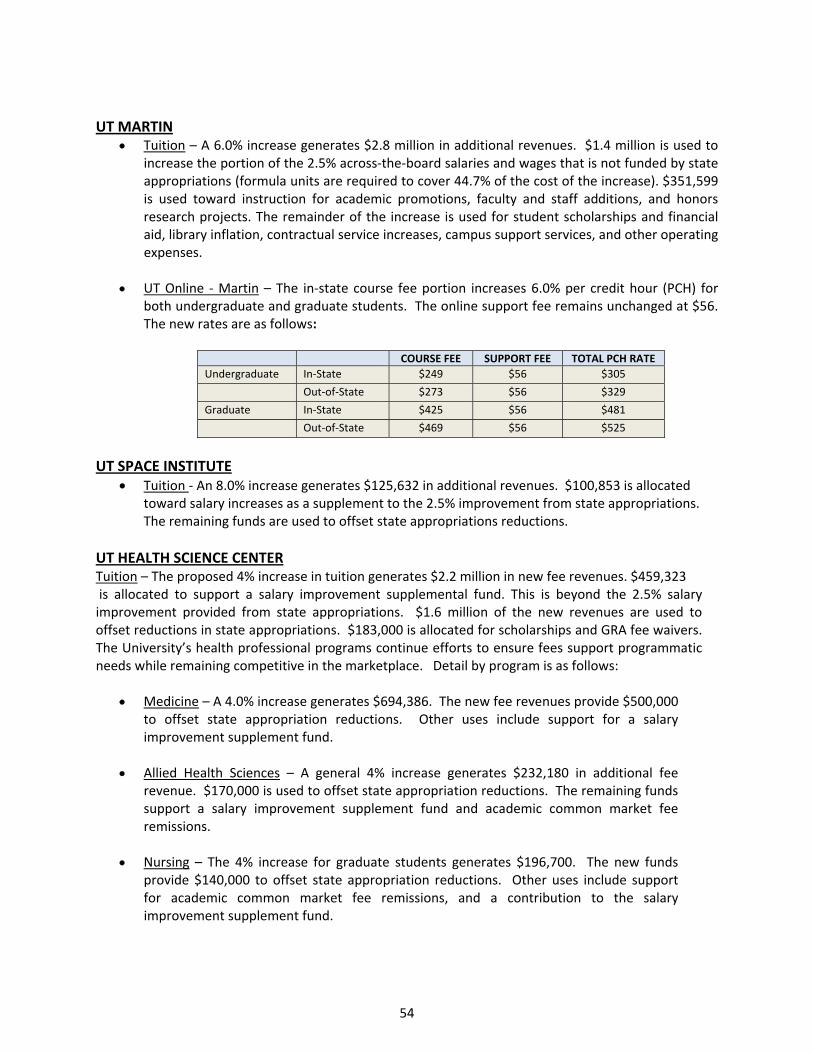
UT MARTIN
Tuition – A 6.0% increase generates $2.8 million in additional revenues. $1.4 million is used to increase the portion of the 2.5% across‐the‐board salaries and wages that is not funded by state appropriations (formula units are required to cover 44.7% of the cost of the increase). $351,599 is used toward instruction for academic promotions, faculty and staff additions, and honors research projects. The remainder of the increase is used for student scholarships and financial aid, library inflation, contractual service increases, campus support services, and other operating expenses.
UT Online ‐ Martin – The in‐state course fee portion increases 6.0% per credit hour (PCH) for
both undergraduate and graduate students. The online support fee remains unchanged at $56. The new rates are as follows:
COURSE FEE SUPPORT FEE TOTAL PCH RATE
Undergraduate In‐State $249 $56 $305
Out‐of‐State $273 $56 $329
Graduate In‐State $425 $56 $481
Out‐of‐State $469 $56 $525
UT SPACE INSTITUTE Tuition ‐ An 8.0% increase generates $125,632 in additional revenues. $100,853 is allocated
toward salary increases as a supplement to the 2.5% improvement from state appropriations. The remaining funds are used to offset state appropriations reductions.
UT HEALTH SCIENCE CENTER Tuition – The proposed 4% increase in tuition generates $2.2 million in new fee revenues. $459,323 is allocated to support a salary improvement supplemental fund. This is beyond the 2.5% salary improvement provided from state appropriations. $1.6 million of the new revenues are used to offset reductions in state appropriations. $183,000 is allocated for scholarships and GRA fee waivers. The University’s health professional programs continue efforts to ensure fees support programmatic needs while remaining competitive in the marketplace. Detail by program is as follows:
Medicine – A 4.0% increase generates $694,386. The new fee revenues provide $500,000 to offset state appropriation reductions. Other uses include support for a salary improvement supplement fund.
Allied Health Sciences – A general 4% increase generates $232,180 in additional fee
revenue. $170,000 is used to offset state appropriation reductions. The remaining funds support a salary improvement supplement fund and academic common market fee remissions.
Nursing – The 4% increase for graduate students generates $196,700. The new funds provide $140,000 to offset state appropriation reductions. Other uses include support for academic common market fee remissions, and a contribution to the salary improvement supplement fund.
54

Dentistry – The 4% increase generates $431,660. The new fee revenues provide $310,000 to offset state appropriation reductions. Other uses include support for a salary improvement supplement fund.
Pharmacy – A 4% increase generates $503,960. $360,000 is used to offset state appropriation reductions. The remaining funds support a salary improvement supplement fund.
Graduate Health Sciences – A 4% tuition increase generates $166,780. Of this total, $120,000 is used to offset state appropriation reductions. The remaining funds support the increase in graduate research and teaching assistant tuition waivers.
Health Science Center Online – Undergraduate on‐line course and support fee rates are added for a new Medical Laboratory Technician program. Graduate on‐line fee has a very slight out‐of‐state tuition increase of $1 per credit hour (PCH) as a rate correction. Otherwise, all graduate tuition and support fees will be unchanged for FY 2012‐13. The courses offered through all online programs are in the College of Allied Health Sciences. The proposed rates are as follows:
COURSE FEE SUPPORT FEE TOTAL PCH RATE
Undergraduate (New) In‐State $350 $46 $396
Out‐of‐State $415 $46 $461
Graduate ‐ Entry Level Advanced Degrees
In‐State $640 $46 $686
Out‐of‐State $705 $46 $751
UT COLLEGE OF VETERINARY MEDICINE
Tuition – A 10% increase generates $905,832 in new revenues. $410,688 is used to replace a portion of tuition revenue that will be lost due to a move from a 9 to 8 semester tuition collection model. $314,522 is used for salary increases as a supplement to the 2.5% improvement provided by state appropriations. The remaining funds are allocated to offset appropriation reductions.
55
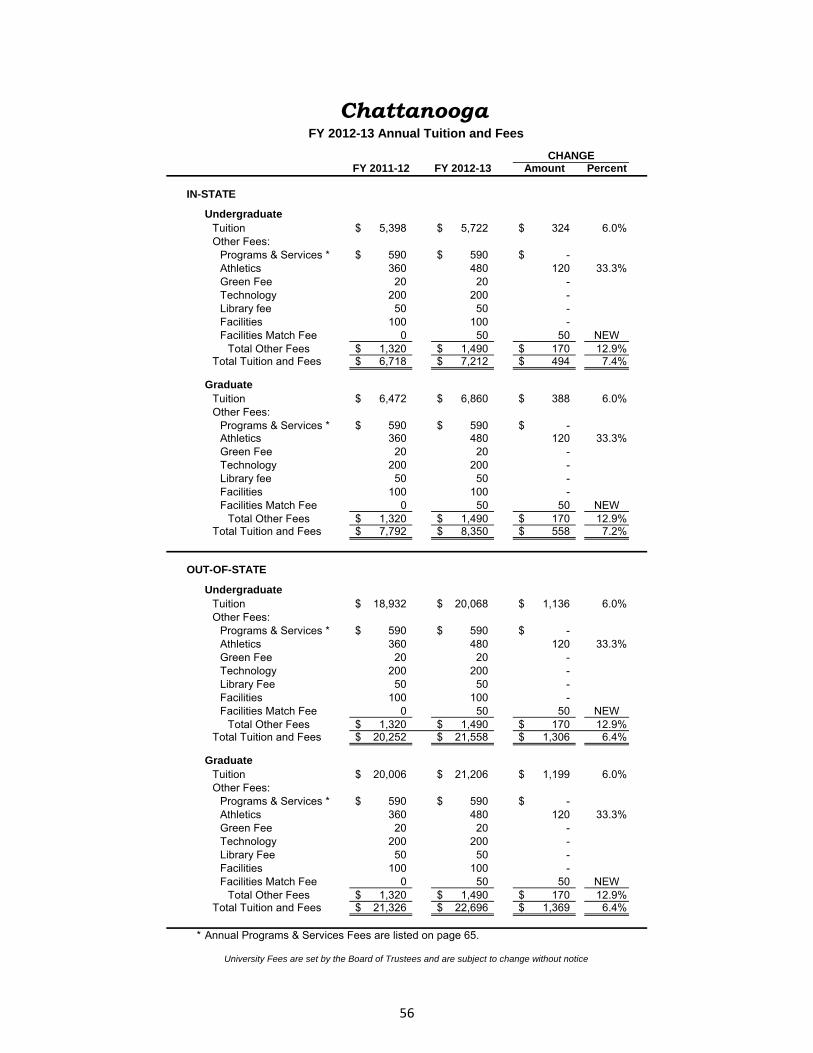
FY 2011-12 FY 2012-13 Amount Percent
IN-STATE
UndergraduateTuition 5,398$ 5,722$ 324$ 6.0%Other Fees:
Programs & Services * 590$ 590$ -$ Athletics 360 480 120 33.3%Green Fee 20 20 - Technology 200 200 - Library fee 50 50 - Facilities 100 100 - Facilities Match Fee 0 50 50 NEW
Total Other Fees 1,320$ 1,490$ 170$ 12.9%Total Tuition and Fees 6,718$ 7,212$ 494$ 7.4%
GraduateTuition 6,472$ 6,860$ 388$ 6.0%Other Fees:
Programs & Services * 590$ 590$ -$ Athletics 360 480 120 33.3%Green Fee 20 20 - Technology 200 200 - Library fee 50 50 - Facilities 100 100 - Facilities Match Fee 0 50 50 NEW
Total Other Fees 1,320$ 1,490$ 170$ 12.9%Total Tuition and Fees 7,792$ 8,350$ 558$ 7.2%
U d d t
Chattanooga
CHANGE
FY 2012-13 Annual Tuition and Fees
OUT-OF-STATE
UndergraduateTuition 18,932$ 20,068$ 1,136$ 6.0%Other Fees:
Programs & Services * 590$ 590$ -$ Athletics 360 480 120 33.3%Green Fee 20 20 - Technology 200 200 - Library Fee 50 50 - Facilities 100 100 - Facilities Match Fee 0 50 50 NEW
Total Other Fees 1,320$ 1,490$ 170$ 12.9%Total Tuition and Fees 20,252$ 21,558$ 1,306$ 6.4%
GraduateTuition 20,006$ 21,206$ 1,199$ 6.0%Other Fees:
Programs & Services * 590$ 590$ -$ Athletics 360 480 120 33.3%Green Fee 20 20 - Technology 200 200 - Library Fee 50 50 - Facilities 100 100 - Facilities Match Fee 0 50 50 NEW
Total Other Fees 1,320$ 1,490$ 170$ 12.9%Total Tuition and Fees 21,326$ 22,696$ 1,369$ 6.4%
* Annual Programs & Services Fees are listed on page 65.
University Fees are set by the Board of Trustees and are subject to change without notice
56
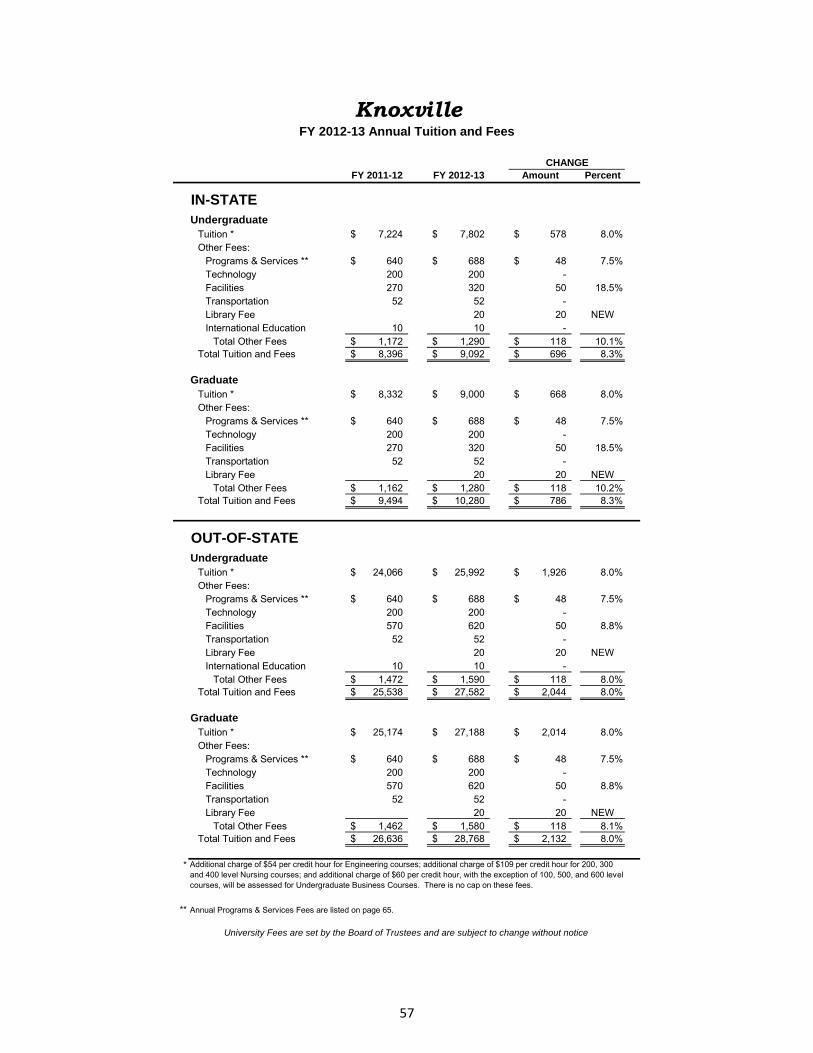
FY 2011-12 FY 2012-13 Amount Percent
UndergraduateTuition * 7,224$ 7,802$ 578$ 8.0%Other Fees:
Programs & Services ** 640$ 688$ 48$ 7.5%Technology 200 200 - Facilities 270 320 50 18.5%Transportation 52 52 - Library Fee 20 20 NEWInternational Education 10 10 -
Total Other Fees 1,172$ 1,290$ 118$ 10.1%Total Tuition and Fees 8,396$ 9,092$ 696$ 8.3%
GraduateTuition * 8,332$ 9,000$ 668$ 8.0%Other Fees:
Programs & Services ** 640$ 688$ 48$ 7.5%Technology 200 200 - Facilities 270 320 50 18.5%Transportation 52 52 - Library Fee 20 20 NEW
Total Other Fees 1,162$ 1,280$ 118$ 10.2%Total Tuition and Fees 9,494$ 10,280$ 786$ 8.3%
UndergraduateTuition * 24,066$ 25,992$ 1,926$ 8.0%Other Fees:
KnoxvilleFY 2012-13 Annual Tuition and Fees
CHANGE
IN-STATE
OUT-OF-STATE
Other Fees:Programs & Services ** 640$ 688$ 48$ 7.5%Technology 200 200 - Facilities 570 620 50 8.8%Transportation 52 52 - Library Fee 20 20 NEWInternational Education 10 10 -
Total Other Fees 1,472$ 1,590$ 118$ 8.0%Total Tuition and Fees 25,538$ 27,582$ 2,044$ 8.0%
GraduateTuition * 25,174$ 27,188$ 2,014$ 8.0%Other Fees:
Programs & Services ** 640$ 688$ 48$ 7.5%Technology 200 200 - Facilities 570 620 50 8.8%Transportation 52 52 - Library Fee 20 20 NEW
Total Other Fees 1,462$ 1,580$ 118$ 8.1%Total Tuition and Fees 26,636$ 28,768$ 2,132$ 8.0%
*
** Annual Programs & Services Fees are listed on page 65.
University Fees are set by the Board of Trustees and are subject to change without notice
Additional charge of $54 per credit hour for Engineering courses; additional charge of $109 per credit hour for 200, 300 and 400 level Nursing courses; and additional charge of $60 per credit hour, with the exception of 100, 500, and 600 level courses, will be assessed for Undergraduate Business Courses. There is no cap on these fees.
57
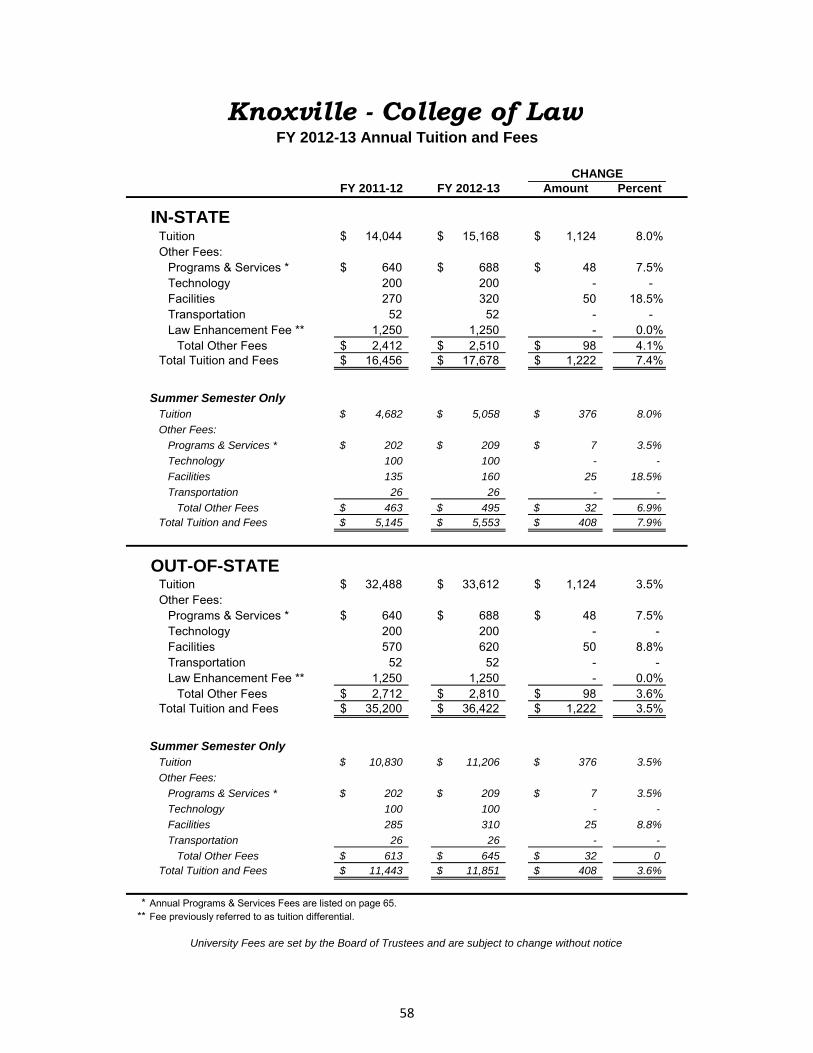
FY 2011-12 FY 2012-13 Amount Percent
Tuition 14,044$ 15,168$ 1,124$ 8.0%Other Fees:
Programs & Services * 640$ 688$ 48$ 7.5%Technology 200 200 - - Facilities 270 320 50 18.5%Transportation 52 52 - - Law Enhancement Fee ** 1,250 1,250 - 0.0%
Total Other Fees 2,412$ 2,510$ 98$ 4.1%Total Tuition and Fees 16,456$ 17,678$ 1,222$ 7.4%
Summer Semester OnlyTuition 4,682$ 5,058$ 376$ 8.0%Other Fees:
Programs & Services * 202$ 209$ 7$ 3.5%Technology 100 100 - - Facilities 135 160 25 18.5%Transportation 26 26 - -
Total Other Fees 463$ 495$ 32$ 6.9%Total Tuition and Fees 5,145$ 5,553$ 408$ 7.9%
Tuition 32,488$ 33,612$ 1,124$ 3.5%
IN-STATE
CHANGE
Knoxville - College of Law
OUT-OF-STATE
FY 2012-13 Annual Tuition and Fees
Tuition 32,488$ 33,612$ 1,124$ 3.5%Other Fees:
Programs & Services * 640$ 688$ 48$ 7.5%Technology 200 200 - - Facilities 570 620 50 8.8%Transportation 52 52 - - Law Enhancement Fee ** 1,250 1,250 - 0.0%
Total Other Fees 2,712$ 2,810$ 98$ 3.6%Total Tuition and Fees 35,200$ 36,422$ 1,222$ 3.5%
Summer Semester OnlyTuition 10,830$ 11,206$ 376$ 3.5%Other Fees:
Programs & Services * 202$ 209$ 7$ 3.5%Technology 100 100 - - Facilities 285 310 25 8.8%Transportation 26 26 - -
Total Other Fees 613$ 645$ 32$ 0 Total Tuition and Fees 11,443$ 11,851$ 408$ 3.6%
* Annual Programs & Services Fees are listed on page 65.** Fee previously referred to as tuition differential.
University Fees are set by the Board of Trustees and are subject to change without notice
58
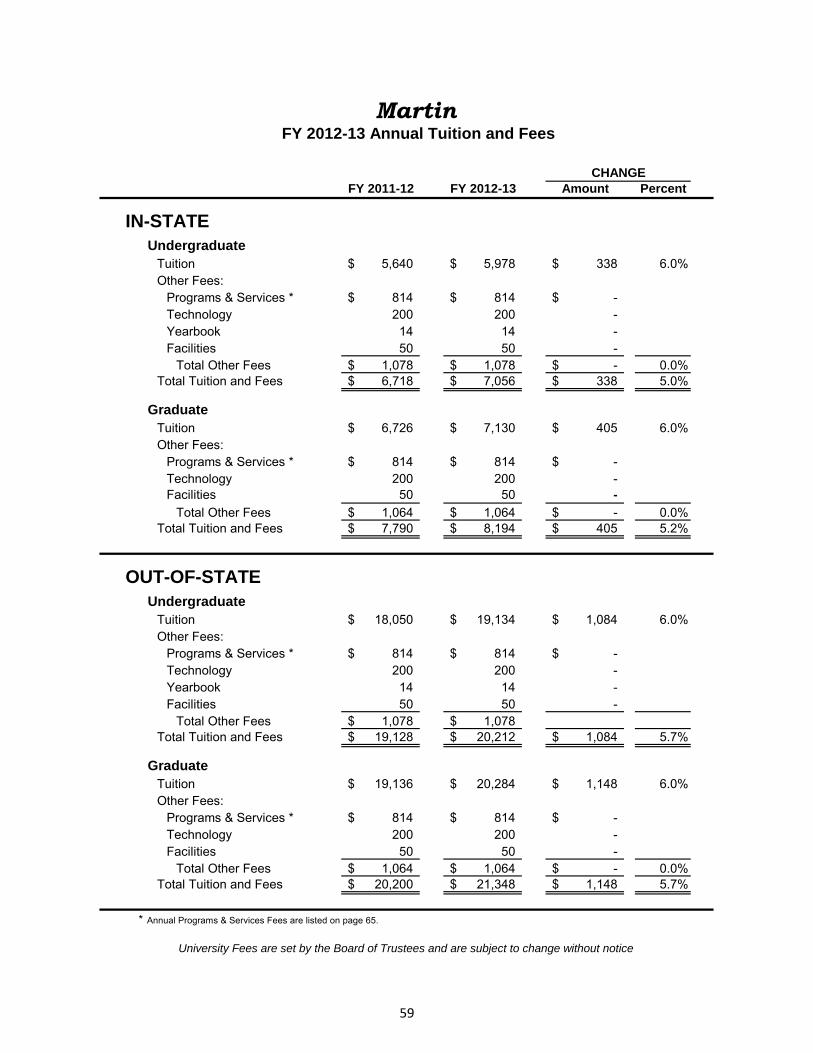
FY 2011-12 FY 2012-13 Amount Percent
IN-STATE
Tuition 5,640$ 5,978$ 338$ 6.0%Other Fees:
Programs & Services * 814$ 814$ -$ Technology 200 200 - Yearbook 14 14 - Facilities 50 50 -
Total Other Fees 1,078$ 1,078$ -$ 0.0%Total Tuition and Fees 6,718$ 7,056$ 338$ 5.0%
GraduateTuition 6,726$ 7,130$ 405$ 6.0%Other Fees:
Programs & Services * 814$ 814$ -$ Technology 200 200 - Facilities 50 50 -
Total Other Fees 1,064$ 1,064$ -$ 0.0%Total Tuition and Fees 7,790$ 8,194$ 405$ 5.2%
OUT-OF-STATE
MartinFY 2012-13 Annual Tuition and Fees
CHANGE
Undergraduate
UndergraduateTuition 18,050$ 19,134$ 1,084$ 6.0%Other Fees:
Programs & Services * 814$ 814$ -$ Technology 200 200 - Yearbook 14 14 - Facilities 50 50 -
Total Other Fees 1,078$ 1,078$ Total Tuition and Fees 19,128$ 20,212$ 1,084$ 5.7%
GraduateTuition 19,136$ 20,284$ 1,148$ 6.0%Other Fees:
Programs & Services * 814$ 814$ -$ Technology 200 200 - Facilities 50 50 -
Total Other Fees 1,064$ 1,064$ -$ 0.0%Total Tuition and Fees 20,200$ 21,348$ 1,148$ 5.7%
* Annual Programs & Services Fees are listed on page 65.
University Fees are set by the Board of Trustees and are subject to change without notice
59
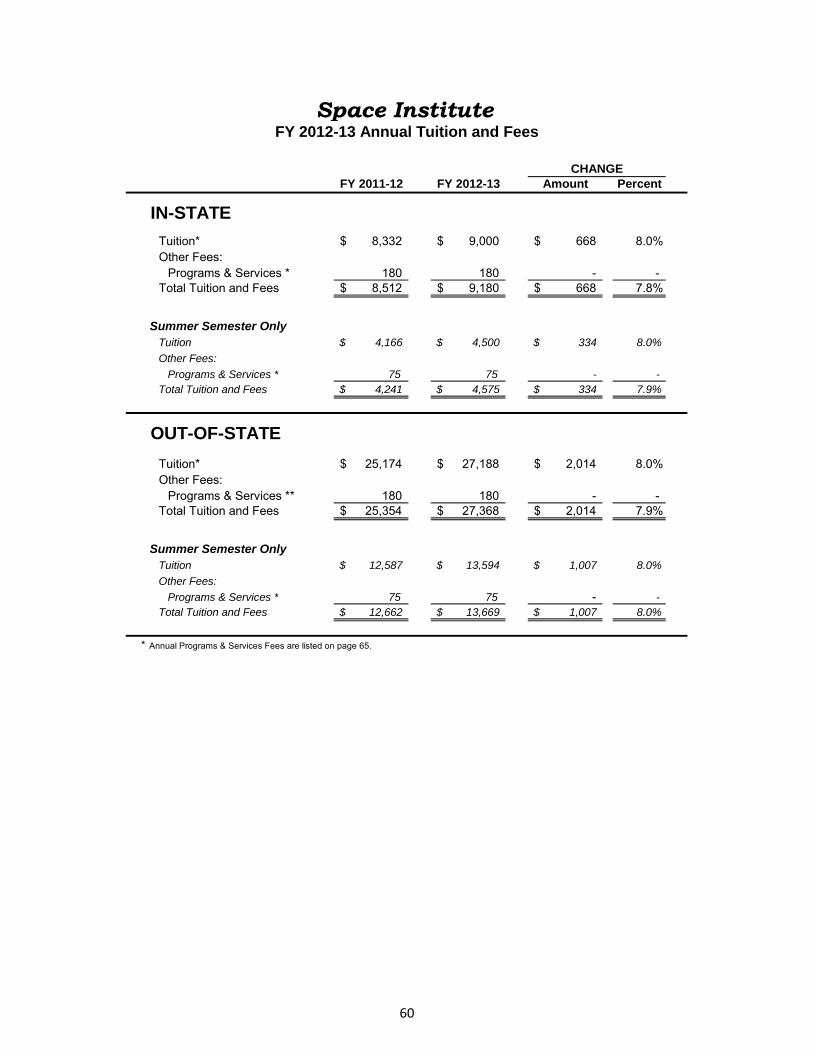
FY 2011-12 FY 2012-13 Amount Percent
Tuition* 8,332$ 9,000$ 668$ 8.0%Other Fees:
Programs & Services * 180 180 - - Total Tuition and Fees 8,512$ 9,180$ 668$ 7.8%
Summer Semester OnlyTuition 4,166$ 4,500$ 334$ 8.0%Other Fees:
Programs & Services * 75 75 - - Total Tuition and Fees 4,241$ 4,575$ 334$ 7.9%
Tuition* 25,174$ 27,188$ 2,014$ 8.0%Other Fees:
Programs & Services ** 180 180 - - Total Tuition and Fees 25,354$ 27,368$ 2,014$ 7.9%
Summer Semester OnlyTuition 12,587$ 13,594$ 1,007$ 8.0%Other Fees:
IN-STATE
CHANGE
Space Institute
OUT-OF-STATE
FY 2012-13 Annual Tuition and Fees
Programs & Services * 75 75 - - Total Tuition and Fees 12,662$ 13,669$ 1,007$ 8.0%
* Annual Programs & Services Fees are listed on page 65.
60
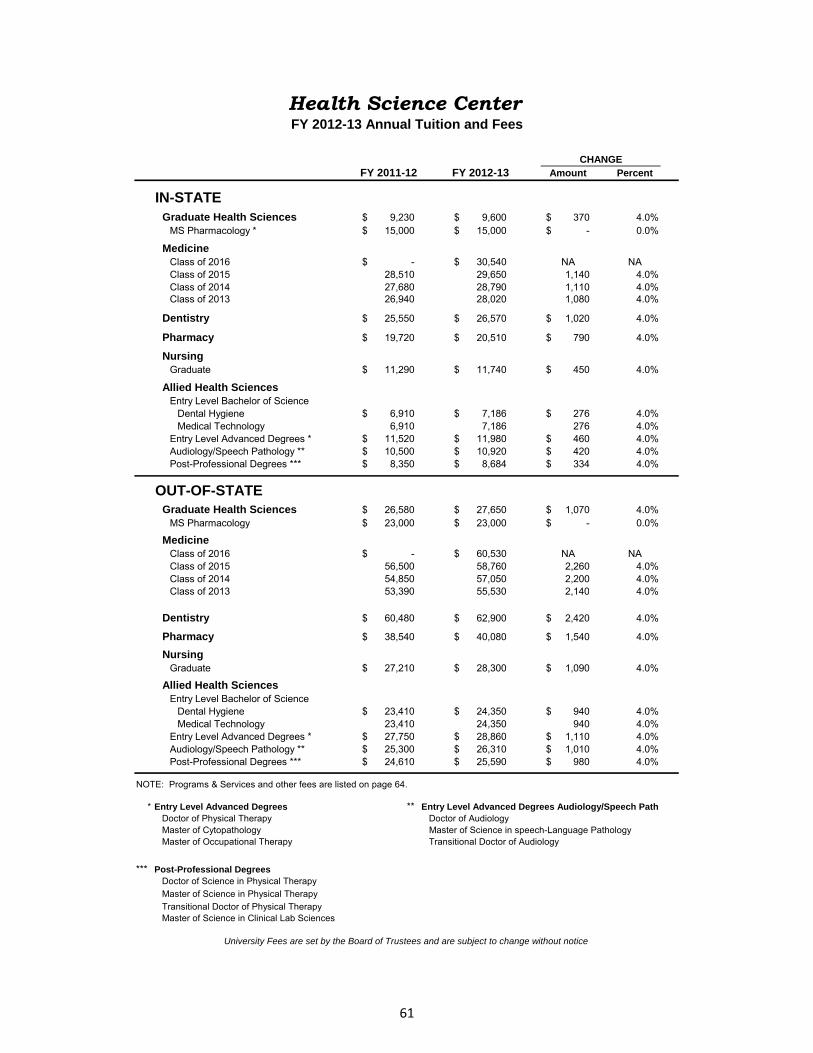
FY 2011-12 FY 2012-13 Amount Percent
Graduate Health Sciences 9,230$ 9,600$ 370$ 4.0%MS Pharmacology * 15,000$ 15,000$ -$ 0.0%
Medicine Class of 2016 -$ 30,540$ NA NAClass of 2015 28,510 29,650 1,140 4.0%Class of 2014 27,680 28,790 1,110 4.0%Class of 2013 26,940 28,020 1,080 4.0%
Dentistry 25,550$ 26,570$ 1,020$ 4.0%
Pharmacy 19,720$ 20,510$ 790$ 4.0%
Nursing Graduate 11,290$ 11,740$ 450$ 4.0%
Allied Health Sciences Entry Level Bachelor of Science
Dental Hygiene 6,910$ 7,186$ 276$ 4.0%Medical Technology 6,910 7,186 276 4.0%
Entry Level Advanced Degrees * 11,520$ 11,980$ 460$ 4.0%Audiology/Speech Pathology ** 10,500$ 10,920$ 420$ 4.0%Post-Professional Degrees *** 8,350$ 8,684$ 334$ 4.0%
Graduate Health Sciences 26,580$ 27,650$ 1,070$ 4.0%MS Pharmacology 23,000$ 23,000$ -$ 0.0%
Medicine Class of 2016 -$ 60,530$ NA NAClass of 2015 56,500 58,760 2,260 4.0%Class of 2014 54,850 57,050 2,200 4.0%C f %
Health Science Center
CHANGE
FY 2012-13 Annual Tuition and Fees
OUT-OF-STATE
IN-STATE
Class of 2013 53,390 55,530 2,140 4.0%
Dentistry 60,480$ 62,900$ 2,420$ 4.0%
Pharmacy 38,540$ 40,080$ 1,540$ 4.0%
Nursing Graduate 27,210$ 28,300$ 1,090$ 4.0%
Allied Health Sciences Entry Level Bachelor of Science
Dental Hygiene 23,410$ 24,350$ 940$ 4.0%Medical Technology 23,410 24,350 940 4.0%
Entry Level Advanced Degrees * 27,750$ 28,860$ 1,110$ 4.0%Audiology/Speech Pathology ** 25,300$ 26,310$ 1,010$ 4.0%Post-Professional Degrees *** 24,610$ 25,590$ 980$ 4.0%
* Entry Level Advanced Degrees ** Entry Level Advanced Degrees Audiology/Speech PathDoctor of Physical Therapy Doctor of AudiologyMaster of Cytopathology Master of Science in speech-Language PathologyMaster of Occupational Therapy Transitional Doctor of Audiology
*** Post-Professional DegreesDoctor of Science in Physical TherapyMaster of Science in Physical TherapyTransitional Doctor of Physical TherapyMaster of Science in Clinical Lab Sciences
University Fees are set by the Board of Trustees and are subject to change without notice
NOTE: Programs & Services and other fees are listed on page 64.
61
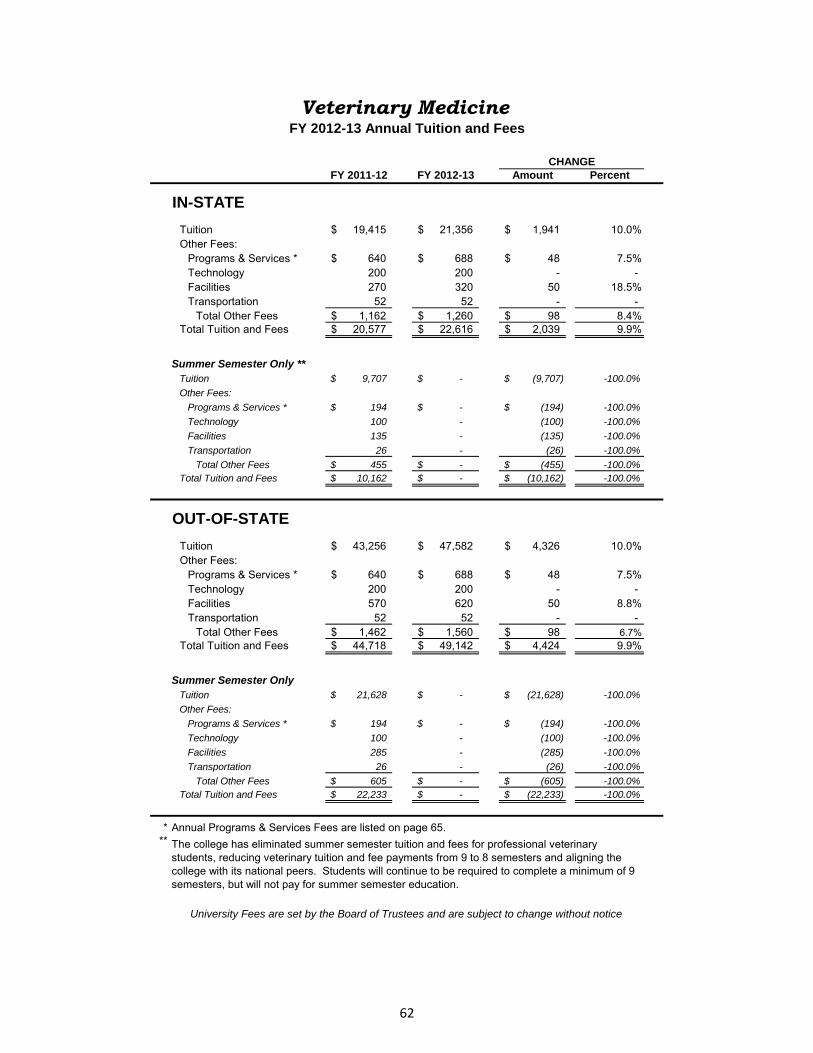
FY 2011-12 FY 2012-13 Amount Percent
Tuition 19,415$ 21,356$ 1,941$ 10.0%Other Fees:
Programs & Services * 640$ 688$ 48$ 7.5%Technology 200 200 - - Facilities 270 320 50 18.5%Transportation 52 52 - -
Total Other Fees 1,162$ 1,260$ 98$ 8.4%Total Tuition and Fees 20,577$ 22,616$ 2,039$ 9.9%
Summer Semester Only **Tuition 9,707$ -$ (9,707)$ -100.0%Other Fees:
Programs & Services * 194$ -$ (194)$ -100.0%Technology 100 - (100) -100.0%Facilities 135 - (135) -100.0%Transportation 26 - (26) -100.0%
Total Other Fees 455$ -$ (455)$ -100.0%Total Tuition and Fees 10,162$ -$ (10,162)$ -100.0%
Tuition 43,256$ 47,582$ 4,326$ 10.0%Other Fees:
Programs & Services * 640$ 688$ 48$ 7.5%Technology 200 200
Veterinary MedicineFY 2012-13 Annual Tuition and Fees
CHANGE
IN-STATE
OUT-OF-STATE
Technology 200 200 - - Facilities 570 620 50 8.8%Transportation 52 52 - -
Total Other Fees 1,462$ 1,560$ 98$ 6.7%Total Tuition and Fees 44,718$ 49,142$ 4,424$ 9.9%
Summer Semester OnlyTuition 21,628$ -$ (21,628)$ -100.0%Other Fees:
Programs & Services * 194$ -$ (194)$ -100.0%Technology 100 - (100) -100.0%Facilities 285 - (285) -100.0%Transportation 26 - (26) -100.0%
Total Other Fees 605$ -$ (605)$ -100.0%Total Tuition and Fees 22,233$ -$ (22,233)$ -100.0%
* Annual Programs & Services Fees are listed on page 65.**
University Fees are set by the Board of Trustees and are subject to change without notice
The college has eliminated summer semester tuition and fees for professional veterinary students, reducing veterinary tuition and fee payments from 9 to 8 semesters and aligning the college with its national peers. Students will continue to be required to complete a minimum of 9 semesters, but will not pay for summer semester education.
62
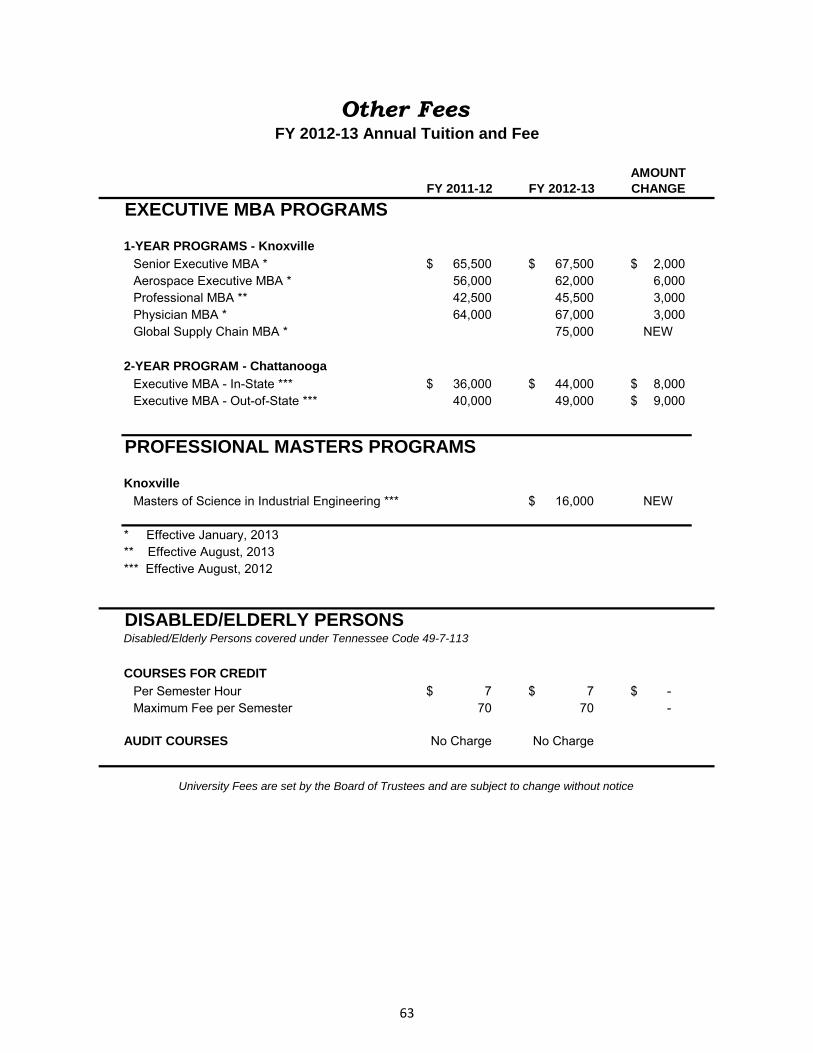
AMOUNTFY 2011-12 FY 2012-13 CHANGE
1-YEAR PROGRAMS - Knoxville
Senior Executive MBA * 65,500$ 67,500$ 2,000$ Aerospace Executive MBA * 56,000 62,000 6,000 Professional MBA ** 42,500 45,500 3,000 Physician MBA * 64,000 67,000 3,000 Global Supply Chain MBA * 75,000 NEW
2-YEAR PROGRAM - Chattanooga
Executive MBA - In-State *** 36,000$ 44,000$ 8,000$ Executive MBA - Out-of-State *** 40,000 49,000 9,000$
Knoxville
Masters of Science in Industrial Engineering *** 16,000$ NEW
* Effective January, 2013 ** Effective August, 2013*** Effective August, 2012
Other FeesFY 2012-13 Annual Tuition and Fee
EXECUTIVE MBA PROGRAMS
PROFESSIONAL MASTERS PROGRAMS
COURSES FOR CREDIT
Per Semester Hour 7$ 7$ -$ Maximum Fee per Semester 70 70 -
AUDIT COURSES No Charge No Charge
University Fees are set by the Board of Trustees and are subject to change without notice
DISABLED/ELDERLY PERSONSDisabled/Elderly Persons covered under Tennessee Code 49-7-113
63
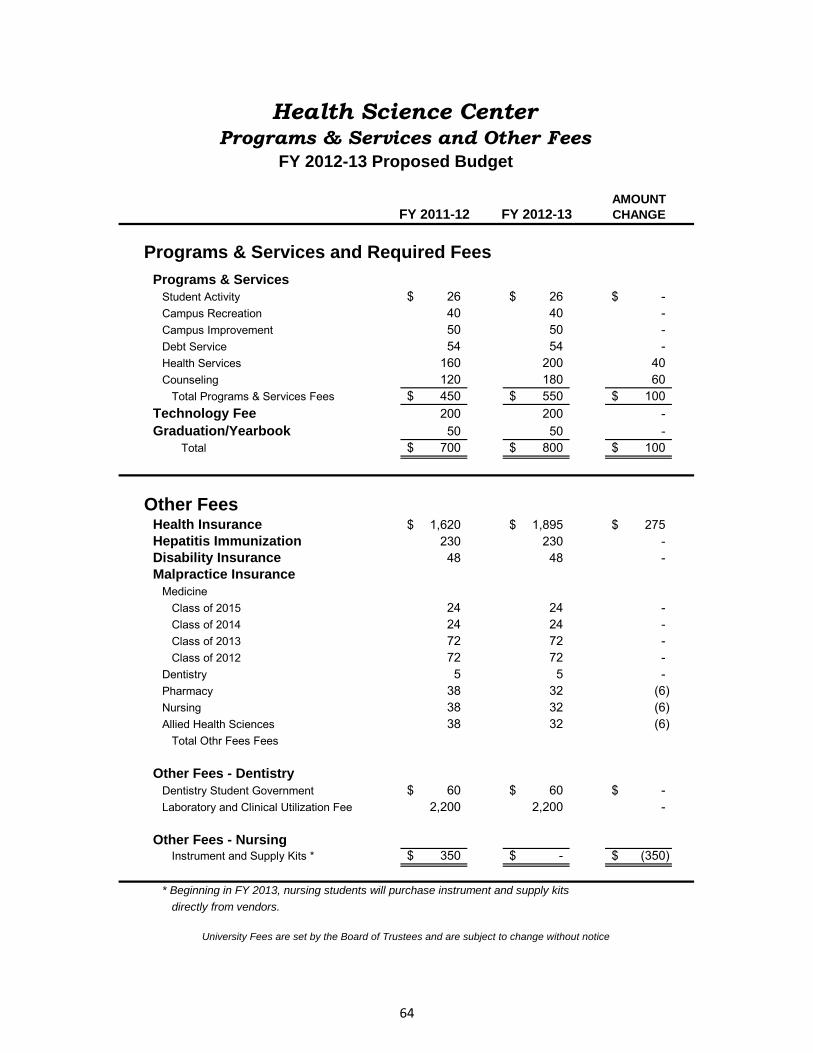
AMOUNTFY 2011-12 FY 2012-13 CHANGE
Programs & ServicesStudent Activity 26$ 26$ -$ Campus Recreation 40 40 - Campus Improvement 50 50 - Debt Service 54 54 - Health Services 160 200 40 Counseling 120 180 60
Total Programs & Services Fees 450$ 550$ 100$ Technology Fee 200 200 - Graduation/Yearbook 50 50 -
Total 700$ 800$ 100$
Other FeesHealth Insurance 1,620$ 1,895$ 275$ Hepatitis Immunization 230 230 - Disability Insurance 48 48 - Malpractice Insurance
M di i
Health Science CenterPrograms & Services and Other Fees
Programs & Services and Required Fees
FY 2012-13 Proposed Budget
MedicineClass of 2015 24 24 - Class of 2014 24 24 - Class of 2013 72 72 - Class of 2012 72 72 -
Dentistry 5 5 - Pharmacy 38 32 (6) Nursing 38 32 (6) Allied Health Sciences 38 32 (6)
Total Othr Fees Fees
Other Fees - Dentistry Dentistry Student Government 60$ 60$ -$ Laboratory and Clinical Utilization Fee 2,200 2,200 -
Other Fees - NursingInstrument and Supply Kits * 350$ -$ (350)$
* Beginning in FY 2013, nursing students will purchase instrument and supply kits directly from vendors.
University Fees are set by the Board of Trustees and are subject to change without notice
64

AMOUNTFY 2011-12 FY 2012-13 CHANGE
FALL AND SPRINGStudent Activity* 190$ 200$ 10$ Debt Service 228 240 12 Health Services 162 178 16 Counseling 60 70 10
Total 640$ 688$ 48$
Summer Semester OnlyStudent Activity* 58$ 61$ 3$ Debt Service 69 73 4 Health Services 49 54 5 Counseling 18 21 3
Total 194$ 209$ 15$
* $1,000,000 of total revenues is allocated to Women's Athletics
FALL AND SPRING
Programs & Services
SPACE INSTITUTE
FY 2012-13 Annual Tuition and Fees
KNOXVILLE (Includes College of Law and Veterinary Medicine)
Student Activity 180$ 180$ -$
Summer Semester OnlyStudent Activity 75$ 75$ -$
Student Activity 240$ 240$ -$ Debt Service 300 300 - Health Services 50 50 -
Total 590$ 590$ -$
Student Activity - Non Athletic 126$ 126$ -$ Student Activity - Athletic 308 308 Debt Service 380 380 -
Total 814$ 814$ -$
CHATTANOOGA
University Fees are set by the Board of Trustees and are subject to change without notice
MARTIN
65
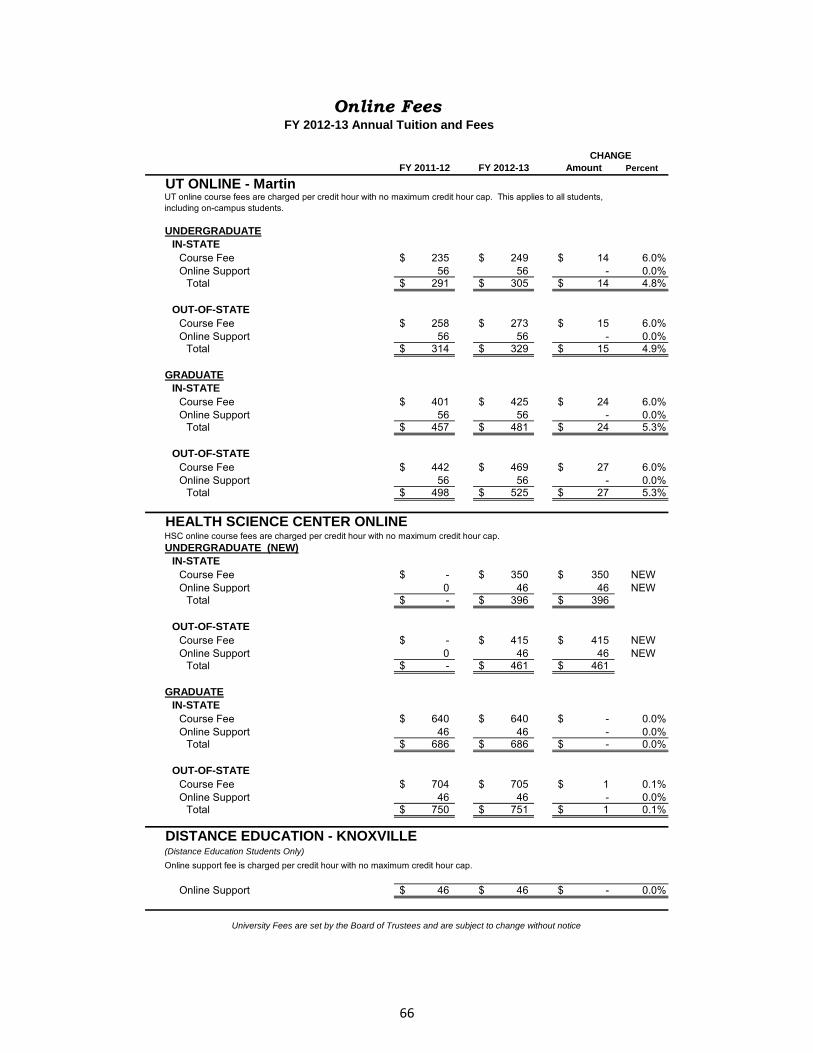
FY 2011-12 FY 2012-13 Amount Percent
UNDERGRADUATEIN-STATE
Course Fee 235$ 249$ 14$ 6.0%Online Support 56 56 - 0.0%
Total 291$ 305$ 14$ 4.8%
OUT-OF-STATECourse Fee 258$ 273$ 15$ 6.0%Online Support 56 56 - 0.0%
Total 314$ 329$ 15$ 4.9%
GRADUATEIN-STATE
Course Fee 401$ 425$ 24$ 6.0%Online Support 56 56 - 0.0%
Total 457$ 481$ 24$ 5.3%
OUT-OF-STATECourse Fee 442$ 469$ 27$ 6.0%Online Support 56 56 - 0.0%
Total 498$ 525$ 27$ 5.3%
UNDERGRADUATE (NEW)IN-STATE
Course Fee -$ 350$ 350$ NEWOnline Support 0 46 46 NEW
CHANGE
Online FeesFY 2012-13 Annual Tuition and Fees
UT ONLINE - MartinUT online course fees are charged per credit hour with no maximum credit hour cap. This applies to all students, including on-campus students.
HEALTH SCIENCE CENTER ONLINEHSC online course fees are charged per credit hour with no maximum credit hour cap.
Online Support 0 46 46 NEWTotal -$ 396$ 396$
OUT-OF-STATECourse Fee -$ 415$ 415$ NEWOnline Support 0 46 46 NEW
Total -$ 461$ 461$
GRADUATEIN-STATE
Course Fee 640$ 640$ -$ 0.0%Online Support 46 46 - 0.0%
Total 686$ 686$ -$ 0.0%
OUT-OF-STATECourse Fee 704$ 705$ 1$ 0.1%Online Support 46 46 - 0.0%
Total 750$ 751$ 1$ 0.1%
(Distance Education Students Only)
Online Support 46$ 46$ -$ 0.0%
DISTANCE EDUCATION - KNOXVILLE
Online support fee is charged per credit hour with no maximum credit hour cap.
University Fees are set by the Board of Trustees and are subject to change without notice
66
The University of Tennessee FY 2012-13 Budget Document
Charles M. Peccolo, Treasurer & Interim Chief Financial Officer System Budget and Finance Office Ron Maples, Controller Ron Loewen, Budget Director John Bodin-Henderson
We gratefully acknowledge the effort and cooperation of the campus and unit budget staff and the IRIS staff who contribute to the preparation of the University budget.
Knoxville Chris Cimino, Chief Business Officer Jonee Daniels Lindstrom Gena Wilson Suzan Thompson James Price Gary Gray
Chattanooga Richard Brown, Chief Business Officer Vanasia Parks Danny Grant Tyler Forrest
Martin Nancy Yarbrough, Interim Chief Business Officer Annette Moore Petra McPhearson
Space Institute Joan Snoderly
Health Science Center Anthony Ferrara, Chief Business Officer Pam Vaughn Charles Cossar Kimberly Moore Chasity Davis
Institute for Agriculture Tim Fawver, Chief Business Officer Melinda Jones Angela Braden Missy Kitts Tonya Kenley Kathy Yates
Institute for Public Service Gail White, Chief Business Officer
IRIS Les Mathews Janet Smith Mark Hall Laurie Rees Denise Haley David Goforth
The University of Tennessee does not discriminate on the basis of race, sex, color, religion, national origin, age, disability or veteran status in provision of educational programs and services or employment opportunities and benefits. This policy extends to both employment by and admission to the University. The University does not discriminate on the basis of race, sex, or disability in its education programs and activities pursuant to the requirements of Title VI of the Civil Rights Act of 1964, Title IX of the Education Amendments of 1972, Section 504 of the Rehabilitation Act of 1973, and the Americans with Disabilities Act (ADA) of 1990. Inquiries and charges of violation concerning Title VI, Title IX, Section 504, ADA or the Age Discrimination in Employment Act (ADEA) or any of the other above referenced policies should be directed to the Office of Equity and Diversity (OED), 1840 Melrose Avenue, Knoxville, TN 37996-3560, telephone (865) 974-2498 (V/TTY available) or 974-2440. Requests for accommodation of a disability should be directed to the ADA Coordinator at the UT Knoxville Office of Human Resources, 600 Henley Street, Knoxville, TN 37996-4125.
Publication Authorization Number: E17-0140-002-12