FY2013 2Q Financial Results, ended September 30, …...customers the results of increased gas sales...
30
0 FY2013 2Q Financial Results, ended September 30, 2013, and Gas Tariff Revisions TSE:9531 October 30, 2013
Transcript of FY2013 2Q Financial Results, ended September 30, …...customers the results of increased gas sales...
0
FY2013 2Q Financial Results, ended September 30, 2013, and Gas Tariff Revisions
TSE:9531
October 30, 2013

1

2
Contents
1. Gas Tariff Revisions 2. FY2013 2Q Consolidated Financial Results ended September 30, 2013 3. FY2013 Full Year Forecast 4. Progress under Challenge 2020 Vision 5. Reference Materials

3
1. Gas Tariff Revisions

4
Gas Tariff Revisions
Reference: Past tariff revisions
An average reduction of 2.09% from current tariff levels for small-volume customers (Average unit tariff in notification: Service agreement: -1.59%; Optional agreement: -3.13%, including discount for direct bank account deduction)
Date of Implementation
To be implemented on December 10, 2013. Discount for direct bank account deduction (¥53 including tax) to be applied from March 2014 meter reading.
Standard average gas resource cost
¥82,470/t (Reference: ¥66,180/t at time of previous revision)
Tokyo Gas will implement the following tariff revisions for the Tokyo district as a means of returning to customers the results of increased gas sales volume from successful marketing efforts and fixed cost reductions achieved through ongoing efforts to enhance management efficiency.
Amount of Reduction
Revision date Avg. revision for small-
volume customers
December 10, 1999 -2.00%
February 15, 2001 -3.20%
January 1, 2005 -5.18%
February 21, 2006 -0.28%
April 15, 2008 -1.51%
March 8, 2012 -1.57%
December 10, 2013 (outlined above)
-2.09%

5
2. FY2013 2Q Consolidated Financial Results ended September 30, 2013

6
FY2013 2Q Results
FY2012 2Q Results Change %
Previous Forecast (July 31)
Change %
Gas sales volume (mil. m3, 45MJ) 6,673 6,998 -325 -4.6% 6,732 -59 -0.9%
Net sales 933.5 863.7 +69.8 +8.1% 942.0 -8.5 -0.9%
Operating expenses 864.9 798.6 +66.3 +8.3% 875.0 -10.1 -1.2%
Operating income 68.5 65.0 +3.5 +5.3% 67.0 +1.5 +2.3%
Ordinary income — (a) 64.9 67.0 -2.1 -3.1% 61.0 +3.9 +6.5%
Net income 42.7 39.9 +2.8 +7.0% 40.0 +2.7 +7.0%
Temperature effect — (b) -8.5 0.8 -9.3 ー -5.9 -2.6 ー Sliding time lag effect — (c) 10.9 0.8 +10.1 ー 10.8 +0.1 ー Amortization of actuarial differences — (d) -1.1 -2.2 +1.1 ー -1.1 0.0 ー Adjusted ordinary income: (a) - ( (b)+(c)+(d) ) 63.6 67.6 -4.0* -5.9% 57.2 +6.4 +11.2% Adjusted net income 41.8 40.4 +1.4 +3.5% 37.4 +4.4 +11.8%
FY2013 2Q Consolidated Financial Results (Apr. 1, 2013 – Sep. 30, 2013) <vs. FY2012 2Q>
Economic Frame (2Q)
Exchange Rate (¥/$)
JCC ($/bbl)
Avg. Temperature (℃)
FY2013 2Q results 98.86 107.66 22.3
FY2012 2Q results 79.41 <+19.45> 113.97 <-6.31> 21.6 <+0.7>
Previous forecast 99.39 (-0.53) 108.87 (-1.21) 21.8 (+0.5)
+ :
Increase in electricity sales (+4.9: increase in unit sales prices, etc.) +
: Increase in city gas resource costs (-36.0: foreign exchange rate -67.3, crude oil +18.2, etc.)
Increase in electricity resource cost (-3.2: increase in resource costs) -
+ +69.8
-66.3
Increase in city gas profit (+1.3: gas gross margin +0.3 (including temperature effect -9.3)) + : Increase in electricity profit (+1.8) +
Increase in resource costs for LNG sales (-12.3: increase in volume, etc.) -
Highlights: Sales Growth, Profit Increase ( +/- indicates profit impact, billion yen) + -
Net sales
Operating expenses
Operating income
+3.5
Increase in city gas sales (+36.3: higher sales unit prices for purchasing gas resource by weaker yen)
Increase in LNG sales (+12.9: increase in sales volume)
-
(Unit: billion yen)
* -4.0: Decrease in gas sales volume -3.1 (excl. temperature effect -9.3), lower fixed costs +1.0, electric power +1.8, gas appliances and installation +1.5, non operating -5.5, other segment profit, etc. +0.3
Increase in overseas sales (+4.6: Pluto, Barnett, etc.) +
Pension Asset
Investment Yield (Cost Deducted)
Year-end Assets (Billion Yen)
FY2013 2Q -0.73% 271.0
<Figures in brackets are year-on-year increase/decrease> (Figures in parenthesis are increase/decrease vs. previous forecast)
Expected rate of return: 2%
Net income : +2.8 Decrease in income tax (+3.8) +
7
0
2,000
4,000
6,000
8,000
今年度実績 前年度実績 前回見通し
923 919 933
3,123 3,359 3,156
1,3771,383 1,359
1,2501,336
1,285
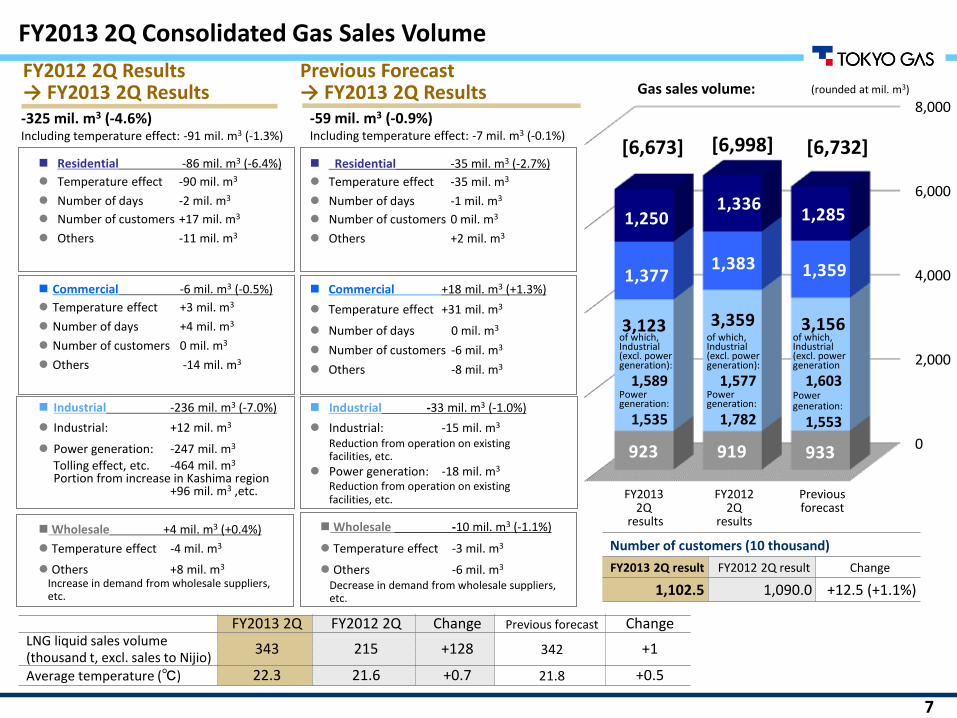
FY2013 2Q Consolidated Gas Sales Volume
[6,732] [6,673]
(rounded at mil. m3)
of which, Industrial (excl. power generation):
1,589 Power generation:
1,535
FY2013 2Q FY2012 2Q Change Previous forecast Change LNG liquid sales volume (thousand t, excl. sales to Nijio)
343 215 +128 342 +1
Average temperature (℃) 22.3 21.6 +0.7 21.8 +0.5
of which, Industrial (excl. power generation
1,603 Power generation:
1,553
[6,998]
Gas sales volume:
Commercial +18 mil. m3 (+1.3%)
Temperature effect +31 mil. m3
Number of days 0 mil. m3
Number of customers -6 mil. m3
Others -8 mil. m3
Industrial -33 mil. m3 (-1.0%)
Industrial: -15 mil. m3
Reduction from operation on existing facilities, etc.
Power generation: -18 mil. m3
Reduction from operation on existing facilities, etc.
Residential -35 mil. m3 (-2.7%)
Temperature effect -35 mil. m3
Number of days -1 mil. m3
Number of customers 0 mil. m3
Others +2 mil. m3
Wholesale -10 mil. m3 (-1.1%)
Temperature effect -3 mil. m3
Others -6 mil. m3
Decrease in demand from wholesale suppliers, etc.
-325 mil. m3 (-4.6%) Including temperature effect: -91 mil. m3 (-1.3%)
Commercial -6 mil. m3 (-0.5%)
Temperature effect +3 mil. m3
Number of days +4 mil. m3
Number of customers 0 mil. m3
Others -14 mil. m3
Industrial -236 mil. m3 (-7.0%)
Industrial: +12 mil. m3
Power generation: -247 mil. m3
Tolling effect, etc. -464 mil. m3
Portion from increase in Kashima region +96 mil. m3 ,etc.
Residential -86 mil. m3 (-6.4%)
Temperature effect -90 mil. m3
Number of days -2 mil. m3
Number of customers +17 mil. m3
Others -11 mil. m3
Wholesale +4 mil. m3 (+0.4%)
Temperature effect -4 mil. m3
Others +8 mil. m3
Increase in demand from wholesale suppliers, etc.
of which, Industrial (excl. power generation):
1,577 Power generation:
1,782
Number of customers (10 thousand)
FY2013 2Q result FY2012 2Q result Change
1,102.5 1,090.0 +12.5 (+1.1%)
FY2012 2Q Results → FY2013 2Q Results
Previous Forecast → FY2013 2Q Results
-59 mil. m3 (-0.9%) Including temperature effect: -7 mil. m3 (-0.1%)
FY2013 2Q
results
FY2012 2Q
results
Previous forecast
8
0
200
400
600
800
今年度実績 前年度実績 前回見通し
755743
272
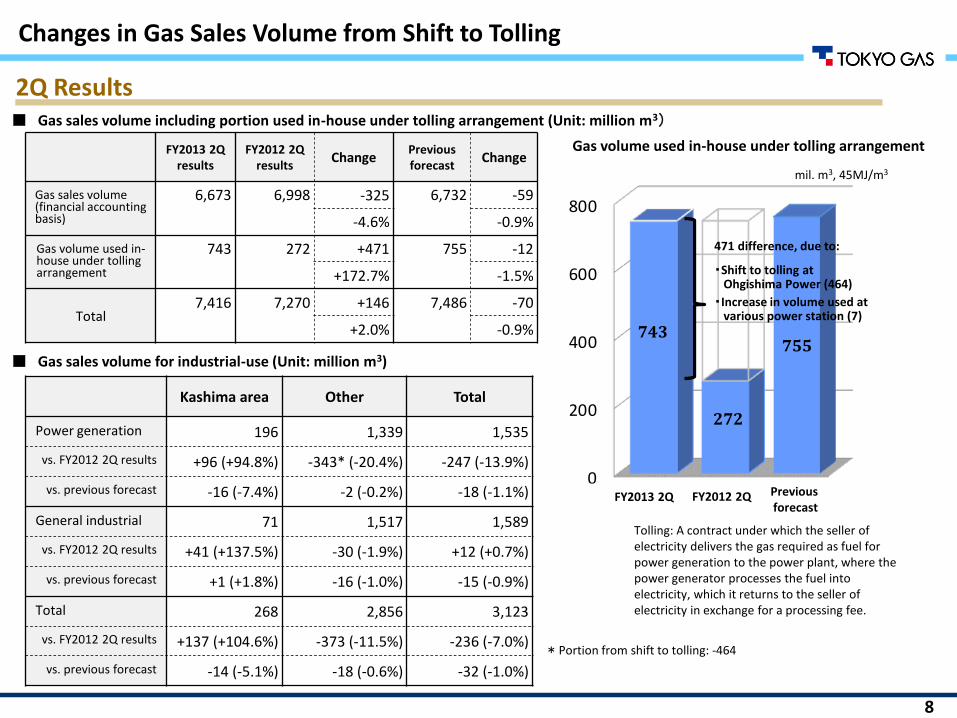
Changes in Gas Sales Volume from Shift to Tolling
2Q Results
FY2013 2Q results
FY2012 2Q results
Change Previous forecast
Change
Gas sales volume (financial accounting basis)
6,673 6,998 -325 6,732 -59
-4.6% -0.9%
Gas volume used in-house under tolling arrangement
743 272 +471 755 -12
+172.7% -1.5%
Total 7,416 7,270 +146 7,486 -70
+2.0% -0.9%
■ Gas sales volume including portion used in-house under tolling arrangement (Unit: million m3)
Kashima area Other Total
Power generation 196 1,339 1,535
vs. FY2012 2Q results +96 (+94.8%) -343* (-20.4%) -247 (-13.9%)
vs. previous forecast -16 (-7.4%) -2 (-0.2%) -18 (-1.1%)
General industrial 71 1,517 1,589
vs. FY2012 2Q results +41 (+137.5%) -30 (-1.9%) +12 (+0.7%)
vs. previous forecast +1 (+1.8%) -16 (-1.0%) -15 (-0.9%)
Total 268 2,856 3,123
vs. FY2012 2Q results +137 (+104.6%) -373 (-11.5%) -236 (-7.0%)
vs. previous forecast -14 (-5.1%) -18 (-0.6%) -32 (-1.0%)
■ Gas sales volume for industrial-use (Unit: million m3)
Gas volume used in-house under tolling arrangement
471 difference, due to:
・Shift to tolling at Ohgishima Power (464)
・Increase in volume used at various power station (7)
mil. m3, 45MJ/m3
FY2013 2Q FY2012 2Q Previous forecast
Tolling: A contract under which the seller of electricity delivers the gas required as fuel for power generation to the power plant, where the power generator processes the fuel into electricity, which it returns to the seller of electricity in exchange for a processing fee.
* Portion from shift to tolling: -464

9
Net Sales Segment Income
FY2013 2Q FY2012 2Q Change % FY2013 2Q FY2012 2Q Change %
City gas 664.6 628.3 +36.3 +5.8% 65.9 64.6 +1.3 +2.0%
Gas appliances and installation work
93.3 93.3 0 -0.1% 2.9 1.4 +1.5 +108.1%
Other energy 165.8 157.8 +8.0 +5.1% 13.3 11.8 +1.5 +12.8%
(Electric power business)
66.6 61.7 +4.9 +8.1% 9.9 8.1 +1.8 +21.6%
Real estate 14.5 15.0 -0.5 -3.4% 3.1 3.3 -0.2 -6.0%
Others 83.6 88.0 -4.4 -5.0% 4.0 4.7 -0.7 -13.9%
(Overseas business)
8.7 4.1 +4.6 +108.6% 1.6 1.8 -0.2 -8.0%
Adjustment -88.5 -119.0 +30.5 ― -20.9 -20.8 -0.1 ―
Consolidated 933.5 863.7 +69.8 +8.1% 68.5 65.0 +3.5 +5.3%
FY2013 2Q Net Sales and Operating Income/Loss by Business Segment <vs. FY2012 2Q>
(Unit: billion yen)
• Net sales by business segment include internal transactions. • “Other energy” includes energy‐service, liquefied petroleum gas, electric power and industrial gas, etc. • “Others” includes businesses in construction, information processing, shipping, credit and leasing, and overseas, etc. • The “Adjustment” to operating income is primarily companywide expenses not allocated to individual segments. • Parentheses indicate sub-segment (figures included in segment total).
Notes:
10
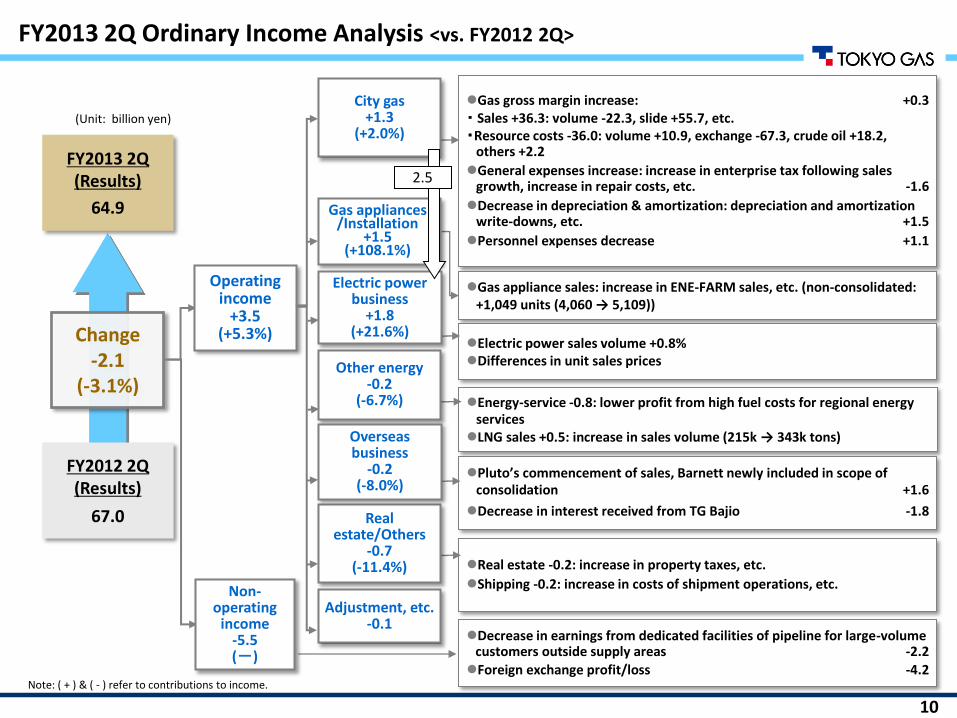
Gas gross margin increase: +0.3 ・ Sales +36.3: volume -22.3, slide +55.7, etc. ・Resource costs -36.0: volume +10.9, exchange -67.3, crude oil +18.2,
others +2.2
General expenses increase: increase in enterprise tax following sales growth, increase in repair costs, etc. -1.6
Decrease in depreciation & amortization: depreciation and amortization write-downs, etc. +1.5
Personnel expenses decrease +1.1
Change -2.1
(-3.1%)
FY2012 2Q (Results)
67.0
FY2013 2Q (Results)
64.9
Non-operating
income -5.5 (-)
Gas appliance sales: increase in ENE-FARM sales, etc. (non-consolidated: +1,049 units (4,060 → 5,109))
Real estate -0.2: increase in property taxes, etc.
Shipping -0.2: increase in costs of shipment operations, etc.
Decrease in earnings from dedicated facilities of pipeline for large-volume customers outside supply areas -2.2 Foreign exchange profit/loss -4.2
Operating income
+3.5 (+5.3%)
Energy-service -0.8: lower profit from high fuel costs for regional energy services LNG sales +0.5: increase in sales volume (215k → 343k tons)
Pluto’s commencement of sales, Barnett newly included in scope of consolidation +1.6
Decrease in interest received from TG Bajio -1.8
Electric power sales volume +0.8% Differences in unit sales prices
FY2013 2Q Ordinary Income Analysis <vs. FY2012 2Q>
(Unit: billion yen)
Note: ( + ) & ( - ) refer to contributions to income.
City gas +1.3
(+2.0%)
Gas appliances /Installation
+1.5 (+108.1%)
Other energy -0.2
(-6.7%)
Real estate/Others
-0.7 (-11.4%)
Adjustment, etc. -0.1
Electric power business
+1.8 (+21.6%)
Overseas business
-0.2 (-8.0%)
2.5

11
3. FY2013 Full Year Forecast

12
Economic Frame (Full Year)
Foreign Exchange Rate (¥/$)
JCC ($/bbl) Average Temp.
(℃)
Current forecast 99.43 108.83 17.0
Previous forecast 99.70 (-0.27) 109.43 (-0.60) 16.8 (+0.2)
FY12 82.91 <+16.52> 113.88 <-5.05> 16.6 <+0.4>
FY2013 Full Year Forecast (Apr. 1, 2013 – Mar. 31, 2014) <vs. Previous Forecast (July 31 Release)>
Highlights: Sales Decline, Profit Increase ( +/- indicates profit impact, billion yen) + -
Current Forecast Previous Forecast
(July 31) Change % FY2012 Change %
Gas sales volume (mil. m3, 45MJ) 14,483 14,590 -107 -0.7% 15,390 -907 -5.9%
Net sales 2,080.0 2,096.0 -16.0 -0.8% 1,915.6 +164.4 +8.6%
Operating expenses 1,921.0 1,935.0 -14.0 -0.7% 1,770.0 +151.0 +8.5%
Operating income 159.0 161.0 -2.0 -1.2% 145.6 +13.4 +9.2%
Ordinary income — (a) 153.0 155.0 -2.0 -1.3% 147.4 +5.6 +3.8%
Net income 103.0 101.0 +2.0 +2.0% 101.6 +1.4 +1.3%
Temperature effect — (b) -8.5 -5.9 -2.6 - 2.9 -11.4 -
Sliding time lag effect — (c) 22.1 22.7 -0.6 - -12.4 +34.5 -
Amortization of actuarial differences — (d) -2.2 -2.2 0.0 - -4.4 +2.2 - Adjusted ordinary income: (a) - ( (b)+(c)+(d) ) 141.6 140.4 +1.2* +0.9% 161.3 -19.7 -12.2% Adjusted net income 95.5 91.3 +4.2 +4.6% 110.9 -15.4 -13.9%
(Unit: mil. m3/45MJ, billion yen)
Decrease in city gas sales (-20.7: decrease in volume -8.7, sliding -6.3, tariff revisions -6.0) - Net sales
Operating expenses
Decrease in operating expense for LNG sales (+1.5: decrease in resource costs)
Increase in electricity sales (+4.1: increase in volume)
Decrease in city gas operating income (-7.5: gas gross margin -9.4 (gas tariff revision -6.0), lower fixed costs +1.9
+ Decrease in city gas resource costs (+11.3: volume +5.6, foreign exchange rate +1.2, crude oil price +3.3)
+
Operating income
-16.0:
+14.0:
-2.0:
+
- + Increase in gas appliances/installation operating income (+1.7: increase in GHP unit sales and number of installation work ordered ,etc.)
Increase in other segment income (+2.1: Electric power +0.7, Overseas +0.5, LNG sales +0.3, etc.)
+
(Figures in parenthesis are increase/decrease vs. previous forecast), <Figures in brackets are year-on-year increase/decrease>
* +1.2: Decrease in gas sales volume -0.5 (excl. temp. effect -2.6), impact from tariff revision -6.0, lower fixed cost +1.9, gas appliances and installation +1.7, other segment income, etc. +4.1.
Decrease in income taxes (+5.6)) Net Income +2.0: +
Expected rate of return: 2%
Pension Asset
Investment Yield (Cost Deducted)
Discount Rate
Year-end Assets
(Billion Yen)
FY12 6.10% 1.4% 276.0
FY11 5.13% 1.7% 254.0

13
0
3,000
6,000
9,000
12,000
15,000
今回見通し 前回見通し 前年度実績
1,981 2,011 1,953
6,264 6,326 7,055
2,813 2,792 2,847
3,426 3,460 3,535
[14,590] [14,483]
Number of customers
Current forecast Previous forecast Change
1,110.5 1,110.4 +0.1 (+0.0%)
Current forecast
Previous forecast Change
LNG liquid sales volume (thousand t, excl. sales to Nijio)
790 801 -11
Average temperature (℃) 17.0 16.8 +0.2
[15,390]
FY2013 Full Year Forecast: Consolidated Gas Sales Volume
Previous Forecast → Current Forecast
-107 mil. m3 (-0.7%) Incl. temperature effect: -6 mil. m3(-0.0%)
FY2012 Results → Current Forecast
-907 mil. m3 (-5.9%) Incl. temperature effect: -146 mil. m3 (-0.9%)
Commercial +21 mil. m3 (+0.7%) Temperature effect +31 mil. m3
Number of days 0 mil. m3
Number of customers -6 mil. m3
Others -5 mil. m3
Industrial -62 mil. m3 (-1.0%)
Industrial: -25 mil. m3
Reduction from operation on existing facilities, etc.
Power generation: -38 mil. m3
Reduction from operation on existing facilities, etc.
Wholesale -30 mil. m3 (-1.5%) Temperature effect -3 mil. m3
Others -28 mil. m3
Decrease in demand from wholesale suppliers, etc.
Industrial -791 mil. m3 (-11.2%)
Industrial: +5 mil. m3
Increase of operation in Kashima area, etc
Power generation: -796 mil. m3
Impact from shift to tolling -969 mil. m3 Portion from Kashima area
+172 mil m3 , etc.
Residential -34 mil. m3 (-1.0%) Temperature effect -34 mil. m3
Number of days -1 mil. m3
Number of customers +2 mil. m3
Others -1 mil. m3
Residential -109 mil. m3 (-3.1%) Temperature effect -118 mil. m3
Number of days -2 mil. m3
Number of customers +43 mil. m3
Others -32 mil. m3
Wholesale +28 mil. m3 (+1.4%) Temperature effect -9 mil. m3
Others +37 mil. m3
Increase in demand from wholesale suppliers, etc.
Gas sales volume: (rounded at mil. m3)
of which, Industrial (excl. power generation):
3,236 Power generation:
3,028
of which, Industrial (excl. power generation):
3,260 Power generation:
3,066
of which, Industrial (excl. power generation):
3,230 Power generation:
3,825
Current forecast
Previous forecast
FY2012 results
(Unit: 10 thousand)
Commercial -34 mil. m3 (-1.2%) Temperature effect -19 mil. m3
Number of days +4 mil. m3
Number of customers 0 mil. m3
Others -20 mil. m3

14
0
300
600
900
1,200
1,500
今回見通し 前回見通し 前年度実績
597
1,508 1,493
Gas sales volume including portion used in-house under tolling arrangement (Unit: million m3)
Current forecast
FY2012 full year results
Previous forecast
Gas sales volume for industrial-use (Unit: million m3)
FY2013 Full Year Forecast
Changes in Gas Sales Volume from Shift to Tolling
Gas Volume Used In-House Under Tolling Arrangement
911 difference, due to: ・Shift to tolling at
Ohgishima Power (969) ・decreases in volume
used at various power stations
(-58)
mil. m3, 45MJ/m3
Kashima area Other Total
Power generation 487 2,541 3,028
vs. FY2012 results +172 (+54.6%) -968* (-27.6%) -796 (-20.8%)
vs. previous forecast -21 (-4.0%) -17 (-0.7%) -38 (-1.2%)
General industrial 167 3,068 3,236
vs. FY2012 results +78 (+87.5%) -73 (-2.3%) +5 (+0.2%)
vs. previous forecast +10 (+6.3%) -35 (-1.1%) -25 (-0.8%)
Total 655 5,609 6,264
vs. FY2012 results +250 (+61.9%) -1,041 (-15.7%) -791 (-11.2%)
vs. previous forecast -11 (-1.6%) -52 (-0.9%) -62 (-1.0%)
Current forecast
Previous forecast
Change FY2012 full year results
Change
Gas sales volume (financial accounting basis)
14,483 14,590 -107 15,390 -907
-0.7% -5.9%
Gas volume used in-house under tolling arrangement
1,508 1,493 +15 597 +911
+1.0% +152.7%
Total 15,991 16,083 -92 15,986 +5
-0.6% +0.0%
Current sales volume forecast as per Challenge 2020 Vision: 16,978 million m3
Tolling: A contract under which the seller of electricity delivers the gas required as fuel for power generation to the power plant, where the power generator processes the fuel into electricity, which it returns to the seller of electricity in exchange for a processing fee.
* Portion from shift to tolling: -969

15
Net Sales Segment Income
Current Forecast
Previous Forecast Difference %
Current Forecast
Previous Forecast Difference %
City gas 1,475.0 1,495.7 -20.7 -1.4% 146.8 154.3 -7.5 -4.9%
Gas appliances and installation work
211.4 207.5 +3.9 +1.9% 5.0 3.3 +1.7 +51.5%
Other energy 348.8 343.6 +5.2 +1.5% 30.4 29.1 +1.3 +4.5%
(Electric power business)
133.9 129.8 +4.1 +3.2% 23.0 22.3 +0.7 +3.1%
Real estate 28.2 28.1 +0.1 +0.4% 5.1 4.8 +0.3 +6.3%
Others 192.6 191.7 +0.9 +0.5% 14.9 14.4 +0.5 +3.5%
(Overseas business) 23.1 23.4 -0.3 -1.3% 6.5 6.0 +0.5 +8.3%
Adjustment -176.0 -170.6 -5.4 - -43.2 -44.9 +1.7 -
Consolidated 2,080.0 2,096.0 -16.0 -0.8% 159.0 161.0 -2.0 -1.2% • Net sales by business segment include internal transactions. • “Other energy” includes energy‐service, liquefied petroleum gas, electric power and industrial gas, etc. • “Others” includes businesses in construction, information processing, shipping, credit and leasing, and overseas, etc. • The “Adjustment” to operating income is primarily companywide expenses not allocated to individual segments. • Parentheses indicate sub-segment (figures included in segment total).
Notes:
(Unit: billion yen)
FY2013 Net Sales and Operating Income/Loss by Business Segment <vs. Previous Forecast>

16
FY2013 Ordinary Income Analysis <vs. Previous Forecast>
(Unit: billion yen)
Change -2.0
(-1.3 %)
FY2013 (Previous forecast)
155.0
FY2013 (Current forecast)
153.0
Non-operating
income +/-0.0
(―)
Operating income
-2.0 (-1.2%)
Note: ( + ) & ( - ) refer to contributions to income.
Decrease in gas gross margin -9.4 ・Sales -20.7: volume -8.7, slide -6.3, tariff revisions -6.0, etc. ・Resource cost +11.3: volume +5.6, exchange +1.2, crude oil +3.3, etc.
・Decrease in fixed costs: +1.9, etc.
Real estate +0.2: increase in rental income, etc. Shipping +0.1: increase in utilization and higher unit prices for
chartered vessels
LNG sales +0.3 (unit prices +0.4, volume (801k → 790k tons) -0.1) Energy-service +0.3: sales volume increased
Increase in GHP unit sales (non-consolidated: 6,600 → 6,900 units), increase in number of installation work ordered, etc.
Increase in electricity sales volume: +2.9%
Increase in interest received from TG Bajio +0.5
City gas -7.5
(-4.9%)
Gas appliances/ Installation
+1.7 (+51.5%)
Other energy +0.6
(+8.8%)
Real estate/ Others
+0.3 (+2.3%)
Adjustment, etc.
+1.7
Electric power business
+0.7 (+3.1%)
Overseas business
+0.5 (+8.3%)

17
Net Sales Segment Income
Current Forecast
FY2012 Results Difference %
Current Forecast
FY2012 Results Difference %
City gas 1,475.0 1,401.9 +73.1 +5.2% 146.8 141.3 +5.5 +3.9%
Gas appliances and installation work
211.4 206.0 +5.4 +2.6% 5.0 4.4 +0.6 +13.1%
Other energy 348.8 336.6 +12.2 +3.6% 30.4 25.9 +4.5 +17.2%
(Electric power business)
133.9 127.0 +6.9 +5.4% 23.0 19.1 +3.9 +20.5%
Real estate 28.2 30.2 -2.0 -6.8% 5.1 5.6 -0.5 -8.9%
Others 192.6 195.7 -3.1 -1.6% 14.9 13.5 +1.4 +10.1%
(Overseas business) 23.1 12.4 +10.7 +86.5% 6.5 2.4 +4.1 +164.7%
Adjustment -176.0 -255.0 +79.0 - -43.2 -45.1 +1.9 -
Consolidated 2,080.0 1,915.6 +164.4 +8.6% 159.0 145.6 +13.4 +9.2% • Net sales by business segment include internal transactions. • “Other energy” includes energy‐service, liquefied petroleum gas, electric power and industrial gas, etc. • “Others” includes businesses in construction, information processing, shipping, credit and leasing, and overseas, etc. • The “Adjustment” to operating income is primarily companywide expenses not allocated to individual segments. • Parentheses indicate sub-segment (figures included in segment total).
Notes:
(Unit: billion yen)
FY2013 Net Sales and Operating Income/Loss by Business Segment <vs. FY2012 Results>

18
FY2013 Ordinary Income Analysis <vs. FY2012 Results>
(Unit: billion yen)
Note: ( + ) & ( - ) refer to contributions to income.
Change +5.6
(+3.8%)
FY2012 (Result)
147.4
FY2013 (Current forecast)
153.0
Non-operating
income -7.8 (—)
Operating income +13.4
(+9.2%)
City gas +5.5
(+3.9%)
Gas appliances/ Installation
+0.6 (+13.1%)
Other energy +0.6
(+8.7%)
Real estate/ Others
-3.2 (-19.0%)
Adjustment, etc.
+1.9
Electric power business
+3.9 (+20.5%)
Overseas business
+4.1 (+164.7%)
Increase in gas gross margin +10.7 ・ Sales +73.1: volume composition -57.0, slide +128.9, tariff revisions -6.0, etc. ・ Resource costs -62.4: volume +33.4, exchange -137.0, crude oil +34.0,
etc. Increase in enterprise tax and other fixed costs -5.2, etc.
Increase in TES unit sales, increase in number of installation work ordered, etc.
Construction -3.4: decrease in revenue following the completion of large-scale construction (LNG terminal)
Revenue from dedicated facilities: -2.0 Decrease in earnings from construction of dedicated facilities of pipelines for large-volume customers outside supply areas, etc.
Foreign exchange loss to increase -3.9
LNG sales +2.9: Increase in sales volume (604 kt → 790 kt) (+0.5), increase in unit price
(+2.4) Energy-service -2.1: district heating and cooling cost to increase from a
rise in resource prices due to yen depreciation, etc.
Increase in unit prices
Increase in production at Pluto, increase in earnings from Barnett, etc. +6.5
Decrease in interest received from Bajio -1.6, etc.
3.5

19
FY2013 Uses of Cash Flow
Capital expenditure
Capex Main items Ref: initial plan
Tokyo Gas: 142.5 (-4.1, -2.8%)
Production facilities: 28.4 (+0.3) Hitachi LNG terminal construction, etc.
Tokyo Gas: 146.6
Distribution facilities: 93.3 (-3.3) Ibaraki-Tochigi Line and other trunk line installation, New demand-side pipes and pipelines, etc.
Service and maintenance facilities, etc.: 20.7 (-1.2) Systems-related investment, Tamachi development-related, etc.
Total of Consolidated Subsidiaries: 115.4 (+1.0,+0.9%)
Overseas upstream investment 69.9 On-site energy service 16.9 (ENAC), etc.
Total consolidated subsidiaries: 114.4
Total 254.0 (-4.0, -1.6% after eliminations in consolidation) Total: 258.0
(after eliminations in consolidation)
*Numbers in parentheses refer to comparisons with FY2013 initial plan.
Investments and loans
Returns to shareholders
11.7 (overseas businesses, etc. 20.7, collections on loans -9.0; unchanged from initial plan)
62.7 (TG non-consolidated, on cash flow basis; unchanged from initial plan) (Total of FY2012 year-end dividends’ and FY2013 interim dividends’ ¥26.7 billion, and FY2013 treasury stock purchases’ ¥36.0 billion)
(Unit: billion yen)

20
FY2013 Full Year Forecast: Funding Plan (Consolidated)
Required funds and source of funds
(Unit: billion yen)
Interest-bearing debt
End of FY2012: 642.5 billion yen End of FY2013 2Q: 718.7 billion yen End of FY2013 Forecast: 712.0 billion yen (-4.0 (vs. initial plan)) * Other investment & financing is the net amount of investment outlays and loan repayments. The above does not include CP to be issued and redeemed within FY2013 as seasonal working capital.
[2Q Results] [FY2013 Full Year Forecast]
Required Funds Source of Funds
Capex 121.9 Inte
rnal fu
nd
ing
Depreciation 66.5
Other Investment & Financing* -5.2
Ordinary income
64.9
Dividends & Tax 48.2 Others 2.1
Share buyback 36.0 Total 133.5
Repayment (Non-consolidated)
17.4 (22.5)
Outside funding (Non-consolidated)
84.8 (76.5)
Total 218.3 Total 218.3
Required Funds Source of Funds
Capex 254.0 Inte
rnal fu
nd
ing
Depreciation 139.0
Other Investment & Financing* 11.7
Ordinary income
153.0
Dividends & Tax 68.2 Others 14.5
Share buyback 36.0 Total 306.5
Repayment (Non-consolidated)
53.0 (39.2)
Outside funding (Non-consolidated)
116.4 (107.3)
Total 422.9 Total 422.9
21
FY2013 Current Forecast
FY2013 Previous Forecast
FY2012 Result
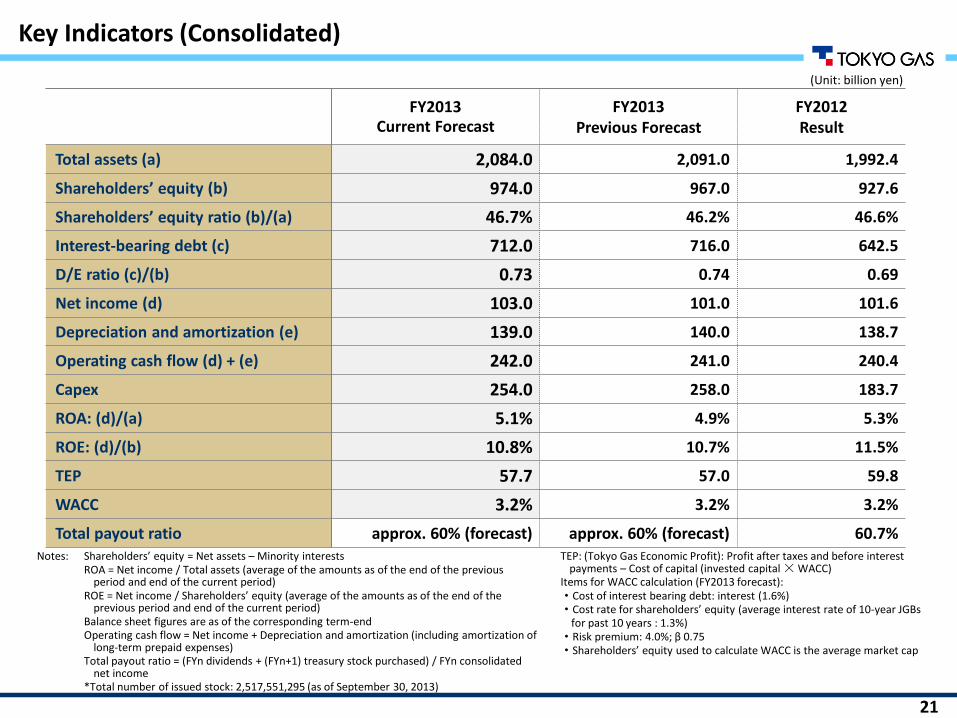
Total assets (a) 2,084.0 2,091.0 1,992.4
Shareholders’ equity (b) 974.0 967.0 927.6
Shareholders’ equity ratio (b)/(a) 46.7% 46.2% 46.6%
Interest-bearing debt (c) 712.0 716.0 642.5
D/E ratio (c)/(b) 0.73 0.74 0.69
Net income (d) 103.0 101.0 101.6
Depreciation and amortization (e) 139.0 140.0 138.7
Operating cash flow (d) + (e) 242.0 241.0 240.4
Capex 254.0 258.0 183.7
ROA: (d)/(a) 5.1% 4.9% 5.3%
ROE: (d)/(b) 10.8% 10.7% 11.5%
TEP 57.7 57.0 59.8
WACC 3.2% 3.2% 3.2%
Total payout ratio approx. 60% (forecast) approx. 60% (forecast) 60.7% Notes: Shareholders’ equity = Net assets – Minority interests ROA = Net income / Total assets (average of the amounts as of the end of the previous
period and end of the current period) ROE = Net income / Shareholders’ equity (average of the amounts as of the end of the
previous period and end of the current period) Balance sheet figures are as of the corresponding term-end Operating cash flow = Net income + Depreciation and amortization (including amortization of
long-term prepaid expenses) Total payout ratio = (FYn dividends + (FYn+1) treasury stock purchased) / FYn consolidated
net income *Total number of issued stock: 2,517,551,295 (as of September 30, 2013)
TEP: (Tokyo Gas Economic Profit): Profit after taxes and before interest payments – Cost of capital (invested capital × WACC)
Items for WACC calculation (FY2013 forecast): ・Cost of interest bearing debt: interest (1.6%) ・Cost rate for shareholders’ equity (average interest rate of 10-year JGBs for past 10 years : 1.3%) ・Risk premium: 4.0%; β 0.75 ・Shareholders’ equity used to calculate WACC is the average market cap
Key Indicators (Consolidated)
(Unit: billion yen)
22
21.6
39.0
21.3
10.0
21.4
5.0
24.3
7.9
24.1
34.0
23.3
5.0
25.7
36.0
25.1
36.7
0.0
10.0
20.0
30.0
40.0
50.0
60.0
70.0
FY06 FY07 FY08 FY09 FY10 FY11 FY12 FY13
(73.6%) (63.4%) (60.9%) (60.1%) (61.4%) (60.7%) (60.1%) (60.0%)
(forecast)
=
+
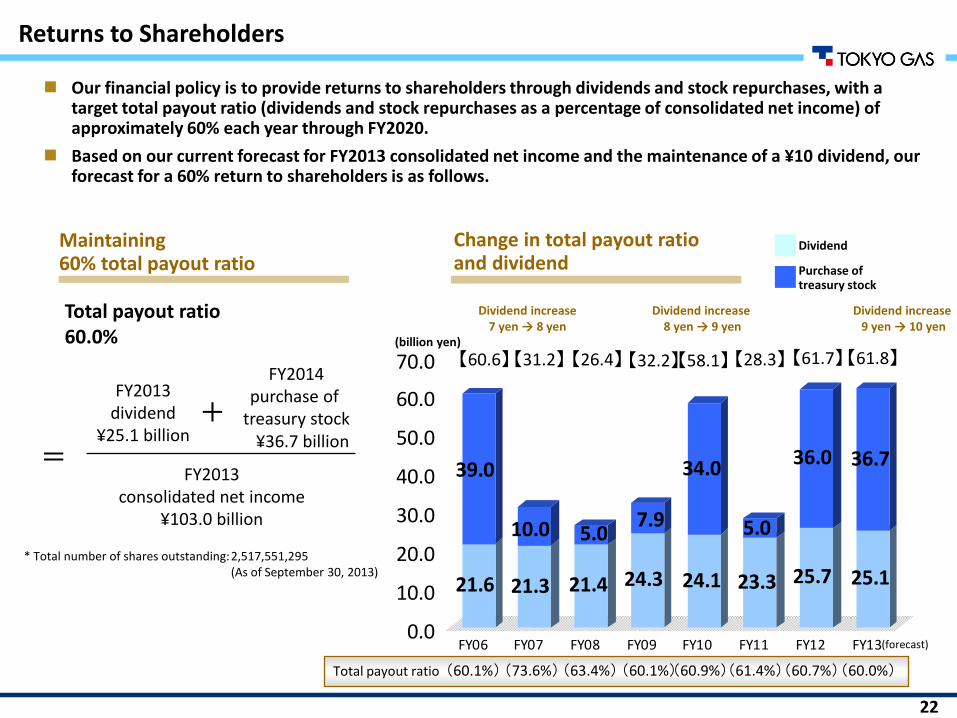
Returns to Shareholders
Our financial policy is to provide returns to shareholders through dividends and stock repurchases, with a target total payout ratio (dividends and stock repurchases as a percentage of consolidated net income) of approximately 60% each year through FY2020.
Based on our current forecast for FY2013 consolidated net income and the maintenance of a ¥10 dividend, our forecast for a 60% return to shareholders is as follows.
Maintaining 60% total payout ratio
Change in total payout ratio and dividend
Total payout ratio 60.0%
FY2013 dividend
¥25.1 billion
FY2014 purchase of
treasury stock ¥36.7 billion
FY2013 consolidated net income
¥103.0 billion
* Total number of shares outstanding: 2,517,551,295 (As of September 30, 2013)
(billion yen)
Dividend increase 8 yen → 9 yen
Dividend increase 7 yen → 8 yen
Dividend increase 9 yen → 10 yen
Dividend
Purchase of treasury stock
Total payout ratio
【60.6】 【31.2】 【26.4】 【32.2】 【58.1】 【28.3】 【61.7】 【61.8】

23
4. Progress under Challenge 2020 Vision

24
• Construction of Ohgishima terminal No. 4 LNG Tank
Construction of No. 4 LNG Tank completed (storage capacity of 250,000kl; full-scale operations from November 2013).
• Spread and expansion of the use of distributed energy systems
Jointly developed with Panasonic world’s first ENE-FARM home fuel cell for condominiums and began accepting orders (October 2013).
• Diversification of gas resource procurement
Cove Point LNG Project in the United States, with which an LNG purchasing agreement (1.4 million tons/year) has been concluded, received approval from the U.S. Department of Energy for LNG exports to non-Free Trade Agreement (non-FTA) countries (September 2013).
• Development of overseas business
Drilling of new gas wells and gas production at the Barnett basin shale gas development project in the United States are proceeding on schedule.
• Installation of natural gas infrastructure
Installation of Hitachi LNG Terminal, Ibaraki-Tochigi Line proceeding on schedule; Shin-Negishi Line and 2nd Phase of Yokohama Line commenced operations.
• Expansion of electric power business
Began construction of Ohgishima Power Station Unit 3 (June 2013).
1. Gas resource procurement and overseas business
2. Production and distribution
3. Energy solution
Major Progress under Vision (Initiatives since Apr. 26, 2013 announcement)

25
Forecast for Medium- to Long-Term Earnings after Tariff Revisions
Going forward, we expect consolidated net income to recover to the FY2013 level in FY2016, with an improvement in the gas gross margin from increased sales volume and a contribution from earnings growth at overseas businesses more than offsetting the increase in depreciation from the Hitachi LNG terminal.
For FY2017-20, expecting consolidated net income to steadily outpace Vision.
Forecast
Reference
Major management coefficients
Cash flow allocation (2012-2020 cumulative)
Current forecast Challenge 2020 Vision
Consolidated operating cash flow FY2012 - FY2020 cumulative
¥2,370.0 billion ¥2,240.0 billion
(Average of ¥250 billion p.a.)
ROE (FY2020) Approx. 10% Approx. 8%
ROA (FY2020) Approx. 5% Approx. 4%
D/E ratio (FY2020) Approx. 0.7 Approx. 0.8
Current forecast Challenge 2020 Vision
Capex ¥1,930.0 billion (73%) ¥1,680.0 billion (68%)
Investments and loans ¥200.0 billion (7%) ¥380.0 billion (16%)
Returns to shareholders ¥510.0 billion (20%) ¥420.0 billion (17%)
External borrowings ¥270.0 billion ¥240.0 billion

26
5. Reference Materials
27
823 924 8231,035
7691,008 1,019
720 815
18 20 710 8
17 2019
1510
12 21 1318
27
39
123
149 155 170
324
419865 905823
727 677774 826
886 775783
793 825 778833
779
861
757
826 844 803
764
825
624 601 596 482 518 589 550 626 704824 752 781
1,029
0
500
1,000
1,500
2,000 Power generation
Tolling Industrial Total
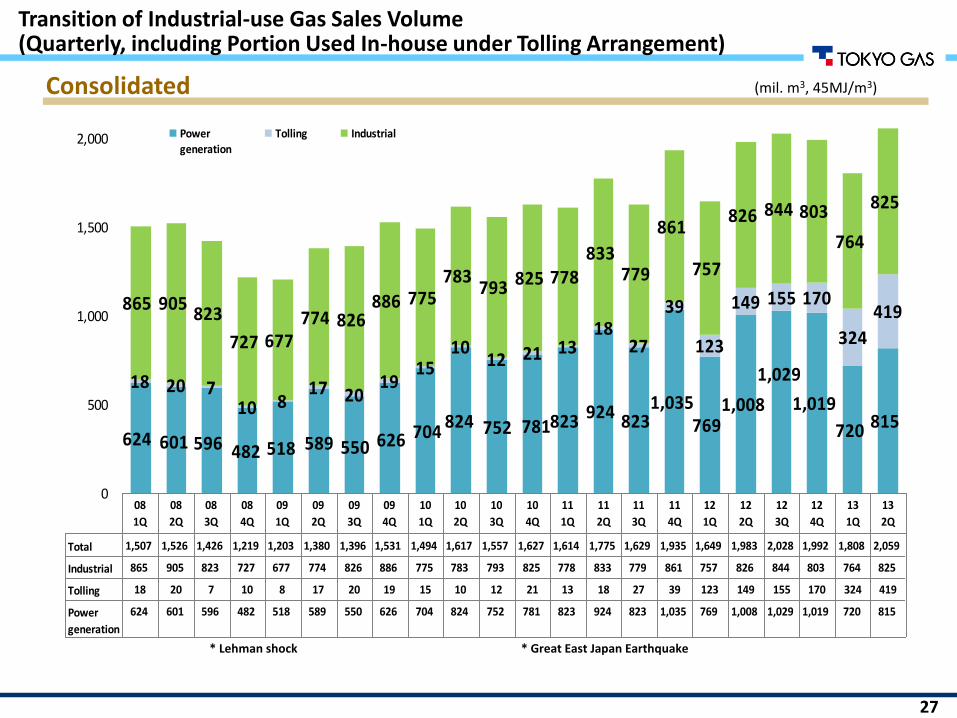
Total 1,507 1,526 1,426 1,219 1,203 1,380 1,396 1,531 1,494 1,617 1,557 1,627 1,614 1,775 1,629 1,935 1,649 1,983 2,028 1,992 1,808 2,059
Industrial 865 905 823 727 677 774 826 886 775 783 793 825 778 833 779 861 757 826 844 803 764 825
Tolling 18 20 7 10 8 17 20 19 15 10 12 21 13 18 27 39 123 149 155 170 324 419
Power
generation
624 601 596 482 518 589 550 626 704 824 752 781 823 924 823 1,035 769 1,008 1,029 1,019 720 815
08
1Q
08
2Q
08
3Q
08
4Q
09
1Q
09
2Q
09
3Q
09
4Q
10
1Q
10
2Q
10
3Q
10
4Q
11
1Q
11
2Q
11
3Q
11
4Q
12
1Q
12
2Q
12
3Q
12
4Q
13
1Q
13
2Q
(mil. m3, 45MJ/m3)
Transition of Industrial-use Gas Sales Volume (Quarterly, including Portion Used In-house under Tolling Arrangement)
Consolidated
* Lehman shock * Great East Japan Earthquake

28
Impact on earnings
3Q 4Q 2nd half
Pe
riod
3Q -0.2 -1.0 -1.2
4Q -0.1 -0.1
2nd half -0.2 -1.1 -1.3
Impact on earnings
3Q 4Q 2nd half
Pe
riod
3Q -1.3 1.2 -0.1
4Q -1.6 -1.6
2nd half -1.3 -0.4 -1.7
Gross Margin Sensitivity to Changes in Oil Price and Exchange Rate
Impact of rising JCC by $1/bbl
Impact of yen depreciation by ¥1/$
(Unit: billion yen)
(Unit: billion yen)

29
TSE:9531
< Cautionary Statement regarding Forward‐looking Statements >
Statements made in this presentation with respect to Tokyo Gas’s present plans, forecasts, strategies and beliefs, and other statements herein that are not expressions of historical fact are forward‐looking statements about the future performance of the Company. As such, they are based on management‘s assumptions and opinions stemming from currently available information and therefore involve risks and uncertainties.
The Company’s actual performance may greatly differ from these projections, due to these risks and uncertainties which include without limitation general economic conditions in Japan, crude oil prices, the weather, changes in the foreign exchange rate of the yen, rapid technological innovations and the Company’s responses to the progress of deregulation.