FY2011: Interim Results Presentation August 2011 · 4 Main Achievements in 1H 2011Main Achievements...
27
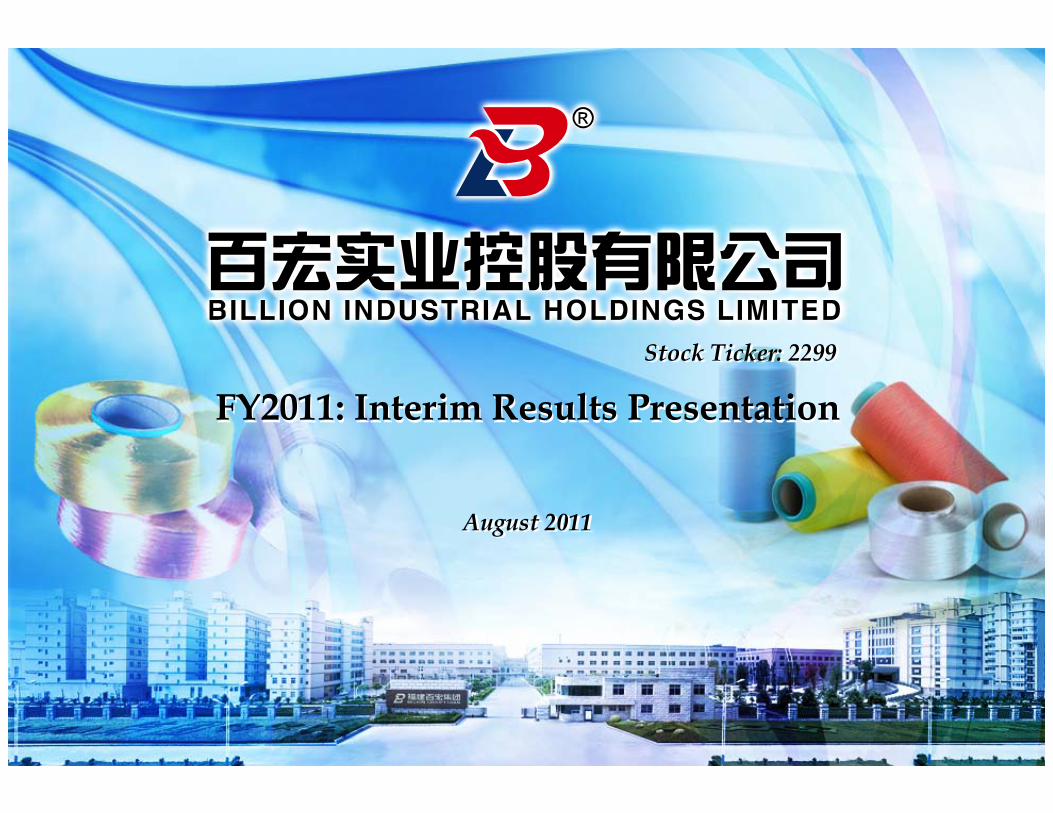
1 FY2011: Interim Results Presentation FY2011: Interim Results Presentation August 2011 August 2011 Stock Ticker: 2299 Stock Ticker: 2299
Transcript of FY2011: Interim Results Presentation August 2011 · 4 Main Achievements in 1H 2011Main Achievements...
1
FY2011: Interim Results PresentationFY2011: Interim Results Presentation
August 2011August 2011
Stock Ticker: 2299Stock Ticker: 2299
2
DisclaimerDisclaimer
This document has been compiled by Billion Industrial Holdings Limited. All persons are prohibited to copy or forward this document onward. In other jurisdictions, the distribution of this document may be subject to local laws and restrictions; the person who possesses this document must understand and comply with such legal restrictions. The information contained in this document has not been independently verified. No representation or warranty, expressed or implied is made as to the fairness, accuracy, completeness or correctness of the information and opinions contained in this document. This document is not aimed to be a complete or comprehensive analysis of the financial or trading positions or prospects, any person who possesses this document should note that the contents should not be unduly relied upon. Information and opinions contained in this document are subject to change withoutnotice. Nothing in this document should be considered a solicitation, offer or invitation to buy, subscribe for or sell the Company's securities. None of Billion Industrial, its directors, employees or agents or any other persons accepts any liability for any loss whatsoever arising from any use of this document or its contents, or otherwise arising in connection therewith (regardless if they are negligent or otherwise).
This document is based on public information and compiled information previously disclosed by the Company. This document may contain forward-looking statements involving risks and uncertainties. Forward-looking statements are related to expectations, estimates, plans, projections, objectives, opportunities, or other possibly forward-looking terminology that express the Company's expectations or results of possible future actions or related actions’ results. Forward-looking statements are based on the Company's own data and other sources believed to be reliable, but should not be unduly relied upon or over trusted. The Company's actual results may differ from those described in forward-looking statements, so that the Company's stock price fluctuates.
Warning: The contents of this document have not been reviewed by the regulatory authorities in Hong Kong. You should exercise caution in respect to the offer. If you have any doubts of the contents of this document, you should seek independent professional advice.
I. 1H2011 Results Overview
II. Company Overview
III. Competitive Strengths
IV. Financial Highlights
V. Corporate Strategies
4
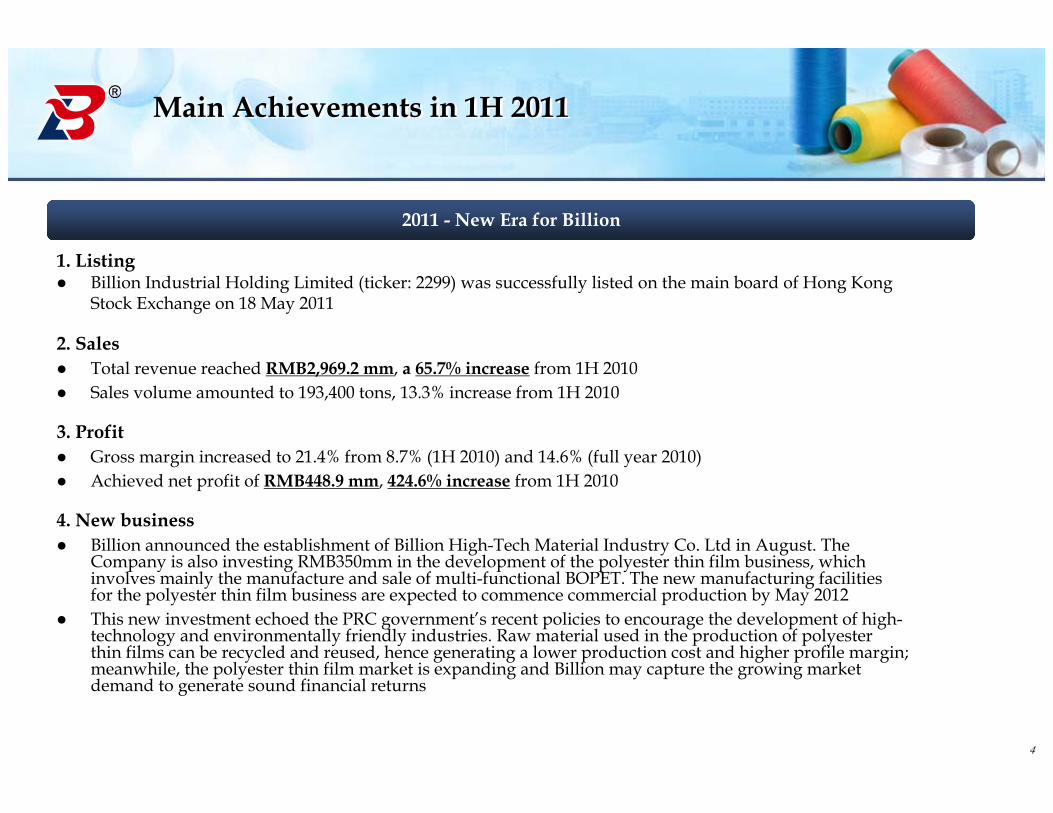
Main Achievements in 1H 2011Main Achievements in 1H 2011
2011 - New Era for Billion
1. Listing Billion Industrial Holding Limited (ticker: 2299) was successfully listed on the main board of Hong Kong
Stock Exchange on 18 May 2011
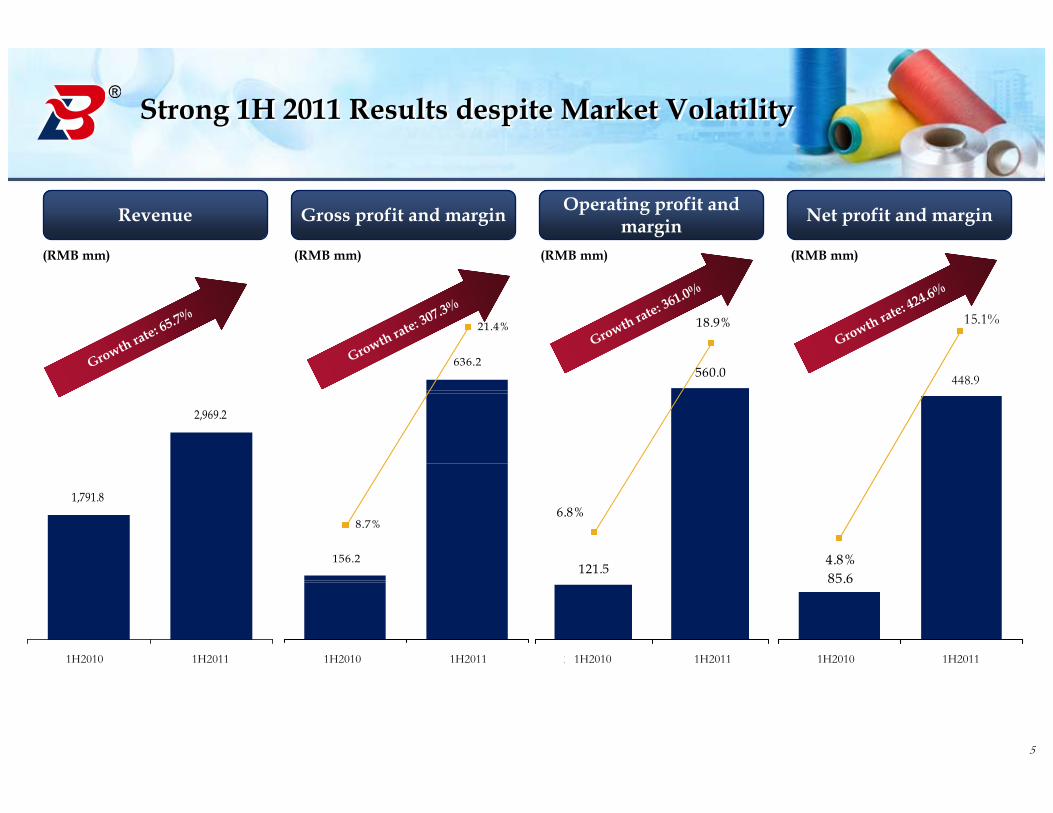
2. Sales Total revenue reached RMB2,969.2 mm, a 65.7% increase from 1H 2010 Sales volume amounted to 193,400 tons, 13.3% increase from 1H 2010
3. Profit Gross margin increased to 21.4% from 8.7% (1H 2010) and 14.6% (full year 2010) Achieved net profit of RMB448.9 mm, 424.6% increase from 1H 2010
4. New business Billion announced the establishment of Billion High-Tech Material Industry Co. Ltd in August. The
Company is also investing RMB350mm in the development of the polyester thin film business, which involves mainly the manufacture and sale of multi-functional BOPET. The new manufacturing facilities for the polyester thin film business are expected to commence commercial production by May 2012
This new investment echoed the PRC government’s recent policies to encourage the development of high-technology and environmentally friendly industries. Raw material used in the production of polyester thin films can be recycled and reused, hence generating a lower production cost and higher profile margin; meanwhile, the polyester thin film market is expanding and Billion may capture the growing market demand to generate sound financial returns
5
2,969.2
1,791.8
2010上半年 2011上半年
Strong 1H 2011 Results despite Market VolatilityStrong 1H 2011 Results despite Market Volatility
8.7%
21.4%
2010上半年 2011上半年
156.2
636.2
85.6
435.2
14.7%
4.8%
2010上半年 2011上半年
121.5
560.0
6.8%
18.9%
2010上半年 2011上半年
Operating profit and margin Net profit and marginGross profit and marginRevenue
Growth rate: 307.3%
Growth rate: 65.7%
Growth rate: 361.0%
Growth rate: 424.6%
(RMB mm)
448.9
(RMB mm) (RMB mm) (RMB mm)
1H2010 1H2011 1H2010 1H2011 1H2010 1H2011 1H20111H2010
15.1%
I. 1H2011 Results Overview
II. Company Overview
III. Competitive Strengths
IV. Financial Highlights
V. Corporate Strategies
7
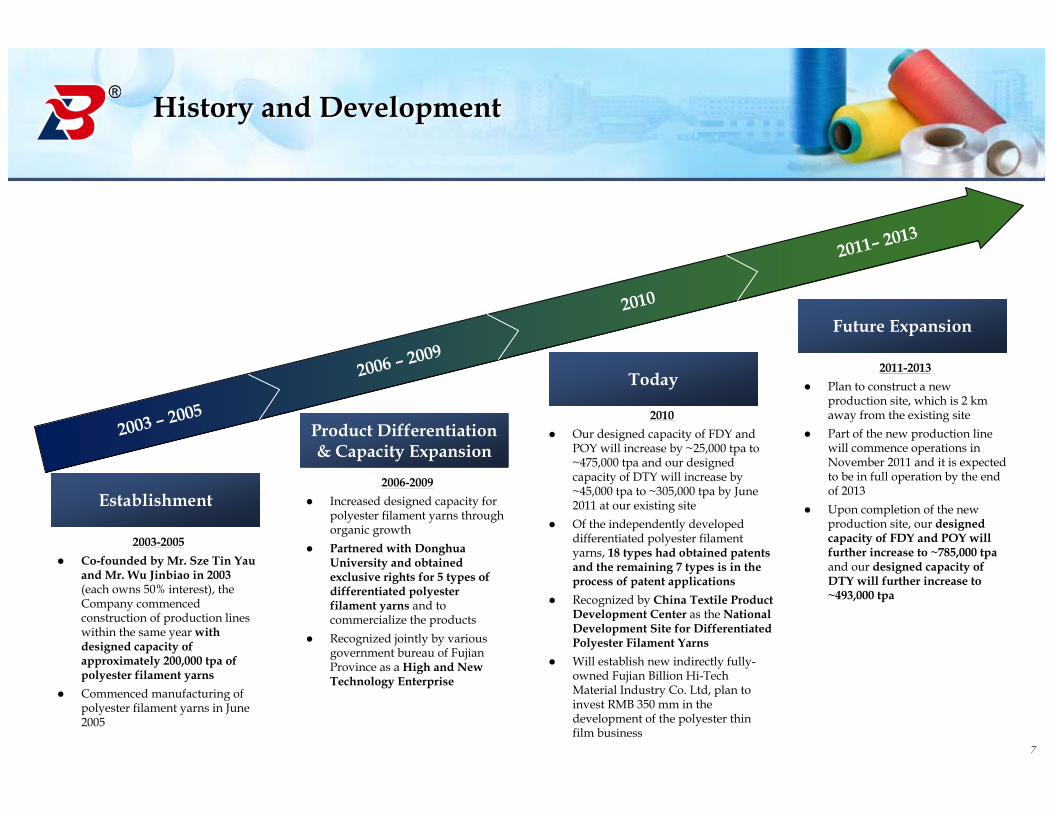
Establishment
2003-2005 Co-founded by Mr. Sze Tin Yau
and Mr. Wu Jinbiao in 2003 (each owns 50% interest), the Company commenced construction of production lines within the same year with designed capacity of approximately 200,000 tpa of polyester filament yarns
Commenced manufacturing of polyester filament yarns in June 2005
Product Differentiation & Capacity Expansion
2006-2009 Increased designed capacity for
polyester filament yarns through organic growth
Partnered with Donghua University and obtained exclusive rights for 5 types of differentiated polyester filament yarns and to commercialize the products
Recognized jointly by various government bureau of Fujian Province as a High and New Technology Enterprise
History and DevelopmentHistory and Development
Today
2010 Our designed capacity of FDY and
POY will increase by ~25,000 tpa to ~475,000 tpa and our designed capacity of DTY will increase by ~45,000 tpa to ~305,000 tpa by June 2011 at our existing site
Of the independently developed differentiated polyester filament yarns, 18 types had obtained patents and the remaining 7 types is in the process of patent applications
Recognized by China Textile Product Development Center as the National Development Site for Differentiated Polyester Filament Yarns
Will establish new indirectly fully-owned Fujian Billion Hi-Tech Material Industry Co. Ltd, plan to invest RMB 350 mm in the development of the polyester thin film business
Future Expansion
2011-2013 Plan to construct a new
production site, which is 2 km away from the existing site
Part of the new production line will commence operations in November 2011 and it is expected to be in full operation by the end of 2013
Upon completion of the new production site, our designed capacity of FDY and POY will further increase to ~785,000 tpaand our designed capacity of DTY will further increase to ~493,000 tpa
2003 – 2005
2006 – 2009
2010
2011– 2013
8
Company OverviewCompany Overview
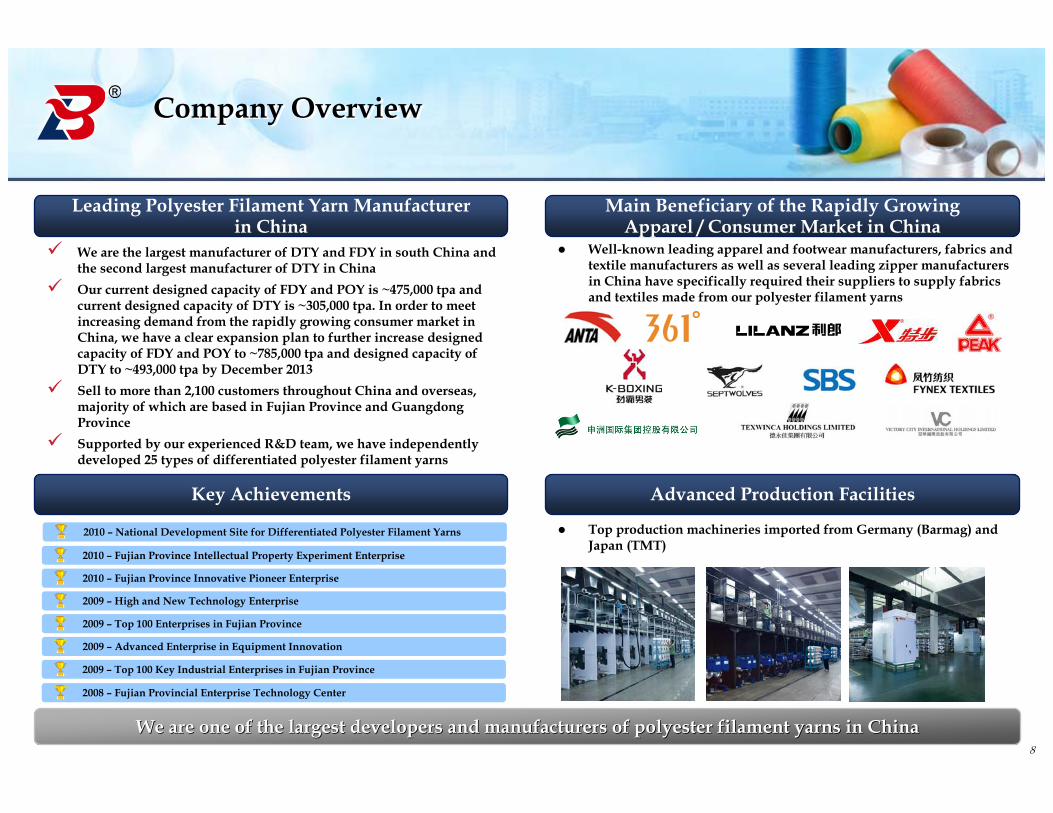
Leading Polyester Filament Yarn Manufacturer in China
Main Beneficiary of the Rapidly Growing Apparel / Consumer Market in China
Key Achievements Advanced Production Facilities
We are one of the largest developers and manufacturers of polyesWe are one of the largest developers and manufacturers of polyester filament yarns in Chinater filament yarns in China
We are the largest manufacturer of DTY and FDY in south China and the second largest manufacturer of DTY in China
Our current designed capacity of FDY and POY is ~475,000 tpa and current designed capacity of DTY is ~305,000 tpa. In order to meet increasing demand from the rapidly growing consumer market in China, we have a clear expansion plan to further increase designed capacity of FDY and POY to ~785,000 tpa and designed capacity of DTY to ~493,000 tpa by December 2013
Sell to more than 2,100 customers throughout China and overseas,majority of which are based in Fujian Province and Guangdong Province
Supported by our experienced R&D team, we have independently developed 25 types of differentiated polyester filament yarns
Top production machineries imported from Germany (Barmag) and Japan (TMT)
Well-known leading apparel and footwear manufacturers, fabrics and textile manufacturers as well as several leading zipper manufacturers in China have specifically required their suppliers to supply fabrics and textiles made from our polyester filament yarns
2010 – Fujian Province Innovative Pioneer Enterprise
2010 – Fujian Province Intellectual Property Experiment Enterprise
2009 – High and New Technology Enterprise
2009 – Top 100 Enterprises in Fujian Province
2009 – Advanced Enterprise in Equipment Innovation
2009 – Top 100 Key Industrial Enterprises in Fujian Province
2010 – National Development Site for Differentiated Polyester Filament Yarns
2008 – Fujian Provincial Enterprise Technology Center
9
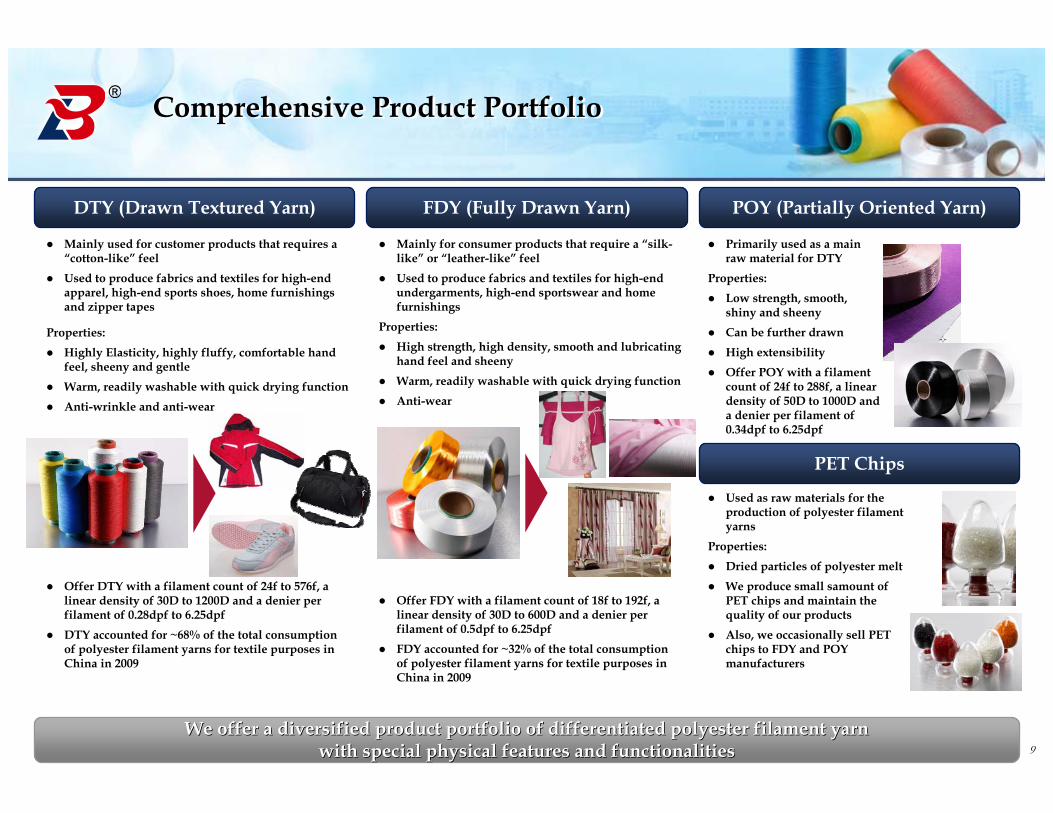
Mainly used for customer products that requires a “cotton-like” feel
Used to produce fabrics and textiles for high-end apparel, high-end sports shoes, home furnishings and zipper tapes
Properties: Highly Elasticity, highly fluffy, comfortable hand
feel, sheeny and gentle Warm, readily washable with quick drying function Anti-wrinkle and anti-wear
Offer DTY with a filament count of 24f to 576f, a linear density of 30D to 1200D and a denier per filament of 0.28dpf to 6.25dpf
DTY accounted for ~68% of the total consumption of polyester filament yarns for textile purposes in China in 2009
Mainly for consumer products that require a “silk-like” or “leather-like” feel
Used to produce fabrics and textiles for high-end undergarments, high-end sportswear and home furnishings
Properties: High strength, high density, smooth and lubricating
hand feel and sheeny Warm, readily washable with quick drying function Anti-wear
Offer FDY with a filament count of 18f to 192f, a linear density of 30D to 600D and a denier per filament of 0.5dpf to 6.25dpf
FDY accounted for ~32% of the total consumption of polyester filament yarns for textile purposes in China in 2009
Comprehensive Product PortfolioComprehensive Product Portfolio
Used as raw materials for the production of polyester filament yarns
Properties: Dried particles of polyester melt We produce small samount of
PET chips and maintain the quality of our products
Also, we occasionally sell PET chips to FDY and POY manufacturers
Primarily used as a main raw material for DTY
Properties: Low strength, smooth,
shiny and sheeny Can be further drawn High extensibility Offer POY with a filament
count of 24f to 288f, a linear density of 50D to 1000D and a denier per filament of 0.34dpf to 6.25dpf
DTY (Drawn Textured Yarn) FDY (Fully Drawn Yarn) POY (Partially Oriented Yarn)
PET Chips
We We offer a diversified product portfolio of differentiated polyesteoffer a diversified product portfolio of differentiated polyester filament yarn r filament yarn with special physical features and functionalitieswith special physical features and functionalities

10
Polyester Filament Yarn Production ProcessPolyester Filament Yarn Production Process
We use a technologically advanced polyester melt direct spinningWe use a technologically advanced polyester melt direct spinning method to produce polyester filament yarns, method to produce polyester filament yarns, which enables us to improve production efficiency and at a lowerwhich enables us to improve production efficiency and at a lower costcost
Mixes PTA and MEG together under high temperature and high pressure to produce polyester melt
After the polymerizing process, polyester melt is cooled, dried, cut into small pieces, packed and then stored in our warehouse
POY is partially drawn processed through a pre-orientation process
Polyester melt is first pushed through the spinning holes on the spinneret into polyester filaments which are then drawn and combined into polyester filament yarns
FDY is fully drawn through a heated drawing process
By applying various methods during the production process of our polyester filament yarns, we can achieve special features and functionalities of differentiated polyester filament yarns
► Add special chemical additives during the polymerizing process to achieve special features such as ultraviolet resistant and ultra-white
► Change the number, size and shape of spinning holes on the spinneret to create various shapes of cross-sections of filaments in order to achieve special features such as water-absorbing, sweat-discharging and ultra-soft
► Adjust the various parameters and processing measures in the spinning and texturing processes to achieve different textures and feels
MEG
PTA
Polymerizing Process
Polyester Melt
FDY
PET Chips
WarehouseQuality Control Packaging
POY / FDYSpinning POY DTY
POY is processed through a texturing process to become DTY
9
11
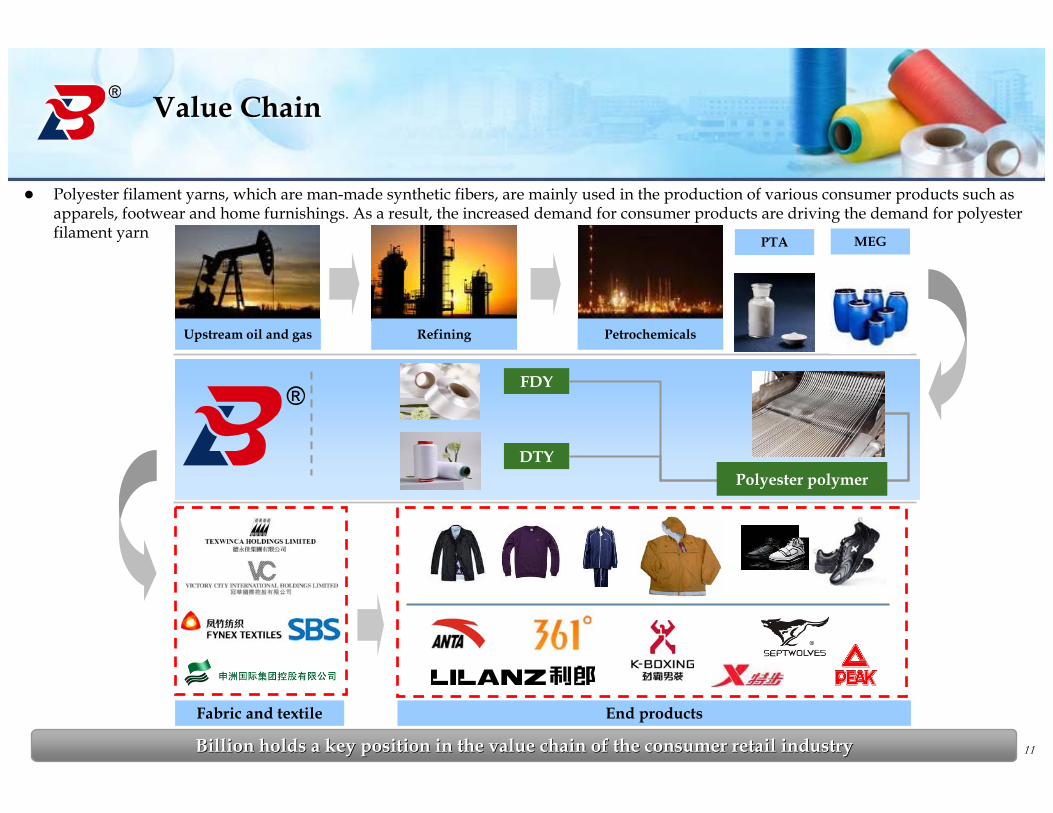
Value ChainValue Chain
Polyester filament yarns, which are man-made synthetic fibers, are mainly used in the production of various consumer products such as apparels, footwear and home furnishings. As a result, the increased demand for consumer products are driving the demand for polyester filament yarn PTA MEG
FDY
DTY
Upstream oil and gas Refining Petrochemicals
Fabric and textile End products
Polyester polymer
Billion holds a key position in the value chain of the consumer Billion holds a key position in the value chain of the consumer retail industryretail industry

I. 1H2011 Results Overview
II. Company Overview
III. Competitive Strengths
IV. Financial Highlights
V. Corporate Strategies
13
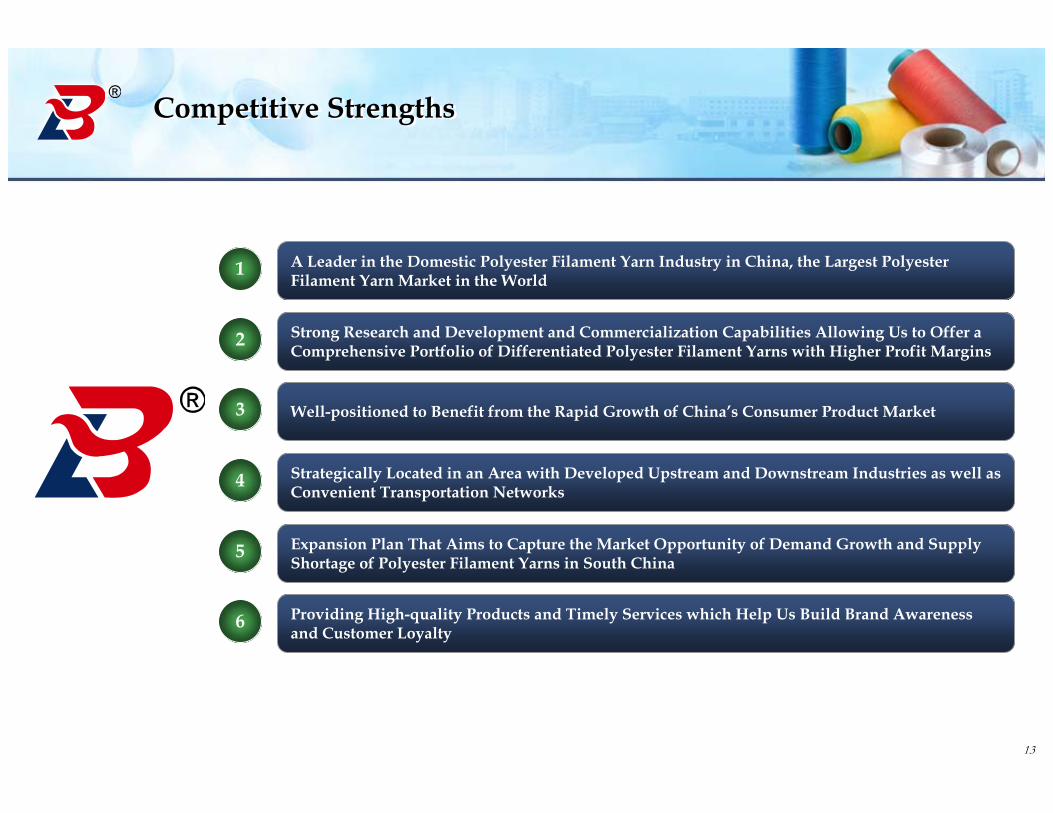
Competitive StrengthsCompetitive Strengths
1
3
2
4
5
6
A Leader in the Domestic Polyester Filament Yarn Industry in China, the Largest Polyester Filament Yarn Market in the World
Strong Research and Development and Commercialization Capabilities Allowing Us to Offer a Comprehensive Portfolio of Differentiated Polyester Filament Yarns with Higher Profit Margins
Well-positioned to Benefit from the Rapid Growth of China’s Consumer Product Market
Strategically Located in an Area with Developed Upstream and Downstream Industries as well as Convenient Transportation Networks
Expansion Plan That Aims to Capture the Market Opportunity of Demand Growth and Supply Shortage of Polyester Filament Yarns in South China
Providing High-quality Products and Timely Services which Help Us Build Brand Awareness and Customer Loyalty

14
China66%
China32%
1
Global Share of China’s Polyester Filament Yarn Production
Designed Capacity of FDY and POY of the Top Five Manufactures in South China (2010)
Designed Capacity of Top Five DTY Manufacturers in China (2010)
According to CMAI, China’s share of global polyester filament yarn production has increased from 32% in 2000 to 66% in 2009
By 2015, China’s share of global polyester filament yarn production is expected to be 72%, maintaining its leadership position
In south China, the top five polyester filament yarn manufacturers collectively have a total designed capacity of approximately 1.2mtpa, accounting for over 92.0% of the total designed capacity in the area. Billion has the largest designed capacity among the five
As a leading producer of polyester filament yarn in China, the largest polyester filament yarn market in the world, Billion is well-positioned to benefit from the development of this market
Source: CMAI
2000 2009 2015
China72%
A Leader in the Polyester Filament Yarn Industry in China, the Largest Polyester Filament Yarn Market in the WorldA Leader in the Polyester Filament Yarn Industry in China, the Largest Polyester Filament Yarn Market in the World
(ktpa)
335
450
785
215 180 160 150
0
200
400
600
800
1,000
Billion Jinlun Xianglu Jinxing Kaiping
Expected designed capacity by 2013
Current designed capacity
(ktpa)
260
233300
493
250220 200
0
100
200
300
400
500
Hengyi Billion Rongsheng Shenghong Hengli
Expected designed capacity by 2013
Current designed capacity
493

15
Strong Research and Development and Commercialization CapabilitiesStrong Research and Development and Commercialization Capabilities
2
Benefitting from our R&D team of 505 professionals, Billion’s sales in differentiated products achieved RMB 1.89 bn in 2011H1, accounting for 64% of total sales. With our differentiated products catering to the evolving market demand, we
have managed to achieve higher market recognition, market share and ASP as well as gross margins
EvolvingMarket Demand
Strong R&D Team
Advanced Production Machineries
Differentiated Products with High Market Recognition
Close Communication with Customers
Strong R&D Team Major Awards and Recognition
Increasingly diversified requirements in the functions and features of the textile consumer products
Strong demand for differentiated polyester filament yarns
Differentiated polyester filament yarns with high market recognition and higher profit margins– ultraviolet resistant– water absorbing and sweat
discharging– flame resistant– anti-abrasion– ultra-soft– ultra-white– ultra-bright– anti-bacterial
Revenue from differentiated products achieved RMB1.89bn in the first half of 2011, representing 64% of total revenue
Close and frequent communication with customers to gain a better understanding of their needs
505 dedicated R&D professionals Already developed 25 types of differentiated
products with 18 patents Partnered with Donghua University and
obtained exclusive rights for 5 types of patented differentiated polyester filament yarns and to commercialize the products through 2013
Expect to develop 5 new types of differentiated products in each of 2012 and 2013
Has applied for the certification as a National Standard Laboratory
Advanced production machineries ensure high production efficiency and constant product quality
16
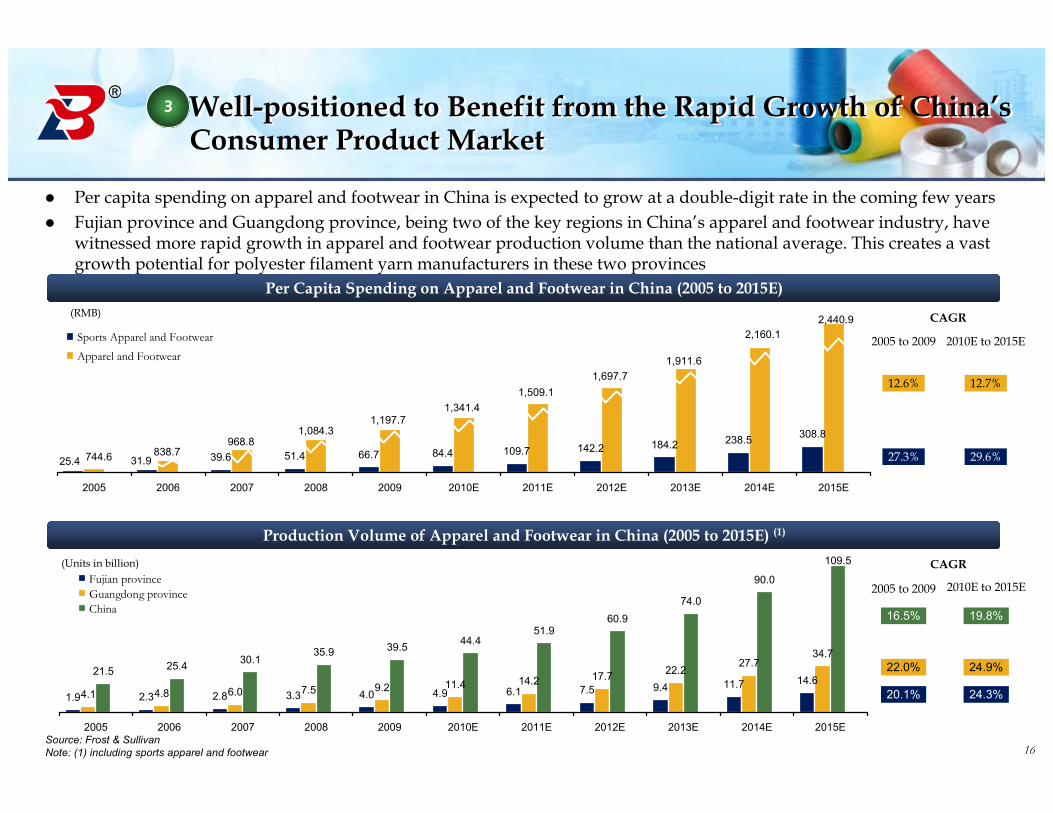
1.9 2.3 2.8 3.3 4.0 4.9 6.1 7.5 9.4 11.7 14.64.1 4.8 6.0 7.5 9.2 11.4 14.2 17.7 22.2
27.734.7
21.5 25.4 30.135.9 39.5 44.4
51.960.9
74.0
90.0
109.5
2005 2006 2007 2008 2009 2010E 2011E 2012E 2013E 2014E 2015E
Fujian provinceGuangdong provinceChina
39.6 51.4 66.7 84.4 109.7 142.2 184.2 238.5 308.8
31.925.4 744.6 838.7968.8
1,084.31,197.7
1,341.41,509.1
1,697.71,911.6
2,160.12,440.9
2005 2006 2007 2008 2009 2010E 2011E 2012E 2013E 2014E 2015E
Sports Apparel and FootwearApparel and Footwear
Source: Frost & SullivanNote: (1) including sports apparel and footwear
Production Volume of Apparel and Footwear in China (2005 to 2015E) (1)
(Units in billion)
20.1% 24.3%
22.0% 24.9%
16.5% 19.8%
CAGR
2005 to 2009 2010E to 2015E
(RMB)
Per Capita Spending on Apparel and Footwear in China (2005 to 2015E)
CAGR
2005 to 2009 2010E to 2015E
27.3% 29.6%
12.6% 12.7%
Per capita spending on apparel and footwear in China is expected to grow at a double-digit rate in the coming few years Fujian province and Guangdong province, being two of the key regions in China’s apparel and footwear industry, have
witnessed more rapid growth in apparel and footwear production volume than the national average. This creates a vast growth potential for polyester filament yarn manufacturers in these two provinces
Well-positioned to Benefit from the Rapid Growth of China’s Consumer Product MarketWell-positioned to Benefit from the Rapid Growth of China’s Consumer Product Market
3

17
Strategically Located in an Area with Developed Upstream and Downstream Industries as well as Convenient Transportation Networks
Strategically Located in an Area with Developed Upstream and Downstream Industries as well as Convenient Transportation Networks
4
Rapid Economic Growth Complete Textile Industry Chain and Convenient Transportation Networks
Key statistics of Guangdong (RMB): GDP: 3,948.3 billion(1)
GDP 09-15 CAGR: 9.6%(2)
Urban disposable income per capita: 21,575(1)
Per capita consumer spending: 16,858 Production volume of apparel and
footwear: 9,186mn (23.2% of China)
Key statistics of Fujian (RMB): GDP: 1,223.7 billion(1)
GDP 09-15 CAGR: 13.2%(2)
Urban disposable income per capita: 19,577(1)
Per capita consumer spending: 13,451 Production volume of apparel and
footwear: 3,990mn (10.1% of China)
Convenient transportation networks Proximity to Shenhu Port, a national open port Proximity to Highway 308, a provincial highway, and Shenhai
Highway, a national highway Able to transport products on a timely and cost-efficient basis to
customers
Jinjiang is one of the largest apparel production bases in China A complete downstream textile production chain, composed of a
large number of textile and fabric manufacturers and apparel, footwear and home furnishing manufacturers
Able to supply customers at lower transportation costs and within a shorter period of time
Specifically required by well-known leading apparel and footwear manufacturers in China that fabrics and textile supplied to themare made from Billion’s polyester filament yarns
Located in an area with ample raw material supplies Major PTA manufactures based in Jinjiang City and its
neighboring areas where Billion is located Obtain raw material at relatively lower transportation costs and
within a shorter time period
Source: National Bureau of Statistics of China, Guangdong Bureau of Statistics, Fujian Bureau of Statistics, Frost & SullivanNote: (1) All figures in 2009
(2) Frost & Sullivan Forecasts
Guangdong
FujianJinjiang
Primarily focus sales in Fujian Province and Guangdong Province The economy and apparel manufacturing industry are developing rapidly Sales in Fujian and Guangdong accounted for 72.5% and 13.2% in 2011 H1
18
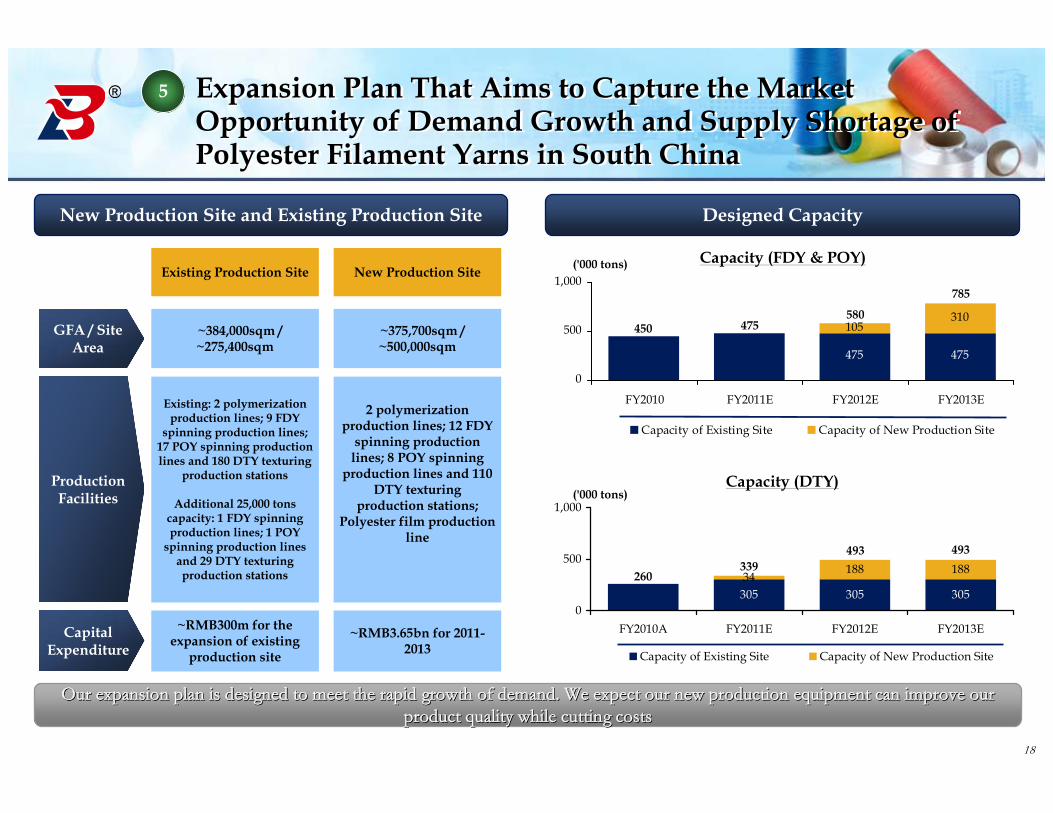
Expansion Plan That Aims to Capture the Market Opportunity of Demand Growth and Supply Shortage of Polyester Filament Yarns in South China
Expansion Plan That Aims to Capture the Market Opportunity of Demand Growth and Supply Shortage of Polyester Filament Yarns in South China
5
Designed Capacity
475 475
105310
785
580475450
0
500
1,000
FY2010 FY2011E FY2012E FY2013E
Capacity of Existing Site Capacity of New Production Site
('000 tons)
305 305
188
305
18834260339
493 493
0
500
1,000
FY2010A FY2011E FY2012E FY2013E
Capacity of Existing Site Capacity of New Production Site
('000 tons)
Capacity (FDY & POY)
Capacity (DTY)
New Production Site and Existing Production Site
GFA / Site Area
~384,000sqm /~275,400sqm
Production Facilities
Existing: 2 polymerization production lines; 9 FDY
spinning production lines; 17 POY spinning production lines and 180 DTY texturing
production stations
Additional 25,000 tons capacity: 1 FDY spinning production lines; 1 POY
spinning production lines and 29 DTY texturing production stations
Capital Expenditure
~RMB300m for the expansion of existing
production site
2 polymerization production lines; 12 FDY
spinning production lines; 8 POY spinning
production lines and 110 DTY texturing
production stations;Polyester film production
line
~375,700sqm / ~500,000sqm
Our expansion plan is designed to meet the rapid growth of demanOur expansion plan is designed to meet the rapid growth of demand. We expect our new production equipment can improve our d. We expect our new production equipment can improve our product quality while cutting costsproduct quality while cutting costs
Existing Production Site New Production Site
~RMB3.65bn for 2011-2013
19
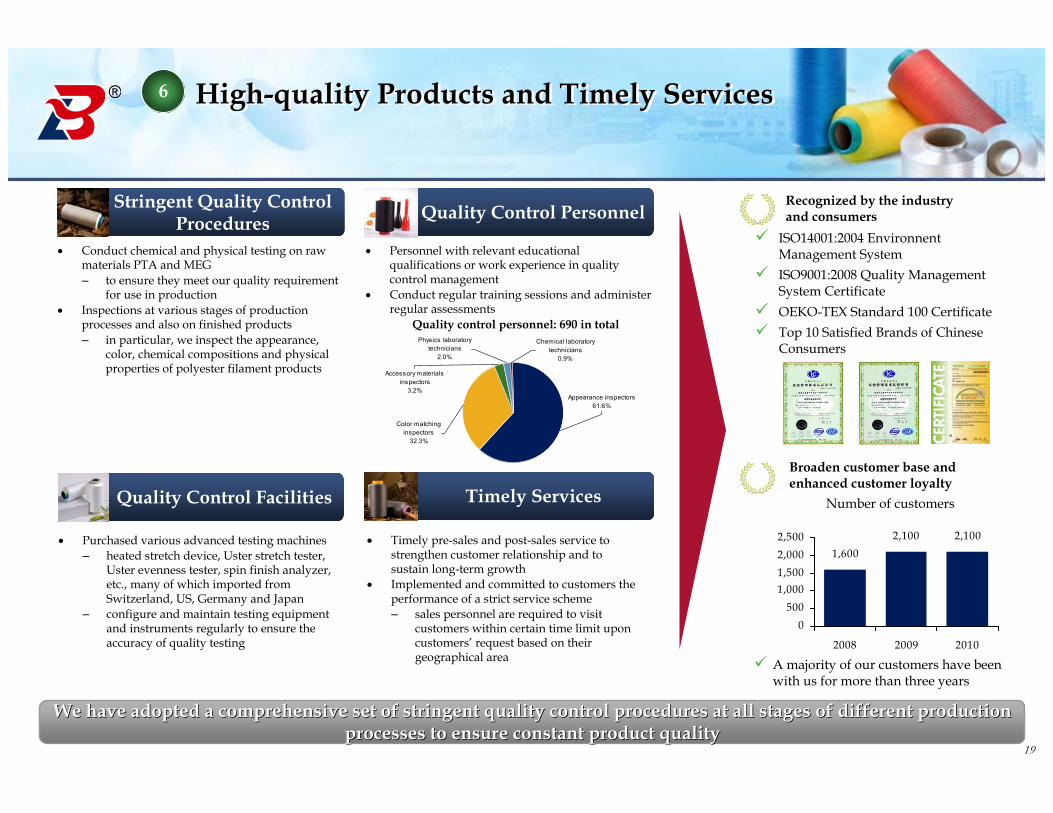
Physics laboratory technicians
2.0%
Chemical laboratory technicians
0.9%
Accessory materials inspectors
3.2%Appearance inspectors
61.6%
Color matching inspectors
32.3%
1,6002,100 2,100
0500
1,0001,5002,0002,500
2008 2009 2010
High-quality Products and Timely ServicesHigh-quality Products and Timely Services6
We have adopted a comprehensive set of stringent quality controlWe have adopted a comprehensive set of stringent quality control procedures at all stages of different production procedures at all stages of different production processes to ensure constant product qualityprocesses to ensure constant product quality
Conduct chemical and physical testing on raw materials PTA and MEG– to ensure they meet our quality requirement
for use in production Inspections at various stages of production
processes and also on finished products– in particular, we inspect the appearance,
color, chemical compositions and physical properties of polyester filament products
Personnel with relevant educational qualifications or work experience in quality control management
Conduct regular training sessions and administer regular assessments
Purchased various advanced testing machines– heated stretch device, Uster stretch tester,
Uster evenness tester, spin finish analyzer, etc., many of which imported from Switzerland, US, Germany and Japan
– configure and maintain testing equipment and instruments regularly to ensure the accuracy of quality testing
Stringent Quality Control Procedures Quality Control Personnel
Timely pre-sales and post-sales service to strengthen customer relationship and to sustain long-term growth
Implemented and committed to customers the performance of a strict service scheme– sales personnel are required to visit
customers within certain time limit upon customers’ request based on their geographical area
Quality control personnel: 690 in total
Timely ServicesQuality Control Facilities
Recognized by the industry and consumers
ISO14001:2004 Environnent Management System
ISO9001:2008 Quality Management System Certificate
OEKO-TEX Standard 100 Certificate Top 10 Satisfied Brands of Chinese
Consumers
Broaden customer base and enhanced customer loyalty
A majority of our customers have been with us for more than three years
Number of customers

I. 1H2011 Results Overview
II. Company Overview
III. Competitive Strengths
IV. Financial Highlights
V. Corporate Strategies

21
110.5 115.5
33.546.75.42.721.2
28.4
1H2010 1H2011
170.7193.4
97.1
236.5 238.839.8
43.080.7
37.7
27.4
12.0
24.6
28.2
47.8
FY2008 FY2009 FY2010
199.2
335.0
379.3
1,148.9
2,207.1
2,870.6417.7
358.9
940.1
379.4
211.3
122.7
167.6
185.8
376.3
FY2008 FY2009 FY2010
2,113.6
2,963.2
4,309.7
1,212.9
1,910.0
364.7
723.0
37.0
164.0
299.2
50.2
1H2010 1H2011
1,791.8
2,969.2
Revenue Sales Volume
We managed to grow our revenue significantly through increasing We managed to grow our revenue significantly through increasing sales volume and selling pricesales volume and selling price
Robust Revenue GrowthRobust Revenue Growth
(’000 tons)(RMB mm)
(1) Others include PET chips and wasted filament
Growth: 65.7%
Growth: 13.3%
CAGR = 42.8%
CAGR = 38.0%
DTY FDY POY Others¹
2963.1
22
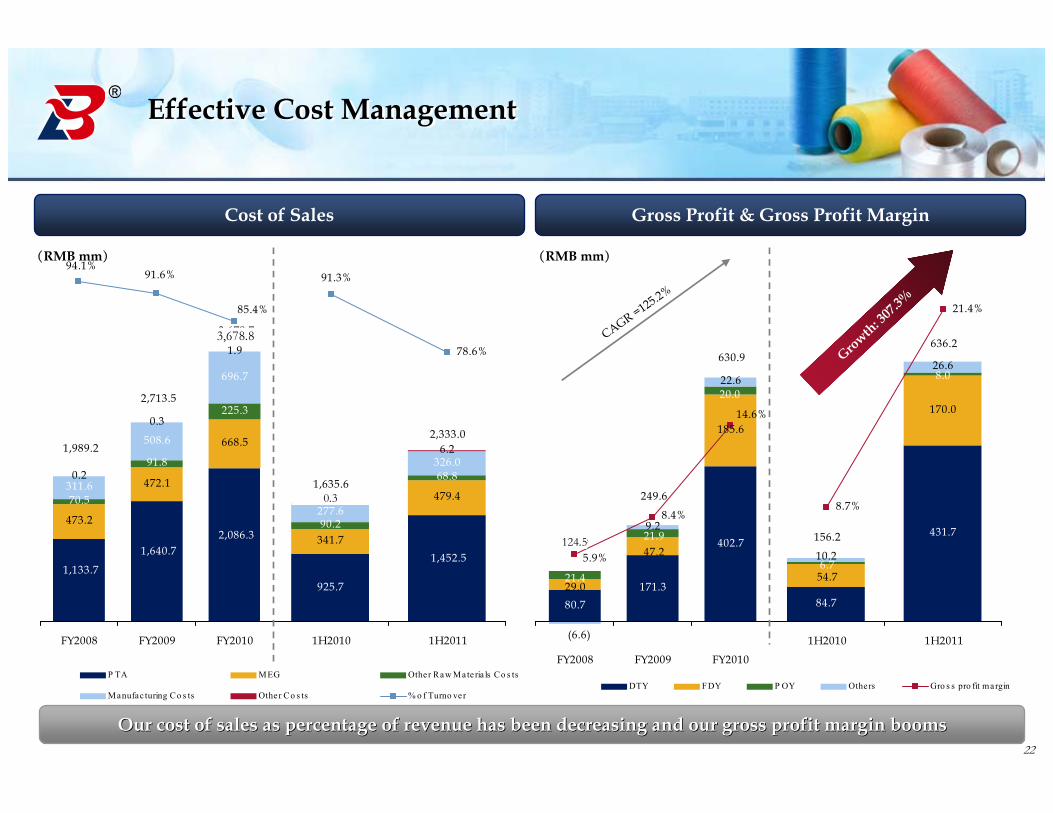
P TA MEG Other Raw Mate ria ls Co s ts
Manufac turing Co s ts Other Co s ts % o f Turno verDTY FDY P OY Others Gro s s pro fit margin
84.7
431.7
170.0
26.6
54.7 6.7
8.0
10.2
8.7%
21.4%
1H2010 1H2011
156.2
636.2
80.7171.3
402.7
185.6
9.2
22.6
29.0
47.2
21.4
21.9
20.0
(6.6)
14.6%
8.4%
5.9%
FY2008 FY2009 FY2010
124.4
249.6
630.9
925.7
1,452.5341.7
479.4
90.2
68.8
277.6
326.0
0.2
6.2
78.6%
91.3%
1H2010 1H2011
1,635.6
2,333.0
1,133.7
1,640.72,086.3
473.2
472.1
668.5
70.5
91.8
225.3
311.6
508.6
696.7
0.2
0.3
1.9
94.1%91.6%
85.4%
FY2008 FY2009 FY2010
1,989.2
2,713.5
3,678.7
Effective Cost ManagementEffective Cost Management
Cost of Sales
(RMB mm)
Our cost of sales as percentage of revenue has been decreasing aOur cost of sales as percentage of revenue has been decreasing and our gross profit margin boomsnd our gross profit margin booms
Gross Profit & Gross Profit Margin
(RMB mm)
CAGR =125.2%
Growth: 307
.3%
3,678.8
0.3
124.5

23
85.6
435.2
4.8%
14.7%
1H2010 1H2011
56.7
101.0
446.0
2.7%
3.4%
10.3%
FY2008 FY2009 FY2010
121.5
560.0
6.8%
18.9%
1H2010 1H2011
135.5
569.7
168.46.4%
5.7%
13.2%
FY2008 FY2009 FY2010
Solid Margin Expansion and Superior Profitability GrowthSolid Margin Expansion and Superior Profitability Growth
With the continuous expansion of our production capacity, we belWith the continuous expansion of our production capacity, we believe that there is great potential for additional ieve that there is great potential for additional improvement in our profitability in the futureimprovement in our profitability in the future
(RMB mm) (RMB mm)
Operating Profit & Operating Profit Margin Net Profit and Net Profit Margin
CAGR =105.1%
Growth: 361.0%
CAGR =180.4%
Growth: 424
.6%
Operating Profit Operating Profit Margin Net Profit Net Profit Margin
448.9
15.1%
101.4
24
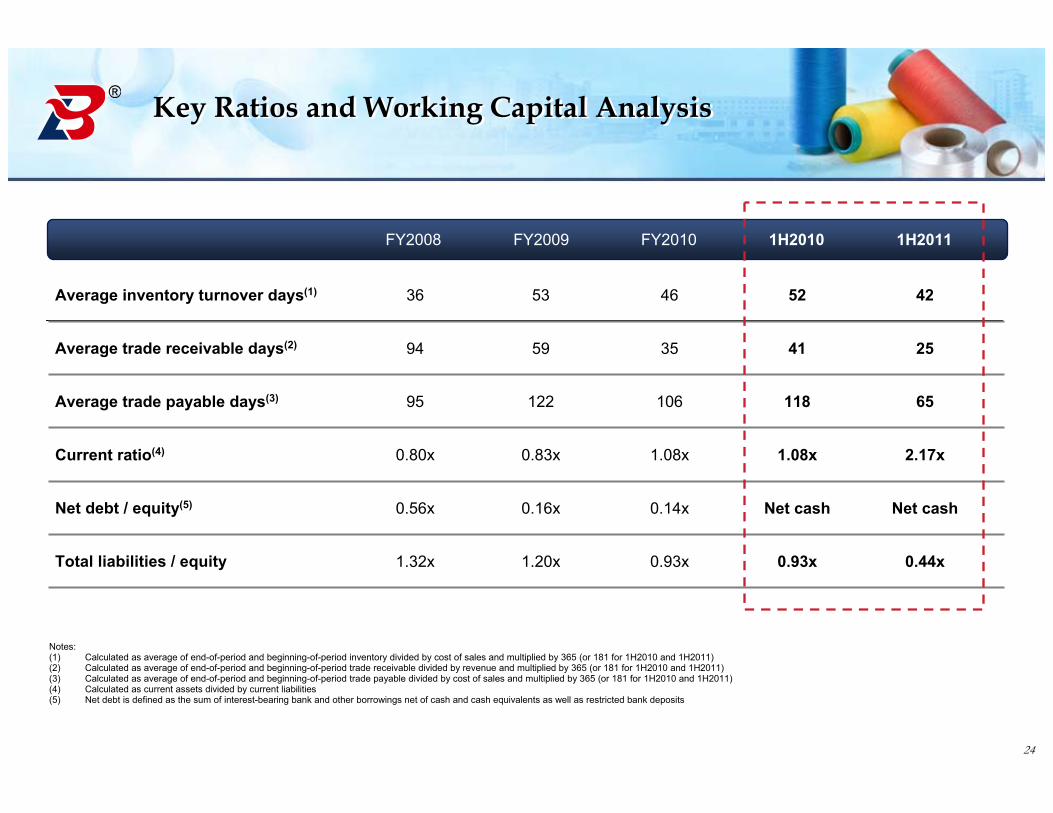
Key Ratios and Working Capital AnalysisKey Ratios and Working Capital Analysis
FY2008 FY2009 FY2010
Notes:(1) Calculated as average of end-of-period and beginning-of-period inventory divided by cost of sales and multiplied by 365 (or 181 for 1H2010 and 1H2011)(2) Calculated as average of end-of-period and beginning-of-period trade receivable divided by revenue and multiplied by 365 (or 181 for 1H2010 and 1H2011)(3) Calculated as average of end-of-period and beginning-of-period trade payable divided by cost of sales and multiplied by 365 (or 181 for 1H2010 and 1H2011)(4) Calculated as current assets divided by current liabilities(5) Net debt is defined as the sum of interest-bearing bank and other borrowings net of cash and cash equivalents as well as restricted bank deposits
Average inventory turnover days(1)
Average trade receivable days(2)
Average trade payable days(3)
Current ratio(4)
Net debt / equity(5)
Total liabilities / equity
36 53 42
94 59 25
95 122 65
0.80x 0.83x 2.17x
0.56x 0.16x Net cash
1.32x 1.20x 0.44x
1H2010 1H2011
46
35
106
1.08x
0.14x
0.93x
52
41
118
1.08x
Net cash
0.93x

I. 1H2011 Results Overview
II. Company Overview
III. Competitive Strengths
IV. Financial Highlights
V. Corporate Strategies

26
Corporate StrategiesCorporate Strategies
We aim to maintain our position as a leading polyester filament We aim to maintain our position as a leading polyester filament yarn supplier in Chinayarn supplier in China
Further expand our production capacity and improve our production efficiency and product quality, and also optimize product mix
Continue to utilize technologically advanced equipment to produce differentiated products with strong demand, special features and
functionalities
Continue to strengthen our research and development capabilitiesand further commercialize new products
Further expand our marketing channels and strengthen our relationship with textile and fabric manufacturers and end customers to enhance our brand
awareness and reputation
1
2
3
4
Thank you!


![4PNYH[PVU VY 4VKLYUPZH[PVU& - Intec Systems Limited · (un\shy1: 1h]h:jypw[ ?7(.,: 1h]h 1:- 1h]h :wypun 4=* 1h]h =hhkpu 1h]h 'sbnfxpsl -bohvbhf #btjt 'jstu 3fmfbtf,ocation!s better](https://static.fdocuments.in/doc/165x107/5f63751302c9503c893ede57/4pnyhpvu-vy-4vklyupzhpvu-intec-systems-limited-unshy1-1hhjypw-7.jpg)