FY2011 first-quarter financial results - Nissan Motor ...D exp. FY11 1Q O.P. Selling exp. Sales...
19
www.nissan-global.com Nissan Motor Co., LTD. July 27, 2011 FY2011 first-quarter financial results www.nissan-global.com 2 Key performance indicators: financial results Net revenue 2,050.1 2,082.0 106.6 167.9 85.0 70.8 150.4 (billion yen) Operating profit Net income Free cash flow (Auto) 59.3 FY11 1Q FY10 1Q FY11 1Q FY10 1Q FY11 1Q FY10 1Q FY11 1Q FY10 1Q 22.8 -314.8 FY11 1Q FY10 1Q Net debt (Auto)
Transcript of FY2011 first-quarter financial results - Nissan Motor ...D exp. FY11 1Q O.P. Selling exp. Sales...

www.nissan-global.com
Nissan Motor Co., LTD.July 27, 2011
FY2011 first-quarterfinancial results
www.nissan-global.com 2
Key performance indicators: financial results
Net revenue
2,050.1 2,082.0
106.6
167.9
85.0 70.8
150.4
(billion yen)
Operating profit
Net income Free cash flow(Auto)
59.3
FY111Q
FY101Q
FY111Q
FY101Q
FY111Q
FY101Q
FY111Q
FY101Q
22.8
-314.8
FY111Q
FY101Q
Net debt(Auto)

www.nissan-global.com 3
FY11 1Q Business update
Rapid recovery from the earthquakeRapid recovery from the earthquake
11th Apr
13th Apr
18th Apr
20th Mar
17th May
Mar Apr May June
Oppama
Tochigi
Kyushu
Yokohama
Iwaki
Plant
Vehicle
P/T
www.nissan-global.com 4
320248
-22.4%+19.3%
+18.5%
Over seas Over
seas
April to June total
(tho
usan
d un
its)
Overseas
Dom
+541,037983Total
+93810717
-39227266
VarianceFY11 1QFY10 1Q
FY11 1Q Business update
Global Production in calendar baseGlobal Production in calendar base
0
100
200
300
400
500
May JuneApr
FY10
FY11
309369 354
420
DomDom

www.nissan-global.com 5
Global marketshare by FY16 (%)
88Sustainable COP (%)
88Brand & sales power
POWERPOWER
FY11 1Q Business update
Mid-term Plan “NISSAN POWER 88” announcementMid-term Plan “NISSAN POWER 88” announcement
www.nissan-global.com 6
FY11 1Q Business update
Establishment of new minicar JV with Mitsubishi MotorsEstablishment of new minicar JV with Mitsubishi Motors

www.nissan-global.com 7
Launching in China in 2nd quarter
FY11 1Q Business update
Global growth model : TiidaGlobal growth model : Tiida
www.nissan-global.com 8
FY11 1Q Business update
Lafesta Highway STARLafesta Highway STAR
www.nissan-global.com 9
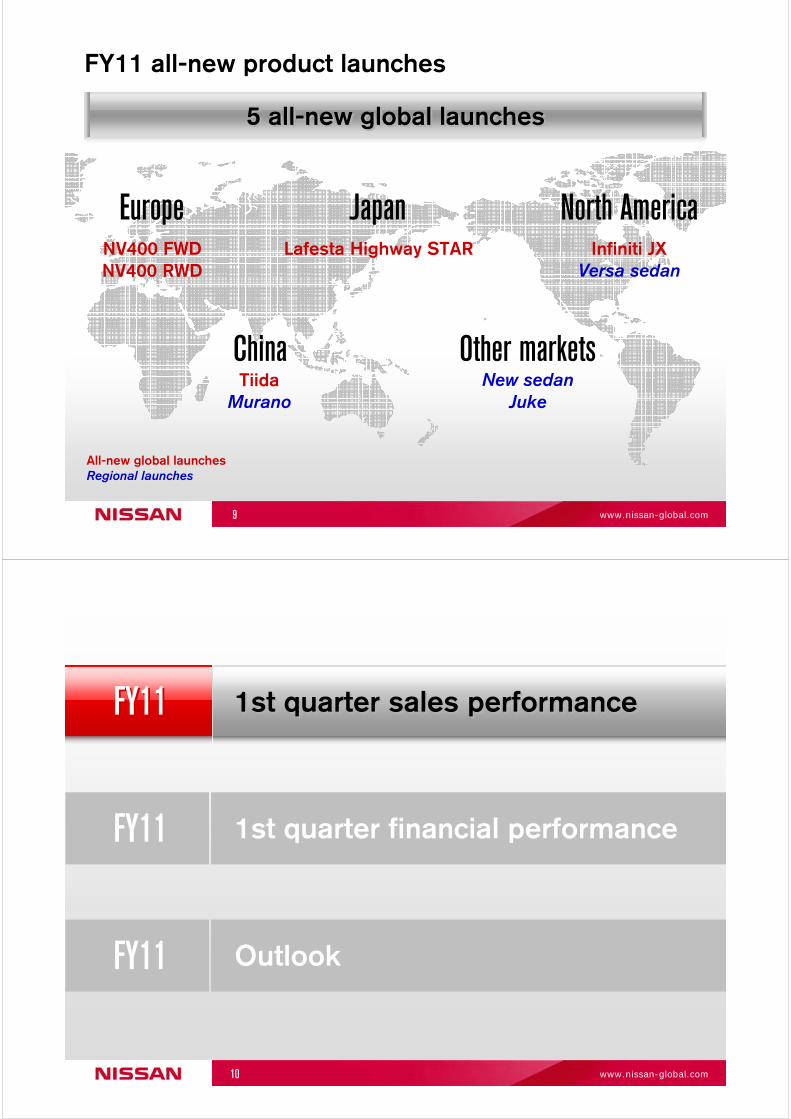
All-new global launchesRegional launches
Japan North AmericaEurope
New sedanJuke
NV400 FWDNV400 RWD
Lafesta Highway STAR
ChinaTiida
Murano
Infiniti JXVersa sedan
Other markets
FY11 all-new product launches
5 all-new global launches5 all-new global launches
www.nissan-global.com 10
FY11FY11 1st quarter sales performance1st quarter sales performance
FY11 1st quarter financial performance
FY11 Outlook

www.nissan-global.com 11
(tho
usan
d un
its)
Retail volume
FY111Q
FY101Q
+20.9%Europe
-14.7%Japan
+13.6%Others
Global +10.6%
298
170
294(220)
118
176
+22.6%China
+5.9%(+3.5%)
North America
(US)
(mill
ion
units
)
TIV*
FY111Q
FY101Q
+4.4%Europe
-33.1%Japan
+8.0%Others
vs. FY10 Q1
Global +4.2%
4.59
5.00
3.95(3.27)
4.77
+8.3%China
+6.4%(+6.6%)
North America
(US)
vs. FY10 Q1
*Nissan’s estimation
1,056
954
19.0818.31
Sales performance: Global
0.77
www.nissan-global.com 12
TIV decreased 33.1% to 0.77 million units
Sales in Japan decreased 14.7% to 118 k units
March, Juke and Elgrand contributed to Japan sales despite a significant drop in TIV. As a result, Nissan achieved a 15.2% market share
FY101Q
FY111Q
Market share
FY101Q
FY111Q
Retail volume
11.9
+3.3%
15.2
138-14.7%
(tho
usan
d un
its)
(%)
March Elgrand
118
Sales performance: Japan

www.nissan-global.com 13
+22.6%
243298
TIV increased 8.3% to 4.6 million units
1Q sales in China increased 22.6% to 298 k units, thanks to Teana, QASHQAI and Sunny
FY11 2Q sales results continued to grow by 14% to 296.3 k units, market share improved 1% to 7.5%
Teana Sunny
5.7
+0.8%
6.5
*TIV for China : Passenger and LCV only
Sales performance: China (Jan. to Mar.)
FY101Q
FY111Q
Market share
FY101Q
FY111Q
Retail volume(t
hous
and
units
)(%
)
www.nissan-global.com 14
Grow sales by 1million
Venucia brand to launch in 2012;targeting 300 k units in 2015
30 new models for Chinese market
Production capacity expansion; new and existing plants
DFL New Mid-term Business Plan (2011 to 2015)

www.nissan-global.com 15
*Variances on a straight-percentage basis
TIV increased 6.6%* to 3.3 million units in US
Sales in US increased 3.5% to 220 k units
Canada: Sales up 7.7% to 25.3 k units, market share improved 0.2% to 5.3%
Mexico: Sales up 17% to 49.1 k units, market share improved 1.3% to 24.3%
6.9
-0.2%
6.7
220212
+3.5%*
SentraAltima
Sales performance: North America
FY101Q
FY111Q
Market share
FY101Q
FY111Q
Retail volume(t
hous
and
units
)(%
)
www.nissan-global.com 16
Juke
TIV increased 4.4% to 5 million units
Sales in Europe excluding Russia increased by 11.4% to 137 k units thanks to Juke and QASHQAI
Sales in Russia increased by 87.8% to 33 k units
Market share:
2.9
+0.5%
3.4
170141
+20.9%
Russia
FY101Q
FY111Q
3.5% 4.6%
Europe excl. Russia 2.9% 3.3%
QASHQAI series
Sales performance: Europe
FY101Q
FY111Q
Market share
FY101Q
FY111Q
Retail volume
(tho
usan
d un
its)
(%)

www.nissan-global.com 17
FY101Q
FY111Q
154
+13.6%
(tho
usan
d un
its)
Retail volume
Sales in Latin America increased 40.9% to 46.7 k units. Sales in Brazil increased 92.2% to 13.1 k units
Sales in Thailand increased 28.7% to 16.7 k units
Sales in Indonesia increased 22.9% to 11.6 k units
March Livina series
154 176
Sales performance: Other markets
www.nissan-global.com 18
Sales impacted by earthquake
FY101Q
FY111Q
-8.4%
(tho
usan
d un
its)
28.8
INFINITI
Expanding global presenceExpanding global presence
Product expansion: all new JX
Raising brand awareness through Formula 1
Start of sales in Indonesia Market expansion:Chile and Panama
31.4

www.nissan-global.com 19
FY11 1st quarter sales performance
FY11FY11 1st quarter financial performance1st quarter financial performance
FY11 Outlook
www.nissan-global.com 20
(billion yen)
Operating profit
147.7 -7.3Ordinary profit
131.0 -26.6
Non-operating
-16.7Extraordinary
167.9
155.0
-12.9
Profit before tax
VarianceFY11 1QFY10 1Q
FX rate 81.7 JPY/USD117.4 JPY/EUR
92.0 JPY/USD117.0 JPY/EUR
2.6
157.6
Net revenue 2,050.1
150.4
-2.7
2,082.0 +31.9
-17.5
-10.3 JPY/USD+0.4 JPY/EUR
Net income
Taxes -38.6
Minority interest -7.4
-43.3
-7.7
-21.6
+1.6%
-10.4%
-4.7%
-16.9%
-20.3%
Effective tax rate 29.5%27.5%
Change vs. FY10 (%)
OP margin 7.2%8.2%
106.6 85.0
FY11 1st quarter financial performance

www.nissan-global.com 21
167.9
-55.0
150.4+45.0
(billion yen)
FY101QO.P.
Purch. cost
reduction
FOREX Raw material / energy
cost
Volume / mix
R&D exp.
FY111QO.P.
Selling exp.
Sales finance
& Other items
+1.5+2.0 +7.8
-32.4
+13.6
FY11 1st quarter financial performance
Operating profit variance analysisOperating profit variance analysis
www.nissan-global.com 22
+187.0
+96.5
59.3
-88.8
-45.0
149.7 -68.2
+5.8-28.0
Net cash inflow from P&L items
AP / AR Inventory Cash flow from
operating activities
Net assetsales
Other investingactivities
CAPEX*
(billion yen)
Tax / other operating activities
* CAPEX does not include finance lease-related investments
Free cashflow
FY11 1st quarter financial performance
Free cash flow (Auto business)Free cash flow (Auto business)

www.nissan-global.com 23
Days supply
(tho
usan
d un
its)
Consolidated Nissan inventory, except some minor countriesDealer inventory, except some minor countries
2010 Mar
(Day
s)
2011Mar Jun
*Previous and current figures revised to reflectnew scope adopted from FY11
Sep DecJun
Restoring inventoryRestoring inventory
Inventory management
480540 580
680 630690
44 4449 48 50 53
0
100
200
300
400
500
600
700
800
900
1000
0
10
20
30
40
50
60
www.nissan-global.com 24
FX: JPY/USDEnd of month
2009 Mar Jun Sep Dec
2010 Mar Jun Sep
98.2 96.0 90.2 92.1 93.0 88.5 83.8
Dec81.5
2011 Mar83.2
22.8
-69.3
Jun80.7
Net debt (Auto business)
387.9 405.3
293.3
207.129.7
-42.9
-293.3 -314.8
-400
-200
0
200
400
(billion yen)

www.nissan-global.com 25
FY11 1st quarter sales performance
FY11 1st quarter financial performance
FY11 OutlookOutlook
www.nissan-global.com 26
FY11
* Forecast
4.4%
FY10(billion yen)
Net revenue 8,773.1
Net income
Net income ratio
319.2
Ordinary profit 537.8
Operating profitOP margin
537.5
*
399.34.6%
312.03.6%
CAPEX sales ratio
R&Dsales ratio
FX rateassumptions
80.085.7
9,400.0
270.0
441.0
460.0
(JPY/USD)
Variance
+626.9
-96.8
-49.2
-77.5
+7.1%
-18.0%
-15.4%
-14.4%
460.04.9%
410.0
115.0113.1(JPY/EUR)
6.1%
3.6%
4.9%
2.9%
-1.2%
-0.7%
+98.0
+60.7+0.8%
+0.3%
+31.4%
+15.2%
-5.7+1.9
FY11 outlook (released June 23rd )
www.nissan-global.com 27
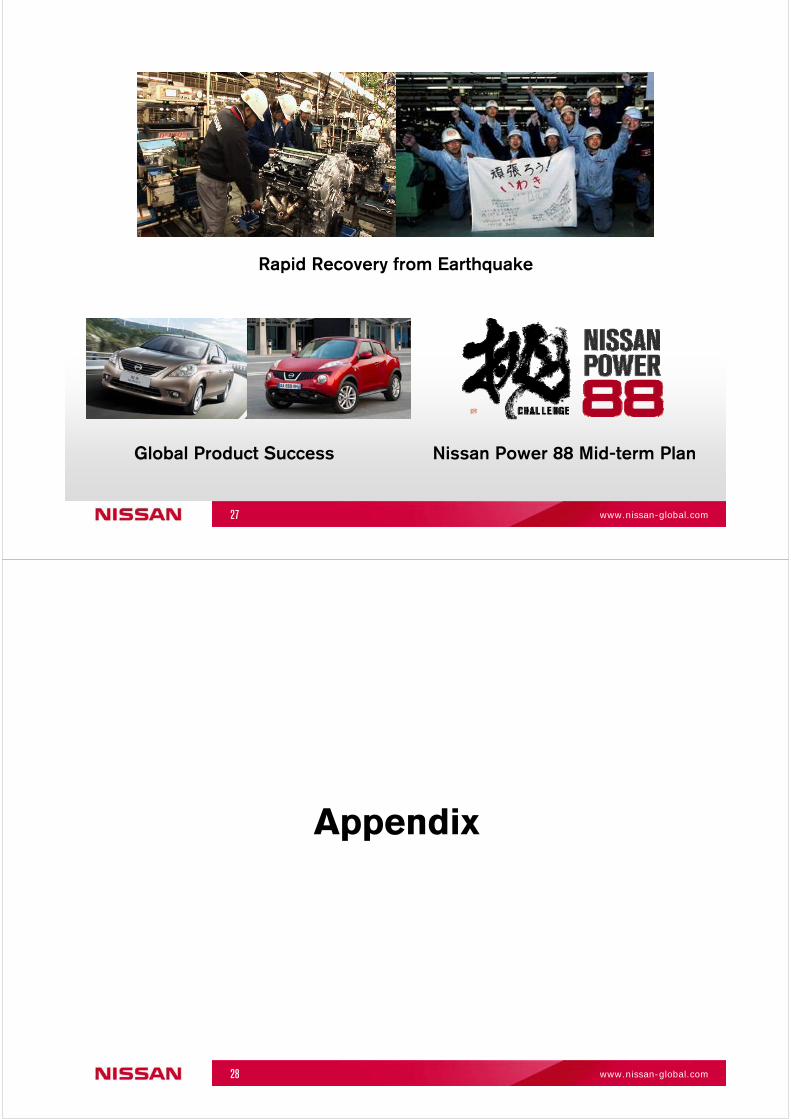
Global Product Success
Rapid Recovery from Earthquake
Nissan Power 88 Mid-term Plan
www.nissan-global.com 28
Appendix

www.nissan-global.com 29
Sales financing : Funding sources(As of June 2011)
Total funding amount3,826 billion yen7.8%
Group Finance
(Inter-Company)26.0%
ABS Off B/S4.3%
Equity11.2%
ABS On B/S17.6%
L/T Loan25.8%
Commercialpaper3.2%
S/T Loan4.1%
Bonds
www.nissan-global.com 30
0
10
20
30
40
50
60
70
80
90
100
Lease
Retail
%
FY101Q
FY111Q
FY101Q
FY111Q
FY101Q
FY111Q
FY101Q
FY111Q
NFS: Nissan Financial Service, sales finance company in JapanNMAC: Nissan Motor Acceptance Corporation, sales finance company in USANCF: Sales financing division of Nissan Canada IncNRFM: NR Finance Mexico, sales finance company in Mexico
Sales financing: penetration
NMACNFS NCF NRFM
28% 28%34%
37%
43%40%
27% 34%
31% 32%
23%26%
3% 4%

www.nissan-global.com 31
Sales financing: net credit loss ratio
NFS
NMAC
NCF
FY101Q VarianceFY11
1Q
NFS: Nissan Financial Service, sales finance company in JapanNMAC: Nissan Motor Acceptance Corporation, sales finance company in USNCF: Sales financing division of Nissan Canada Inc
Lease: 0.06%Retail: 0.27%
Lease: 0.08%Retail: 0.46%
Lease: 0.00%Retail: -0.03%
Lease: -0.21%Retail: -0.39%
Lease: 0.18%Retail: 0.19%
Lease: -0.09%Retail: -0.13%
Lease: 0.06%Retail: 0.30%
Lease: 0.29%Retail: 0.85%
Lease: 0.27%Retail: 0.32%
www.nissan-global.com 32
Sales financing: operating profit & asset
NFS
FY101Q
NMAC
Variance
NCF
FY111Q
( NFS : billion yen, NMAC : million USD, NCF : million CAD, NRFM : million Peso)
NRFM
NFS: Nissan Financial Service, sales finance company in JapanNMAC: Nissan Motor Acceptance Corporation, sales finance company in USNCF: Sales financing division of Nissan Canada IncNRFM: NR Finance Mexico, sales finance company in Mexico
Asset: 1,075.9OP: 4.4
Asset: 33,671OP: 325
Asset: 3,861OP: 26
Asset: -9.5OP: +0.5
Asset: +3,192OP: +110
Asset: +1OP: +6
Asset: 1,085.4OP: 3.9
Asset: 30,479OP: 215
Asset: 3,860OP: 20
Asset: 26,366OP: 222
Asset: +2,626OP: +189
Asset: 23,740OP: 33

www.nissan-global.com 33
RUB -3.5 (3.04 to 2.92) USD -48.7 (92.0 to 81.7)
Operating profit variance analysis
* including other European currencies (excluding RUB)
1. Foreign exchange impact
+2.0
Others +6.3
+7.8
-55.0
2. Volume / mix
3. Selling expenses
US&CAN +11.0Incentives: +9.7Others: +1.3
EUR -0.8Incentives: +0.9Others: -1.7
Others -8.0Incentives: -5.3Others: -2.7
Japan +5.6Incentives: -0.5Others: +6.1
AUD +1.9 (81.1 to 86.7)
EUR* +0.5
Japan -3.3Vol: -5.7Mix: +2.4
US -19.4Vol: +0.2Mix: -19.6
EUR +23.2Vol: +23.5Mix: -0.3
MEX&CAN -4.8
Others -3.0
CAD -2.2 (89.5 to 84.4)
(billion yen)
FY11 1st quarter financial performance
www.nissan-global.com 34
Detail of non-operating income/expenses
FY11 1st quarter financial performance
• Interest income / expenses
-13.72.43.14.0
• FX translation
• Profit/Loss under equity methods -1.7
-4.0
5.0
-3.5
NMLNMEXNMACOthers
• Amortization of net retirement benefit
Variance
+6.7
+0.5
-4.2 -6.1 -1.9
-2.7 -2.6 +0.1
(billion yen)
-1.7-1.1-2.5-0.8
+12.0-3.5-5.6-4.8
-3.53.1
• Derivative gain and loss
NMACOthers
-0.4 1.8 +2.2
2.3-0.5
+5.8-3.6
Offset
FY101Q
FY111Q

www.nissan-global.com 35
• Sale/disposal of fixed assets
• Sale of investment securities
• Impairment loss on fixed assets -0.1
4.7
-2.1
-0.6
Variance
-2.0
-5.3
1.4 7.8 +6.4
Detail of extraordinary gains/losses(billion yen)
FY101Q
FY111Q
FY11 1st quarter financial performance
• Loss on asset retirement obligation -3.8 0.0 +3.8
• Special addition to retirement benefits -0.7 0.0 +0.7
• Loss on disaster 0.0 -21.1 -21.1
www.nissan-global.com 36
(billion yen)Free cash flow (Auto business) variance
AP/AR
Inventory
Tax/Others
234.0
100.3
Operating activities
-133.8
-50.2
Net cash inflow from P&L items
Others
Capex *
10.0Asset sales
150.3
-60.4
Investing activities
-29.1
Free cash flow
-79.5
70.8
187.0
96.5
-88.8
-45.0
5.8
149.7
-68.2
-28.0
-90.4
59.3
-47.0
-3.8
+45.0
+5.2
-4.2
-0.6
-7.8
+1.1
-10.9
-11.5
VarianceFY111Q
FY101Q
* Capex does not include finance lease-related investments
FY11 1st quarter financial performance

www.nissan-global.com 37
FY11 1st quarter retail sales
Detail of other markets
76.9
31.9
19.3 33.1
15.6
40.4
64.846.7
0
30
60
90
120
Asia & Oceania
M.East Africa Latin America
FY10 1Q
FY11 1Q
(th
ou
san
d u
nit
s)
*Scope change between M.East and Africa
www.nissan-global.com 38